Remain Calm
Have a plan, and stick to it. If something moves rapidly in the wrong direction, don't get upset and don't panic. Remain as calm as possible, take action if necessary. These are my rules for walking the Serengeti and Trading. 🙂
.
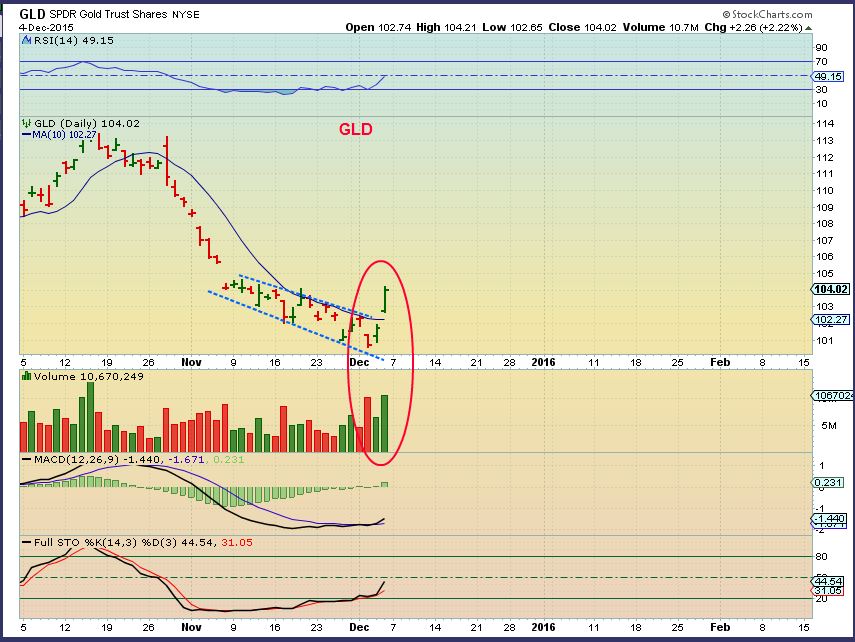
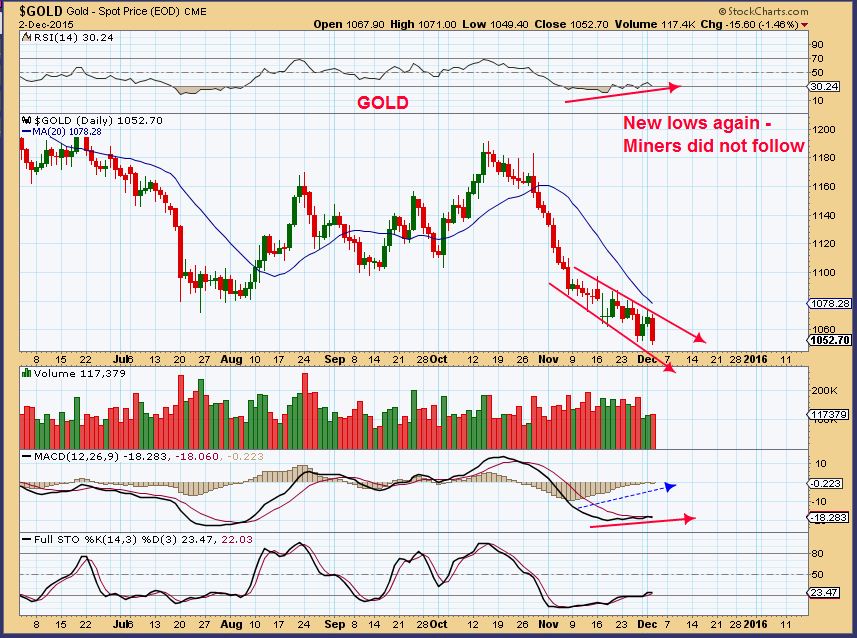
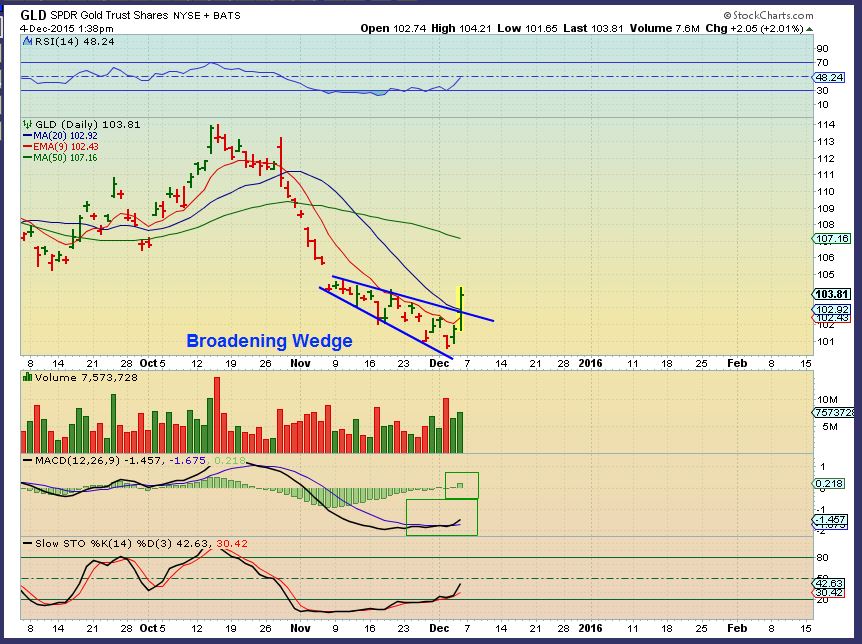
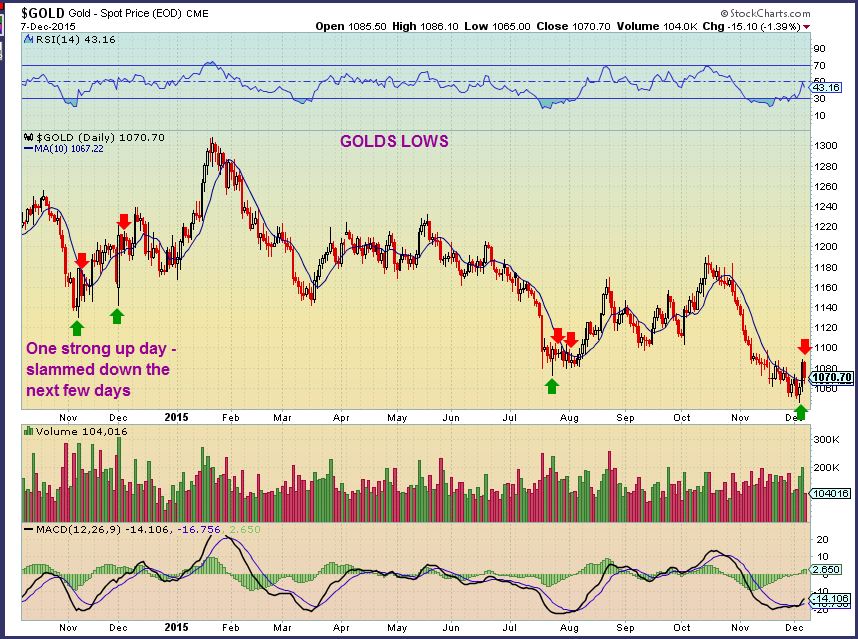
GOLD BOTTOMS -
Lately Golds lows have been hard for some to hold. "Have a plan and stick to it. If something moves rapidly in the wrong direction, don't get upset and don't panic...."
More on precious metals later
.
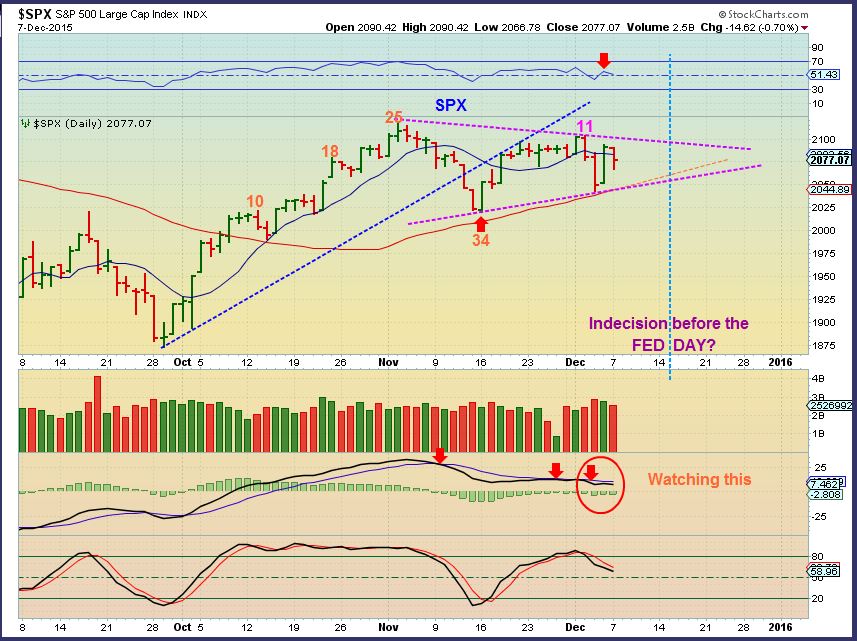
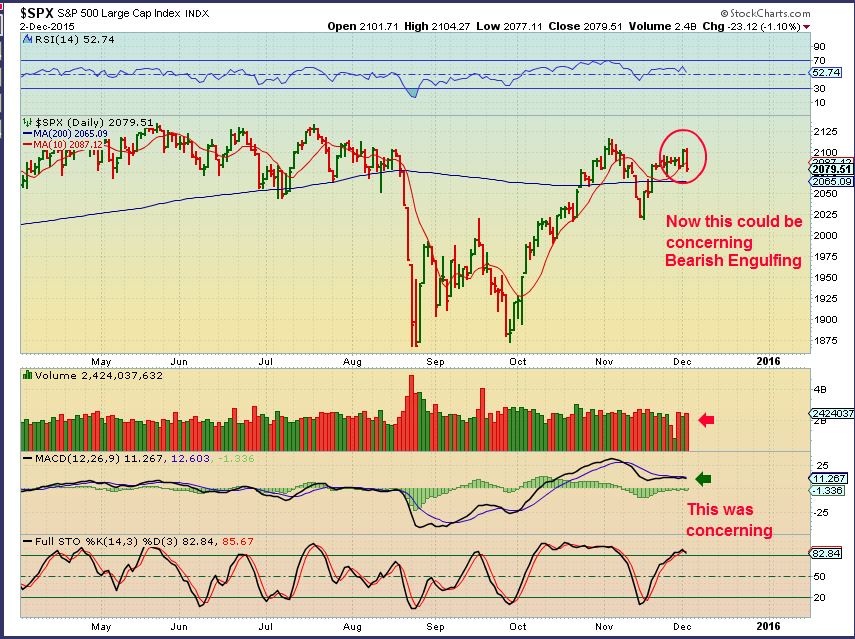
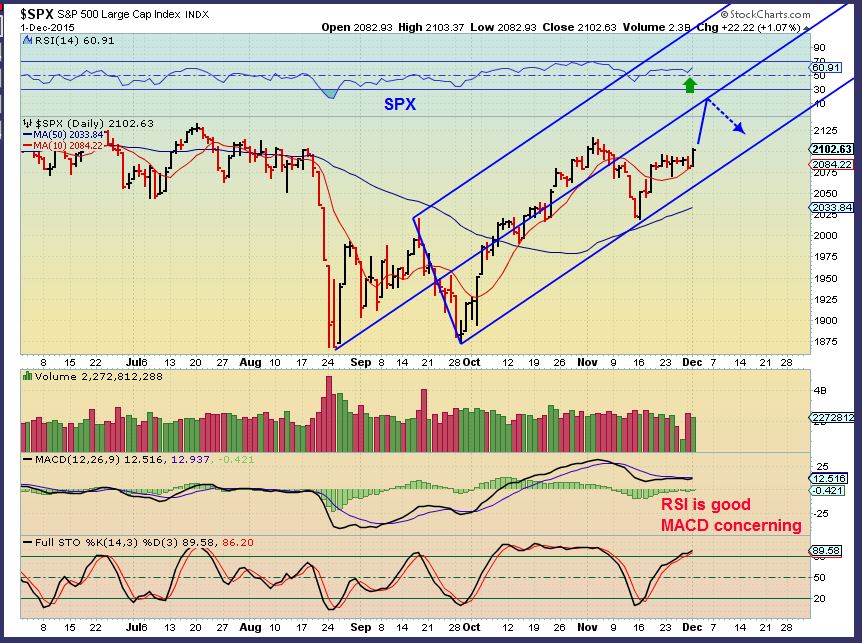
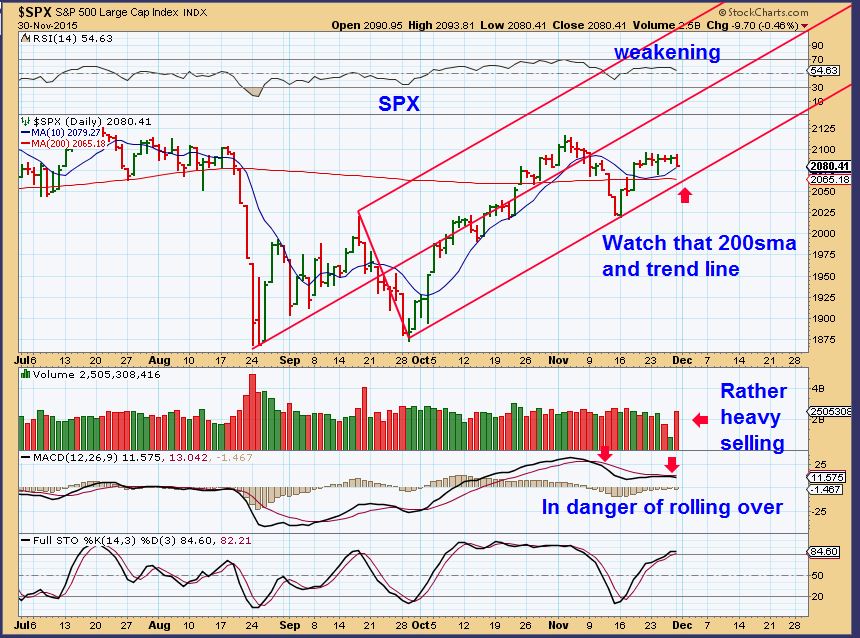
SPX - It will be interesting to see where we are on Dec 15th. This could break down or form a triangle here.