Author Archive for: Alex - Chart Freak
About Alex - Chart Freak
I’ve been a full time trader for well over a decade and began trading in the late 1990s while working in management and sales at a well-known aerospace company. As my style evolved, so did my success, and it allowed me to leave corporate America to pursue my passion and trade full time.
Entries by Alex - Chart Freak
OCT 14th Weekend Report
October 14, 2017 /185 Comments/in Premium /by Alex - Chart FreakFor the weekend reports, I am trying to cover all of the sectors and point out where we are in time and what we are looking for in the big picture. During the week, I focus mainly on things like stock picks , trade set ups, day to day progress and expectations for the various sectors near term. In some cases, when advantageous, I'll cover daily charts in the weekend report too. This weekend I will do a little of both. Let's take a look at our Big Picture expectations.
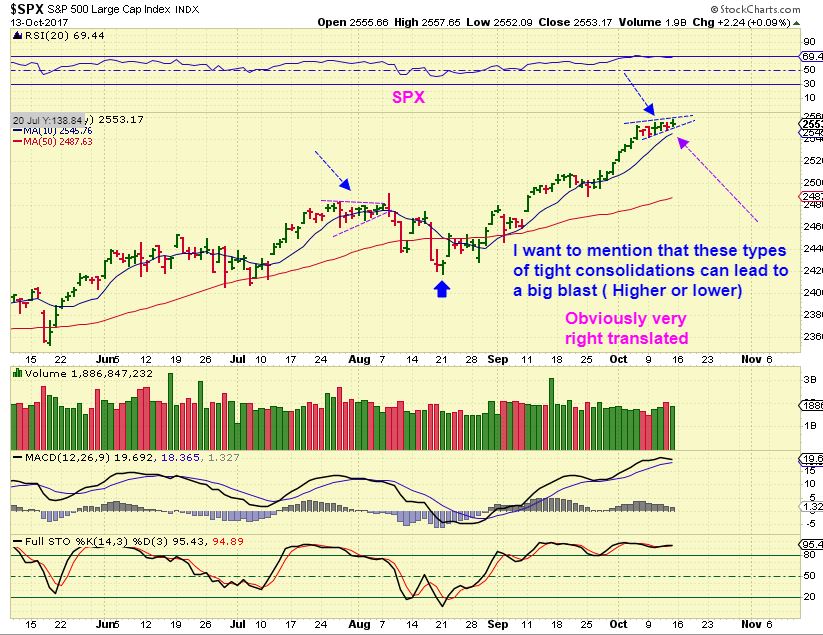
SPX DAILY - We are running late in this daily cycle, so it is due for a dip into a dcl. The markets have been very bullish and buyers have bought each 1 day dip lately. Now - Look at the Last week of July & the First week of August. We may have a similar formation now, however a POP in any direction can take place first. Trailing stops work the best here.
Weekly charts ...
Fridays Trading
October 13, 2017 /141 Comments/in Premium /by Alex - Chart FreakFriday - The final trading day of the week. Today I want to cover Oil, Natgas, Gold & The Miners, and some trade set ups.
Thursday- October 12th
October 12, 2017 /205 Comments/in Premium /by Alex - Chart FreakWednesday had some action, let's take a look...
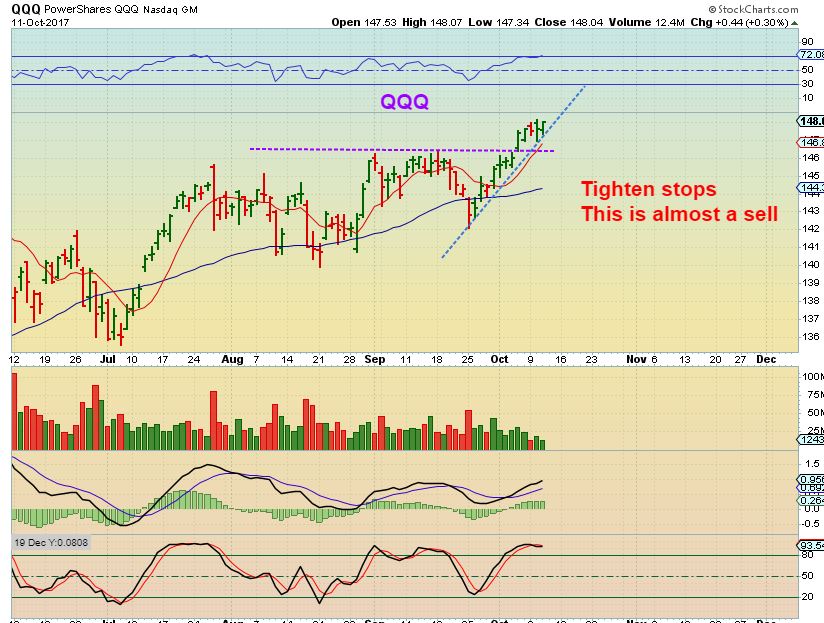
QQQ - I not only feel that we are getting late in the daily cycle, but there are other signs that this has been a good bull move( RSI), but that this also is approaching a top here.
Oct 10 – Have A Seat
October 11, 2017 /188 Comments/in Premium /by Alex - Chart FreakWelcome to Wednesdays trading, please have a seat and we'll start out discussion...
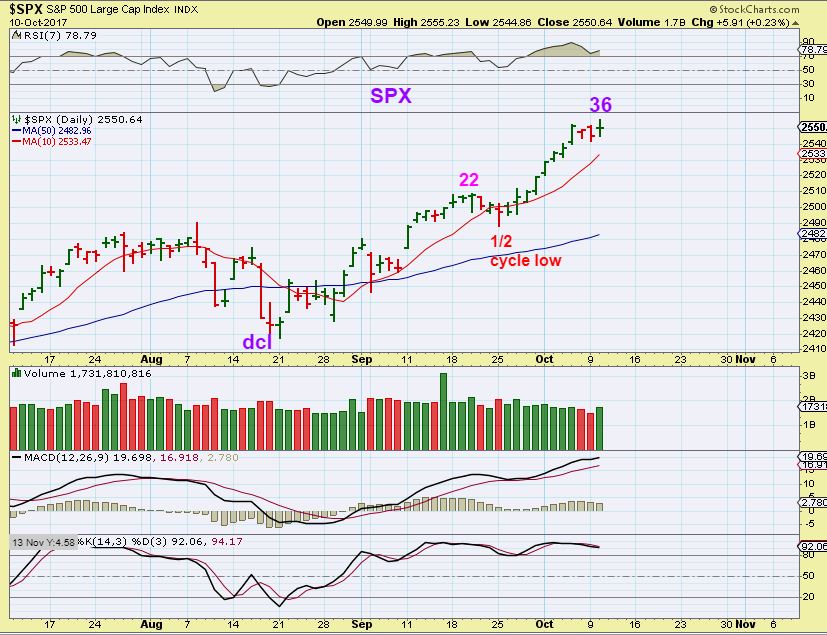
SPX - I believe that this is day 36 and I would expect that the markets can pull back into a dcl at anytime. This remains a strong market, able to peak around day 36 ( R.T. Again).
October 10th – Falls Into Place
October 10, 2017 /119 Comments/in Premium /by Alex - Chart FreakWe've only had 1 trading day since the weekend report, and things do seem to be falling into place as expected. Let's do a review...
Oct 8th – Are We There Yet?
October 8, 2017 /133 Comments/in Premium /by Alex - Chart FreakLet's take a look and see where the last week of trading took the markets...
SPX - The Big Picture for the General Markets remains the same. The ICLs ( deep meaningful dips in the market) are becoming less visible as the bull run picks up speed. Daily cycle wise? We are entering the time for a dip into a dcl.
Friday October 6th
October 6, 2017 /180 Comments/in Premium /by Alex - Chart FreakToday is Friday, the last trading day of the week, and I have quite a few thoughts rolling around my head. One of the biggest is the employment report. Why? The Markets are on fire, The NASDAQ just broke out , following the SPX, DJIA, and RUT - which have been on fire. What if the Jobs report disappoints? What if the hurricane that hit Texas and then another one that hit Florida disrupts the employment numbers and caused more than expected to report that they are not working?
Well, again, it is Friday the last trading day of the week, so lets just look at what is in front of us as of Thursday nights close.
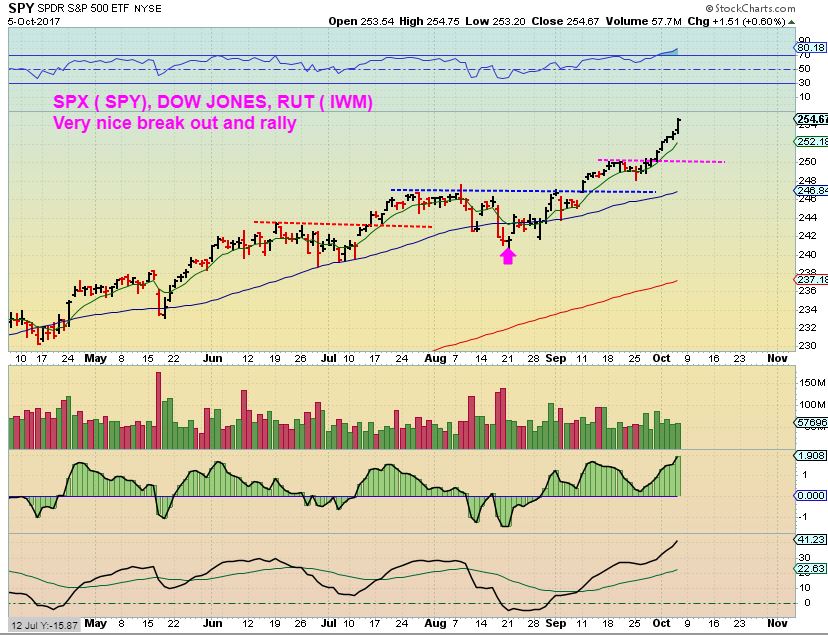
SPY - What a solid run higher after the break out. No change here.
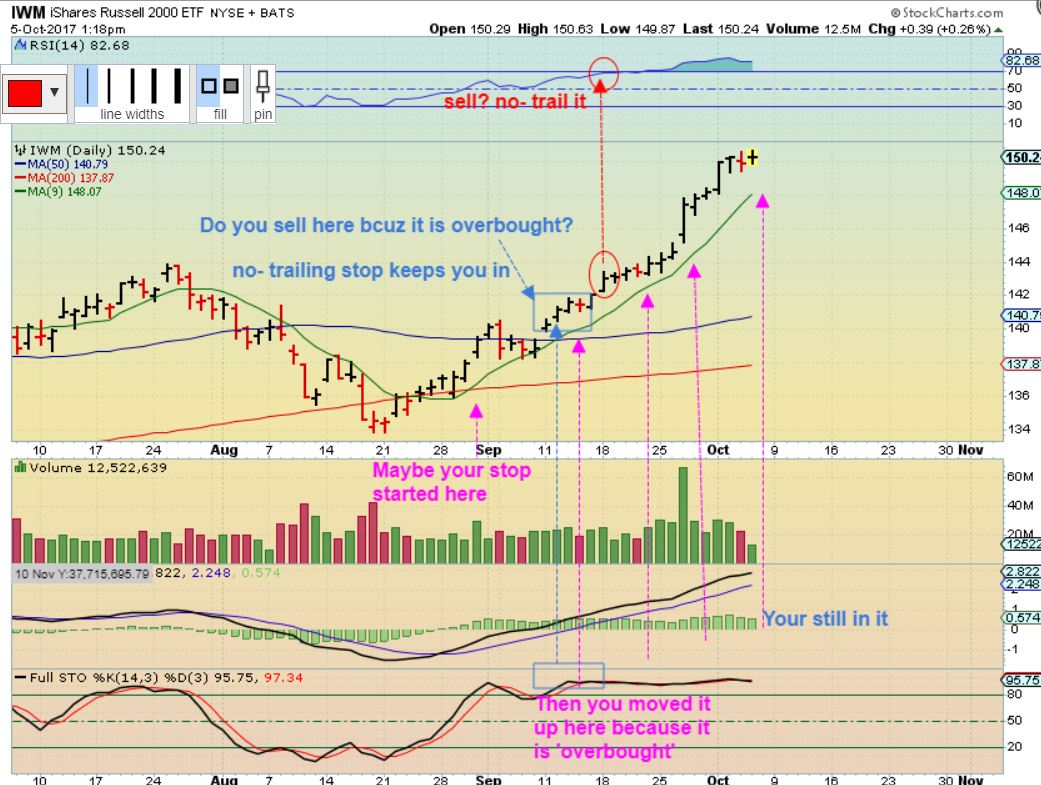
IWM - I used this chart in the comments / chat section yesterday to simply show why I would use a 'trailing stop' rather than just selling my position when it gets to a point of 'overbought'. You would not be forced to sell in a runaway move, you just ride the gains until the top is in.
Biotech Thursday
October 5, 2017 /143 Comments/in Premium /by Alex - Chart FreakI have given in to the pressure. 🙂 After our normal market review, I will discuss some of the biotech stocks that are a bit higher risk, but have been seeing tremendous rewards (gains) lately.
SPX - The idea of a trailing stop is working well, but we are on day 31, so we are now entering the time for the general markets to begin to seek out a dcl. Lately dips have been sideways and downward as seen on this chart. Since that was an ICL that we just put in place, and this is a R.Translated daily cycle, holding on to anything that is not leveraged may be fine during the dip into the first daily cycle. Some people just ride out the dips.
Wednesdays Mixed Bag
October 4, 2017 /143 Comments/in Premium /by Alex - Chart FreakHonestly, not much is changing from the weekend reports expectations and the Tuesday update. The General markets are moving higher, The USD has put in an ICL, Oil dropped but Oil & Energy stocks are holding rather well, etc. etc., so today I am just going to cover a variety of ideas, including trade set ups and a trading idea that is a bit higher risk ... a real Mixed bag. Enjoy.
Contact Us
26 Broadway,
8th Floor
New York, NY 10004
admin@bigleaguefinance.com
admin@bigleaguefinance.com
Latest Blog Posts
accelerator diet pills goji berry diet pills ultra 90 diet pills keto meal replacement bar top weight loss diet pills for thyroid patients where to buy t lite diet pills keto friendly thickener diet fuel diet pills peanuts keto friendly rite aid diet pills that work envy diet pills diet pills for breastfeeding moms belique diet pills perfect slim weight loss pills calories in a bottle of white wine

