Author Archive for: Alex - Chart Freak
About Alex - Chart Freak
I’ve been a full time trader for well over a decade and began trading in the late 1990s while working in management and sales at a well-known aerospace company. As my style evolved, so did my success, and it allowed me to leave corporate America to pursue my passion and trade full time.
Entries by Alex - Chart Freak
Tuesday September 11
September 11, 2018 in Premium /by Alex - Chart FreakWkend Report- Between A Rock And…
September 9, 2018 in Premium /by Alex - Chart FreakYou'll see why I chose this Theme Pic shortly, but first let's do our Big Picture Weekend Review...
.
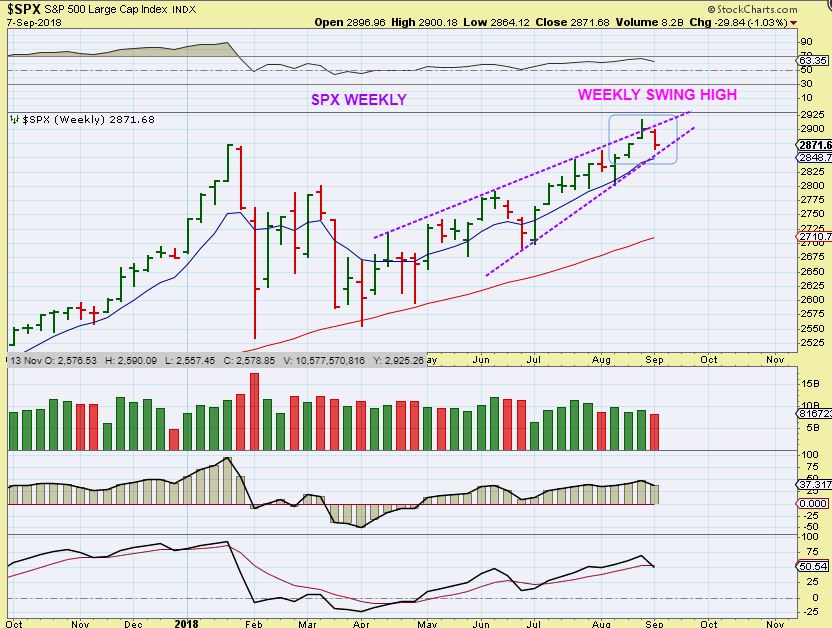
SPX WEEKLY - We have a weekly swing high, and I have been expecting a pull back to a dcl, even an ICL.
Sitting Near The Lows
September 7, 2018 in Premium /by Alex - Chart FreakToday is Friday, the last trading day of the week. Let's discuss just a few details of this weeks activity...
SEPTEMBER 6TH – Mixed Again
September 6, 2018 in Premium /by Alex - Chart FreakI have been expecting a pull back in the General Markets, but notice what happened on Wednesday...
.
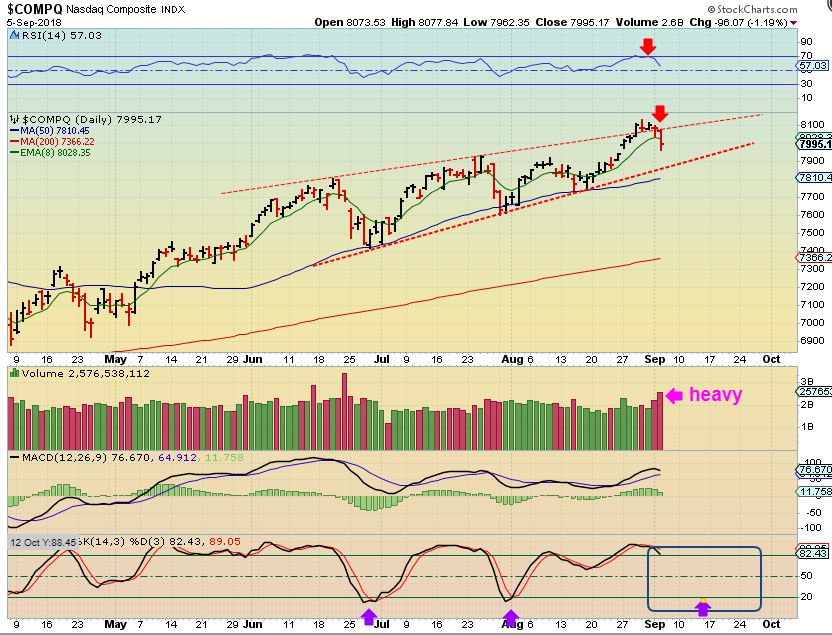
NASDAQ - That had a pretty good size drop and the volume increased. Also look at 3 month daily charts of TWTR, FB, GOOG, ( Even AMZN yesterday) , SQ, etc. They are dropping from the highs, so ...
It looks like the pull back has started, however,
.
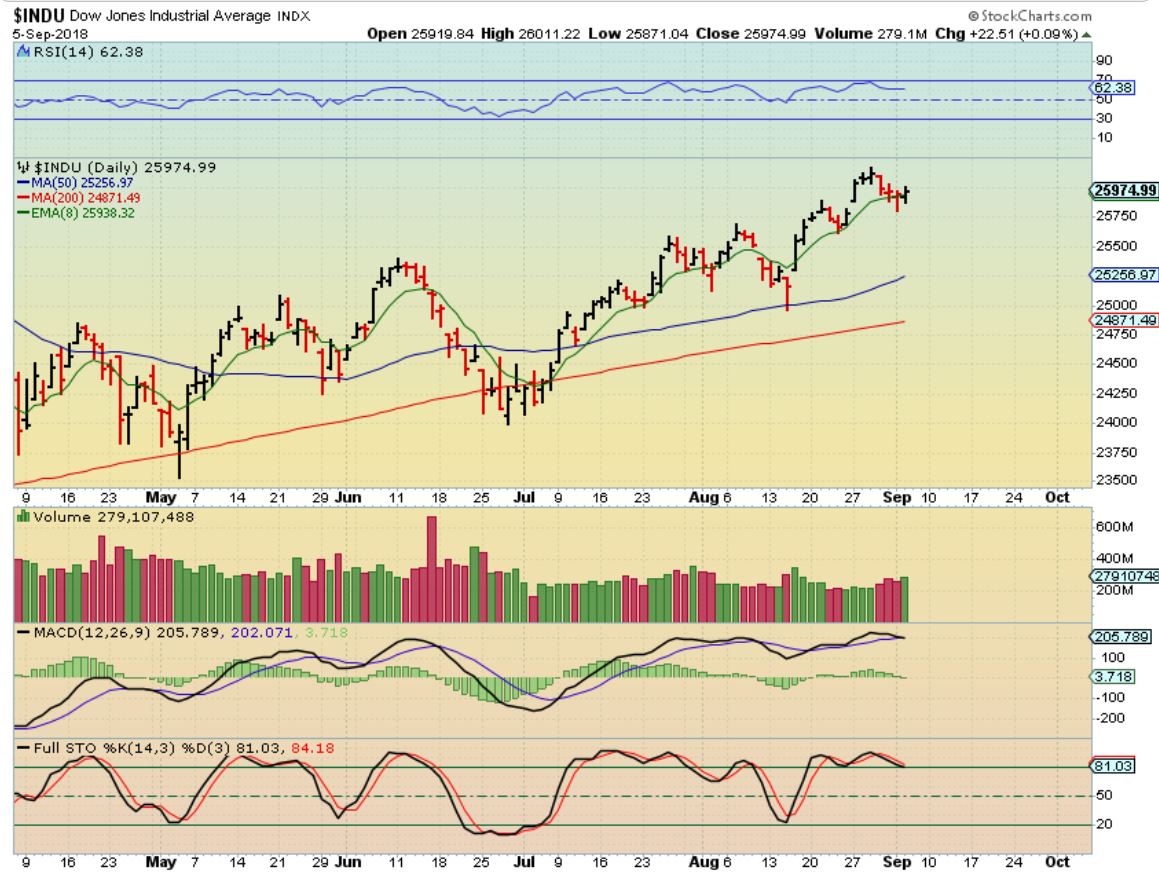
DJIA - The DOW closed higher with increasing volume. Interesting, and ...
September 5th- What Is Going On?
September 5, 2018 in Premium /by Alex - Chart FreakThe theme picture that I drew up speaks for itself. I will address that after a market review...
.
September 1st weekend report
September 1, 2018 in Premium /by Alex - Chart FreakFriday August 31 –
August 31, 2018 in Premium /by Alex - Chart Freak
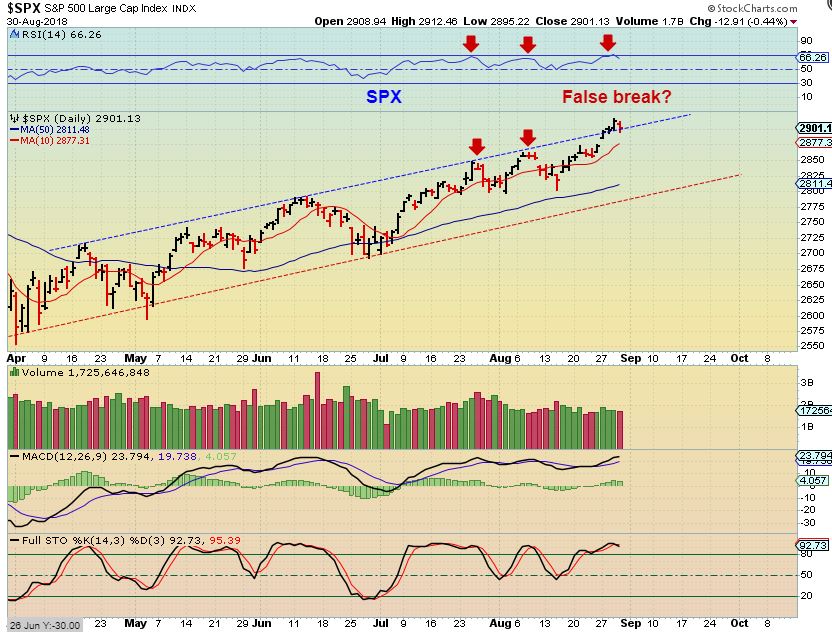
SPX - The SPX broke out above the upper trend line, but dropped back down on Thursday. We see a gap & the 10sma below, these could be initial targets, so let's see how things play out.
Thursday August 30
August 30, 2018 in Premium /by Alex - Chart FreakAUGUST 29th – Here Again
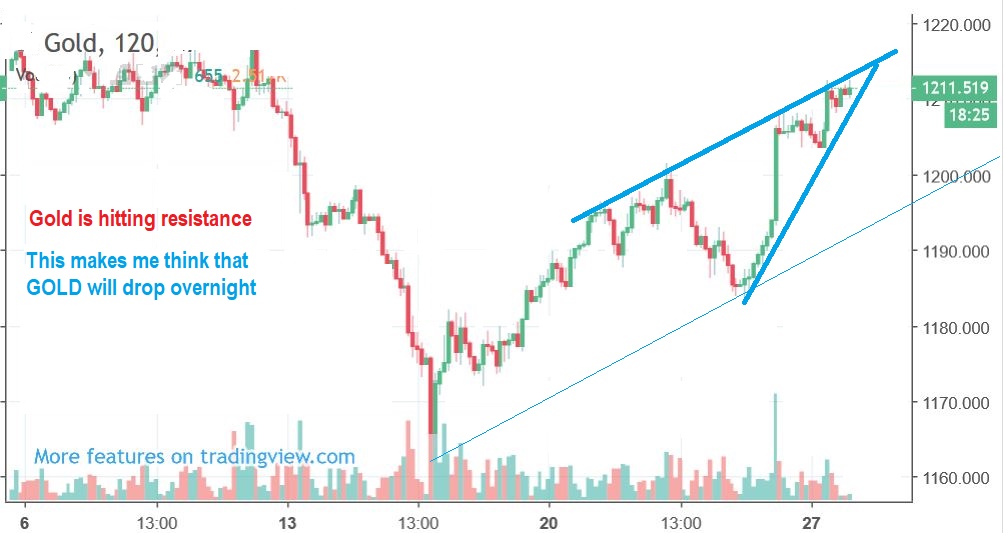
August 29, 2018 in Premium /by Alex - Chart Freak1. Last Night I mentioned to my readers that I was seeing a drop in Gold coming. Gold was at $1212, and I posted this chart saying that we could see a drop to $1200. That is not a big deal, but we are waiting for a short cover rally, so apparently we had to 'expect delays'...
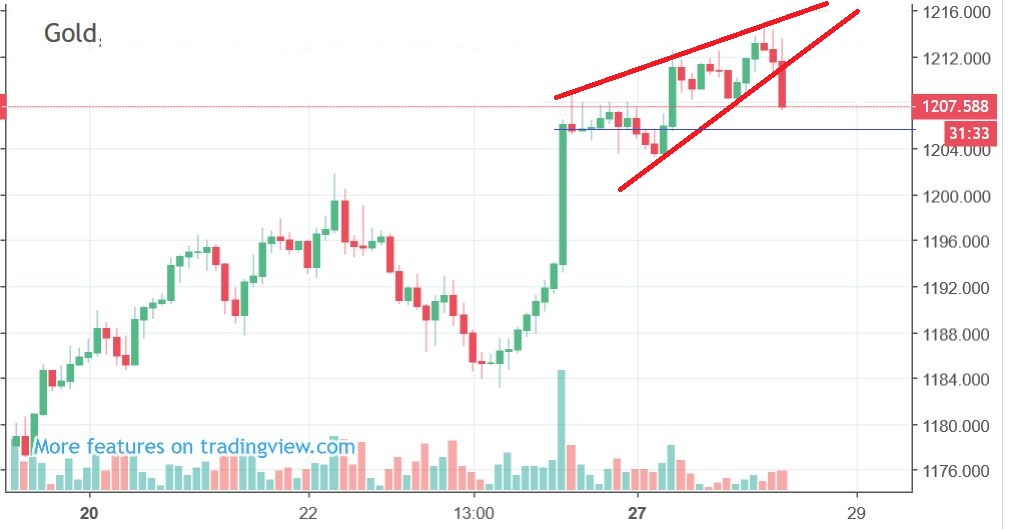
2. The drop started here, and I posted this in the comments section. Again, not a big scary concern, just Expect delays..
Let's talk about Gold $1200
Contact Us
26 Broadway,
8th Floor
New York, NY 10004
admin@bigleaguefinance.com
admin@bigleaguefinance.com
Latest Blog Posts
accelerator diet pills goji berry diet pills ultra 90 diet pills keto meal replacement bar top weight loss diet pills for thyroid patients where to buy t lite diet pills keto friendly thickener diet fuel diet pills peanuts keto friendly rite aid diet pills that work envy diet pills diet pills for breastfeeding moms belique diet pills perfect slim weight loss pills calories in a bottle of white wine

