Lets review last weeks market action by stepping back and looking at the bigger picture.
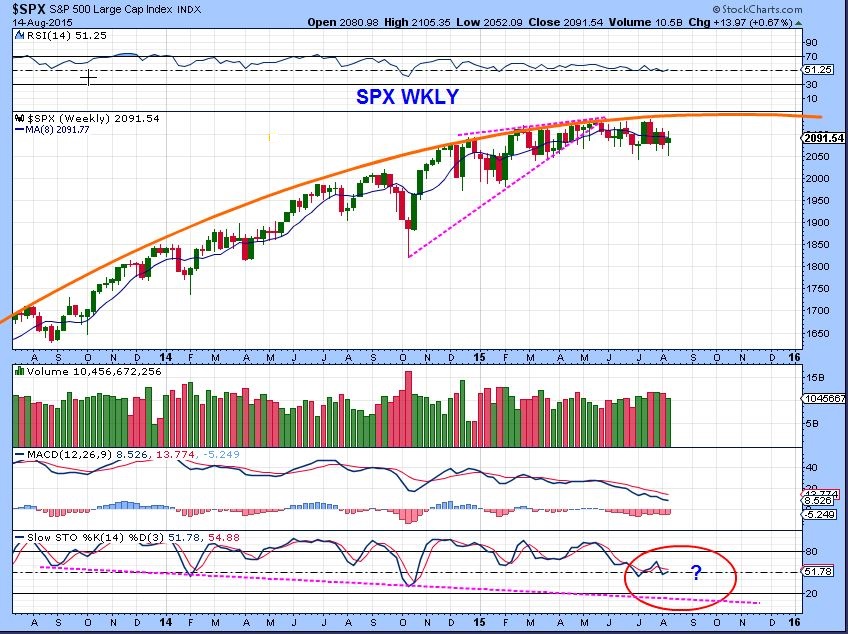
SPX – This long consolidation has left price right where it was in Jan. The MACD is dropping steadily on the weekly. This is a reversal candle so we may see a bounce this week.
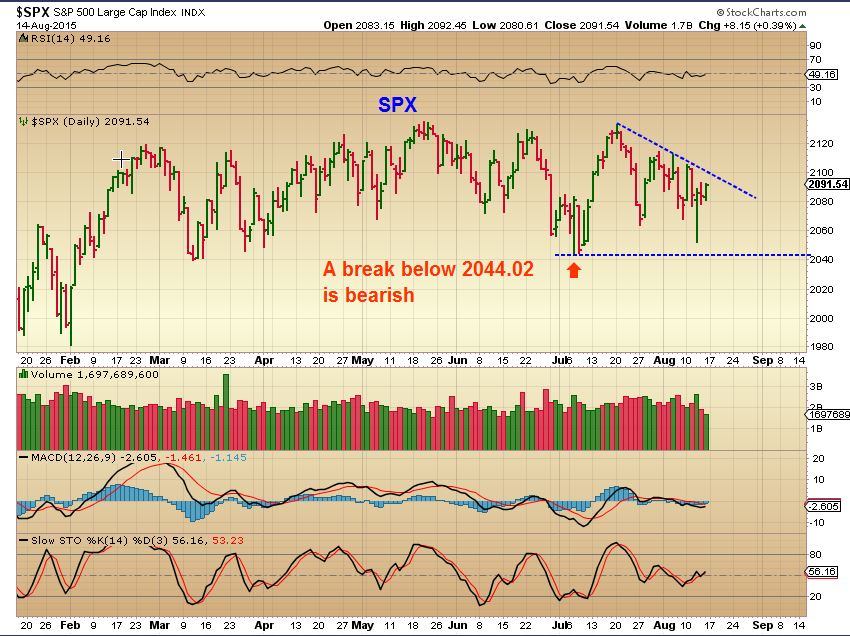
SPX DAILY – We could bounce here, but the markets have not had any follow through lately. A break below July lows of 2044.02 is bearish. We will monitor this.
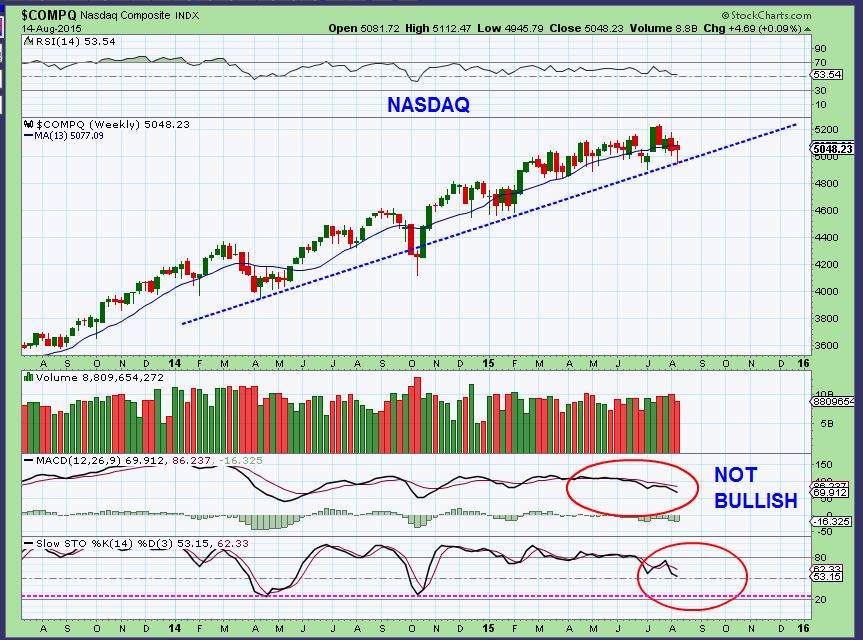
The NASDAQ has been a little stronger, but look at the weekly MACD here too. It also looks like it could bounce this week with a wkly reversal candle in place, but overall this looks like more downside is likely.
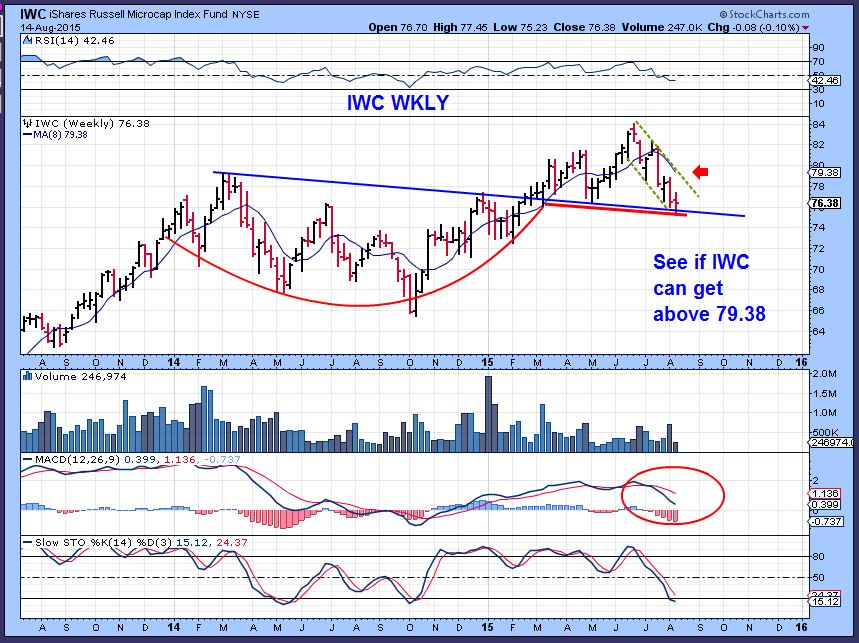
$RUT – The Russell small caps are actually in a downtrend now.
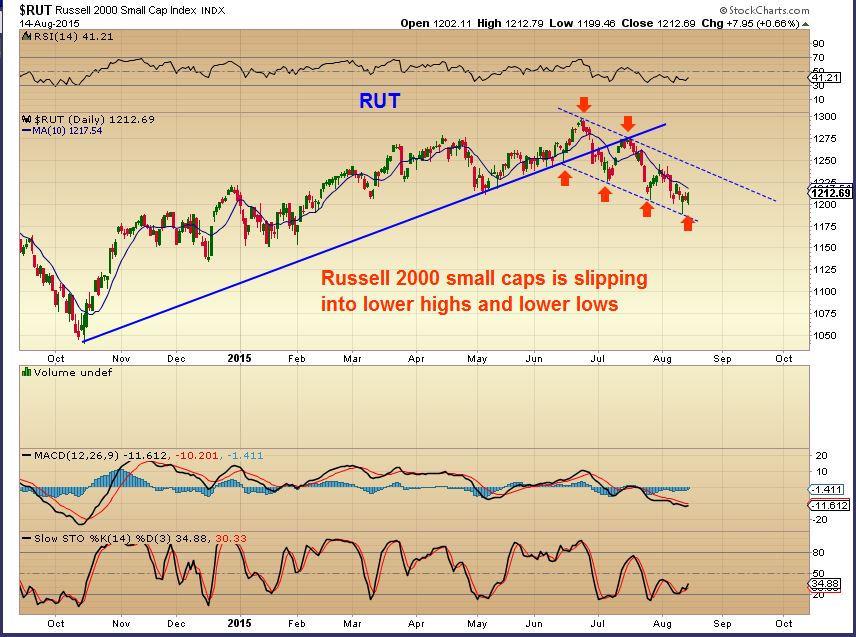
I can see possible bullish set ups in both the IWC & IWM, but they would need to prove themselves first, with the bearish set ups in the DJIA, SPX, and NAZ, they will likely break down in the near future.
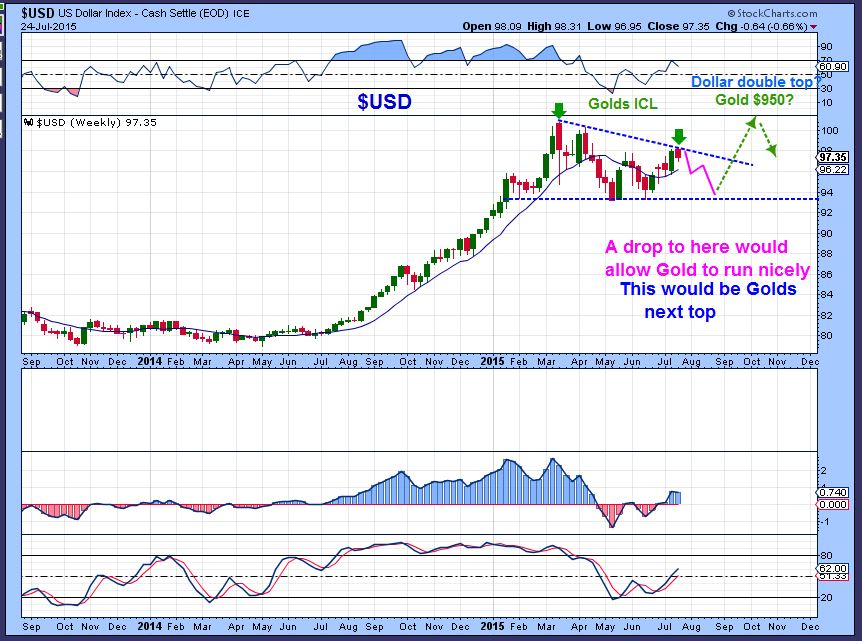
$USD – Back in JUNE and JULY I was calling for a top when the dollar had a run back higher. I saw weakness internally, while many others called for ” $1.20 strong dollar”. In July I was looking at it this way, saying that this would allow the Precious Metals to run higher as the dollar dropped.
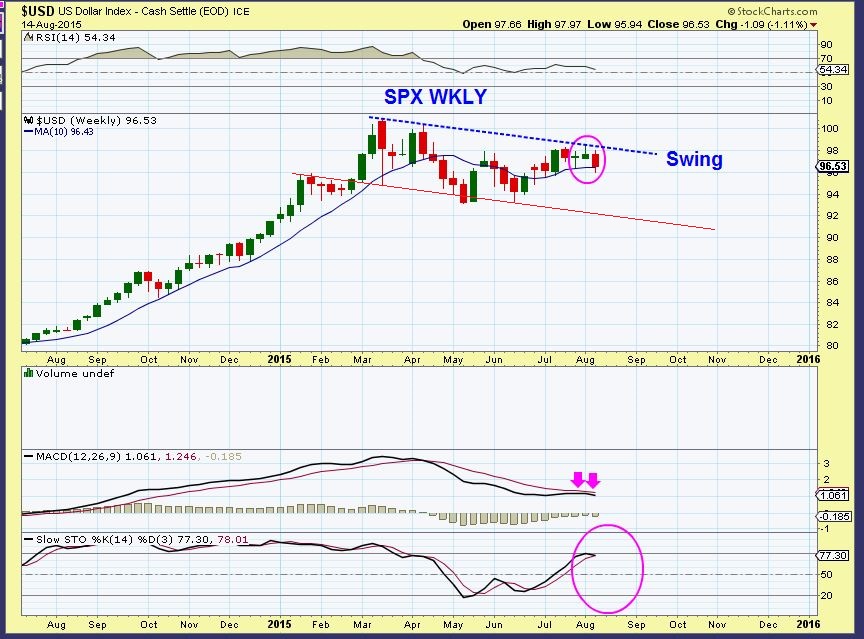
$USD WKLY today – We seem to have put in a top now. The 10WMA is still supporting the dollar, but the MACD is rolling over. I expect more downside.
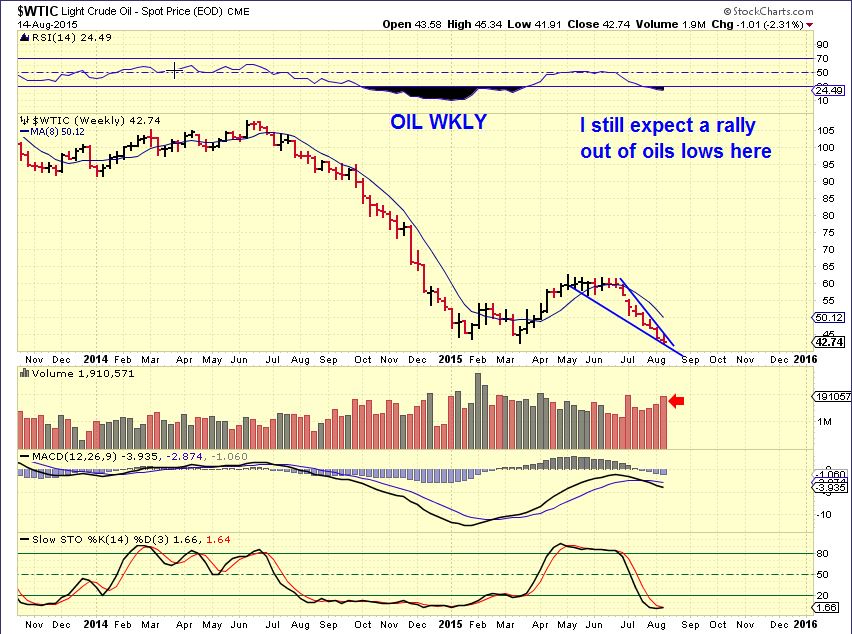
$WTIC– I have pointed out this wedge for a while now. This squeeze play has to be done. We are at the apex and many Oil/Energy stocks have bottomed and moved higher. I think this indicates that OIL is about to put in trade able lows.
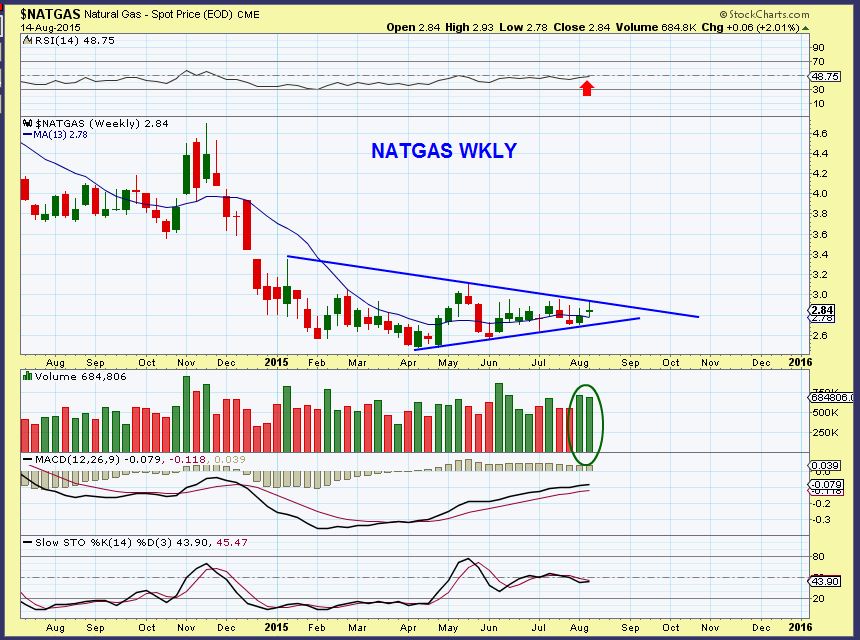
$NATGAS – THIS has been moving sideways for weeks and has been moving within a triangle set up. This is more of a bullish set up than a bearish, so watch for a break out this week. I expect it will be higher.
GOLD SILVER & MINERS
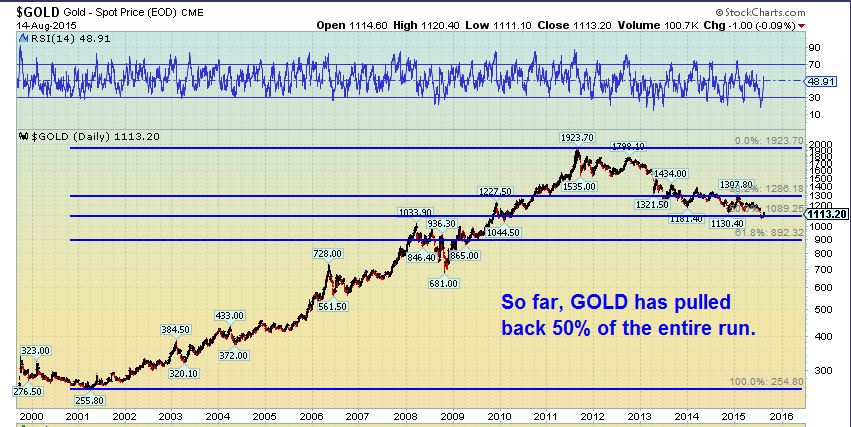
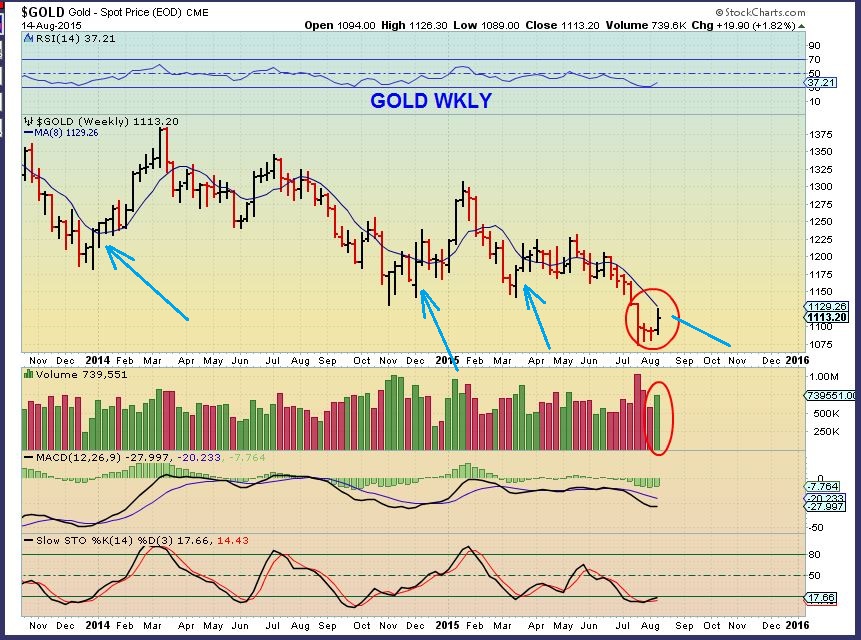
GOLD BIG PICTURE – interesting to note that GOLD pulled back 50% of its Bull run so far and has bottomed.
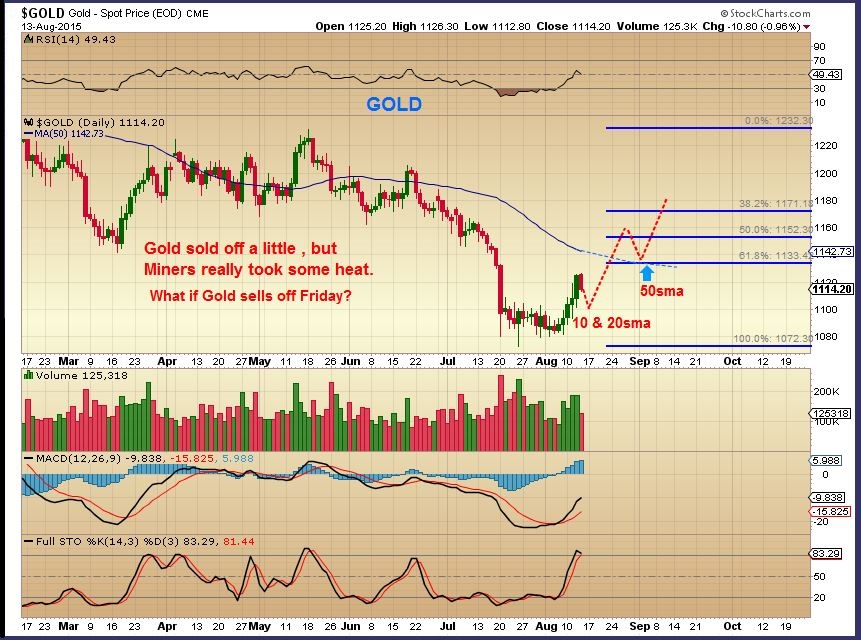
$GOLD – I posted this chart Thursday, mentioning that GOLD could drop to $1100 to shake out new buyers. The chart would still be bullish and could look like this.
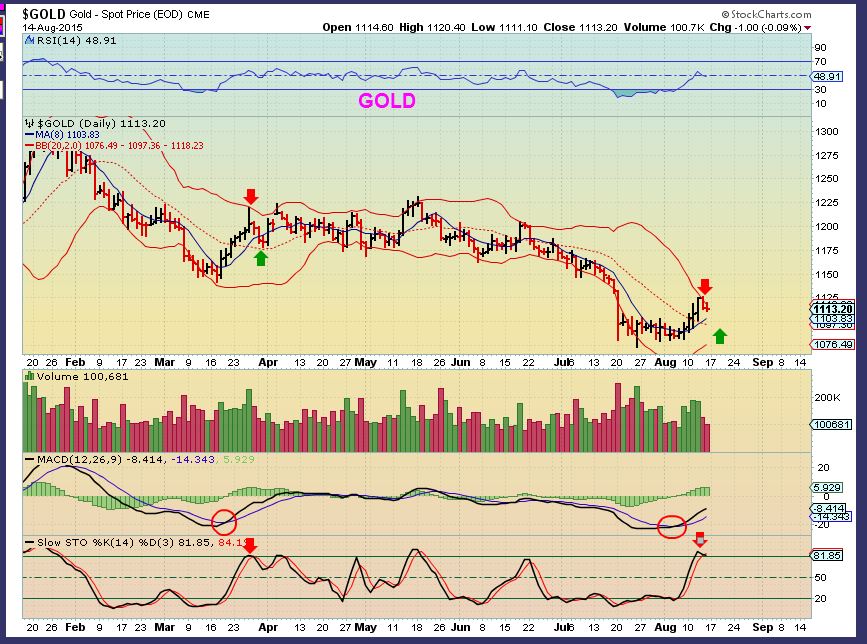
As of Friday, the daily chart had us a little overbought and up against the B.B.’s. I noticed that we did this in March and dropped to the 20sma, but not all cycles repeat exactly. I expect Gold to be much stronger coming out of these lows with the current C.O.T. Readings and negative sentiment.
Golds weekly chart saw us capped at the 10WMA, in the past this was temporary.
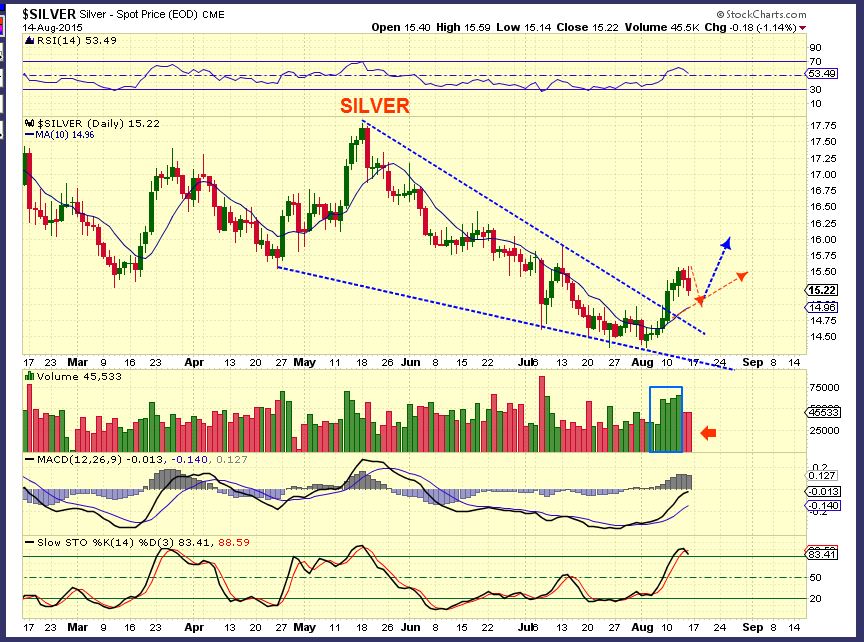
SILVER – Broke out and has reversed , now trading under the 50sma. Volume at the break out was strong and the pull back has been light. This remains bullish. The WEEKLY SILVER chart shows a swing low in place on a weekly basis. Silver often leads Gold.
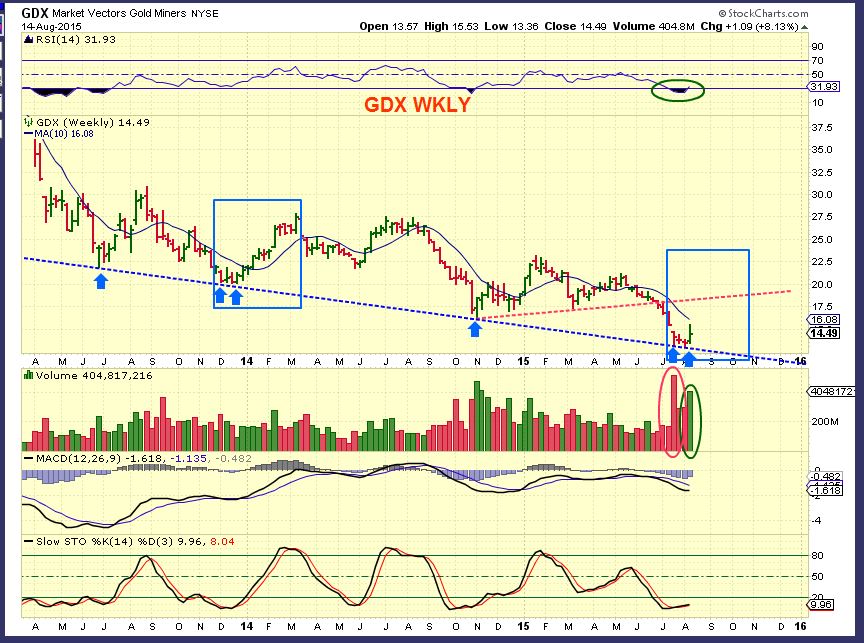
GDX WKLY– this is also a bullish set up and the big picture looks good. A Weekly Swing Low is in place in Miners.
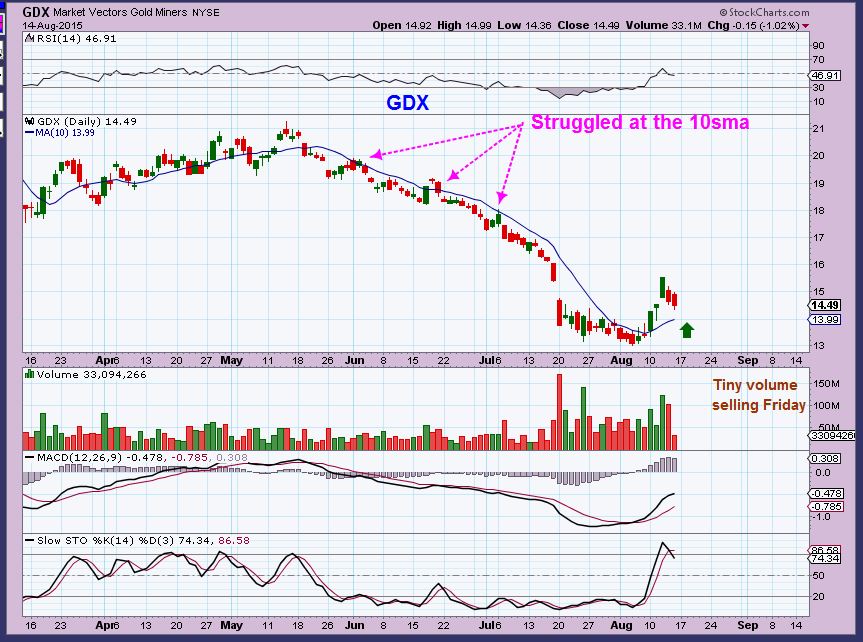
GDX DAILY – Volume selling was extremely light Friday. GDXJ also has very light volume. Sellers drying up already? Further drop to the 10sma wouldn’t harm this chart, but the volume is so light it may hold up and go sideways.
Not much has changed in the markets. I think that we could see a bounce in the equity markets, but I still feel they are going to continue to sell off. The OIL & NATGAS charts were bullish , even though they look as bearish as ever, with OIL selling off for the last 8 weeks. My thoughts on GOLD,SILVER, & MINERS has not changed. I love the set up and various features mentioned in many of my past reports, but I still advise people to honor their stops. That is always good discipline.
We’ll see what Monday throws our way, and I will be looking at charts for trade set ups since I expect the pullback in Metals and even energy to run its course soon. Thanks for being here and happy trading.
~ALEX
Shaken, Not Stirred 
 Turning Points
Scroll to top
Thanks Alex, good report. I agree with the Energy sector, I think we saw the low in WTI last week. I took a small position. Still holding miners. CDE and EGO actually went up while NUGT went down the end of last week.
Hey Bill, yes, I agree – some of the individual miners are holding up nicely. IAG is still at recent highs for example.
Thanks Alex. Holding GDX. I believe we will be rewarded this week.
I am holding on too Eddy ,
I’m thinking we make a new high this week in GDX / GDXJ and maybe tag that 50sma overhead, then we MIGHT go sideways or drop to a DCL if we cant break through it , but not too deep of a drop. I think we’ll have another nice leg higher.
I’m looking at this Harmonic pattern for GDX. Hourly chart. The upper dashed blue line is the the gap fill from 7-20. May have trouble there again.
It’s looking like another great call on gold/miners, Alex. Bueno
Thx Troy,
You probably guessed that I’m not loving the light volume rise (That can lead to sideways moves more than a burst higher), but maybe we flag here until the FOMC minutes wed (Then POP higher? ) Always something, huh?
Yes, and it’s always tough to tell what is signal vs noise. We could just go sideways with a bit of downwards bias for a bit here, further forming a bull flag; letting the 10 DM catch up, etc. GDX & GDXJ back up against the BB that has turned up is a good sign; i.e. staying overbought.
Somebody please light a fire under TRQ! Anybody have any insights on this one???
Earnings surprise 50% lower than expected! Maybe?
This one did excellent at the last ICL in March, but that ICL was MArch 16 and it didnt take off until April. Delayed back then too.
SO maybe it just has to digest recent earnings news. THE low for TRQ was AUG 6 with a little heavy selling, now we’re near that low with lighter selling. If it doesnt move soon, it’s having trouble gaining traction.
Thanks for the advice. Will keep that in mind with a tight stop below.
Holding firm on existing positions in GDX & GDXJ. Cancelled low-ball orders that were entered on Friday and sold near OTM puts on GDX, GDXJ. Hope to buy those back at lower prices (when miners test the lows?) and double positions at that time.
When you say test the lows, not sure if you mean test the GDX $13 area , or just the “Base” that it just popped out of.
I’m looking for more of a tag of the 10sma which is at the top of the “Base” area , and it is rising. I personally would look to maybe at least ‘start’ to re-enter there unless you are feeling really sure about a lower test.
We’ll see how things go with the FED MINUTES released this Wednesday ( I think they get released this week).
I WAS vague on that wasn’t I? It seems we could make a lower high below GDX 15.50 and then drop lower. I’d love to buy more at the 10 day sma – almost a dollar lower would be nice. If that happens in the next couple of days, I should be able to keep about 40% of today’s put revenue. If GDX does drop below 14, it should make a higher low with bullish divergence, so that deep of a drop isn’t catastrophic
Gotcha
If they do a rate hike in September, it could cause a drop into a daily cycle low, and then that may be the only drop. If they dont do the hike…yes it could be good for Gold & Miners (But it sure hasnt done much good for them over the past few months 🙂
Honestly, after watching this for the past few years, I’ve started to believe that gold can only finally shed the bear once the Fed gets out of the way. A no rate increase kicks the can but two days later market frets over December. People’s evidence #1 will always be September ’13 ‘no taper’
GDXJ is hovering in the twilight zone, between the continuing correction and a new uptrend.
which way will it go?!
Why does your GDXJ have a big gap at $20.90 to $21.10 ? I have that gap filled as of Friday
isnt the gap on fridays open filled 3rd candle?
then gap up again today, so far not filled.
probably wouldve helped if i put date scale below.
i havent checked what its doing on stockcharts.
otherwise, maybe just a data glitch,.. i dunno
refresh for my chart of GDXJ . We did gap open higher today, but your chart seems to show the gap from Wednesday still open.
.
Oh I see…you are in a very different time frame ( not shown) and the date scale was missing on the first chart, so I thought you had a daily chart pointing out a gap from Wednesday that I see as filled.
we all good now 🙂
added new chart for clarity
…
Morning Freaks!
update on your favorite miners. Good day so far.
also like the setup on Energy stocks.
(refresh)
Can you post the same for the energy sector, include TPLM if you can. Thanks
I posted the energy list above 🙂
BAA, what is going on with you? patience….
Any of you EW theorists want to take a look at the attached GDX chart (refresh)? Probable?………..
as an EW hobbyist… i’m projecting its somewhere roundabout there.
10sMA most likely to stop it.
are there any harmonic patterns that give a short flat C wave like that? .. all the ones ive seen, seem to be long zigzags.
An Ideal Harmonic would have C up around 88.6% of A, almost a double top and then a big correction.
Hi Bill
I’m certainly no EW expert but it certainly lloks like a viable count and if the pullback is a simple ABC a 50% retracment of 1-5 would put C around 14.275 and a 62% retracement would target 13.98, which is where A=C and is also the area of the prior wave 4 low and a typical retaracment target. But only my personal and by no means expert view!!
awesome.. welcome 🙂
lookn good bill… I’m loving any nod to EW in analysis…. tho for the record — i am a mere EW Analyst WannaBe ;o)
welllll hopefully someday when i grow up i will be.. ;o)
ehhhh .. on 2nd thought… I dont wanna grow up.. ;o) ha ha..
im watchn GDXJ annnnd have something ROUGHLY like this … but im sure all the true Elliotticians would stab me w/ pitchforks for the sloppiness of my counts… they are BRUTAL… 😡 so let’s not tell them… ;o)
I ‘think’ wave 1 actually began on July 24th… which incidentally coincides with CF’s awesome bottom call if I’m not mistaken.. So, because I am farther back than you, considering the Fibs across time, it ‘appears’ that this wave 4 triangle is going to bore us to death a bit longer and resolve more in the 1.38-1.61 fib line …so maybe like Friday or monday it resolves & wave 5 blasts off to the upside?????
What ya think….
https://www.tradingview.com/x/zIHdO5Nk/
Hi Maria
Your count looks good on GDXJ but GDX actually made its price low on 5 Aug and not on 24 Jul as GDXJ did. Based on my very limited knowledge wave 2 cannot retrace more than 100% of wave 1 therefore there has to be a slightly different count running in both ETF’s. But based on yours and Bills charts both look good to me in GDXJ and GDX. But just very my my humble opinion. 🙂
thx Chris… i have 17.92 for low on 7/24 and 18.42 for 8/5 …. i could be reading that wrong.. lol!!
Sorry Maria I didn’t explain myself very well. You are spot on with GDXJ which made it’s price low at 17.92 on 24 Jul. However, GDX actually made it’s price low on 5 Aug and hence the reason why I think yours and Bills’ wave counts although slightly different actually both look correct for their respective ETF’s. Hope that makes sense!! Lol
ohhhh .. i see.. sorry – i read that too fast
**hazards of working while trading… one leg here…one leg over there…it’s like a GIANT Twister game…
*yes i still play that game.. what of it? ha!
Muti-tasking!! Apparently women are better at that than us mere men!! Lol Although in fairness I was cooking my evening meal while writing my comments! Does that count!!? Lol 😉
Ooo.. u cook and chart? Yummy…;-)
That or starve!! Lol I think I may be in a slightly different time zone here from yours. Just coming up to 9.30pm in the evening where I live! But always like to see how the US markets close, so the PC stays on relatively late.
and ps… this 4 triangle could also extend to infinity and really bore us to death.. I’ve seen some FUGLY longA$$ triangles out there…. esp where Gold is concerned….
you could be right M, with your higher B wave endiing (you labelled abc)
may end up where my ‘1’ is on earlier chart today
watching GDXJ.. just broke out of downtrend channel now.
would give nice zz B wave
I think the simplest pattern is the most likely here, AB=CD with a bull flag in the middle. Currently we are in the CD leg higher. Next stop $17 on GDX.
expecting a top this week for a tradeable top….most likely dates 19/20 or even as late as 24th. However, some do not see it as a crash like in 2000 or 2008….see Philadelphia Anxiety index…..click on accompanying chart not the same conditions as 2000 or 2008
https://www.philadelphiafed.org/research-and-data/real-time-center/survey-of-professional-forecasters/anxious-index/
RRC adding to my calls. Heads up.
COG still in play. Sept calls still cheap.
.. isnt that purrrdy…
GDX & GDXJ on 3 day chart look to me to be inverse H&S (refresh) ( Elliot Wave THAT!) – LOL 🙂
.
we’ll get it to fit like Cinderellas slipper
I just tried up above a bit higher 🙂
ha.. there aint no job we cant fix
i think it’s really saying SOS … u need help… 😉
LOL !!! exactly…
LOL !!
Did you notice we got your volume by EOD? 🙂
Also notice that GDX:GOLD is improving (but at upper BB, now starting to curl up). If GDX:GOLD returned to spring values of .17 and gold moved up towards 1180-1200??
Whoah.
might have negative divergence on the 15 min macd
http://screencast.com/t/8G0ADffhL
I cant tell (refresh) – I’m probably breaking a rule here in 1 of these 2 choices.
ha ha… BRAT
I still luv u… i mean ur charts… YOU are the best … EVER in the ENTIRE world…
https://uploads.disquscdn.com/images/6478511828514aa8342914cf41732d4d4b6785670fff706394b2d4f3a0a6ad79.png
They let you drink at work , aye? LOL
liking the downtoearthy lo-fi approach!
giggle……
gorgeous chart! makes sense.
don’t humor him frenchie… ;o)
ps. those are some nice lists you posting for energy&gold… can you post as a csv or txt file? ;o)
thanks…
also ..thanx for heads up on ego… hopefully i can do some shopping tomoro…
Have your fun … lol… im having mine.
Ps. That is one sexxxy pic for the blog 2day… pheww.
. dont even tell me it’s your home…
No Ma’am – That is not my home – I took the pic from a line up
I think the red guys better, 5 has to extend past 3 of correct.
eod favorite miners (refresh)
special mention for AUY for performance and volume. thank you!
Some of these charts look pretty good. EGO, IAG, SSRI, etc etc
I am in IAG 🙂
EGO may pullback tomorrow. May be a good opportunity to buy in.
Go AUY! I added Friday.
Apologies I have no idea yet how to post a chart on here so this is description only. Very much a newbie to the discussion board…it’s my first day!! But looking at the 1 hour chart of GDX and leaving all the EW counts aside, there looks to have been a nice little base breakout around the 14.40/14.50 level which has now been retested as support. The hourly MACD also had a nice reset near the zero line and is now turning up keeping it short term bullish. The breakout from the base would suggest a near term target in the 16.0 area and I notice there are one or two daily price gaps in that area and a prior spike low right back on 5 Nov at a price of 16.46. Just think based on this that 16.0/16.5 might be a viable target area for the relatively short term, so long as we stay above that base breakout area. Just a few thoughts.
It does appear that way. BTW there’s a little icon at the bottom left of the box you type your message in. That will let you post a file. Or you can just paste a weblink,
Thanks for the tip Bill. Much appreciated. 🙂
hi Chris.. you must be in UK like me, now approaching our 10pm bedtime.
(not together of course! lol)
Good guess…on both counts ‘SonofGud’!!! Lol Not quite in the UK though. Just a little further south in Guernsey, in the Channel Islands. 🙂
**not that there’s anything wrong with it…. ;o)
side thought: that’s a little Seinfeld humor… in case you didn’t watch that in queensland….
*** if i discovered a stranger in my bed.. who was subsequently revealed to be Chris from CF.. then i can safely say, something would have had to have gone very very wrong …. :0
Seinfeld.. was the best sitcom ever
Hi Chris,
Are you Chris DeLane?
That would be nice to have you also on this side by Alex?
Sorry to disappoint you Guert but not Chris DeLane. Sorry!! 🙁
Thank you Chris & glad to have you hear .
Thanks. Very pleased to be here and looking forward to some lively and informative future discussions.
Chris, also notice 50 day SMA at 16.16 and headed down, should meet your 16 target in day or two, adding credence to your summary and resistance.
Thanks Cason. Probably all a little too neat and I’m sure there will be a lots more twists and turns yet but all good to keep an eye on.
Sold my positions A/H in NUGT & GDX I’ll sleep better. 🙂 Can always buy back at right time. Hope all on this board are doing as good as I am. Just DTing for now.
Nice work. I misplayed the pullback last week. I’ll be exiting leveraged positions on any strength prior to Fed minutes release, but holding core non leveraged juniors.
Thanks Cason, sounds like you have a good plan. It’s real tricky out there that’s why I’m trigger happy. I’m surprised I held on till market close. Best of luck.
for @disqus_KHRnJNxnSW:disqus
Energy stocks eod.
(refresh)
Thanks