When dealing with Cycles, there are times that they are getting s-t-r-e-t-c-h-e-d, and other times when the count has simply started over. Right now in the Precious Metals markets we are facing that situation, so lets discus that further after we review some other areas of the markets.
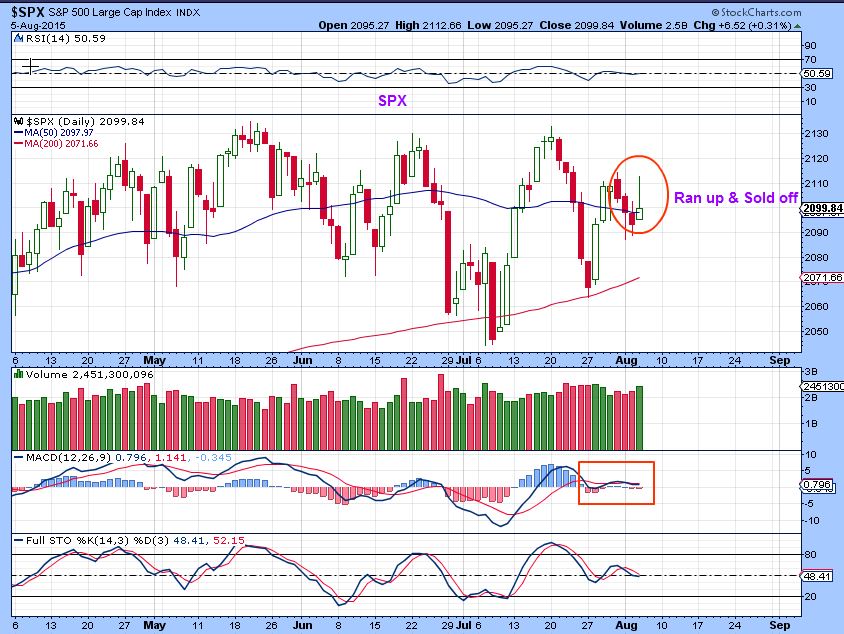
SPX – more sideways action. Yesterdays rally attempt sold off
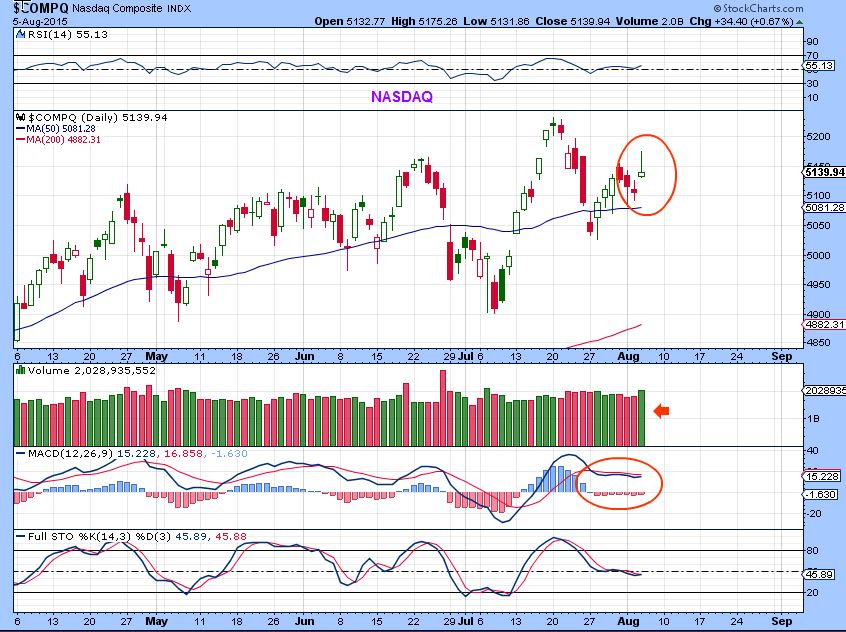
Lets look at the NASDAQ…
It also rallies and sold off into the close
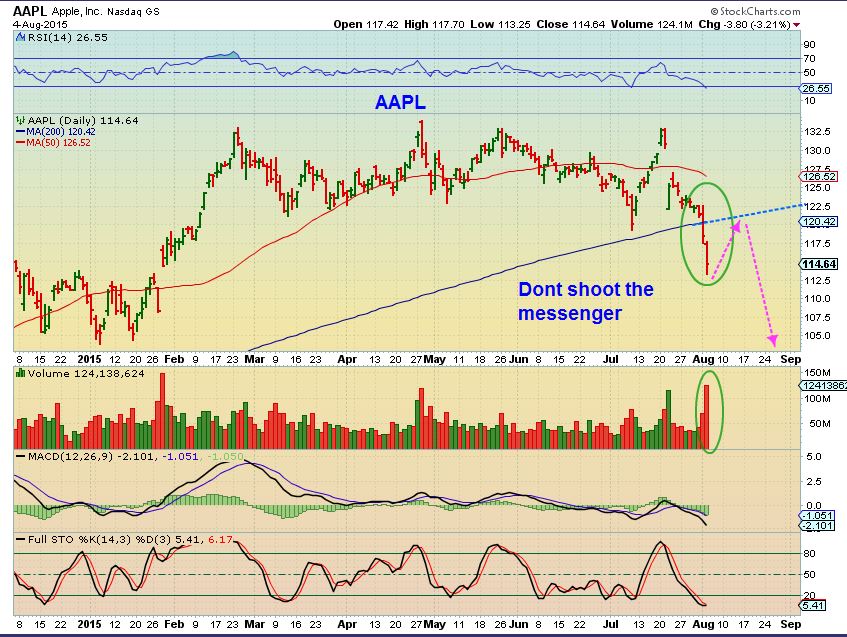
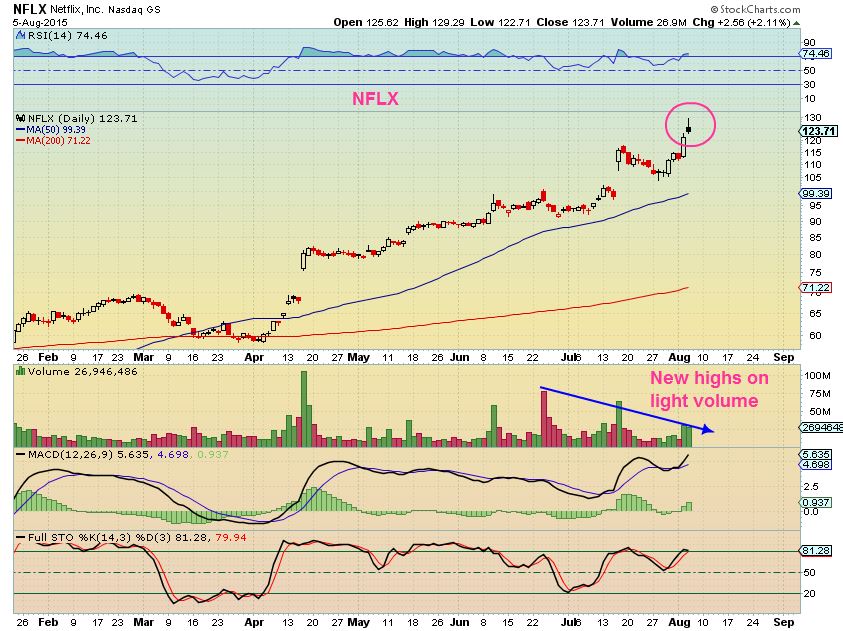
I would have expected a break to new highs before eventually rolling over, but the markets continue to struggle sideways. Will the JOBS REPORT FRIDAY give them the needed boost? We will see, but please look up stocks like AAPL, TWTR, DIS, GMCR, RYN, TSLA, TWX, ETSY . Here are a couple of them below.
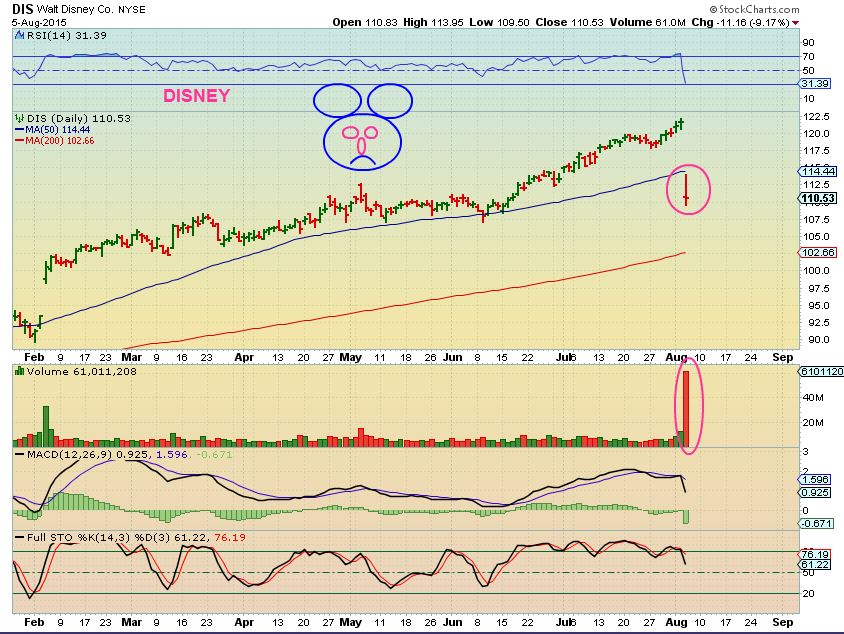
GMCR ( Green Mtn Coffee is down 30% in premarket) . So things arent all rosy, and even though NFLX hit new highs, this looks like a temporary topping candle. Maybe the markets will pull back on The JOBS Report?
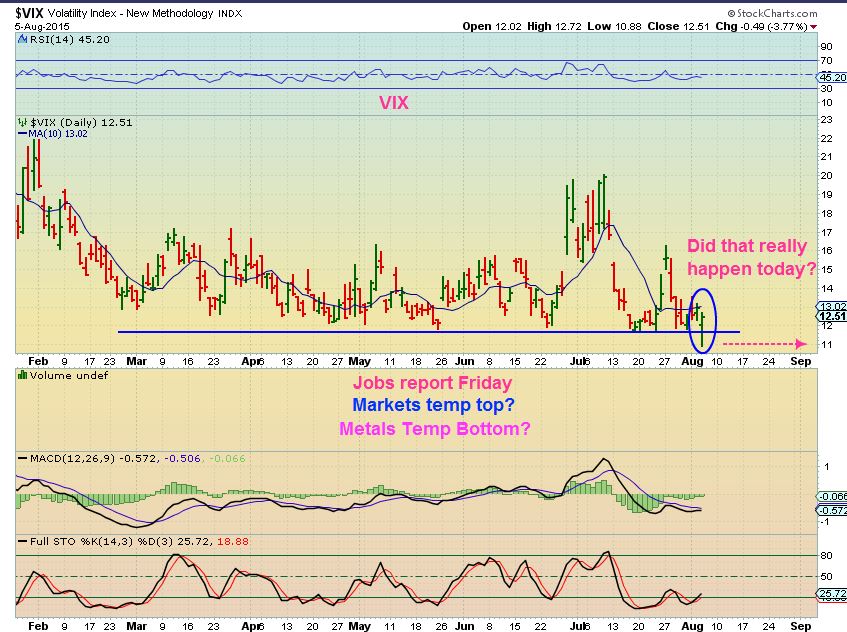
I saw this chart of the VIX and thought to myself, “THAT looks like it wants to rally and that should send the markets lower.” The markets have usually rallied on the JOBS REPORT, but things look a bit different with this Vix reversal. If the markets drop, will the Metals finally POP?
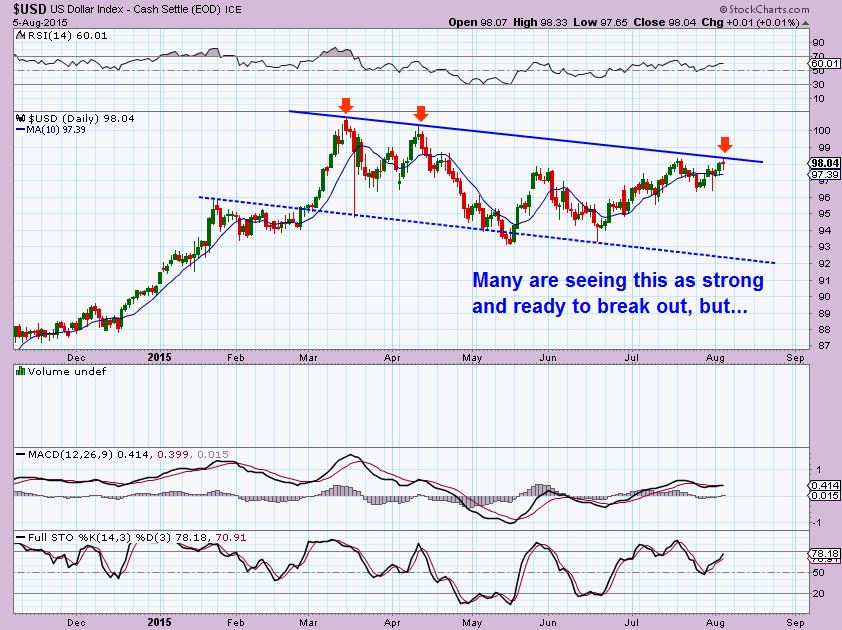
The Dollar has been strong for a long time, and the markets have gone up with it. Also Metals have dropped with the stronger dollar. This is the dollar. Is it going to BREAK OUT?
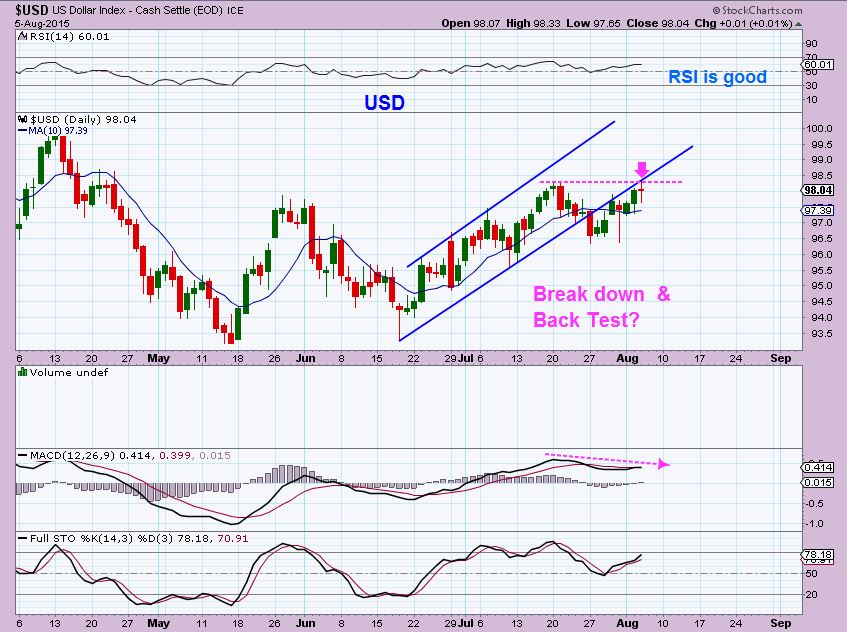
Zooming in, I see the dollar as stalling at resistance and possibly ready to drop lower.
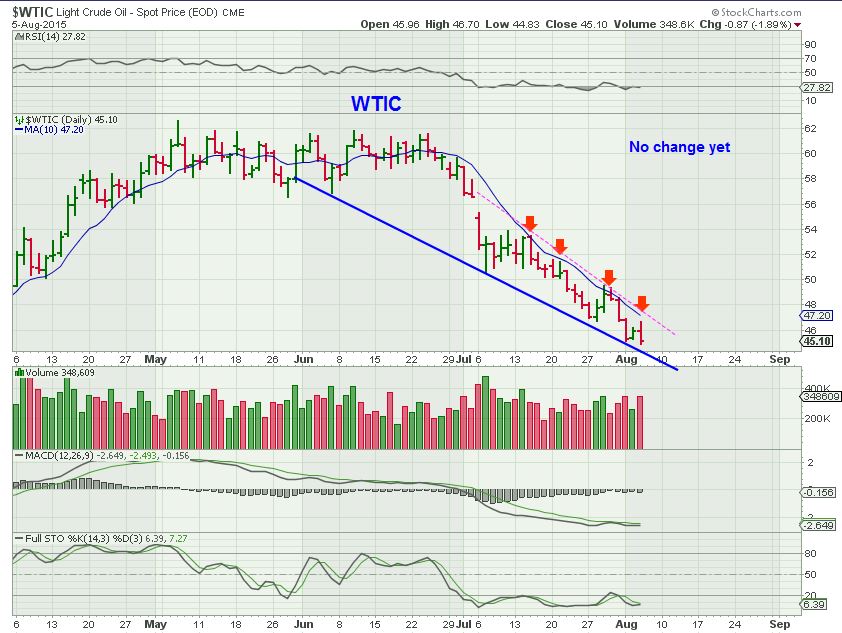
$WTIC – OIL has been failing & Falling rather relentlessly, but it may finally be ready to turn higher. ( Reminder: I have repeatedly cautioned against jumping the gun and entering below the 10sma)
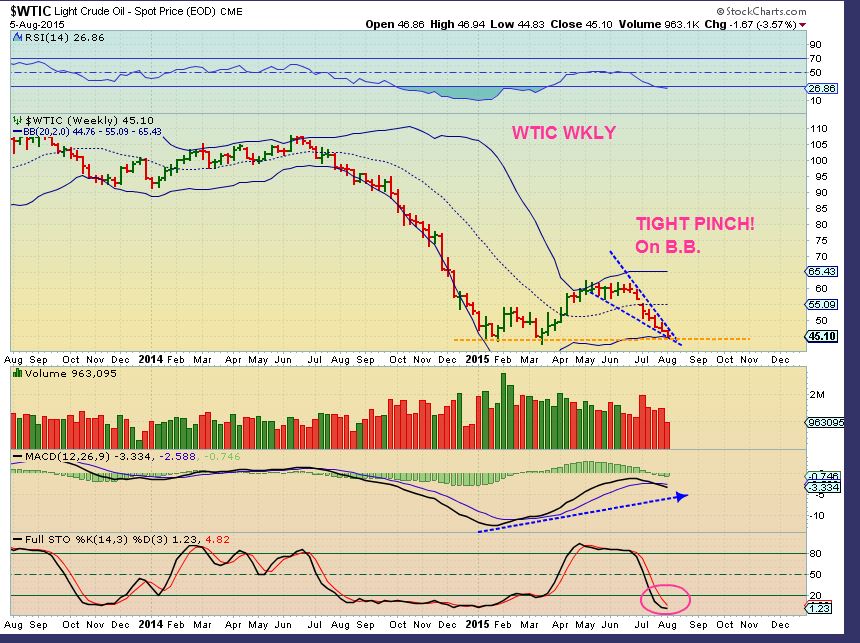
The weekly WTIC looks SQUEEZED – these usually break out with zest. There actually may be an ENERGY trade in the near future.
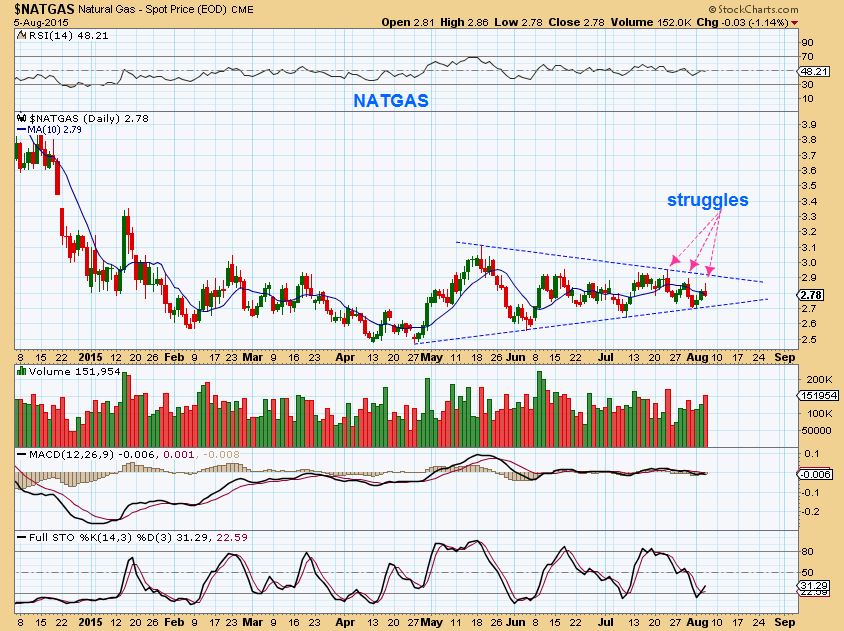
NATGAS
GOLD , SILVER & MINERS
What else can we say? 
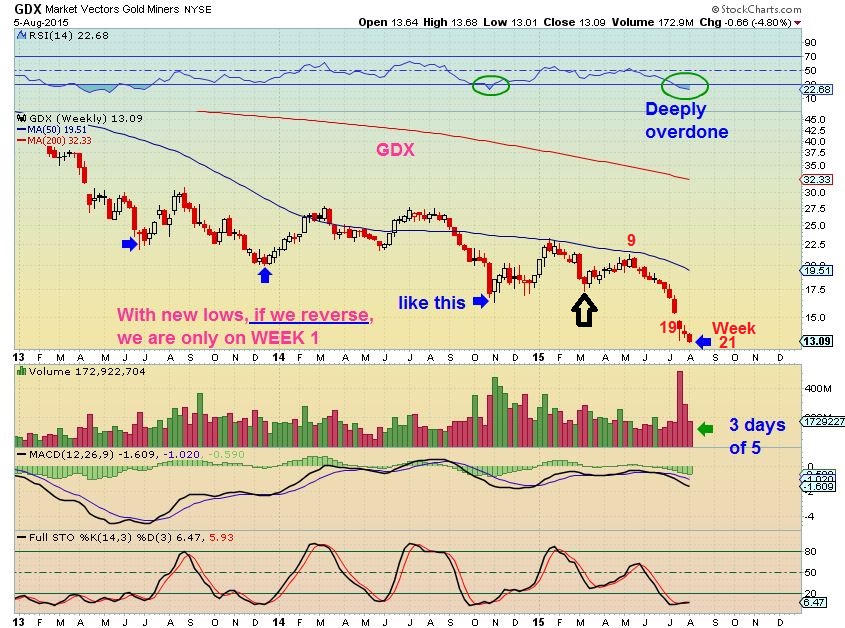
GOLD is stretched . I actually liked that GDX hit new lows , because I personally DO NOT think that we started a new Daily Cycle and new lows is good for a couple of reasons. I will explain.
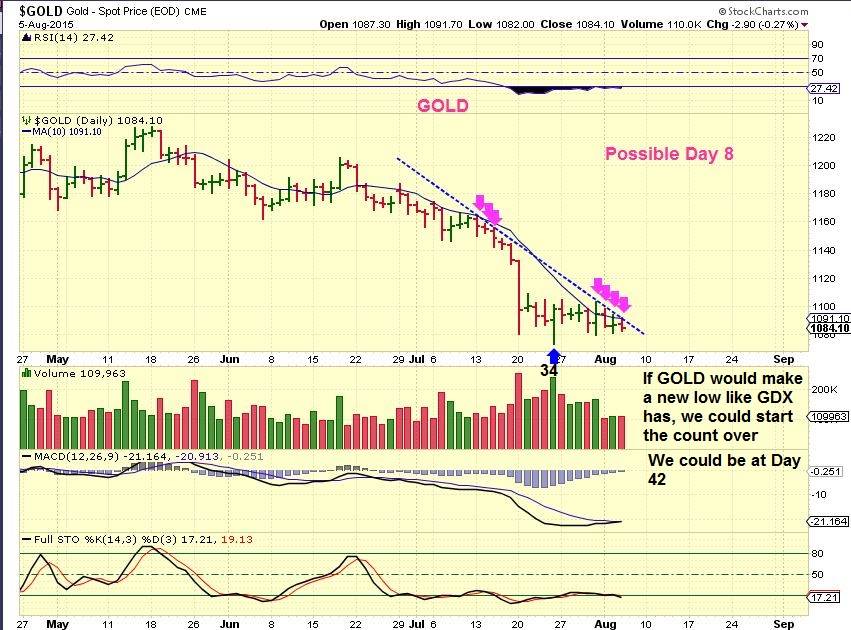
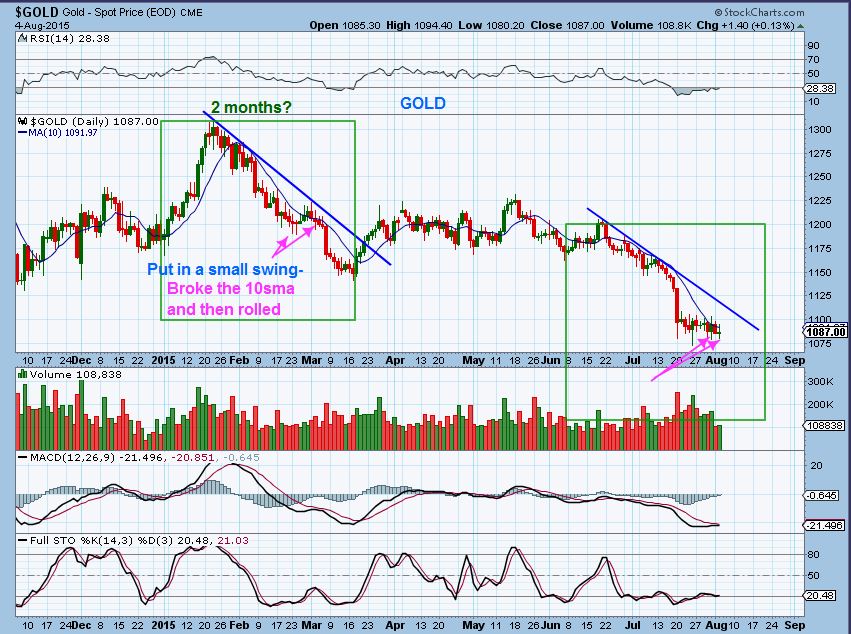
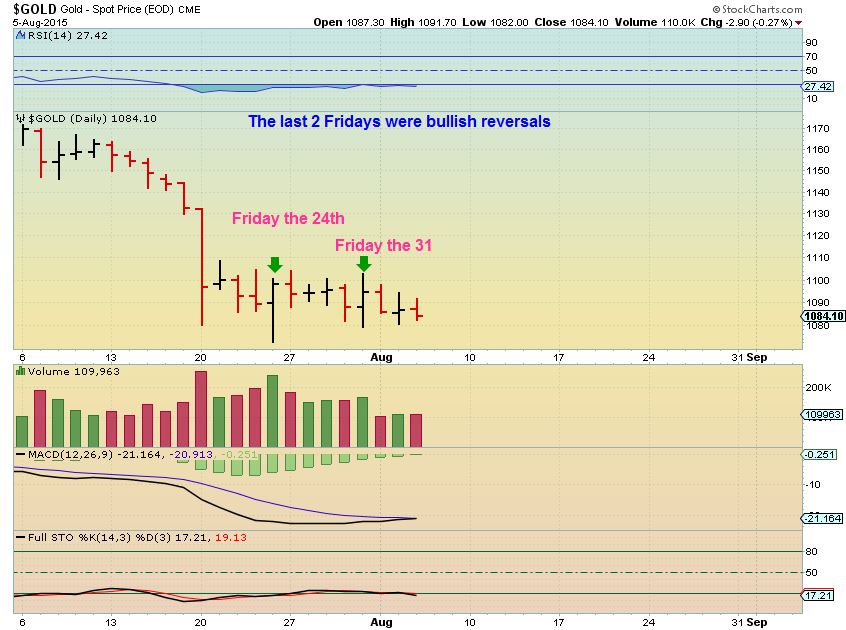
I looked at this GOLD CHART yesterday and found it encouraging. I pointed out this possible L-O-N-G Stretched Cycle into the March ICL. Notice how it played out in MARCH.
1. A slam down day (March 6) and then 2 weeks of downward sloping/ sideways type drop day after day.
2. We now have a slam down day (June 20)and 2 weeks a downward/ sideways sloping day by day move.
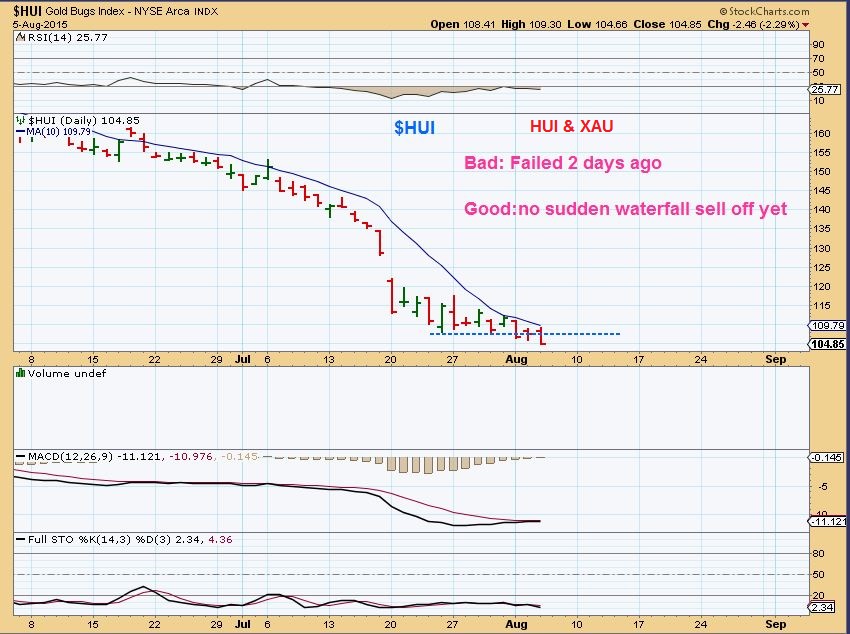
YESTERDAY I saw GDX hit new lows and MANY in other blogs & Forums immediately switched to short to “Catch the coming bloodbath”. Many said that a break of support would cause a waterfall sell off. I Looked at HUI& XAU – they broke 2 days ago and No bloodbath so …
What happens if we go higher? They’ll have to cover. A short cover rally.
GDX at new lows is actually good looking on a weekly chart. We had a week 19 low 2 weeks ago (early-ish) and now we have a week 21 low. If we reverse by Friday it looks like other lows.
Will the JOBS REPORT do the opposite this time? Drop the markets and rally the metals? Look at the set up in GOLD, and then look at DIS, AAPL, the TRAN, the SOX, etc etc . It is possible.
Is it also possible that DUST runs to $50-$60 and Miners and Gold do drop fast after the JOBS REPORT too? Yes. I am looking at everything and all I can do for myself is sit tight and wait for what I know will an exceptionally profitable rally in Miners. The current set up so BULLISH. It has not been this strongly bullish in many many years. Patience will pay off, I personally am not going to attempt to short this.
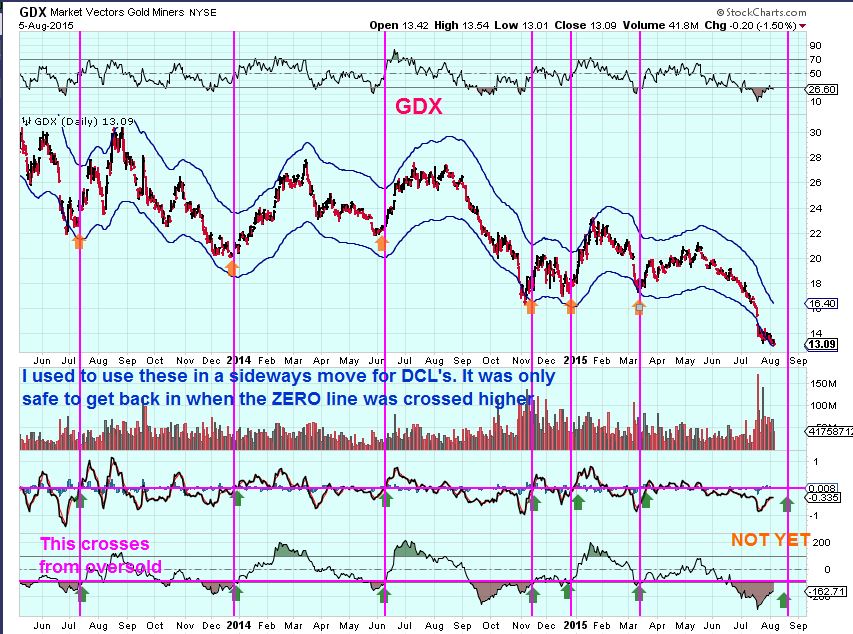
GDX TRIGGER CHART- This is just a chart that I used to use in sideways moves at bottoms. It was for both an anticipated DCL or ICL timing wise in GDX Cycles. If you were expecting those lows and we were going sideways, I found that I would jump in & maybe get stopped out- so how to avoid that jittery sideways stuff? ( Now I simply say wait for a trend-line break above & a move above the 10sma, but I had developed this chart) …
Notice the sideways lows. You only buy when BOTH bottom 2 indicators shown recover the magenta horizontal line ( Green arrows) . Both must recover . As you can see, it worked well to catch a move off of the lows early, just not the exact lows. Notice too that It has not triggered here yet. It wont until we move off of the lows.
It is not possible to know in advance how this will all unfold after the release of the JOBS report, but I will say this… the last 2 Fridays were Golden Fridays 🙂
~ALEX
P.S. As you know, often not much changes from the Thursday report to Friday morning, so I may not have a report Friday. We’ll see what happens after the release of the Jobs report. I will cover all the weeks events in the weekend report. Have a great Friday & weekend.
What Is The Golden Key 
 Oversold Oil
Scroll to top

I have an idea that Jobs Report will be weak, $ will reverse, USTs will surge, Euro and commodities will surge. On verra.
Seems NBG is basing right here. Daily chart later on today I think members will find interesting.
Interesting. Refresh
sweet! tx
made some nice cashola on that one… tx 2 u posting….
From $640 in 2007 to 75 CENTS. Seems to me the recent crash was coming due to the Greek mkt closed (for repairs…). If this is indeed a false breakdown of NBG and it retakes the 50 then the 200 it really could be a pension gold mine.
If…
On verra.
Remember, 10.30 today is the natural gas report.
mornin frank 🙂
DADDY to you
wink
Yes, and NATGAS was on the lower trend line again…Thanks
Alex, GDX chart: now if I could only figure what those indicators are which are to cross the magenta lines!
Alex, can’t give away all his secrets.
he’s ALIVEEEE … ;o)
cant u just put in ur own line.. then drag & drop it there….
What in the world does this mean?
HA!! i will try and show u later… 2 funny. nice day out there… woop! LGCY – i like it 2
ps. u … this … better b around in 2 yrs when i can play…. im bummed missing out on the fun.. ;o)
mann.. IAGs in fire … DQs calln me again…lol
idk if you saw my jdst chart last night CHARTFREEEEEk .. but .. it APPEARS to be following at EW diagonal pattern to perfection.. including the ‘throw over’ of E… and you see that ‘pattern progression’ indicated that price would fall down after completion..
not prediction… but .. “progression of a pattern” is what foretells what may happen… this is ‘pre’ (as in not post) ;o) — knowledge – well according to my beautiful brown eyes …. [so im told] ;o) HA !!!
(insert van morrisons Brown Eyed Girl clip)
here’s jdst ….in case u didnt see it … https://www.tradingview.com/x/SESE4tOp/
ohhh… annnnd the way those Cycles stretch… sounds strikingly similar to how waves can “extend” to fit the move….
…. just trying to understand these things……… curious cat that i am… not trying to pick a fight at all .. (not that i would mind rolling around in the dirt) LMAO!!
just spend some time playing in stockcharts,… you’ll find em
Alex did both signals just cross? Good volume in GDX………….Trend line rejection
Not yet, but this is what I’ve seen…
When I stopped using that chart it was because for the most part , over 80% of the time the GDX had just crossed above the 10sma when both indicators triggered. .The other times it was just about to move over the 8sma.
SO to make it easy, I just started saying “Its safer to wait for a cross above the 10sma” .
Right now we are up against the 8sma on the GDX, a cross over that may be enough, but above the 10sma is usually safe.
Interesting day for sure, price move on both sides of the trend lines of GDX
Yes, I have to wonder if this all gets resolved with the Friday Jobs report.
As long as the GDX remains under the 10sma, I think it could go either way.
Yep, it’s proven nothing so far; other than that they can screw with our heads and run stops!
Nice to hear from you Bill.
Keep up with you good works???
Thanks.
Thanks Geurt
MBLY, GMCR, DIS, FIT, TSLA, SQNM – Pretty big losses
DDD – up 20% WTW , RAIL,
Looking at charts of ABX ( up 6%) GG( mentioned yesterday) , and NEM…it looks like the drop in GDX yesterday MAY have been a shake out.
GG & ABX now have MACD cross up
GDX MACD hist pos now. Of course it has to hold it.
the selloff on ABX had been excessive but earnings were not as bad as feared and so the rally probably fueled by short covering and prior overselling.
Could be, and now ABX has as much volume today in 2 hrs that it had almost all day yesterday.
GDX up $0.34 today and it feels like its blasting off? Doesn’t take much after the recent beat downs.
A positive natural gas report.
And a nice reversal on UGAZ / UNG
very good reasoning Alex, I feel I am ready to nibble and actually picked up shares in GDX, GG, EGo and several Canadian juniors.
Hey Marinho
Its hard to be sure with JOBS REPORT tomorrow. If the Dollar takes off higher we could get a 4th daily cycle in the metals and more downside, but I feel that yesterdays break of the lows in GDX lured in a lot of shorts.
If they start covering today? We get a pop over that 10sma and start moving higher too.
SO basically, honor your stops 🙂
appreciate the GDX chart hopefully you will keep updating it if we get the buy signals.
I will post it, but as mentioned in a comment below , it is more often than not occurring when the GDX moves above the 10sma.
I dont think It would cross higher until next week , if the GDX keeps climbing, but I will post as it does reach those areas.
IAG is a nice looking set up (Still vulnerable if GOLD were to sell down however, but a higher low, good volume ,etc) . Refresh to See chart
IAG is only one of my miners that did not stop out. I plan to add to the position once GDX moves above 10sma.
Oil down over 2% Energy stocks XLE up….hmmm…..maybe it is time to nibble?
PLUG missed revenue, ouch, RIG beat estimates.
CLNE major sell off today…watching.
RIC – attempting to apologize for its recent sell off. Up 9% today
Is RIC a buy here? Above the 10 and 20sma, MACD crossover. RSI above 50
Now up 17%!
If you have time…LOOK UP THESE CHARTS. I am seeing a LOT of breaking down going on in this Bull Market. Tomorrows DATA could be crucial for the Equity Markets and Precious metals.
AMCX, GMCR, TSLA, TWC ( time warner) , PHH, XBI ( Biotech ETF)
and
FIT & MBLY beat earnings ….down
Fit blew their estimates away= Price is now down 13%
DOW JONES chart & Viacom chart below (refresh)
GDX fight going on (refresh)
: ) I was looking at the same thing ( And with GOLD too)
GDX won’t cross its 10MA today. Gold is not ready yet 🙂
this kinda freaks me out it fits so well ……………………..
https://www.tradingview.com/x/h3PuFlej/
Yep, chasers are getting spanked a bit here.
I bet we get a retest of the $3 level, 78.6% retracement.
I’ve watched 3 seasons of Vikings waiting for Gold/Miners to resolve. Lets hope it gets a move on before Season 4 is aired 🙂
LOL!!!
Is anyone still alive on the show?
They left a lot of bodies in their trail. Great series!
Is this it? Time to take off? I am showing GDX and GDXJ both exactly 2 cents below 10-day SMA, each having popped above that level for a few minutes earlier. I know we have Jobs tomorrow!! ADP came in light but they do not always correlate. Considering holding one DUST call as insurance into the report, knowing that if metals take off, it would devalue quickly.
If miners do push higher after jobs, they would close the week above the 10 day that we have been following.
Sorry Cason I had the same thoughts….
I decided to solve the problem by throwing more money at it. That usually works (sarcasm). Figured if we are up tomorrow the extra I make from the additional calls while pay for the ‘insurance’ I took out. Crossing fingers…
Alex,
If it looks like GDX will close above the 10sma will you be adding with GDP staring you in the face tomorrow morning ?
Sorry not GDP but Job numbers tomorrow
I accidentally did. I put on a trade and …fell in love with it? Oh no- Thats not an unemotional trader.
this kinda freaks me out it fits so well. …. ABCDE .. and includes the E throw over… hmmmm
https://www.tradingview.com/x/h3PuFlej/
M.. those ABCDE triangles with throw-over Es,, may be a ABC z/z with long diagonal C wave (ie. overlapping 1 & 4 waves).
saw a version of GDXJ on my web rounds with such a pattern… this is JDST equivalent below…
OOOooooo .. wow .. interessssting… tx SOG
the wave i of the C wave also has the overlapping 1 & 4 (looks very spiky!)
in fact.. just wonderin if there is one playing out now on the 15min GDXJ (before we get a deeep 50-78% wave 2 correction?)
can u show me ….. ….
im having trouble seeing and drawing that ……… (all i see is people having sex) LMAO
can u include the price/time scales so i can try & replicate it…
thannnnnk u ;o)
soz!… now with scales
sorry.. i meant the other GDXJ on the 15min… (who’s on first?)
No, what’s on first…
no whats on second…
HA! Love it.
you mean the GDXJ version of the JDST i posted?
here it is (simplified somewhat)
hmmm .. ok.. but abc is higher degree ‘2’ so then begins ‘3’ up… no?
well its either 3.1 or C.1 that started today… assuming that was an abc correction wave we just had for 2weeks ( which has now done its dirty deed)
done dirt cheap
vroom vroom, huh? 🙂
anyone grabbing USO calls? still too early to tell.
Bght. a few calls this morning not USO but XLE. 🙂
I might grab some FCG calls or simply a few thousands shares
Miners update (refresh)
Hi LeChiffre. What is that neat looking software you are using?.
stockcharts.com
Thanks LeChiffre
BAA, way to go! finally…
Euro up, commodities up and…USTs up.
Some thing is, er, sorry, up.
New Post at 3:30 🙂