
Weekend Approaching
I wanted to write this late day report for 2 important reasons-
1. You’ve been filling up the comments section on the last report, so I thought you needed a fresh space to write in 🙂
2. Even thought things are still playing out pretty much as expected in certain areas, this is just a reminder about being able to sleep over the weekend.
Lets do a quick review…
‘Reduce risk’ does not mean our analysis is wrong, sell everything. SO far we do see a little improvement in GOLD SILVER & MINERS today . Reduce risk means that we should ask ourselves,
“CAN I SLEEP COMFORTABLY being heavily invested going into this weekend?”
This is just a reminder that Sunday night could see Gold surge $30 , or drop $30. We cannot say for a certainty, so please just position yourself in a way that you can be comfortable. Lets do a quick review.
.
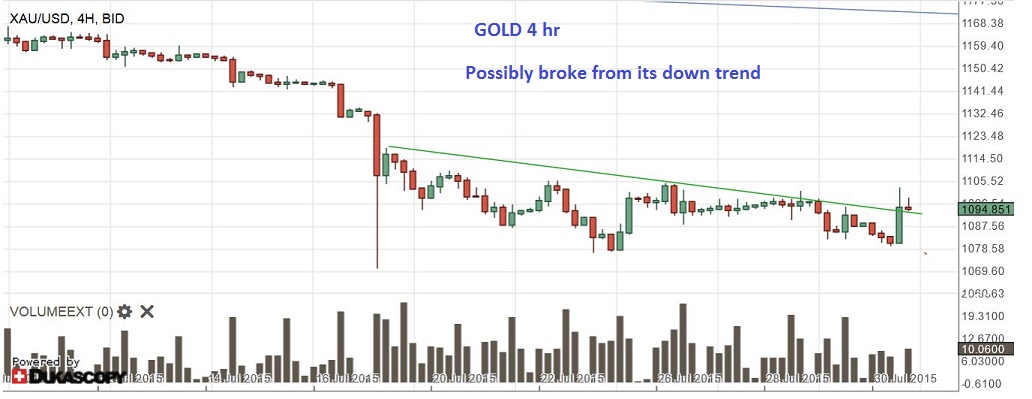
GOLDS 4 hr chart – that was a nice surge today. Possibly a break out if it holds.
GOLD 2 – Possible cup & handle , volume lighter as the handle dips down & forms.
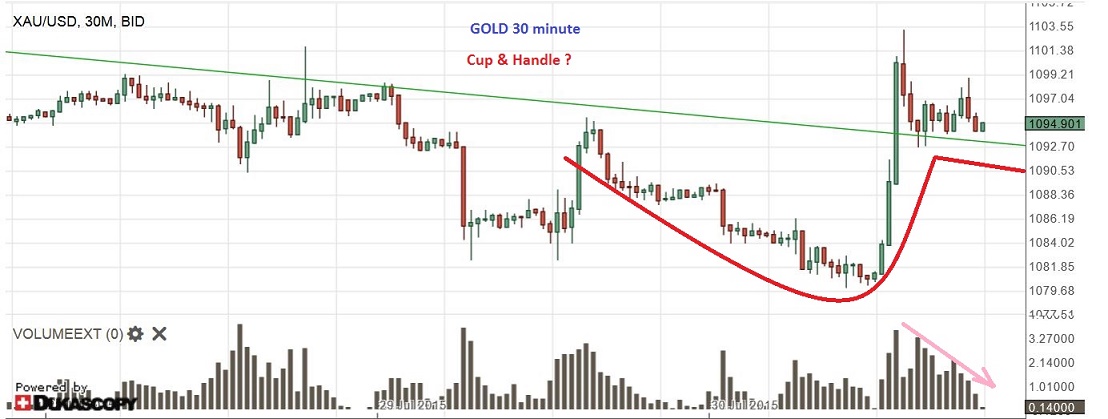
These are slightly bullish developments. I would have preferred to see GOLD close above $1100, above it’s 10sma.
.
This chart is Gold as of Thursday. Also we are expecting that day 34 was the low. If not and Gold was going to drop again to a new low Sunday, that would put Gold on day 40 Sunday. THAT IS VERY STRETCHED , so it becomes more likely that Gold is going to hold up. Maybe run higher next week. The C.O.T. is likely very Bullish again.
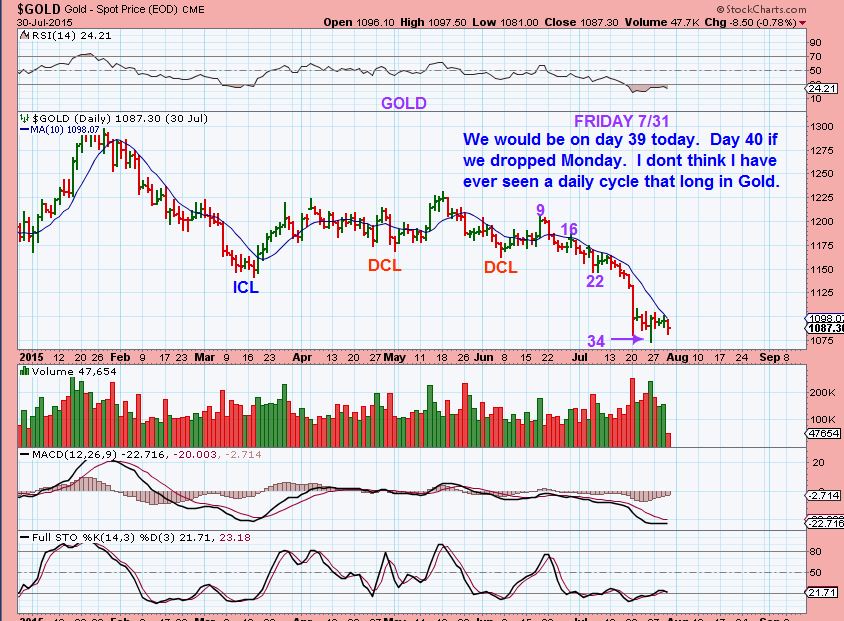
We are entering the weekend. I cannot say for certain that Gold wont smack down Sunday night and scare people. SO RISK MANAGEMENT is important. What can you handle? This is a personal choice & NOW – before the close, is the time to decide.
.
MINERS improved a little. This was our last chart in Thursdays report. We needed a surge over the 10sma .
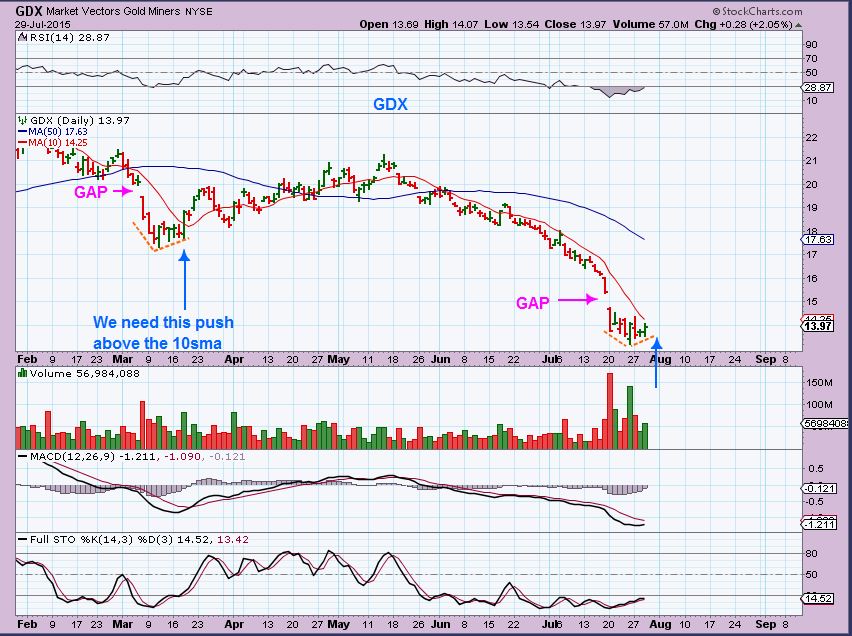
GDX now- Thats not a surge, but it’s at the 10sma. GDXJ has crossed above the 10sma at the time of writing.
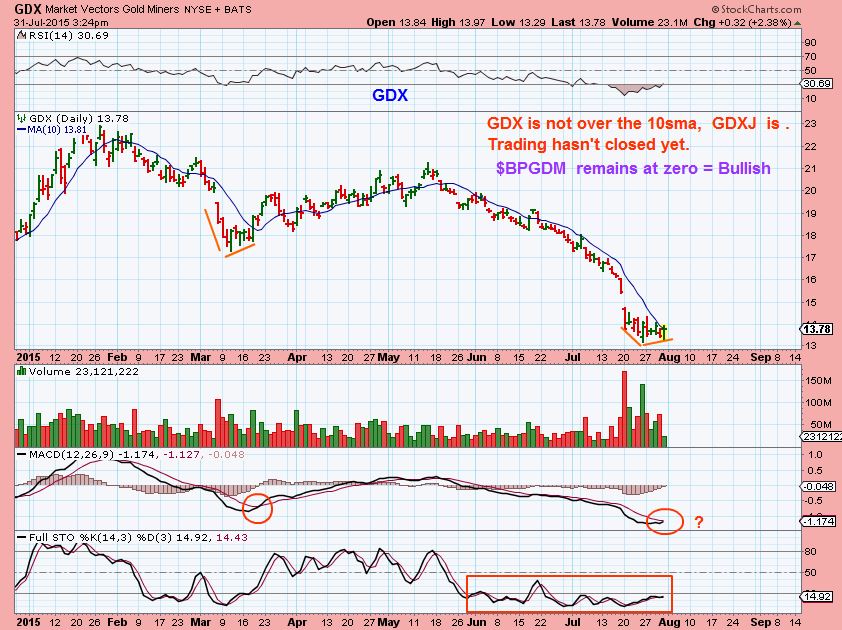
Personally, It doesn’t look like the Miners believe the move. They usually jump 7%- 10% on a day like this. JNUG & NUGT would be up 13to 20% . Right now , many miners are up 3-4%, a few are 7%. I checked the GDX: GLD and its slightly higher today, but very inconsequential at this point.
SO please think about it and adjust your account to your weekend comfort. We still have a very bullish set up, but this has been another week of no real action. Boredom can lead to excitement in one quick overnight move, but no one is 100% sure of which direction that will be in. A quick dip shake out in thin market trading Sunday night could happen. Day 34 lows makes sense in Gold, but also the call to adjust or reduce risk is a prudent call. Why?
Because there is always another trade. IF gold finally breaks free and goes higher, I expect much higher prices in the coming weeks. Many Miners will be very profitable, up 50% to 100% possibly. There is no need to feel we are missing the move, it actually hasn’t really even started yet.
Have a great weekend and thanks for being here!
~ALEX
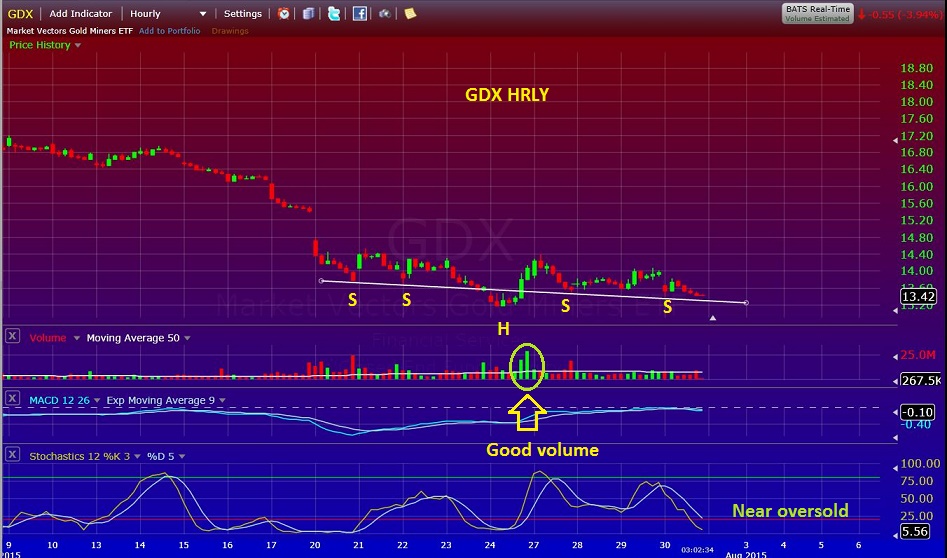
Forgot to add this from yesterday. INVERSE HEAD AND DOUBLE SHOULDER


good advices Alex. Thank you!
watching the EOD action like an hawk
Me too 🙂
Well said my friend.,,,,
Hi Frank! Nice to hear from you 🙂
Frank, you can tell by the time stamp on our comments that I said hello first, but you know that Maria…she just cuts right in between and interrupts : )
LMAO!!! Some things never change .. aye Frank? ;o)
Great, once an hr goes by they round it off, I just lost my proof 🙂
your lips r movin… but all i hear is blah blah blah…….
I assume I am the guy on the left ; )
hey daddy!
Mama bear & Alex.. I’m coming into the modern world … S L O W L Y …
S L O W L Y …
Your posting pictures and everything. Really coming up to speed fast!
By the way, I added a chart from yesterday after I released this and proof read it. Its the last chart ( purple one) In case some missed it. You can just scroll up from here.
look at the volume!
Thanks Alex. You really do a great job.
Appreciate that Carl
A note to Canadians. We are closed on Monday and everyone else is open, so there’s an additional factor consider. I took some of the table for this reason.
Thanks Alex. I’m in light so I’ll take Monday as it comes. As you say if it is going to run, there is plenty of time.
I stayed in too ( Thats my comfort level with this set up ) but I did scalp a little off of the table.
Hey- I just noticed that that 10sma on GOLD dropped and now we did close over the 10sma on GOLD , GLD, SILVER and GDXJ .
Thats a bit more encouraging.
And just look at SLV
COT (gold) becomes most extreme since 2001 bear lows, surpassing the July 2013 low
The COT is crazy good right now.
They are smart money and are almost never wrong at turning points
YAY! can’t wait for next week. (refresh)
Lol
All of a sudden, after looking at that C.O.T. reading, my “Comfort level’ feels a little too light right now. Funny how that works.
Alex, how much is the usual time lag between bottom of COT and first impulse moves in price.
Is there a regular pattern of correlation?
Actually, going from Memory, no lag time.
I have seen the low come in at a steep sell off and the C.O.T. comes in the week after at lows (because the report is as of Tuesday) . SO basically when we see THE LOWS, the following week COT looks lower, but it is a reflection of Tuesday of that week when the low came in.
By the way, I liked your E.W. chart posted yesterday
Thx,,
Maria’s sucked me into her Elliot web….. i gone overboard with some larger timeframe GDX EW charts today in the previous thread 🙂
actually they can be quite good fun to do, when you can make ordered sense out of apparent random noise.
;o)
LOL.. ohhhh Frenchie…
for you too Maria. (refresh)
HA!! alright!!
…. I will make room for them in my nightstand aka Maria’s Travel Fund ;o)
While it doesn’t seem correct to have a second bloodbath phase I wonder if gold might bounce to 1130 (the breakdown) and then turn back down for one more short cycle into an ICL at 1033.
Every gold bug and hedge fund is probably watching that level and I would think any remaining shorts would cover at that point. While the 50% Fib level (1080ish) should be support I get the feeling that 1033 is much stronger support with much better odds of launching a move capable of breaking back through 1130.
That would be a rather nasty scenario for both shorts and longs. But plausible.
That would fit if that small bear flag were labeled 4 of 5, and the break down labeled 5 od 5. Out of pocket now so cant show chart.
Just seen this M… from Elliot Wave International.
(They have that long term truncated 5, with a current AB correction in progress)
hmmm…
sooo.. if 5 is truncated… u no what that means… powerful counter move ahead ;o)
So this 5 is just A finishing… wow .. makes sense .. we are beginning B up… but watch out below when that C down takes place in a few years.. YIKES
whad’ya think then… possibly up to $1500ish then back down to $750ish?
well I’ll be gobsmacked… ding ding ding..give that man a beer .. just brilliant ace. ;o)
well… if EW Rules hold true anyway… right? using Fibs across time & price to arrive at the ‘cluster’ box ..
https://www.tradingview.com/x/aHgwCzaU/
hmm….velly intellesting.
Wonder what the $ would be up to if gold went back down to there.
120 DXY
thx Cas
You’re waves seem on in that rendidtion but that scenario seems unlikely to me. Up to 1500 and then back to 750 would mean that we are in a secular bear market to enter a bull corrective phase and not current bear market within a secular bull. Which are oppostites, so you’d have to make your higher level waves match also.
Fundamentally, I think we are past peak gold, so extended time periods below all-in cost of mining are unlikely, imo.
I take it you mean prices as low as $1000 unlikely to be seen again
No, I meant $750 as in referring to the last EW chart Maria drew that was discussed above. Currently, I think $1000 is definitely in play. Was only saying if we go high enough to confirm a bull market resumption (1500 would do that), I saw it unlikely to re-visit that far below 1K in the near future based on much larger wave (super, is that it?) structure. But only my opinion, which, unfortunately can be wrong at times. 🙂
i agree cason… that was just one idea.. nothing i felt anything much about…
after chatting w/ son today..i think a more shallow retrace is in order..esp following an extended wave 3….
like this .. perhaps..
Isnt this formation in a Bull Mkt?
We are in a Bull MKT for gold in my opinion, but a bear mkt correction currently. this doesnt fit a bear mkt correction, right?
huh?
i meant it for gold mnthly… we are in 4 right now… (it appears)
we just finished A … according to EWI …
of course.. add my disclaimer to that.. “im new at this and could be making it all up” .. ;o)
ps. “E often overshoots the trendline fast and temporarily ..” (read: stop run)
This is what I am seeing as mentioned above, but to $1400’s and then down to 800’s. But I dont share E.W., because it is always changing. I only see it in hindsight, after the fact. It actually has never been predictive enough for me.
Thats why im here & not still at Lara’s gaff 🙂
Lol…you just wanted to say fetish.. 😉
and why not?
😀
Ha.. no comment.
Yessss.. i know that joke. .sorry cant find the right comment to post to..on my cell.. lol..
Darn discus comment section..
the more i look at that count, the more I dont understand why A is truncated, then the next move for B – is down? Make more sense to me that what they have labeled as B – is really then terminus of A… ????? no??? Unless .. B is beginning as an irregular flat.. ahhh .. hmm i may have just answered my own question..
thanks for the chat ole chap .. smirk.
Thats the problem with EW… so many subjective interpretations.
As you say, an irregular flat…
Expanded flat currently in play, no?
if indeed wave 5 ended in nov, that presumably can be the only explanation for the lower price since then.
.. its probably worth pointing out the other valid wave 4 scenarios, lest we all get depressed ’bout $700 gold 🙂
That zigzag down is a worst case scenario, isnt it?
(sorry my current gold price only dated to Nov 14!)
but of course.. u know EW… there are 8 Trillion different scenarios that could play out. ;o)
i like it … very cool
tell ya wot.. id quite like a flat that went up to $2000 a couple of times before taking off on wave 5 trip to outer space.
we could milk that one for all it was worth
allllllso .. IF indeed a primary 4 wave is in progress & it is following an “extended” wave 3 — thennn .. the retracement would most likely be shallow…ie. 38.2% which also obeys the law of alternation – since 2 appears to be an impulse – so 4 should be a flat. … correct? ;o)
sooo.. I pick your GREEN scenario… .
Yow.. that is some degree-level EW boffinism your hitting me with there.
If you said that in a cute Kiwi accent, you could pass for li’l Lara 🙂
but i do vaguely recall the alternating ‘law’..
do you have 2nd wave count for 1980 to 1999?
hmm…all i got outta that was…my voice isnt cute…
LOL!!
which in fact .. it is..;)
… or so im told … 😉
alas, until you start making video reports we shall never know…
:o)
…but there is no reason to doubt you.
so we’ll let you be cute accented
well then… i would also like to be 2″ taller … annnnd … 10 yrs younger ;o)
i enjoyed knockn around ideas today….thank u..son
yes a good larf it was
catchyou later
I see the Purple as currently possible using some of my methods, but the “C” is not as deep as you have shown. Not syre if it needs to be by your methods. I’ have it at $800’s
However, I’d have the run up with 5 much higher
it was just a generic zigzag using Maria’s $700 chart target.
maybe just as likely to flatten out like that 1980-1999 correction?
and the 5… just an arbitrary position… i couldnt get any higher space on the chart!
i guess when you look at it like this, 5 doesnt look truncated..it basically matches 1. This is another scenerio I had — as a 4 wave extension. https://www.tradingview.com/x/PwizxNKC/
yup seems reasonable… think i had something vaguely similar in one of the GDX charts in the previous comments.. (with the expanding 3rd wave?)
I can follow the unboxed pink numbers 12345, but not any of the lower case roman numerals.
what waves are they referring to?
sorry …should have erased those…the blue is just me counting the subwaves..
ps. i also use the ‘automated’ EW feature at times just to check to see what it counts..mostly unreliable, but sometimes it helps w/ learning.
okeedoke
just noticed, with that EWI chart… the 5 looks particularly short coz they havent used the log scale.
it wouldve helped
Hi Alex. I find it strange that you talk about planning for weekend sleep, when the U.S. Market had closed before this report was sent
We received it at UK 10 pm ??? Confused
Eifion
This report was started at 3 p.m. and it took a 1/2 hr to write it up & draw charts.
I then sent it out a little after 3:30 p.m. while the US markets were open.
My email auto alert has been slightly delayed lately, so you can see that I put in the ‘comments section’ of the last report that I had a new update.
Then the alert came through at 3:44 p.m. Eastern time. I know many got it, because they responded in the comments section before the market closed.
See the attached email alert ( I am signed up so I know if the system is working)
.
.
i’m in UK, and i got it in time (20.44 GMT)
Ahhh… a Brit..that explains a lot. ;-).
cheeky monkey… what are ya suggesting..?
anyway, the yanks (hollywood at least) think we’re all serial killers, dont they?
Tee hee… 😉
I’m afraid in only have bad teeth and wear a bowler hat
Oh bollocks…… ;o)
now thats language i can understand.
Most people that I know here on the East Coast think of the UK and think of positive things like Lagavulin, Laphroaig, and ARDBEG 🙂
And U2
Ohh…And hugh grant…who could 4get him…luv his sappy chik fliks hhehe
I havehad 2 other people say that they werent getting the morning alerts for hrs later. They were just refreshing the page and saw my report. We looked into it and it ended up being the Email provider they were using in the UK. . They delivered my replies to that person late too 🙂
Yes..those alerts from discus have been wonky of late…. maybe just post a new comment right away ???
I did post a new comment too, but unfortunately not all are reading the comments in real time either. Twitter has never missed an alert, but then again, not all are on twitter.