
Searching For Clues
Wednesdays Fed Meeting went off without a hitch. Sometimes the following day can get a little volatile, so Lets look at some clues within the market moves and see if things look normal or sketchy
‘
SPX– bounced off of the 200sma and now has good follow through above the 50sma. I would expect a possible break above the recent highs
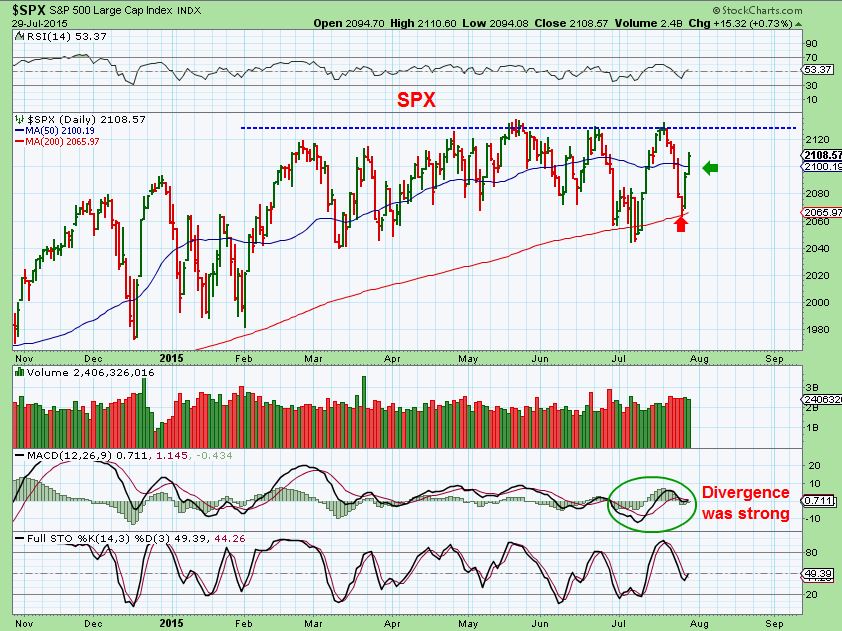
You cant help but notice that the markets have been basically going sideways all year. Will they break out here and just start a nice rally? Here is an interesting clue…
I think the markets are looking pretty good short term for a couple of reasons ( I’ll explain), but this is odd.
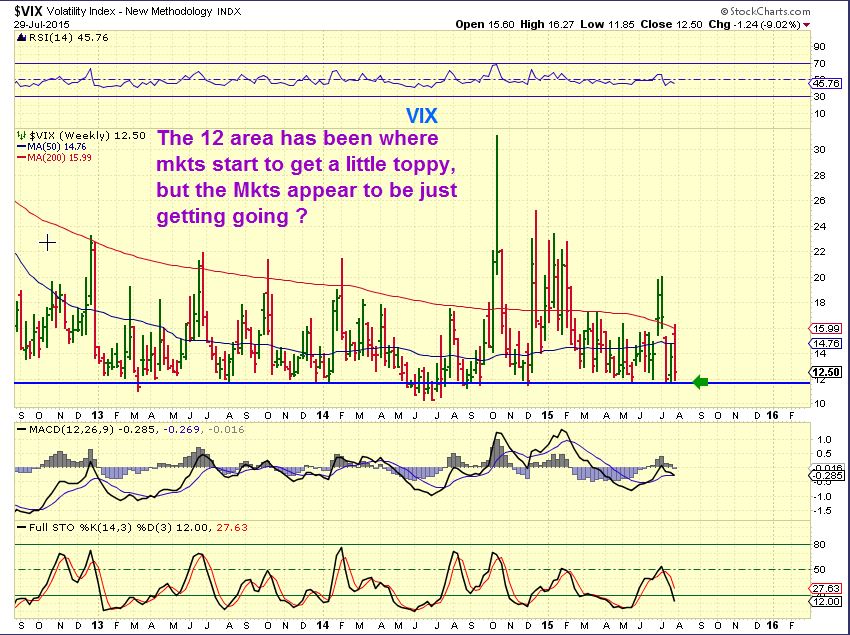
The VIX often gets to the 12 area and the markets get toppy. The Vix is already at the 12 area? Something to keep in mind going forward.
VIX – notice how the SPX reversed lower when the Vix hit 12 and reversed higher.

VIX 2 YR WKLY – This is just to point out that the 12 area has been fairly solid support.
This is why I surprisingly see short term strength in the markets. I have been pointing out the break down in the transports. Suddenly we had a recovery Tuesday, and I pointed that out Wednesday.
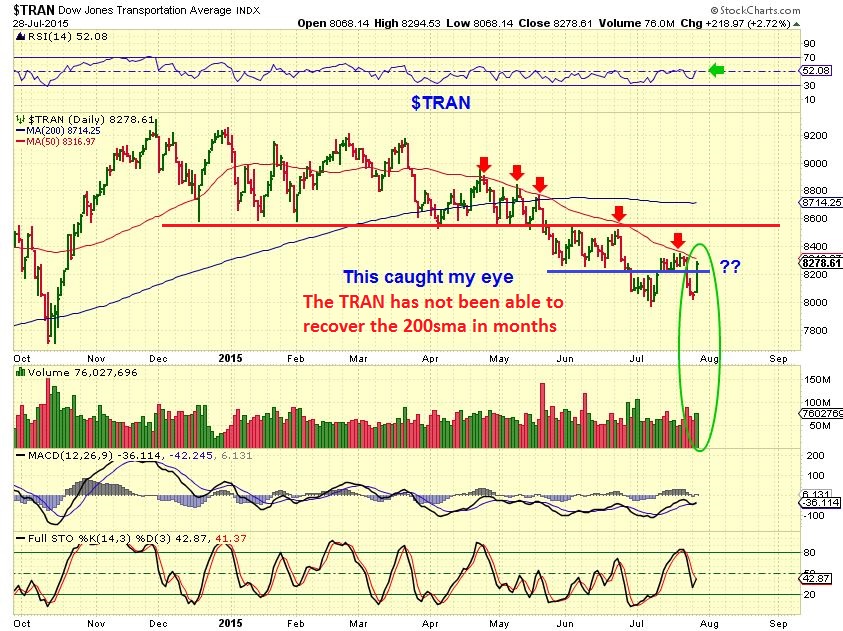
Fed Wednesday had further recovery. The blue line is the big test, but the TRAN broke a down trend line and regained the 50sma. That Blue Line is strong resistance however.
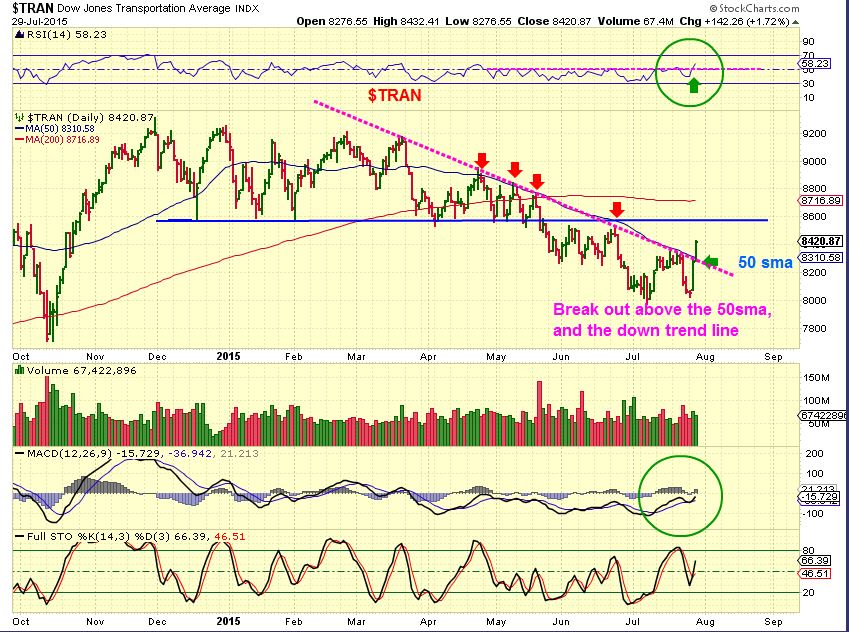
SO as I watch the markets, I am watching overhead resistance. Especially with the Vix at lows, I would keep an eye on the prior highs. We may just get a break to new highs and turn back down. For now- LONG IS STRONG.
.
USD- many think the reversal looked strong. SO far it is ‘internally’ weak. I will be watching for it to strengthen or roll over soon.
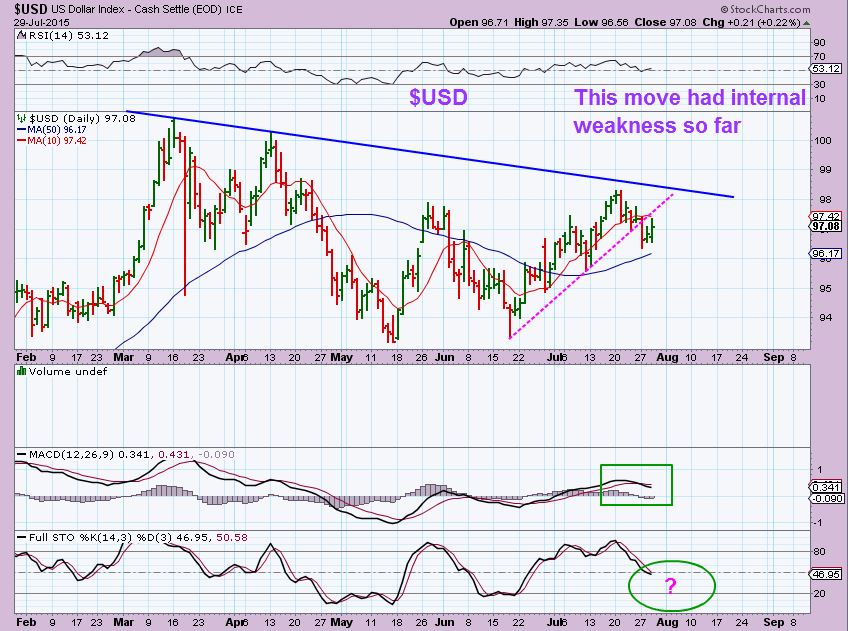
The CRB and Commodities like OIL , GOLD, SILVER, MINERS , etc were Green while the Dollar was Green too. Is this indicating that the Dollar is going to roll over for a bit? Possibly. Time will tell. Lets look at …
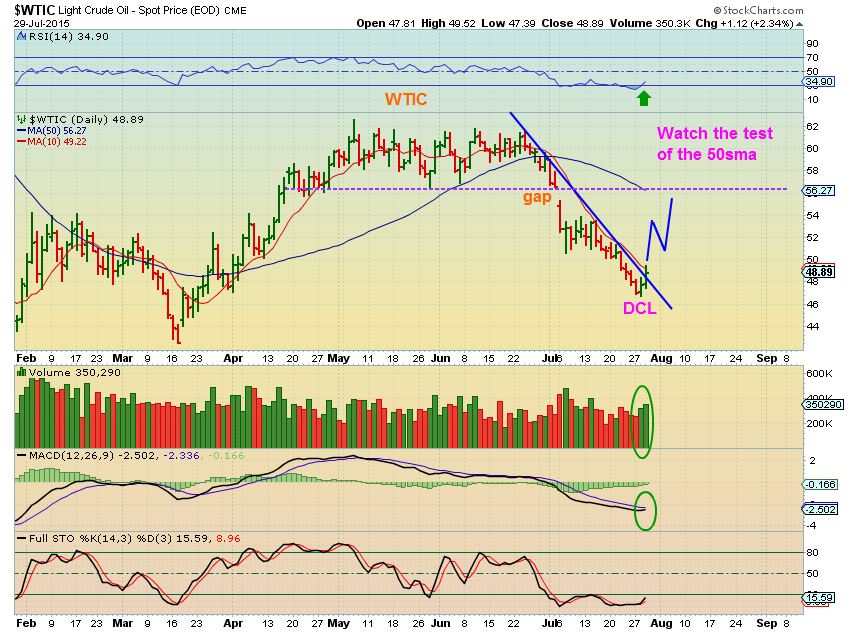
WTIC – I think we saw a DCL, and I have been expecting a “test” of the break down or the 50sma. All are aligned nicely.
GOLD SILVER & MINERS
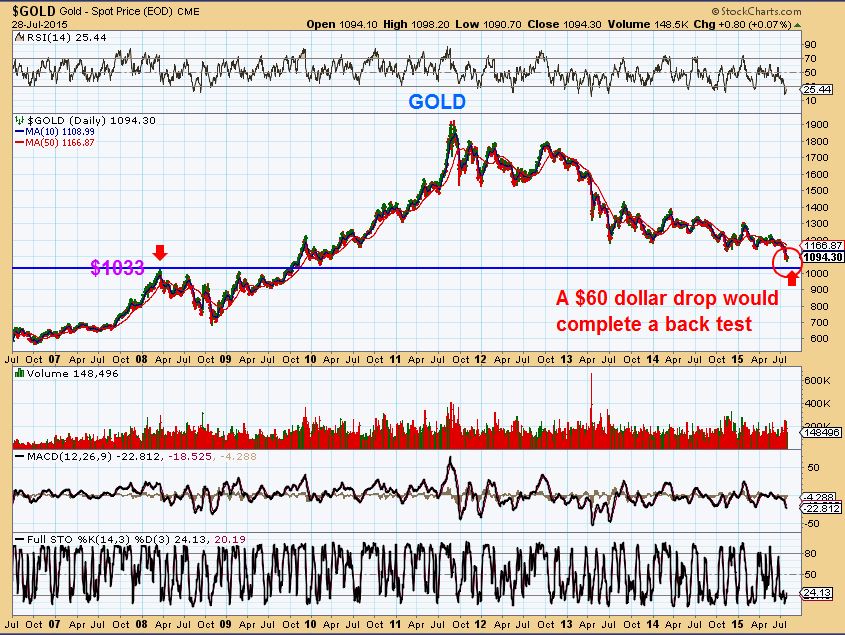
The precious metals held up well during Fed Wednesday too. I still want to be cautious, because we really dont have a confirmed ICL. All of the signs are there for an ICL, as mentioned in prior reports, but no one can rule out a small 4th daily cycle where we just drop fast and put in a final short daily cycle . I just want to re-post this chart as a reminder that STOPS should be used to preserve funds.
A 4th daily cycle could drop Gold to 1033 easily, even below $1000 for final lows. We have seen $50 down days in Gold at crash moments, so we need to just keep alert and expect the unexpected.
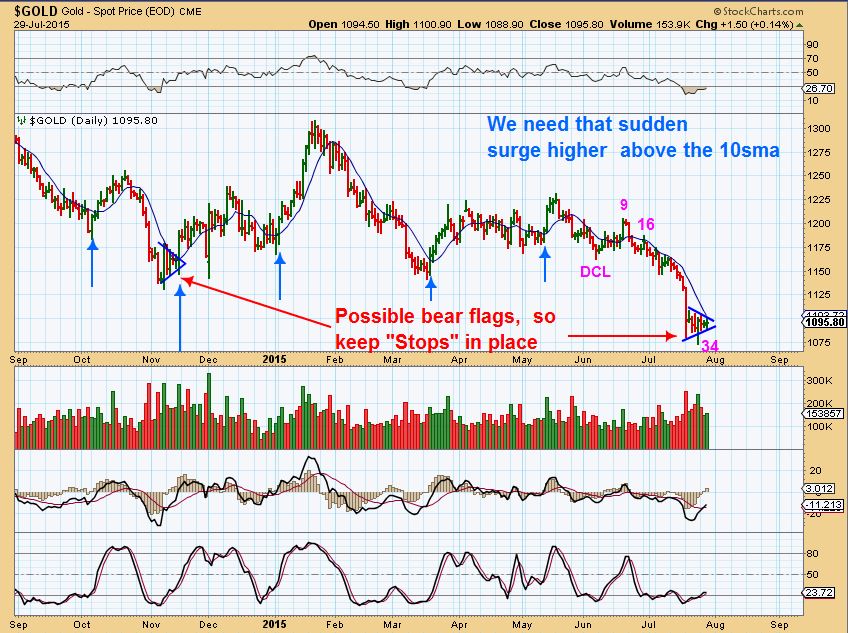
GOLD – so far we look to have a day 34 low. We need a surge higher soon, or we may have started a weak 4th daily cycle that will roll over. Nov looked like a bear flag & then it surged higher. We want that now.
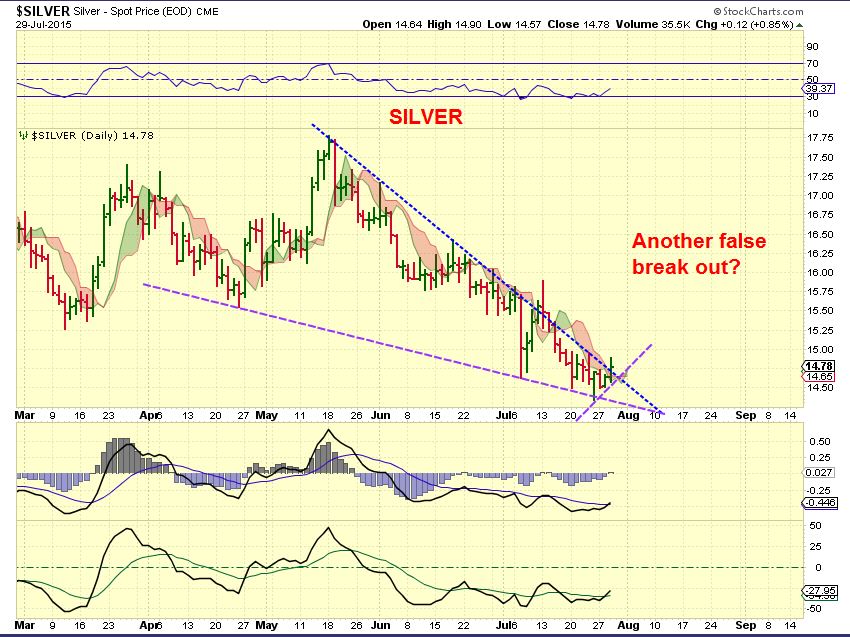
SILVER – breaking out? We need a surge here too (See last March Icl)
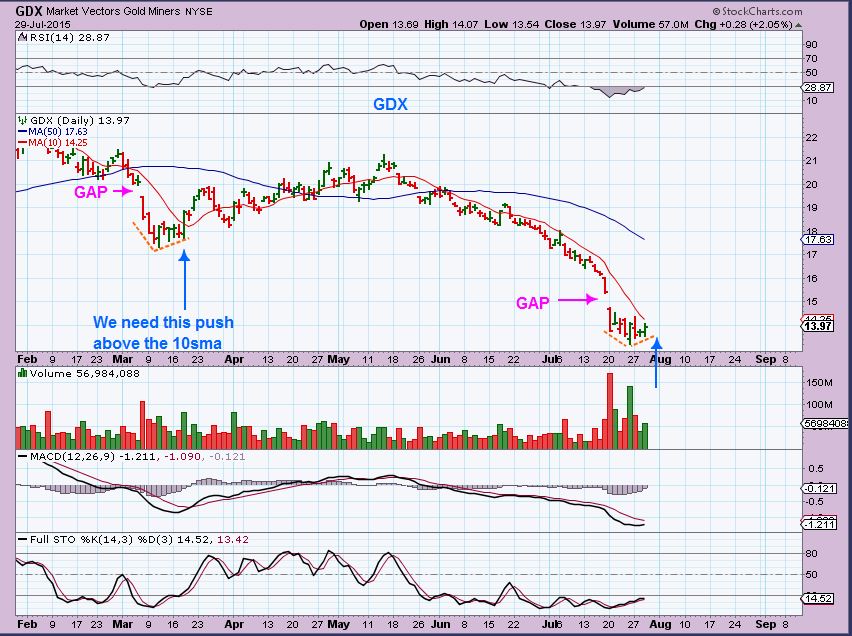
GDX – looks very similar to the Miners slow crawl at the ICL in March. It looked like a possible bear flag in March and then surged higher on day 5. We are on day 4 as of Thursday. Again, we need a surge higher soon.
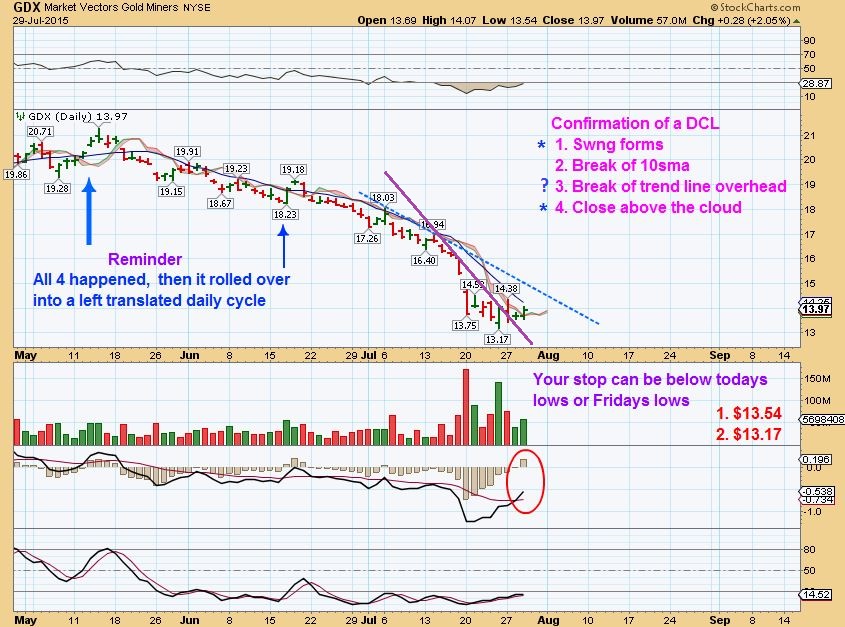
I use 4 or 5 signs of confirmation of a DCL. We only have 2 or 3 so far. TSI ( not shown) crossed upward, but that gives me false signals too often. Trendline..Blue one or Magenta?
I gathered these charts and wrote most of this report late Wednesday night. Overnight we see that GOLD & SILVER were smacked down a bit. Gold went down $10 and Silver was down about $0.19ish. They havent broken any lows, but this keeps us on guard for further selling. We really would like to see a surge higher today or tomorrow, before going into the weekend.
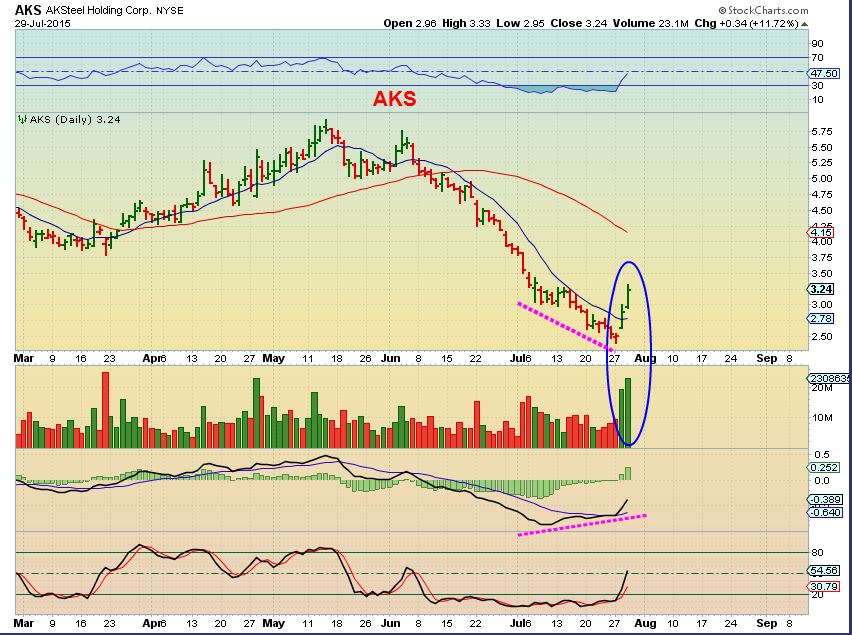
With the DOLLAR green, Many beaten down commodity stocks started to look good recently. Steel stocks have broken out strongly with volume X,AKS, STLD, and Aluminum stocks are starting to do the same see CENX, AA, NOR . Are they leading the way? Will Metals & Miners follow that course?
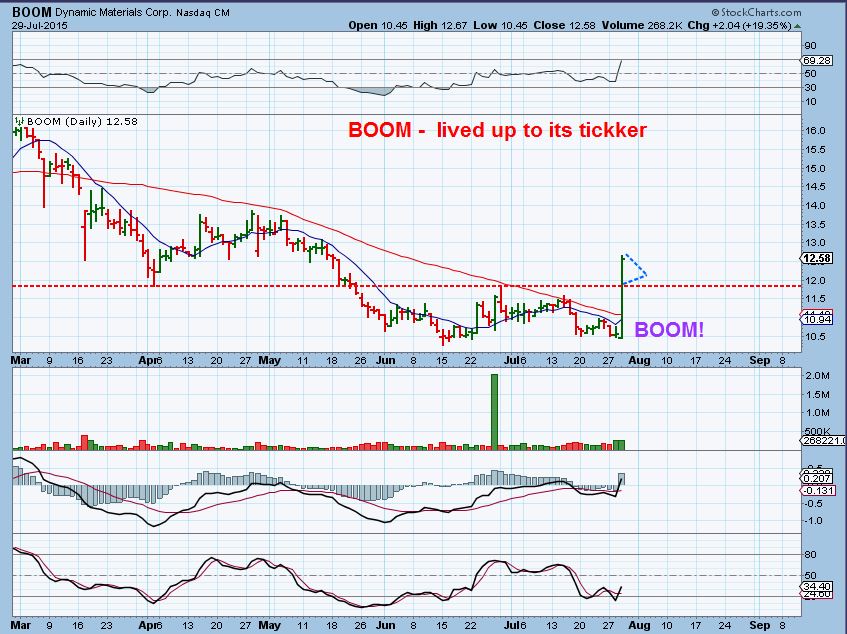
It looks promising when you look at VALE, CLF, BOOM and a few others too. They seem to be getting that short covering push higher too. Will there be follow through?
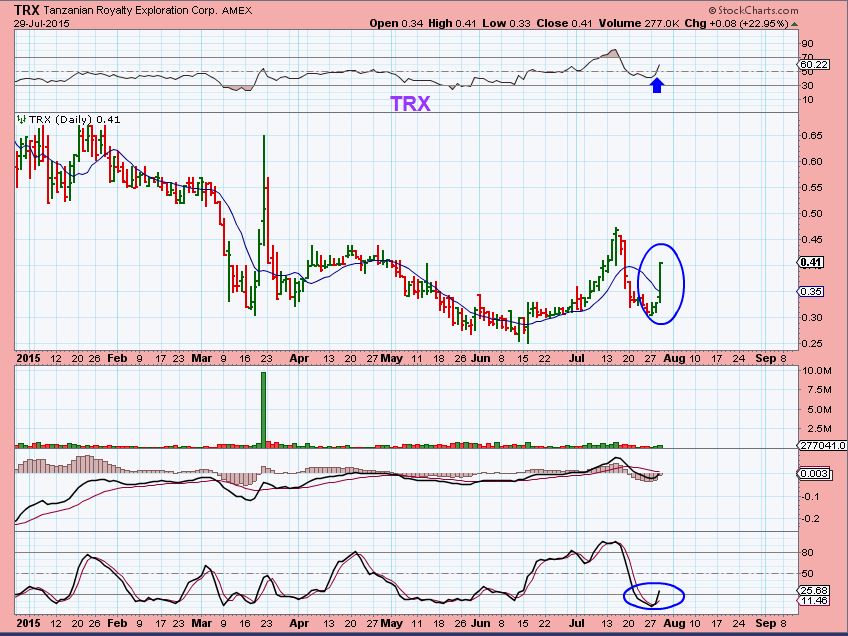
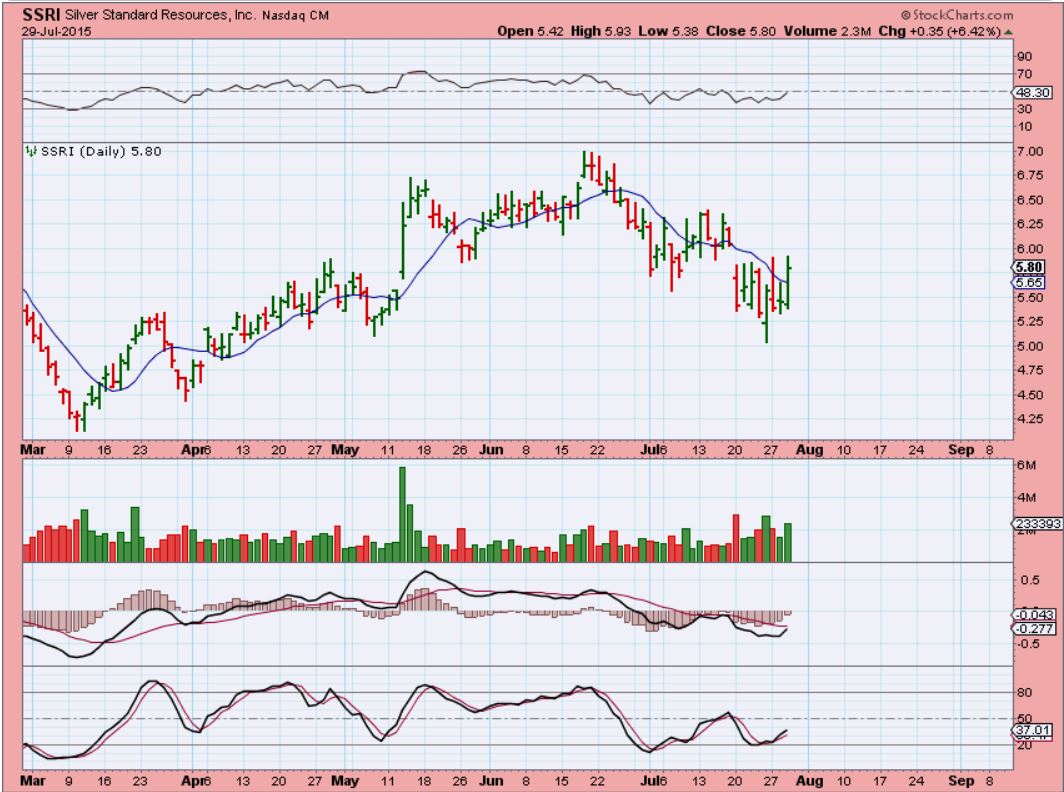
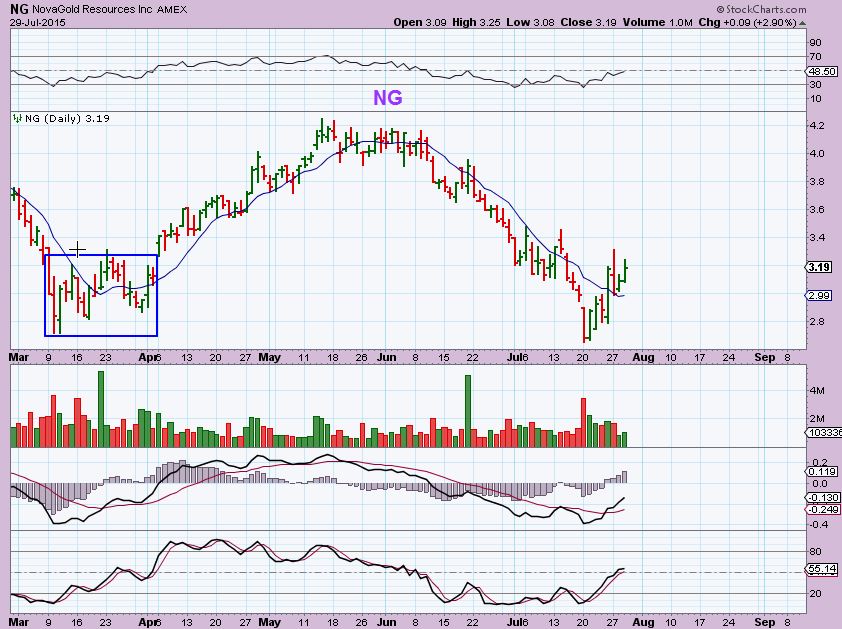
It is encouraging to see some of the miners looking like they are trying to break higher also. It is encouraging, but not enough at this point. We want to see that burst higher in the GDX & GDXJ to know that things are healthy through out the sector. We need to see more from the miners soon. See TRX, SSRI, AKG, NG .
So stay alert if you have taken a position and honor your stops. We still need confirmation and more follow through before we can say whether we have an ICL or not. If we only have a DCL and we are in a 4th daily cycle…it will roll over. I will repeat that this sell off in Metals & Miners has all of the hallmarks of an ICL, but we need further proof. If an ICL is in, we should get a nice relief rally very soon and the Miners will be a very good trade %-Wise. It is a low risk set up at this point, if your stops are in place. Bottoms are NOT easy to buy & hold, and so far we are still forming a bottom. A break of the lows would likely be bearish at this point in time.
~ALEX


We really don’t have confirmation of a DCL yet either. Besides a swing gold would need to break the cycle down trend line to confirm the DCL. So if gold gets hit with another attack it would stretch the current daily cycle. This has been a problem lately in that the market has figured out how to run cycle traders stops by creating false DCL’s and then running the lows and stretching the cycles.
The shake out fuse has been lit. We could blast off here ( He said hands folded in prayer)
Hehee.. stand well back!
Well so far, I can picture that rocket that takes off, flies sideways for a while, and then blows up in your face 🙂
Experimental V2 disaster, or Saturn 5 to the moon….
Refresh for a chart of what I was looking at. I was wrong on the stop run, the lows were not broken…it was more of a “test” of last nights take down.
We need upside follow through now . Clickable chart
.
Silver seems to be pulling away nicely
Nice- I hadn’t even noticed.
Silver & Miners moving higher would be nice. Add to that GDX: GLD
I find one of the best psychological ‘objectifiers’ as to whether i should possibly buy a low without losing sleep, is to look at the inverse ETFs, and decide whether i would do the opposite, and sell a peak extreme (if i owned it).
I could be wrong of course, but just looking at this DUST MA oscillator (3 day/4 years & 1 day/2 years charts), suggests this thing has peaked good & proper, and is on its way down before it goes up again.
Super point, thank you.
Worth noting too DUST support has been 12 or 15 last few years
That is great , almost fool proof.
I do something similar with JDST and DUST, and it calls tops in those too. My problem is when I go back to test it, but it doesnt eliminate that false low that came OCT 2014. That had a low C.O.T. and a few other ICL markings to it too. Looking at a chart of GDX ,GDXJ or $GOLD you’ll see what I mean, it Bear Flagged and my DUST / JDST said a top was in. (Yours does too) . It comes as a double top in my JDST indicator ( yours too).
It still is a very good visual aid
In case any one isnt aware of the inverse trick you can do at stockcharts.com….
if you want the inverse chart of any of any stock/commodity/ETF/spot, just type in $ONE:X, where X is the usual name you would type.
eg inverse chart of GDX is $ONE:GDX
inverse chart of $GOLD is $ONE:$GOLD
and so on.
puts a whole different psychological perspective on bottoms!
I forgot about that actually. Nice, thx
Brilliant, thank you
Is there a $ONE:FED?
“Unable to find Data for $ONE:FED” 🙂
And that’s one nasty exception, for sure.
I hated that October move.
I just loaded up further pre-mkt on that 8:30 a.m. shake out move, will raise stops a little today
So, CF, you’re searching for clues. If you find one would you please hand it in to the Eccles Building as they have no…?
Hmmm, I can email it, but I cant hand it over. I try to stay away from Washington D.C. as much as possible, unless its a field trip for educational purposes 🙂
Pretty sharp drop in Miners, right back to yesterdays lows so far. Volume pretty heavy too.
Still think selling what i have bought so far would be akin to adding at an extreme top
Stops in but if this does not recover after the first hour I’ll throw in the towel and wait for the next DC. If this is the next DC/?IC then as you’ve said we’ve all ready wasted 4-5d of the DC going nowhere. 🙁
Nice moves in X & AKS – whether its short covering or not.
Alex, I know we tend to see what we want but have you noted any pattern when GDXJ and SLV hold up better than GDX–like today?
Just off the top of my head I have noted that GDX did NOT break to new lows last Dec & MArch ( The Nov lows held) and GDXJ did break to new lows both times.
This time around , GDX broke down much further below the MArch ICL . GDXJ held up better.
SO I guess I can say, yes, I’ve noticed GDXJ is holding up better.
Believe it or not –
GDXJ is pushing above the 10sma right now.
GDX is still a tad below it.
GDXJ holding up better than GDX
$SILVER holding up better than $GOLD
hope this bodes well
Thanks! btw…lightened up this am a bit which is why we popped later. no worries…you can thank me later.:-)
yay! go gold
Is this a sign? Yahoo Finance headlines today – refresh
.
We have $700 or even $350 Gold.
.
2 Charts before & after
.
… so H ..O..T
Yeah, its about 94 degrees here this morning. How did you know that?? 🙂
😉 nice… I like it hot.
…. much prefer that over the blizzards and power outages we get….
we’re so close. I’ve combined some long term charts and ratio on Gold and miners
https://www.evernote.com/shard/s5/sh/fd47bd4e-c835-4011-bb62-ad1add9b53ec/9eae9645d8b74876
I like that SPY:GDX monthly
Interesting that OCTOBER 2014 was one of the highs. Thats that GDX false low that I’ve been crying about .
thought so too.
If it was a stock you’ll know it has to come down from its cloud.
also what a volume on GDX this past week…. incredible.
Agree, thats why I liked it…it just looked so obvious , right.
Thanks for sharing. I was chatting GDX:GOLD last night but didn’t get the chance the post.
This dollar strength looks rather ominous. Looks like it wants to break out above that downtrend line.
CDE is puking its brain again….
It doesn’t look particularly promising here but selling in several PM stocks appears to have dried up – EXK, IAG, MUX, RIC, GORO, etc. NG getting hit today, no news posted. Maybe this is a test of the lows (hopefully ).
Heads up. A potential reversal for AKS.
Should we all just buy NUGT at 3.30 and sell at 3.50 and keep repeating?
It beats that seasick feeling that I am experiencing 🙂
Wondered the same with JNUG, but about 8, sell 8.8, about the same %wise. NUGT is so low, it would be better off going ahead and splitting.
I personally do not like the fact that GDX is not doing better than GLD, because I cant get that GDX:GLD to break higher . I’d like to see that break the 10sma
here’s the chart for everyone. (refresh)
Yes, thats the one , and it just looks like it’s being rejected at the 10sma again 🙁
Thx for posting it
i see this as a possible pattern emerging https://www.tradingview.com/x/bT0ByAm7/
thoughts anyone….?
I dont know , but I’d be alright with that 🙂
Where is our Elliot wave guy?
ps. the red arrow going upward…is just arbitrary to show next impulse wave up
With my revived EW ‘knowledge’ (haha)…I think… from the peak, it is a wave 4 correction, as you indicate.
But the final C wave down will be five wave structure, not a abc zigzag.
Simple ABC zigzag = 5,3,5 pattern
Expanding ABC flat = 3,3,5 pattern
Lol..go man go…
RIC is waking up finally.
Shorted JNK via DEC puts. (refresh for chart)
Why cant they all be like PGLC
oh my! I didn’t even know this one.
🙂
Time to short STX? (refresh)
earnings tomorrow…. I’d wait
actually, I bought a couple of Puts (earnings play)
The best thing for us to do is to turn off our computers for a week or two – rubbernecking at the carnage on the side of the road isn’t helping
Off to the gym!
That feels like some pretty good advice ( just set a stop if you hold a position and be done with it)
Setting a stop here is tough. You know as soon as you set your stop at Fridays lows, the stop will get run and then the big bounce.
Amen!
The move down in Miners makes me feel like the move up in Gold wasnt real.
I’m out of positions that I bought earlier, still holding an initial starter position, still honoring stops if we break lows.
This bouncing around at these lows is a bit boring!!
Thanks for sharing.
Alex, thinking through all of this – really had lots of signs this was a deep low. But if it rolls over into a 4th DCL, that would make the signals at the next bottom even that more pronounced. If it bounces here, may just be another BMR. If it rolls over, it may finally slay the best. Idk just thinking out loud.
Psychology 101 : (Refresh)
IF I wasnt in this, I’d probably try buying it. Since I own some, I feel like its going to break down to new lows.
.
I bought anyway. :}
o mann.. i was just thinking of buying… i know this is buttugly wave .. but it does work as a possibility
watcha think?
https://www.tradingview.com/x/RrFOzGUd/
Remember Maria, I dont know all the nuances of E.W., but doesn’t (3) have to go higher than (1)?
Just asking.
pfff…dont u know by now i make up my own rules? lol… actually – it’s ABC correction which has 5 waves..i probably labeled it wrong & the REAL EW guys would slice&dice me…but I’m feelin it… ;o)
That IS an UGLY wave Maria.
If I was not already in a 1/2 position already I would add before the close today. Just my 2 cents worth.
Feels and looks like a wave 2 to me. Risking under 2% (stop under 13.17 GDX) is worth a shot imho.
Stochs confirming.
lol… wave 2? Can u show me…? pleeeeeeese?
just my 2cents Maria, but i understand the wave in question to be something like this…..
wow… yours looks so much better than mine… ha ha
ok .. i get it.. thank u. :o)
which is technically what i thought .. that zigzag was a 2 .. i just (for now) count every wave in between (like using my fingers) AND separate them across time like this …
https://www.tradingview.com/x/iQJfI7ih/
I’m horrendous at labeling…but I understand the concept…. thank u for your input SOG. ;o)
Its pretty basic labelling, but every impulse (1,3,5) has five numbered waves, and every correction (2,4) has the three ABC waves.
Each impulse (A,C) of the correction though, has its own five numbered waves
The correction of the correction (B), has its own three ABC waves.
I understand the correction waves can get a little esoteric at times, with five wave triangles (ABCDE) and ‘running flats’ etc.
btw Maria,, do you subscribe to Lara?
I did for a few months, but the EW stuff seems a bit hit & miss.
Its ok filling in patterns after the fact.
She does a great little pdf on the subject though.
well i don’t subscribe to her pay service, but I do receive her video updates. she’s very good.. fast though. I’m still on the fence actually re: EW .. some days I am utterly captivated, exhilarated & enthralled watching the minute candles paint the perfect wave pattern before my very eyes, then other days I’m just downright aggravated. Granted, it’s only been 3 mnths since I began my quest & the past two mnths I’ve not had much free time to myself, sooo I’m tryn not to be too hasty here. ;o)
I appreciate your input.
Thank you very much SOG ;o)
I just did a quick look at her ebook, and i don’t think that C wave is quite done yet.
Needs to zigzag below the A wave price level.
Then get ready for the 3rd of the 3rd ‘moneywave’ impulse 🙂
Looks like AB=CD with a bull flag in the middle.IMHO
I am starting to build a position in Oil via USO Calls with a stop below 15.64.
The Risk Reward is excellent. IMHO
Comments ?
Euro could be picking up ie US$ could be dropping
The USD will definitely have a factor in this trade.
Could not agree more JDWM. 🙂
UUP LOOKS WEAK IF YOU ASK ME
That would be Positive for Commodities correct ?
I would think so – lately many things haven’t exactly acted as expected though
LOL !!! Aint that the truth !
I hope you’re right. Maybe I top ticked it with my comment earlier. 🙂
Look at that beautiful double bottom 28% bounce. REN (refresh)
Nice catch, looks just like April , huh?
Right!
Funny, REN was one of the very last energy stocks to take off during the last rally. I would have expected the same lag response. EOG was one of the first, up 8% from the bottom. You think the bottom is in?
GURE Cup and Handle? Where does the handle end usually?
Same double bottom as USO. 🙂
Right, USO same double bottom. What’s the difference between USO and USOIL?
mannn.. bunch of beautiful bottom luvers here…. 😉
They are so nice to look at! 😉
…ha ha.. that reminds me of a song…
https://youtu.be/7iYpboTjtoQ
..is it bad that i remember every single word of that song? LOL …
IHS on TLT CF June/July?
TLT respected the 10sma, that looked good , and yes, possible inverse H&S
I agree FWIW…..with the Australia Dollar not confirming this potential bounce I cashed out premarket this morning. doing better following you with the S & P 500….looks good to buy any dips going into mid August. with gold, certainly a bounce is coming but perhaps a bit later imo…..watched larry Williams mid year forecast today…..possible bounce coming in mid August…we’ll see. also, US dollar is concerning as one more wave up may go to 100-102.
I bought JNUG at 8.03 for one last chance tomorrow. If we open down, I’ll sell immediately. In fact, even if we have a good day, I’ll likely sell anyway before weekend.
CDE 7 cents from all time lows. My stop is only a few cents away.
Real issue is calls. Even if/when I stop out tomorrow, will be a non insignificant drawdown.
Take a look at the attached patterns. They are all at meaningful lows in GDX. They are all very similar to NOW. If I look at NUGT, it looks like we are going lower by $3.50, which of course would mean the end of the fund. What do you think?
Why do you think we have a bottom in GDX, but NUGT is going to be wiped out?
I’m just pointing out that the two don’t concur. The current pattern in GDX should move higer IF it takes after the other 3. The day after each of the other 3 we had big moves higher in GDX. Conversely, the NUGT pattern looks the same as it did on 7-9-15. Of course I am looking at a 15min chart in NUGT.
I heard somewhere, that you shouldnt chart by the leveraged ETFs, but take your cue from the 1x equivalent.
If GDX (GDM) & NUGT say opposite things, then its likely NUGT is lying.
Thats due to decay on the leveraged ETFs. Keep in mind, I was talking about a different time frame (15min) for NUGT vs (D) for GDX.
That’s what I believe. I don’t think 3X funds can be reliably charted.
I think this is case of how doing TA on the leveraged funds can be misleading. I’d say do the projection on GDX and then apply 3X the percentage change (as a rough guess, probably a bit worse) to get the NUGT target. I’d say it’s about 1.20, but that’s just a rough estimate. Real nasty, no doubt.
wouldnt they just do a reverse split?
I have been expecting a reverse split on NUGT. It already did on 10:1 split.
thats pretty cool BTW….all 4 bottoms at once… 😉
What’s the chance there’s a lot of stops (for shorts) just sitting above $1100? Just need a little bit more…
There is that chance.
I am watching $1100 too, because if we close there today ( C’MON- LETS DO IT) it will be the first time that GOLD closes above the 10sma since Mid June.
We would also get a green weekly candle.
Lots of pops over the 10sma, but not HUI/XAU as yet
NUGT needs to get over $3.55 the upper trend line. 15min chart
true to that. I have a buy order ready 🙂
NUGT getting there.
DISAPPOINTING
Yeah, not pretty. Don’t like the way the dollar appears to be getting its footing here either after just missing taking out the recent low.
Of course my comment kills the dollar rally. The magic touch Or the Costanza touch. 🙂 Feels like that lately.
Costanza! Nice
Alex, any thoughts so far? I’ll wait until the close but GC not holding onto it’s gains doesn’t look promising. Miners not helping much either. 🙁
EGO!
way to go!
GG as well,
who CF? yeah .. I know right?
GDX 5-minute chart. Flagging, something has got to give soon.
NUGT buy order at VWAP. ($3.43)
Careful, we could be flagging for another leg lower. We need to see a trend break.
yes… i see it at a zig zag correction as well https://www.tradingview.com/x/6Rn7ecSJ/
What does EW say about XAUUSD?
it says .. YO MARIA .. u suk at this.. ha! no .. actually Gold is way too complicated for me … but i will show u what i was working on last night… I have a couple different scenerios spinning in the wheelhouse… perhaps better discussed afterhours… …… annnnd with a glass of wine.. ahemm… i meant koolaid ;o) WHO is typing… sheeze…
Here M, you piqued my interest again in a bit of the old EW.
So what you make of this GDX one?
Critiques welcomed from anyone who gives a damn about such matters.
very cool… i see u ‘appropriately’ show the divergence btwn 3&5… GOLD star 4 u ;o) (pun intended)
im having trouble seeing that 5 truncated… tho…on mine.. i sometimes see the B position as the terminus of 5. ??
Yeah i know what you mean.. i had this one too as an alternative.
Wasn’t sure about that expanding 3rd wave.. but i spose you could still have the more parallel 3rd and the bigger adcde 4th?
Waves 1 & 5 are very similar diagonals.
Actually the momentum channels fit pretty nice with a big triangle 4th and a diagonal 5th
Better version
GDX will conquer its 10MA ($13.81 – so close)
see what i mean about watching the waves paint…. so cool ..
https://www.tradingview.com/x/ujcYE2hh/
EGO!!!!
BAA is lagging…. come on can’t be the black sheep (BAA, BAA have you any wool?)
REXX, anyone? too early to tell. But AUGUST is strong for oil. something is cooking
Im not convinced we will see any move higher in oil until WTI gets to 44
yep. next week should be interesting.
BULLISH percent on Energy is really low. (refresh)
GDX:GLD the ratio is at its 10MA (refresh)
GDX, trying to get above the 10sma. MACD crossing, divergence in RSI. Subtle…….refresh. blue lines are expected targets
just got an alert from Market watch – July ends as Gold worst month in 2 years.
>BULLISH
Dollar has retraced the whole steep drop this A.M. Good news is that gold/miners minimally affected. Now what?
(BTW does anybody else get a strange/random re-arrangement of the comments when you refresh?)
You can sort – see drop down above and to right of comments box
Ah, yep, I overlooked that. Thanks much.
holy inverse H&S… across the board… do my eyes deceive me?
https://www.tradingview.com/x/KrKf9Huo/
I see I see
look at silver painting that 2 .. how lowwwww will she go? up to 99%? https://www.tradingview.com/x/s9e9VKzQ/
Gold too
Alex, Thank you! I think I’ve finally learned an important lesson. Markets closed on Monday in Canada, going on vacation and worried about a Sunday nite raid…yup I’m out (to decrease risk) and with a tad more than I started with. As you said there’s always another trade. If miners take off then I’ll see you all at the next DC station. Enjoy the weekend all!
NEW REPORT
TWITTER TWEETED IT- BUT AUTO ALERT by DISQUS DIDNT AGAIN : (