Quick update:
I just want to throw a quick update out there. We all know that the mrkets can be devious and tricky and throw us a curve, so at times like this, I want to add a cautionary note.
To start I will say that things are actually playing out exactly as I wrote in the Tuesday/ Wednesday reports.
We are LATE in the timing for a low, price is lingering at the lows. I mentioned we may see an undercut of the lows (we see that now). This is where we are at with GDX.
Very much like Nov Lows, undercut the steep drop lows a couple of days later. Notice the simlarity!
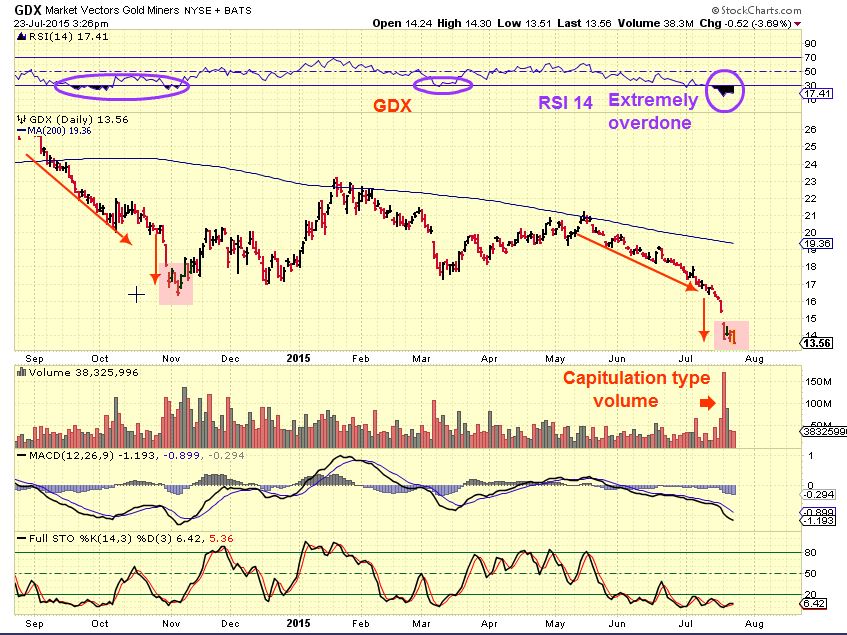
Now as a cautionary note: Just so we dont get TOOO confident and go all in because “We know” these are THE LOWS for an ICL now. That is wrong thinking.
When I look for a swing low, I look for confirmation by watching
1. Price break the upper down trend line and
2. cross the 10sma.
Look at GOLD and using that method , we are LATE and due for that low. The C.O.T. and extreme fear and pessimism adds to the belief that we are approaching an ICL ( deep meaningful low), not just a DCL. BUT WHAT IF we missed a tiny , hidden DCL that started a 4th daily cycle into that ICL?
It is NOT likely, but I dont want to rule anything out. I want to stay cautious until we have proof, so I drew this chart.
Do you see where a tiny little swing took place on July 7 & 8? It DIDNT break the trend-line above or cross the 10sma, so I exclude it. It doesnt qualify, but lets pretend that it could be an outlier weak moment and we started a 4th DCYcle then. That would leave “time” to drop further. We’d be on day 11. Gold could crash for a couple of days.
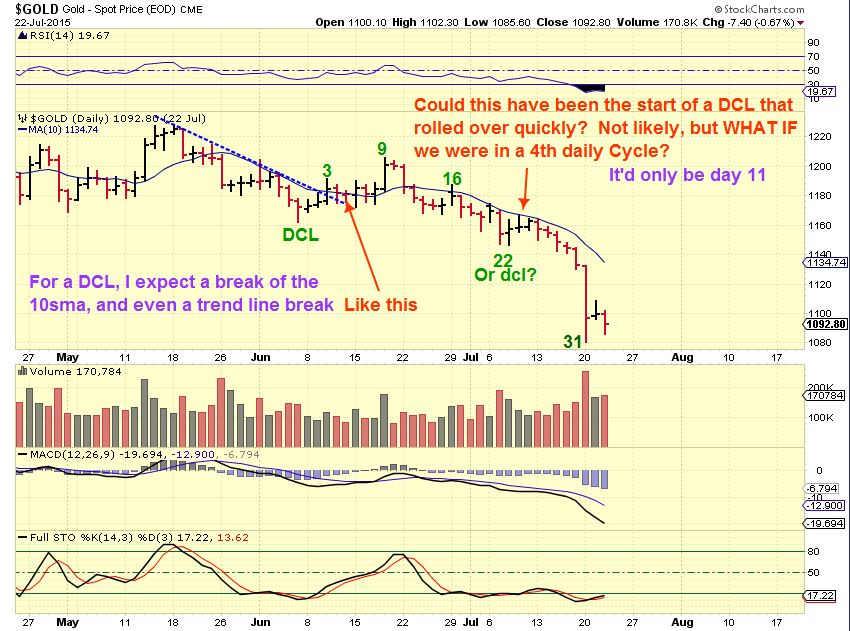
IS THAT LIKELY? NO- it really doesn’t fit normal cycle activity, but I want everyone to be cautious and not go “ALL IN” or heavy leverage, just in case we do get a bit of a swoosh down from here.
Again, scroll up to th GDX chart and look at Nov. This is playing out almost exactly as I expected, but that doesnt mean go heavy without confirmation, unless you are Uber brave and have stops and can take a loss. Why? Tomorrow is FRIDAY. If we drop further tomorrow and close there, will you hold over the weekend? Thinking ahead, I just want to admonish caution, even though the way this is playing out is so far right on target. Again, the train will not leave with out you as we linger at this bottom.
Best wishes!
ALEX
WAITING 
 GREED & FEAR
Scroll to top

I’m thinking we may get another early morning hit on gold in the next few days to take it down to the last C-wave top around 1030ish and the HUI down to 100. That should set up one heck of a bear market rally.
I was looking at the 1030 area, and pointed it out on one of my prior charts. I think the weekend report? I agree though that that is possible, but Id like to see the Miners hold off from a steep sell off and reverse first.
HUI was down $5 today, at 110, so 100 isnt out of the question.
Really should be a heck of a snap back rally once the shorts cover.
Good nite all!
Found my chart – this showed support where we are
.
Sorry, this one 🙂
Pointed out the 1033 area
.
whats the point of throwing numbers when you have your subscribers long since gold was approx 1140ish?
We just started with a 10% position. we’re still only at 60% and have lots of dry powder to add yet.
Another theory – potentially we ICL here, get two solid months up. Fed raises rates in Sep – instant $$ rocket, commodity and gold slam. Hit all of the low targets. I’ve heard 860; though I think 1030-1060 was what I was really looking for. Then as we realize that nominal rates are still negative at +.25% Fed rate and all of this consternation for the past 18 months was actual stupidity the bear could finally be shed for good.
Gary, if your 1030 gets hit, is that final?
Possibly, but I’m leaning towards a lower target and a final 8 year cycle low later in the fall or winter.
Ok, thanks for sharing thoughts, Gary.
Alex, really thought we were breaking out this morning. And I paid for it. 🙁 Going with the November thesis, tomorrow would have to be up. If we are down tomorrow, at that point do we assume we are ‘wrong’ and need to be back on the sidelines (where I probably should already be)! At what point do we declare for sure that the ICL is NOT in? If we start down tomorrow, I’ll have no choice but to eject all positions at which point, I’ll actually be patient and follow the swing/10day advice above. But I’d be better saving the cash for better times.
Early Asian action not encouraging, gold is breaking down again. I’d be cool with the gold new low while miners held up theory. I don’t think it will happen, but that would be awesome.
Clearly was too early. I’m liquidating all positions this morning. Have options so need to sell before they could get to an area they are worthless. Regular non leverage GDX or GDXJ could probably hold. But not calls.
At what point do we feel comfortable this is 4th daily cycle? Below 1070?
I wanted to compare DUST Nov to now as we compare GDX to see if we see evidence of a ‘blow-off’ top. Following the same pattern, but not as blow-off’y (I don’t think that is a word, though). Refresh for chart, see notes on chart.
Trivia for the evening: Also looked at volume. This is weekly WITHOUT Friday. NUGT – highest ever (lower share price does help volume). GDX – 3rd only to November 2014 (could surpass but would need 90M+ tomorrow). JNUG – 2nd only to Mar 15 (share price big factor here). GLD – there just is NO comparison to April 2013. Doubt I will see that eclipsed.
Great job Cason, thanks for sharing the chart. Looks very similar to me. The MA looks to be going parabolic.
Thanks, Bill. But after today’s action I’m thoroughly confused. Miners still not leading but horrendously oversold…
Gold priced in euros is still leading gold in dollars imo. When 1050 broke we fell to 1000 we then dropped 50 here in USA tonight 1000 breaks in euro land. Next support is 950 rising bottoms line. 1050 here. I could see us hitting 1033 now.
GOLD has a bunch of converging trend lines, H&S pattern, double bottom. Getting close, maybe 1065? I started catching the knife to slow it down. Pulled my limit orders from Yesterday until we get a bigger drop. Refresh for chart
At what point do we have to worry about miners going bankrupt? I know the price of oil is low, which is a plus, but there has to be a point where mining is not profitable.
Oh, about right here. A year go the avg ‘all-in’ cost was almost 1200. That’s been lowered some. Some miners near $900 or so. But the easy stuff is already out of the ground. Just ask ABX.
Part of the reason I think the $700 gold folks are so wrong is that is hundreds below the mining cost. At that point, you shutter operations and wait for supply/demand basic econ to take over.
Some are still so saddled with debt that there is likely to be consolidation in the space, even with a gold rebound.
The two red rectangles on the chart look identical. Look for a bounce here in NUGT. But for how long?
Well that worked out for a quick scalp,, now what?