Are you seeing flashing RED and GREEN lights in your sleep? You are not alone. The markets have been volatile and even short term traders may be finding that if you dont lock in immediate gains or at least take partial profits, then next day the trade can flip against you. lets look at some charts and see where we are currently…
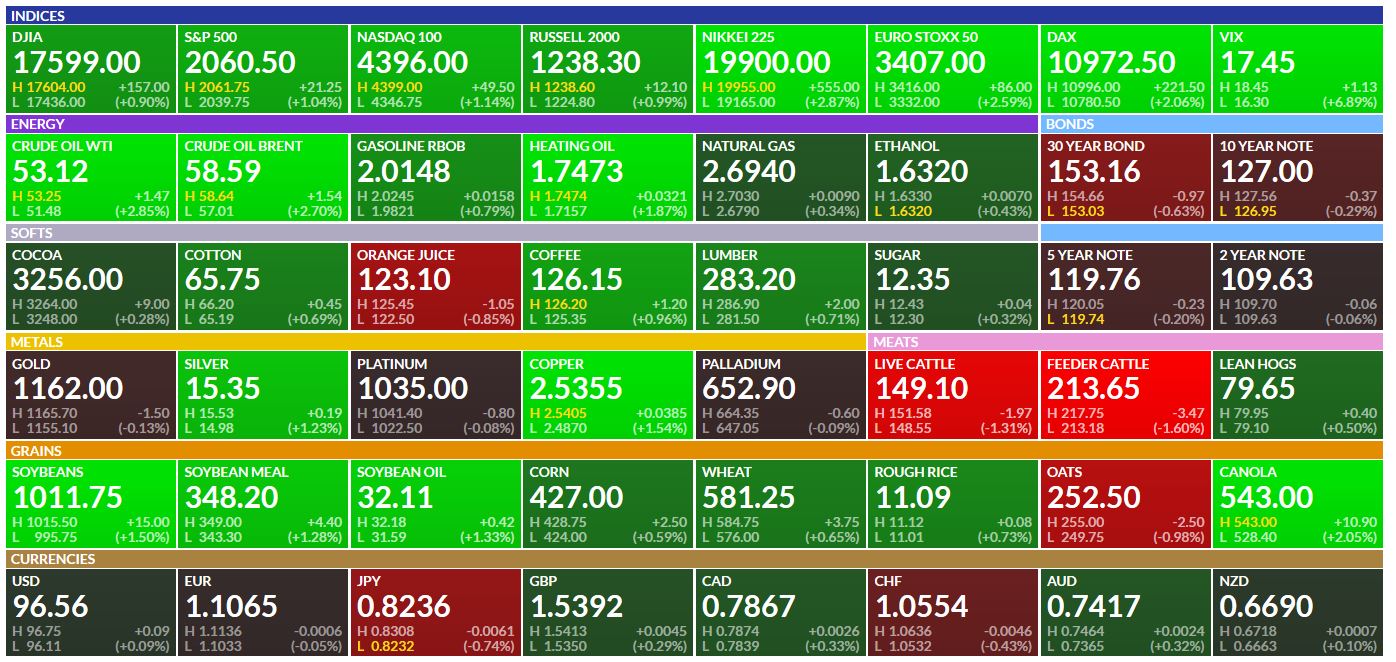
As I write this report, this is where the futures are. A lot of GREEN so far ( Gold is actually up $4 from the close of 1157.40, I dont know why they show up here as down at 1162.00)
I sent out a cautionary update in the afternoon yesterday, lets discuss that first …
This was my SPX chart in the 2 :30 p.m update, warning that a close below the 200sma should be noted if it occurs
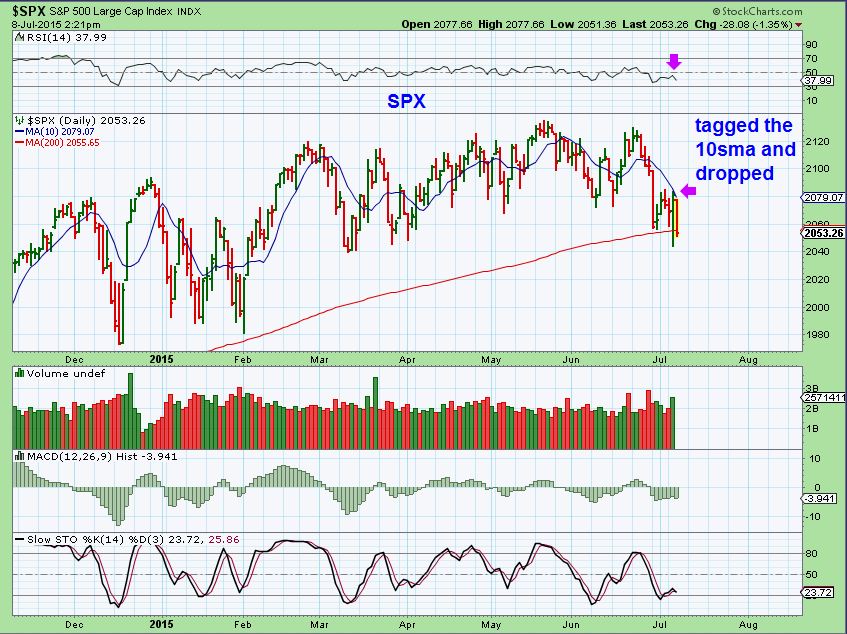
It occurred – but now the futures are GREEN and above the 200sma at 2060.50. What to watch for here? The downward sloping 10sma is holding things down so far. Envision a possible bullish wedge if you can , but if the 10sma rejects price today or tomorrow? This could be part of the selling off stage.
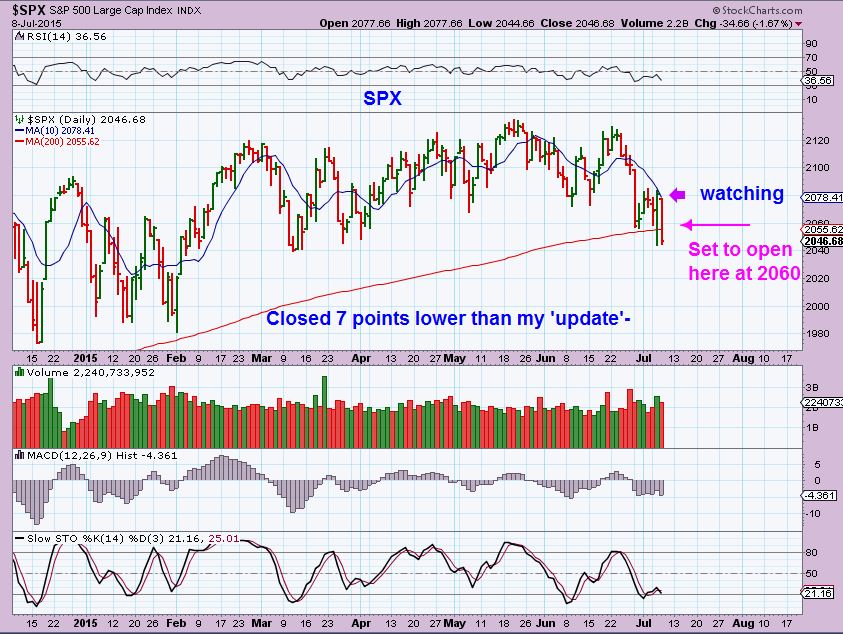
I often do not have a Friday morning report, so I am showing you now what I will be looking at this weekend. Part of it is the SPX above ( 10sma ) …what happens by the Friday close?
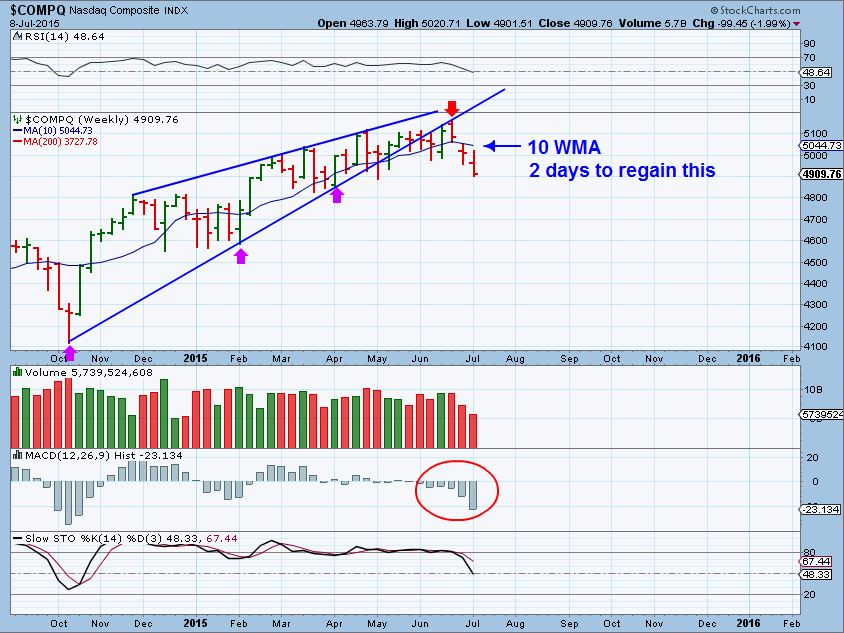
And then look at this NASDAQ WKLY. What will this look like at the close Friday? SO far it remains a
1. Rising bear wedge
2. Breakdown
3. Back test & drop
That Bearish Rising Wedge pattern is why I wrote my intraday alert yesterday as we looked to possibly close below the 200sma. Now we look to be recovering according to the futures ( TRICKY) , so moving forward, please WATCH THE 10 SMA for break through or rejection. Is this just a bounce?
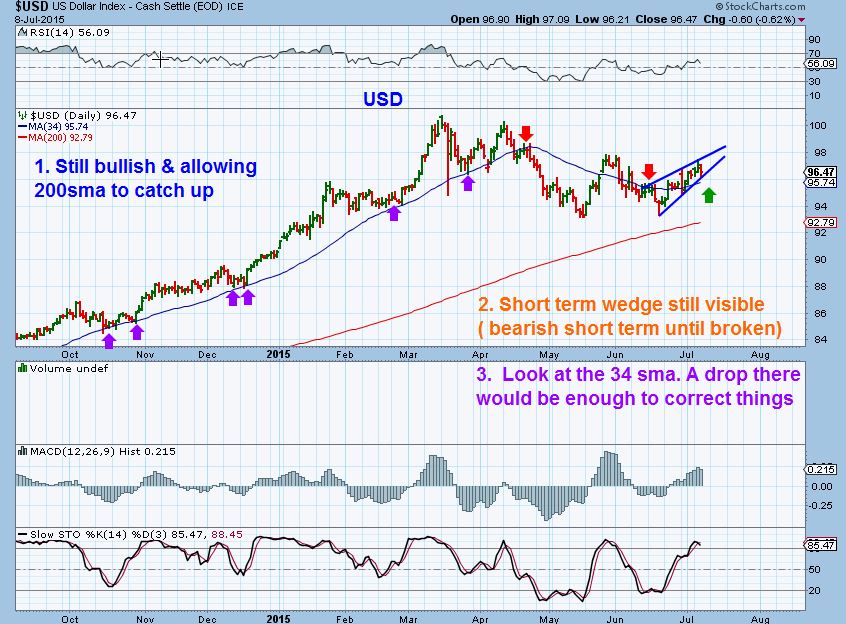
USD – read the chart
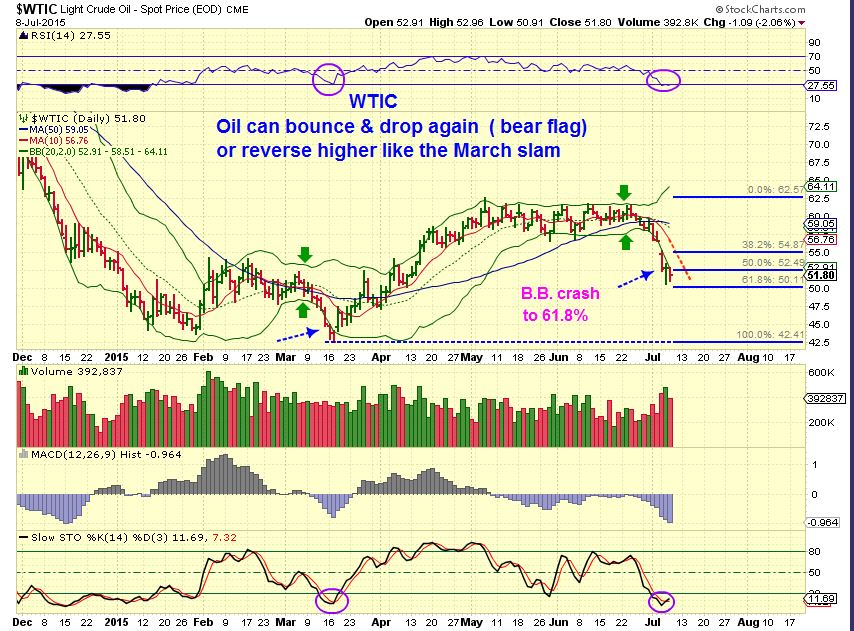
$WTIC – time will tell. B.B.Crash should cause a bounce. Similar to March lows in many ways. In Dec/ Jan OIL just flagged and dropped further, so I am watching this area. We did a 61.8% drop – again watching the 10sma for resistance or recovery.
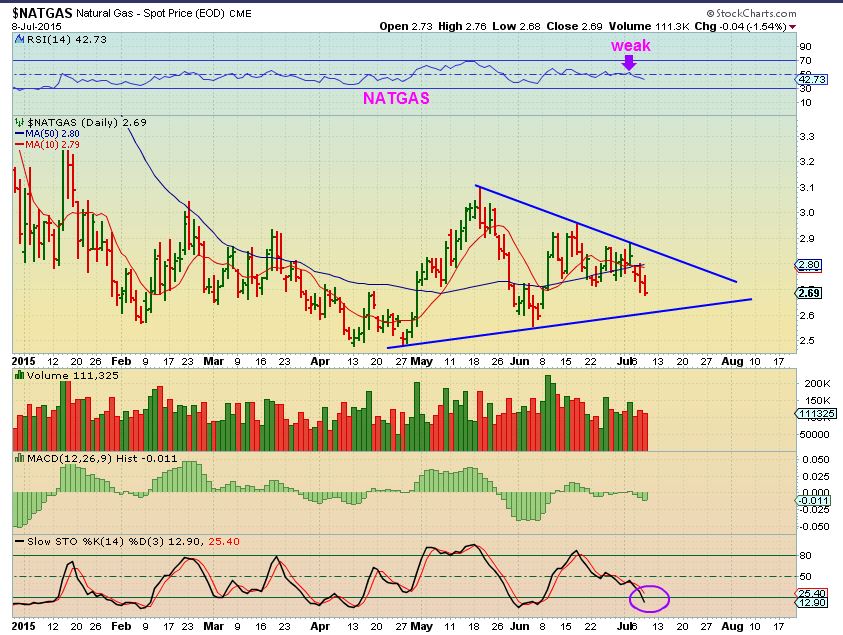
NATGAS – Below the 50sma is not showing strength . Weakening RSI. Drop to trend line?
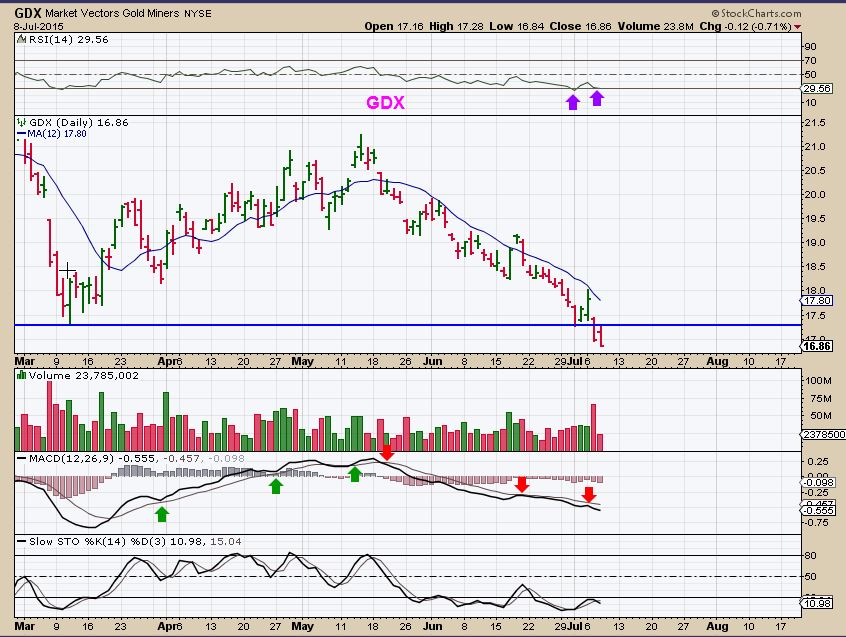
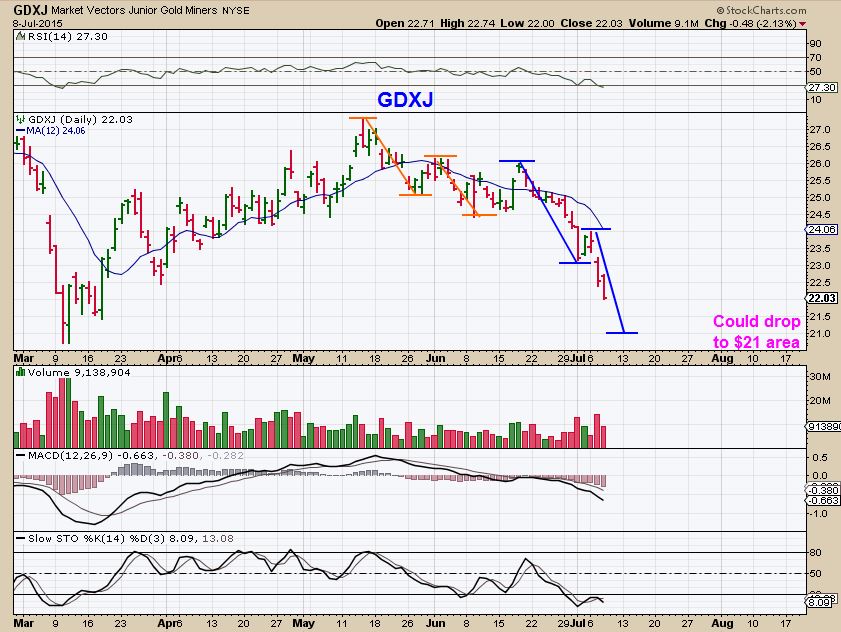
GOLD SILVER & MINERS
The never ending wait for a Daily Cycle Low 🙂
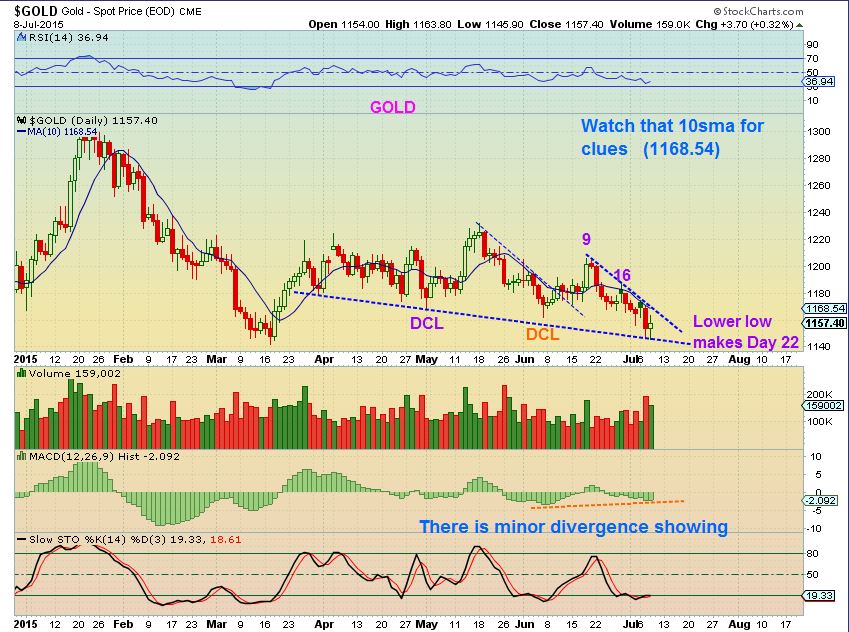
GOLD – a lower low yesterday adds the count to day 22. DCL’s can come in here, but in the recent past they have extended out to day 30+! ( The LAST Daily Cycle was only 24 days long) . A break above that trendline / 10sma is likely proof that a DCL is in. BE AWARE that a 4th daily cycle could be next, Not that we have a new ICL. I’ll cover more in the weekend report.
SILVER – We have seen in the past that the move Tuesday can lead into a bear flag and a continuation down, or a SPIKE low with high volume. It will take a little time to see if Silver can recover that break down. Many in the blogs that I read immediately called for a flush lower with all support broken. Sometimes that is a shake out as I have pointed out repeatedly here. Patience, consider Silver weak here for now .
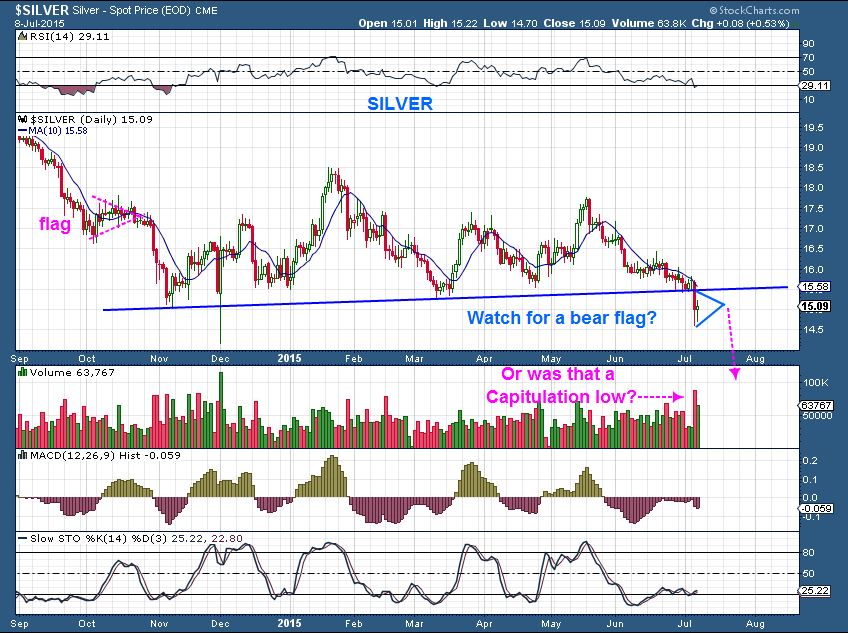
GDX – Gold and Silver were GREEN yesterday into the close , Miners went to new lows and closed RED. That weakness is usually showing the move in Metals is a bounce. GOLD / SILVER are green now, but this makes me think that they will not gain traction and that the DCL is still ahead. I like to see Metals go red and Miners close green. Maybe we get that Friday or next week at a real DCL?
GDXJ – There could be further selling. GDXJ held up as GDX sold off recently to new lows. GDX was barely down yesterday, but GDXJ could now be playing catch up. DUST & JDST have had bullish looking charts since the last bounce in Miners.
SO I just want to say this, these are TRICKY MARKETS. There are times that I , as a trader , can flip around and scalp profits here and there dispite the volatilty. Volatility can actually be a traders friend, giving quick action and short trade time frames. To be totally honest with you all, I have traded a few trades this week and without taking partial profits each day, I find that the trades have flipped quicker than normal against me repeatedly. That causes me to have to stop out or just sell admitting that the trade isnt doing what I thought it would. I am fine with that, and that is always part of the business of honoring stops and proper entries, but I just want to put it down here that right here and now….things are not crystal clear.
There is also a time to wait for clarity. Last week I was in mostly cash all week and I’m thinking that with GREECE, CHINA, FED WED, NYSE failure yesterday, etc- it is just not all that clear right now to be trading confidently. We closed below the 200sma in the SPX. Today we recover , but what about that 10sma that rejected it last time. What about that Bearish Rising Wedge I’ve been watching for weeks on the weekly? Markets are rolling over and recovering and rolling over and being bought back. Is it a topping process or recovery? It is not clear and the direction in many sector moves is not trending , it is day – to – day.
SO be cautious, trade at your own risk and experience level. Being patient on the sidelines in Cash is wise too. I’ve seen some great set ups fail lately. Remember that there is always another trade, but it may be currently “Setting up” , and it may not be today . There will come clarity in time and finally some trending moves that you want to have capitol to deploy. An ICL in METALS, for example, can be quite profitable in the 1st 2 daily cycles. We are nearing an opportunity there with the passing of time , I.M.O.
Best wishes to Traders and Patient ones alike!
~ALEX
Update July 8 
 GOLD IDEAS
Scroll to top

I don’t usually look at Silver. It seems I drew this chart in April after the right shoulder. I looked at Silver this morning and looks like we are very close to an expected bottom ($14.60). FWIW.
Hi Bill,
Thanks and may I Just add my 2 cents? It looks like you had $14.60 based on a perceived H&S price projection or you could say it was an A-B-C-D down target from head top down and then shoulder top down.
However, when you do a price target for such patterns and it turns up & makes new highs like it did in May – I always say that that the initial target was negated, the pattern didnt play out .
Looking at it now – You could re-do it and say that now you want to use the new high in MAY as included in the right shoulder, a bigger H&S , but I think that that then changes your downside target too. I also dont see this as a reliable H&S including that new MAY high as the right shoulder, but thats just me.
Just throwing that out there as how I would see that 🙂
Ya, I agree. That’s why I said FWIW. The new high in MAY must be the new right shoulder, although the pattern is odd looking. I would’nt draw it now. AB=CD makes more sense.
But if the recent low in silver holds, I’m gonna give you a ‘that-a-boy’ anyways,
because it was awfully close 🙂
thanks 😉
Alex great call on SGY and LGCY both up nicely since your recommendation. Keep up the good work.
Thx Bill,
To be honest – I sold all my energy yesterday except UWTI due to the uncertainty. REXX reaction the past several days had me cautious – I should be on the sidelines in that sector.
One profit, one loss , UWTI still holding on for now. Pretty much break even
I still own LGCY
Thanks for your great help.
Very nice pop on LGCY , but keep a stop in place just in case 🙂
I dont know where you got in, but a stop below the 10sma could lock in some gains if it sells down .
You don’t see this action as a turnaround in the energy sector? Lot of stocks moving higher?
I cant tell if it is real or not yet. The moves that I am seeing in stocks moving higher could just be bounces, and the XLE does not look healthy at all yet.
For example looking at EXXI. Its up 6% , but down a lot more. It dropped for almost 12 days in a row, so it Could Be a double bottom, but below the 10sma, it could also be a bear flag forming.
Many are up 7% today, but the chart still doesnt look like a recovery yet ( See CRK, SGY, PEIX, etc ) . Some do look better than others however
Sold my WMT on the open, bought NUGT in pre market and sold on open. Done for the day. Thanks for heads up Alex. : )
Nice Trades WT (wishfullthinking)
Thanks Alex : ) I just don’t trust any trade right now. Almost anything I keep eyes on fades. I’m not good at shorting, so I’ll just keep scalping till you have more confidence and conviction. Only then will I “believe what I see”
I’ve had quite a few pop & drop fades and also stopping out off what looked like good set ups myself. Thats why I sold a few yesterday, just lock in small gains and stopped out small losses since each new day has a whole new direction 🙂 Now I’m just watching a few areas
Not in it anymore but look at CLNE today.
Thats nice looking.
SSRI not bad for a silver miner today too. Released earnings – increased production.
Isn’t that crazy? I watched it all week but didn’t grab any. Bill was talking about energy at the reversal, should have grabbed the CLNE when I saw it. Was hard to trust though.
It was a news related rise today. No way of anticipating that.
Didn’t see that, will have to check it out. It crashed the BB with oil, some reversal to be expected.
Many of the Biotechs I mentioned look good and reacted well, but…
I had recommended LJPC ( check that chart out) Sweet!
and I had recommended SCLN – Check that chart out. (I dont see any news).
You just cant tell .
I’m watching XOMA, IDRA, and I think that ZIOP is still forming a cup or Inverse H&S on a 1 yr chart, but needs to hold . Sits right on the 50sma.
What do you think of NVO? Flagging…….or rolling over
Wow is that a gappy stock .
Thats a tough call because the MACD crossed down and went below zero ( Bearish) , lost the 50sma too.
It also has that HUGE volume price surge in March and I find that those candles almost always get back tested, so it could be doing that, along with allowing the 200sma to gain . When price gets way above the 200sma, it often pulls back or goes sideways to let it catch up.
In other words, I have no edge on this stock, but its likely to drop further.
On second look –
IDRA is bouncing off of the 50sma, but the MACD has crossed down and it did lose the 200sma. Not ideal.
I’m in KITE.
NATGAS / UGAZ reversal today, dont know whether to trust it.
(oh brother…I wanted to just be patient – lol)
Up a couple, down a couple but can’t seem to make a serious move.
What a horrible close. I have a feeling that the Greece news might drive next week, which leaves the market very binary. Which I don’t like – lots of extra risk!
Seems Greece sorted. NBG up 23% yday
Ok, let’s try this again since yesterday’s attempt didn’t work. Look at difference btw 10-year open yest and now. Zowzers! Oil and gold continue to float up some.
Reduced by 80% TMF at open. On verra
$6.61 completes the downleg of the H&S pattern. Should start heading up if all goes by the numbers. Double bottom on GDX just ahead