I gathered all of my charts Sunday morning and most of them looked like they were indicating lower prices. Monday morning , after the Greek Vote, the color of the day certainly does looks to be RED so far. Lets take a look at the charts .
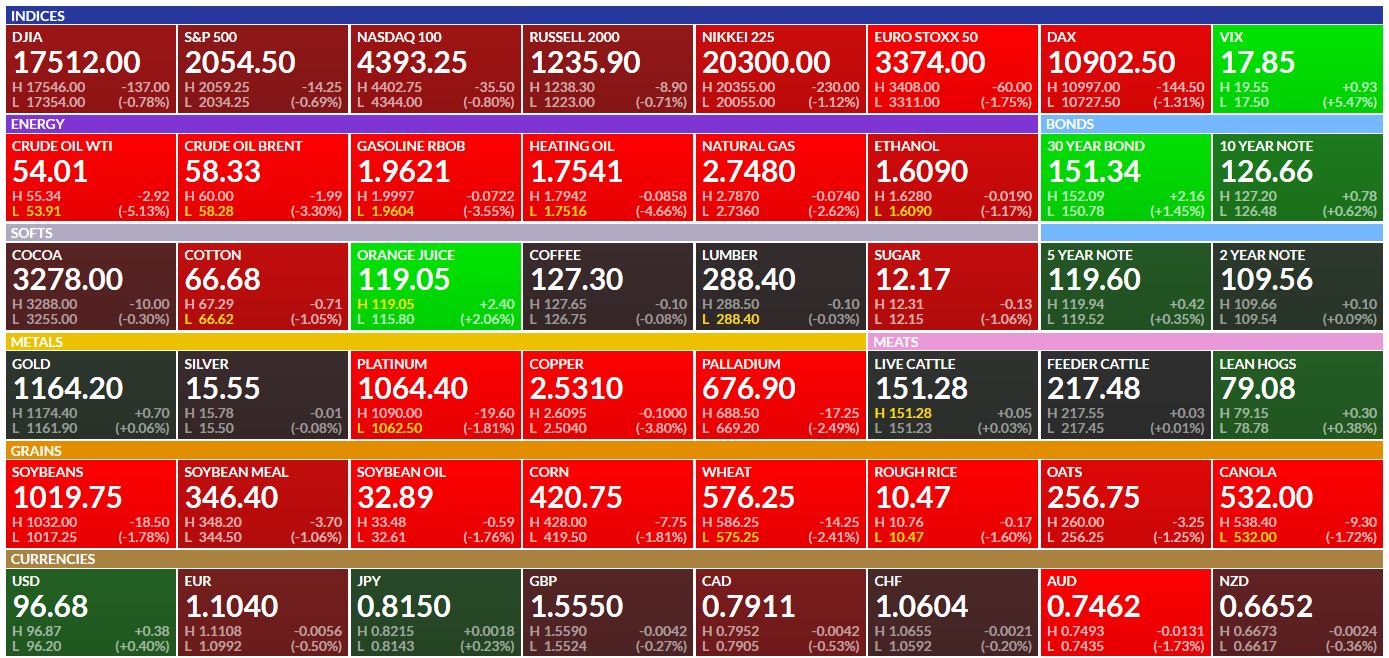
Here is a quick glance of the futures as I write
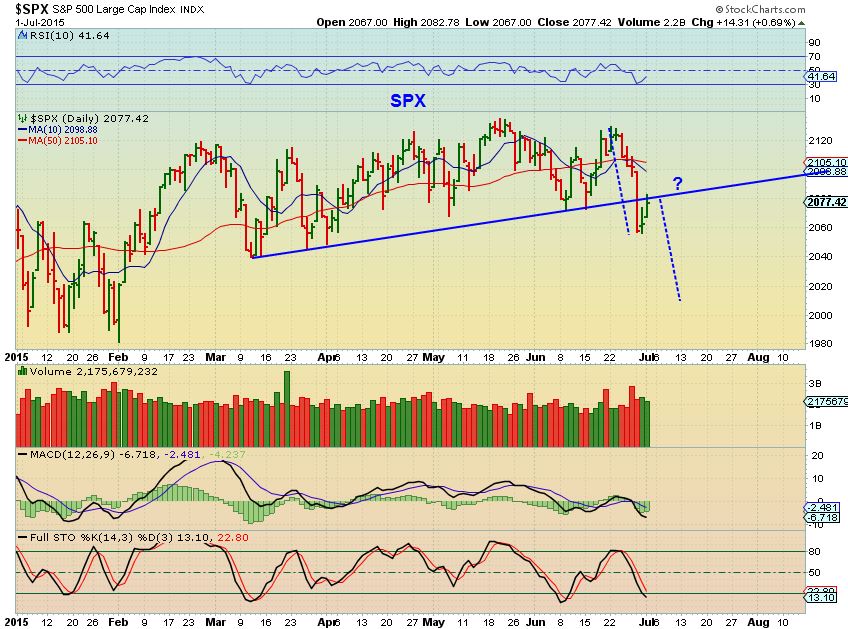
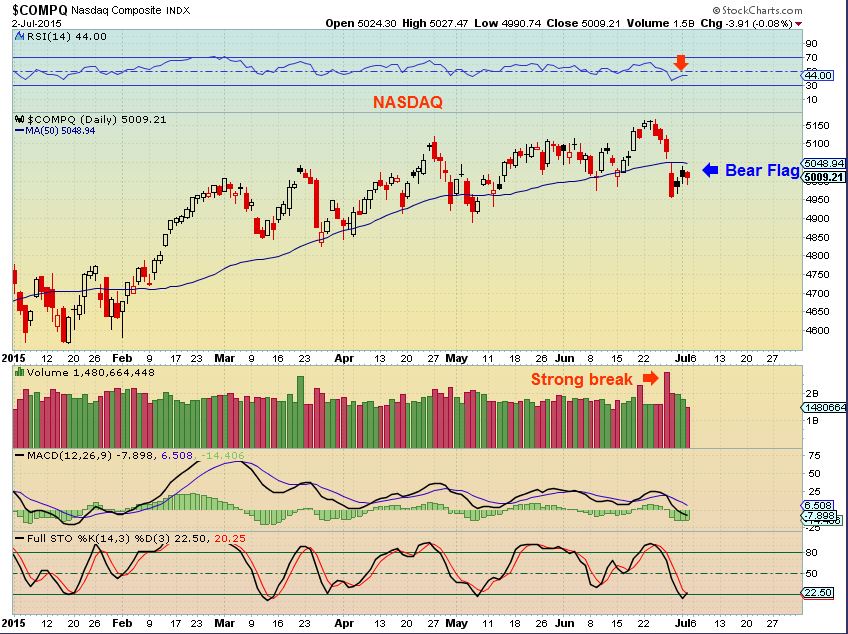
This was my chart for the SPX posted here for July 1- it looked like it might have been a bear flag forming.
Since all the wheels are already in motion in the futures, I am just going to post all the charts that I collected on Sunday and show general direction that I expected.
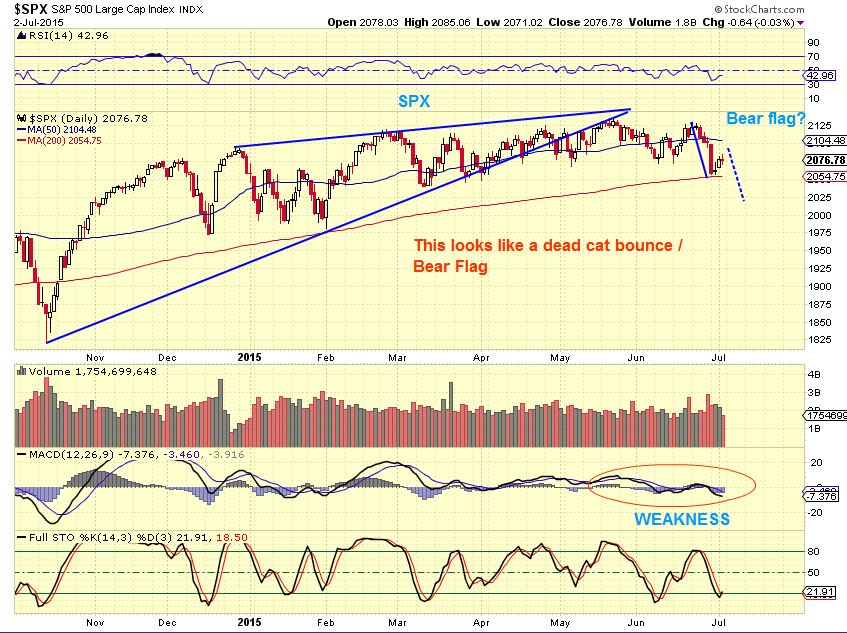
SPX – I continued to see downside as the likely direction, weakness in the chart. It is oversold, so it may bounce again soon after a gap down, watch the 200sma. The futures rest right on it now.
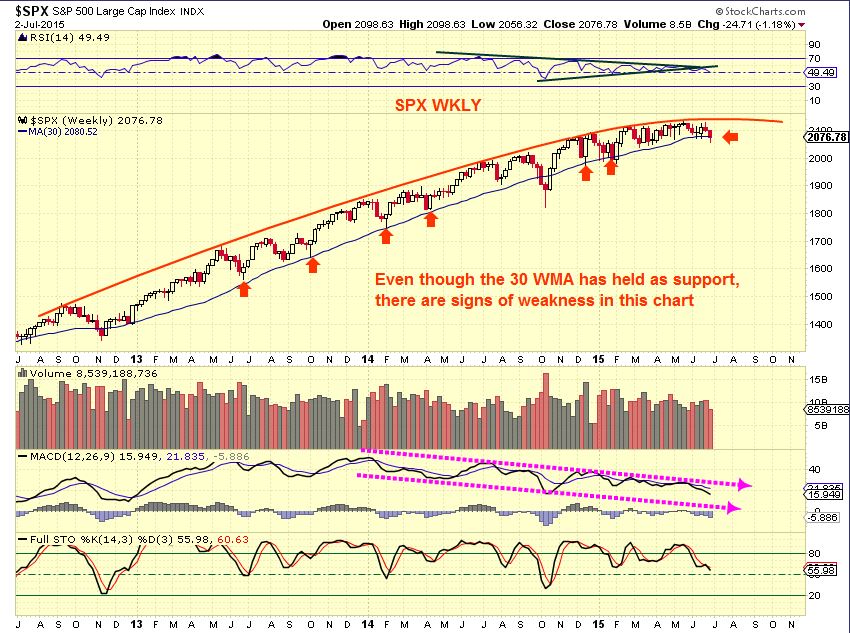
SPX WKLY – I posted a chart similar to this a month ago. Something to watch for if the markets are rolling over.
NASDAQ
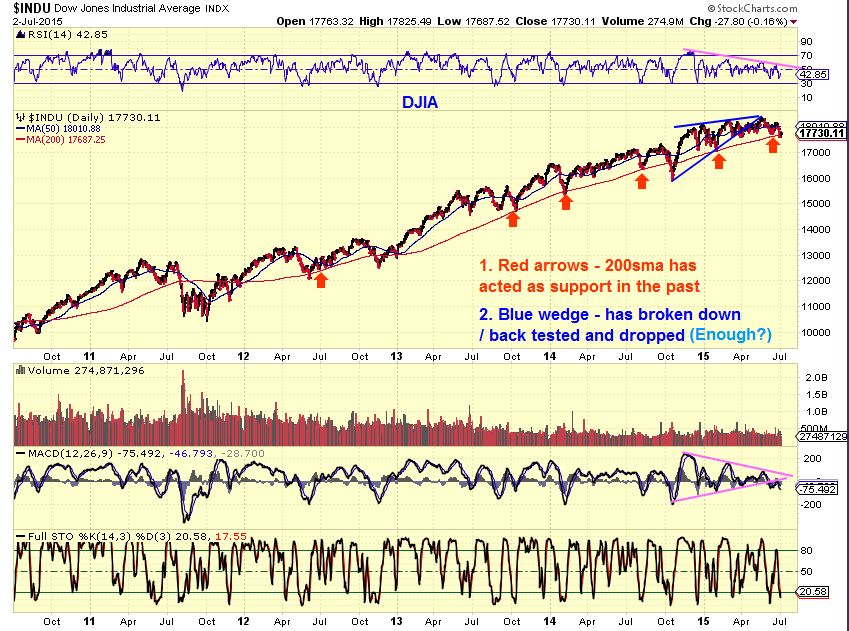
DJIA 5 yr chart – watching the important 200sma longer term.
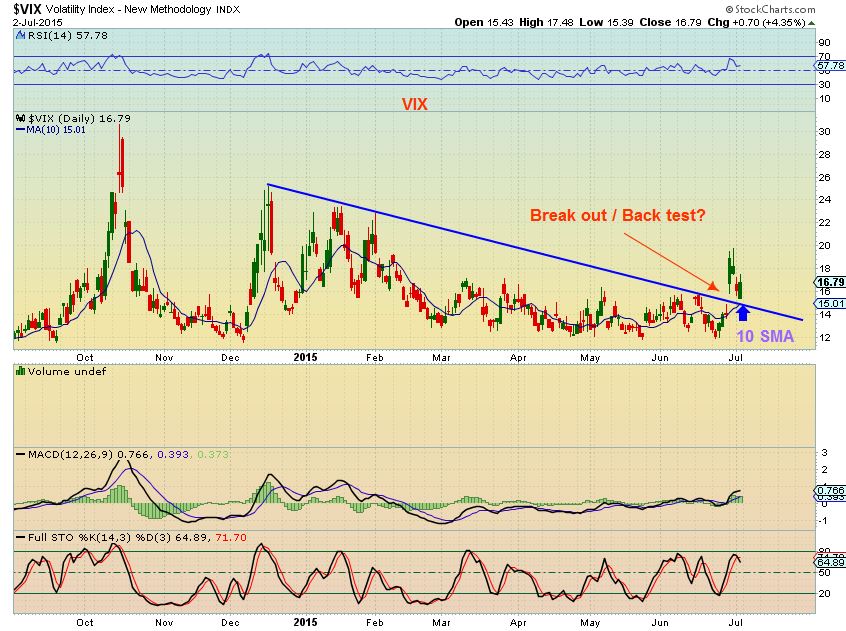
In my last report I pointed out the break out & possible back test to look for in the vix. I expected a test of the 10sma actually. Here was the update, just shy of the 10sma.
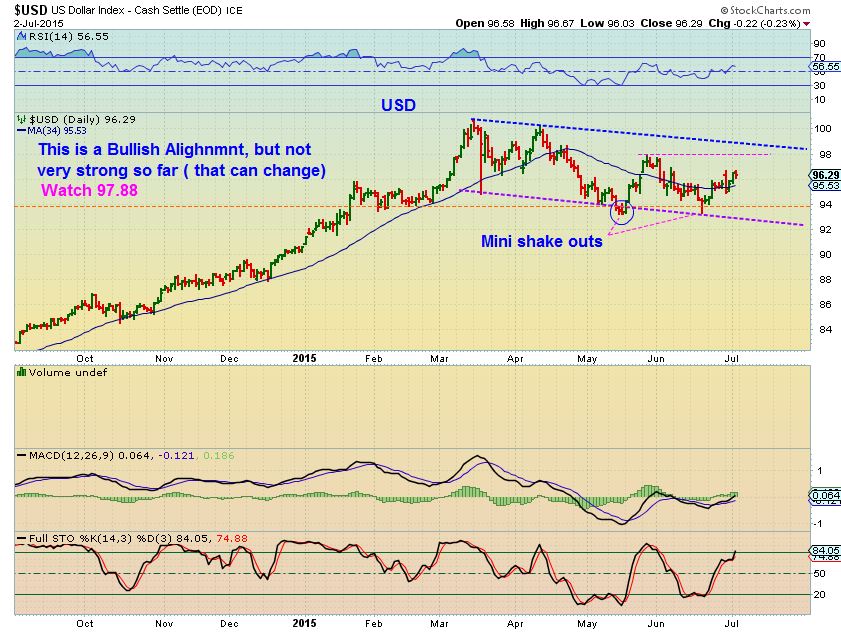
USD– Bullish , but not acting as strong as one would imagine
WTIC– I mentioned using SCO in my last report, since OIL looked to be breaking down. Look at the RSI. Now Oil has dropped fast since this chart ( See current futures chart above) . A bounce may be needed to take a short position at this point.
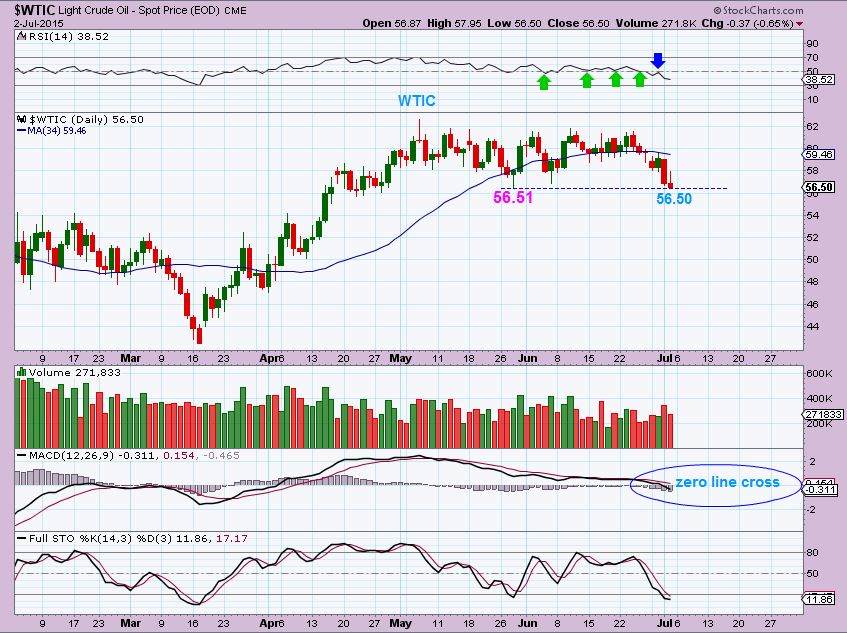
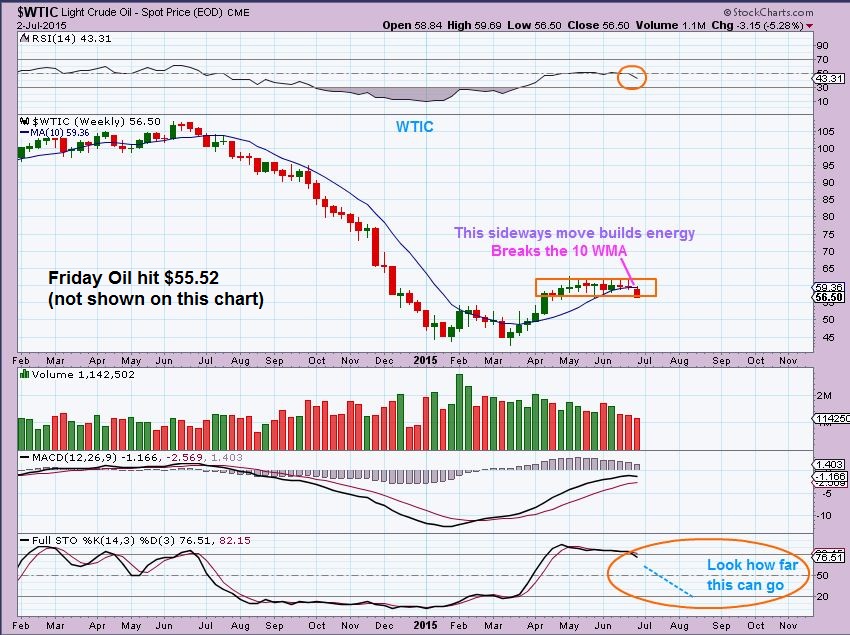
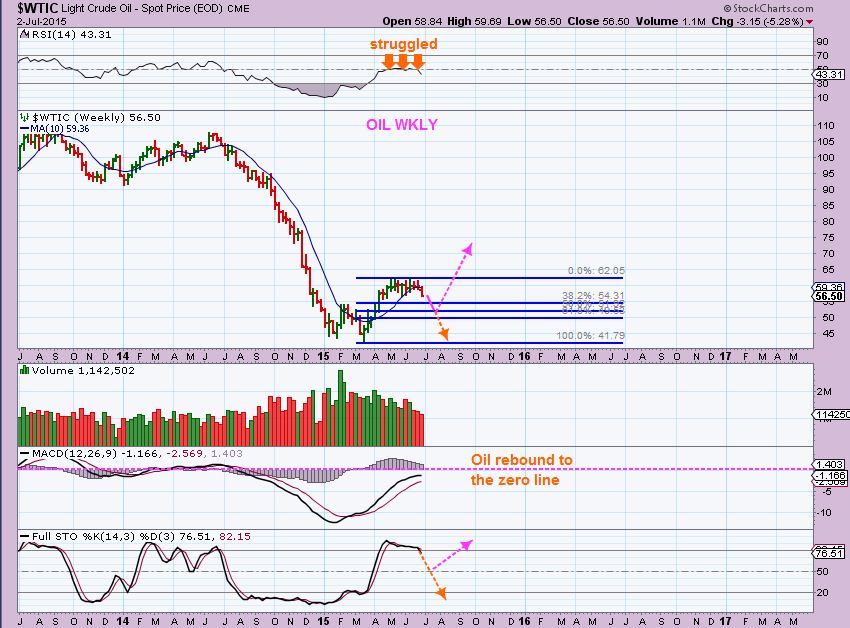
Is there a possible recovery? I drew one out in PINK, but for now just please expect downside. Do not try to go long unless you are a very experienced trader just trying to play an oversold bounce on a daily chart. It is risky after this consolidation, the move can be sharp with the energy built up.
GOLD, SILVER, MINERS
GOLD JULY 2 – You may recall that I said I got 2 separate and very rare buy signals in GDX as it broke down Wednesday. This is Gold and it is “possible” that it broke to new lows, put in a reversal candle, and also possibly a DCL similar to the last one. This would produce a BOUNCE, but is expected to roll over again the same way the last ones did. Watch the 50sma if we get a bounce.

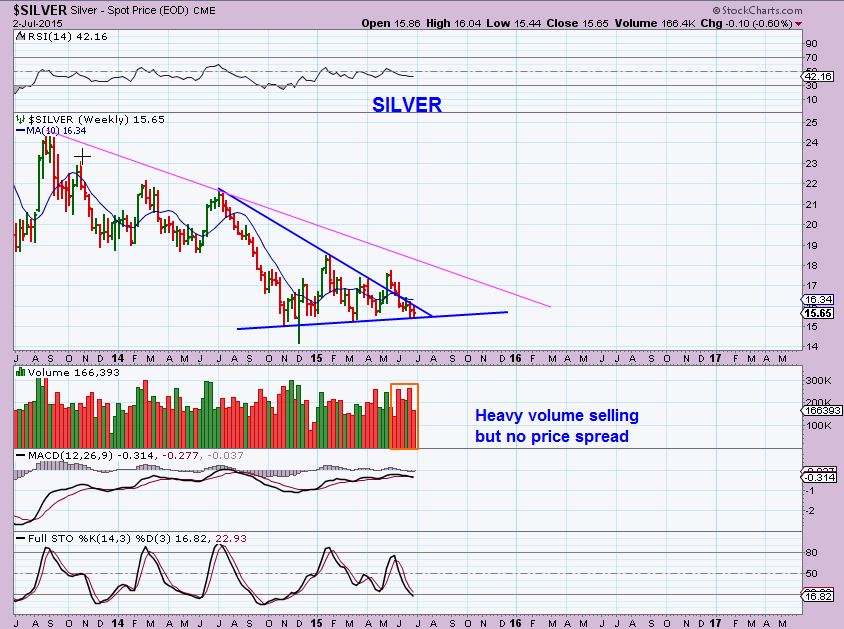
SILVER- You have to admit, SILVER used to just drop fast. It has acted orderly and made higher lows ICL to ICL. I am not saying that we are at our 3rd ICL, but that wedge is a bullish wedge so far, we’ll see if Silver can break free.
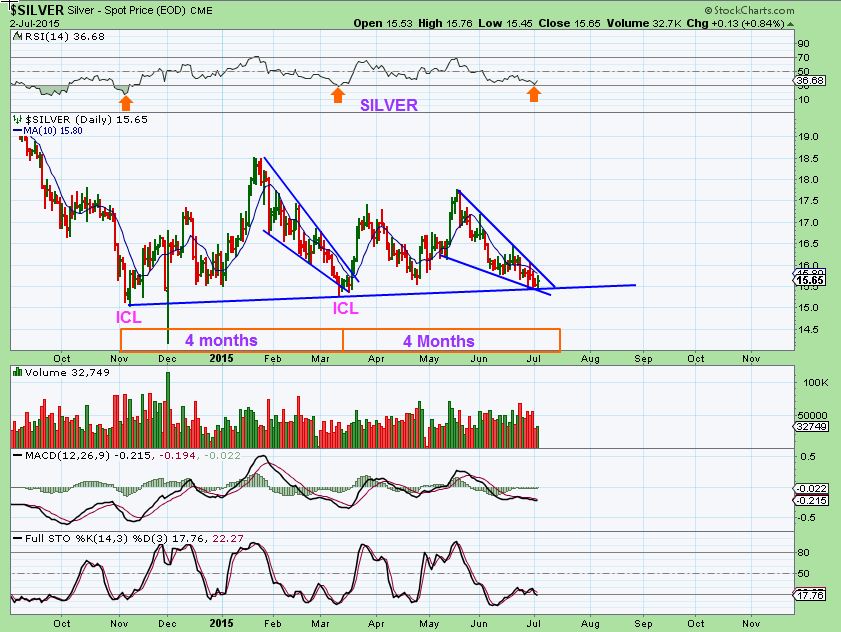
Also interesting in SILVER is that on the weekly chart, we have High Volume and small price spread & no new lows. Hmmm?
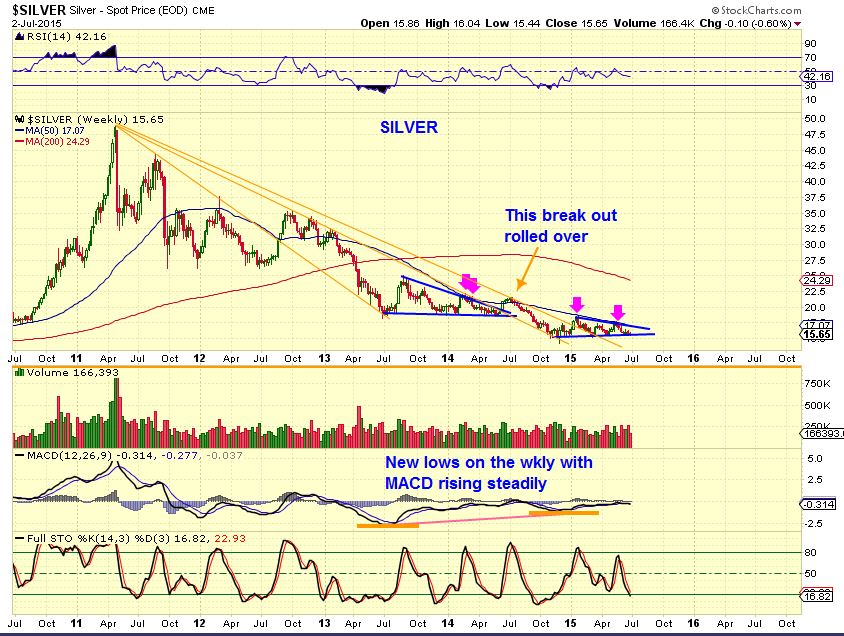
SILVER LONGER TERM _ I wanted to look into this more, but did not have time this weekend. It is on my list. There are interesting things showing up on this silver chart.
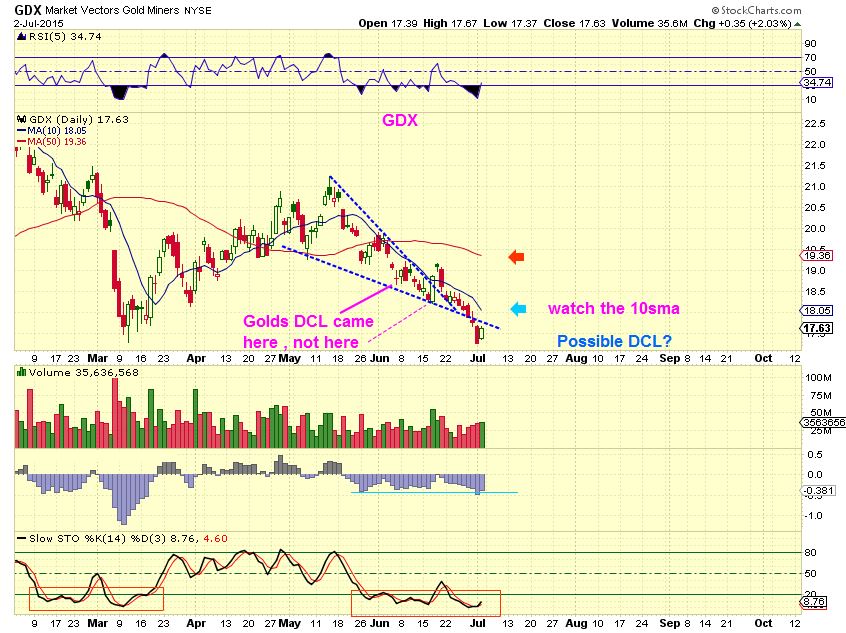
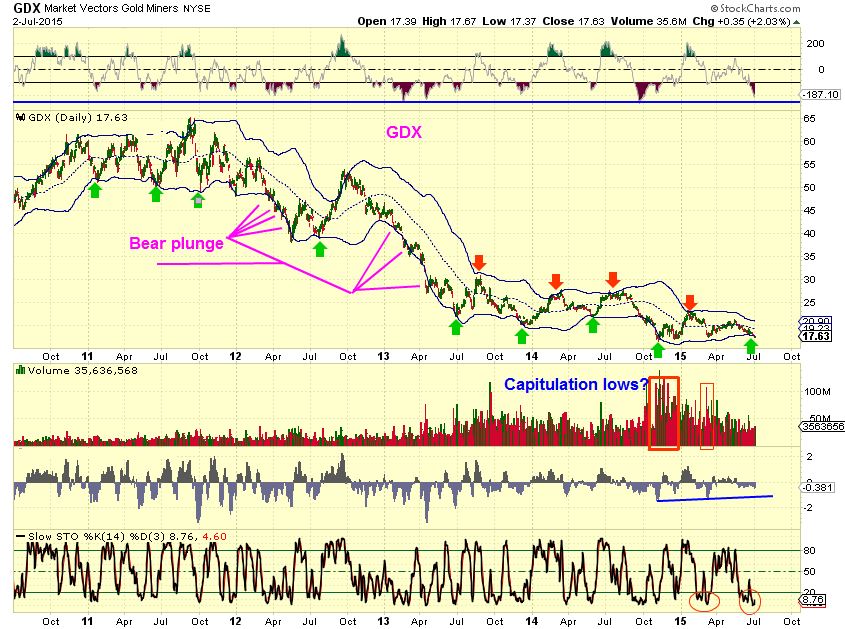
GDX – Got that buy signal that could produce a bounce. Needs to be watched for several reasons. If we are going to roll over, some may want to go short (Dust/ JDST?) after the bounce. I think this needs to be watched because of the rare buy signal that I got. ( Assume that it is just a bounce for now).
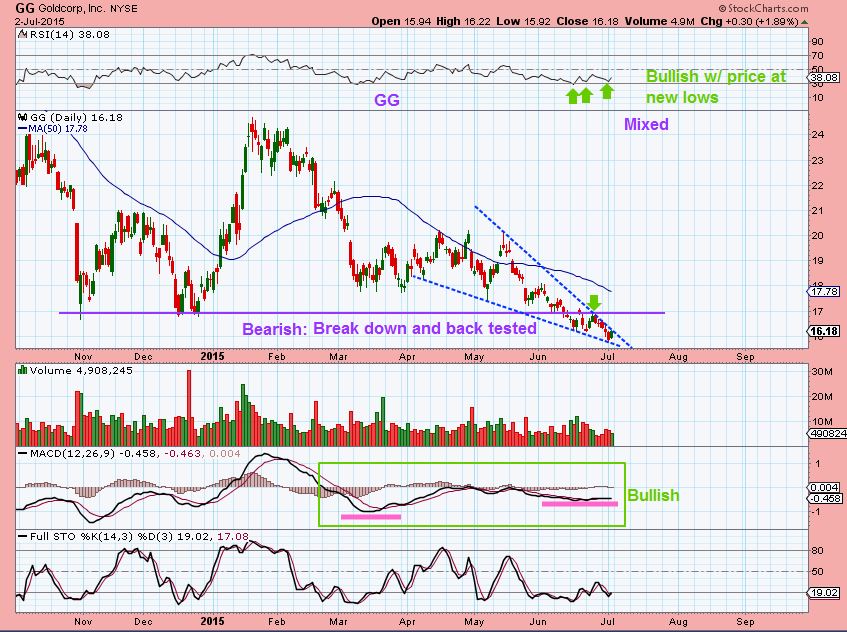
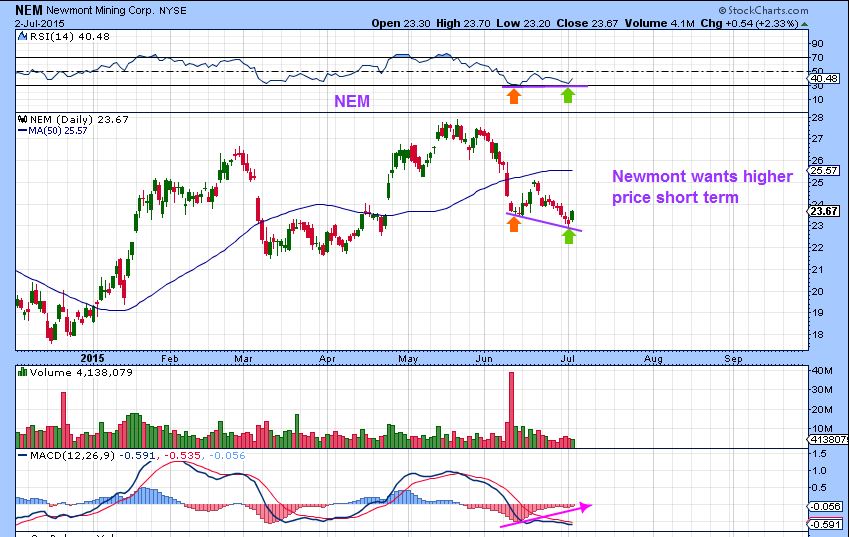
These stocks in the GDX look like they too want to bounce here. GG was a break down, I’ll be watching that one.
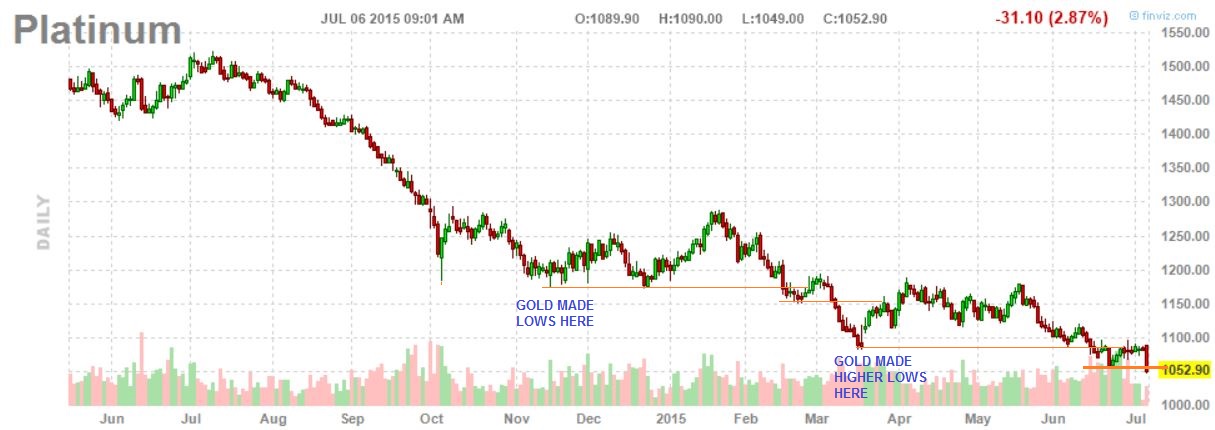
Interestingly PLATINUM is down $30 right now, still making lower lows, while Gold is slightly up. Talk about a mixed set of signals : )
Pieces Of The Puzzle 
 Bounces
Scroll to top
Alex, Interested in your opinion on these two charts. It seems to agree with what you are posting above. USOIL went up and then went sideways. I looked for a similar pattern and posted a while back. It looks like USOIL is following the last pattern (2013). Looks like we have further downside. Its a little hard to see because I over-layed the pattern from 2013, matches pretty good.
Here is the 2nd chart showing where the pattern comes from.
Hi Bill,
I did see when you posted that about a week ago, but I think I checked in late at night and must have forgotten to reply. I do see similarities.
The only real difference that stands out is that Oil seems to have consolidated sideways loosely the in 2013, It was a tight consolidation recently. 2013 also made a false break out to the upside first, Rolled over and sold off . Oil this time was pretty tight & then broke to the downside. I attached a chart of 2013
Anybody trading Today? Prospects? Eyes, Kite, Nugt?
Holding NUGT since Thursday. Happy camper
You must have been a little nervous at the open! 🙂
I was retro-actively. I slept in :)))
(i live in San Diego, 6:30a open)
Me too, Took NUGT last week & held for just a trade, I like the way EYES looked this morning at the 50sma would be low risk. I have been away this a.m., I have a very bad allergic reaction to poison ivy – I am VERY lightly invested.,
Check out SPX & DJIA with the 200sma. Pretty interesting.
Gold Down, Nugt up? Go figure!
Worth pointing out WTIC hitting 38% FIB reversal from March lows to recent (flat) high.
I see that you posted this 2 hrs ago. Oil just dropped on heavy volume. The 50% retrace is $52.50 ish, may bounce, but I’d have to see how it looks in tht area to see if it could be a short the bounce trade.
$ dropping v Euro and Yen. USTs strong. This week’s looking interesting, if these continue and develop.
Yes, The dollar has a bullish set up, but I do see weakness within at this point. Euro holding up well. That can change, but it is also interesting that that BUY signal that I got in Miners took hold & Platinum just did the mother of all shake outs today . Really interesting moves.
I pointed out SAND last week as a stand out volume pop.
Today NG , NGD, SSRI, PPP, CDE have reversals that look pretty good.
SSRI looks like a H&S pattern to me? I am real reluctant right now to invest. I just don’t see sector moving higher.
What time frame ( I refreshed for a chart & you fooled me and didnt add one this time 🙂
Sorry, see attached
no comment : )
What?
I said that kind of jokingly – like LOL. I see what you are pointing out now, but
Its just that a reliable H&S should show weakness on the last rise higher (right shoulder) , so you’d have a lower right shoulder than the left, because lack of buyers couldnt keep it going. The way you have it, the right shoulder has almost taken out the top of the head.
A little less scary because it doesnt show the same weakness in the last rise higher.
But I do see what you are pointing out
I get it, more of a double top.
There ya go…definitely could be double top and still play out as you expected
Alex, you pointed out SCO as an opportunity. Man, big move. Did you take the trade?
I did not take the trade : (
I meant to but I wanted to wait for the weekend , and I thought that maybe OIL would bounce up & tag that 50sma one more time. (
In hindsight, I should have taken a partial position , and added if it tagged the 50sma
think we will get a pullback? Would you buy then?
Oil is oversold ( it can stay that way though) , and SCO gapped up breaking out of its base. SCO could fill the gap while Oil puts in an oversold bounce, but it doesnt have to happen at this point.
Oil could just flush out as longs bail out. IF oil bounced, I’d have to see how it moves , because then we’d also see that OIL did a 50% pullback from the move off of the lows and it gets tricky
Not sure if that was clear, but its kind of a wait & see from here, since we seem to be in the middle or near the end of the initial break .
Thanks! I’m sitting 100% in cash. I can’t see anything worth taking a chance on. I think we will get some real good moves in the future from these lows. I do like NUGT though. If you would have bought NUGT at these lows the past three times, you could have gotten a 70% gain three times since December! 😉 wow
Cash is not a bad place to be in times like this.
The best part about cash is that your head is clear. I see things without bias at all when I am in cash , and I have no emotions because my money isnt tied to any direction.
Sidenote: I look at CDE and EXK today and think we may have seen the DCL with my rare GDX buy signal last Wednesday
I will add this however – The IBB is not affected and the Biotechs still look pretty good.
Solars got CLOCKED lately, even the good ones (JASO, CSIQ, TSL,etc)
Looks like the silver miners are holding up. Gold however, I think, could go either way from here. I can;t see miners moving higher with Gold going down. I do think its a low risk entry, just having a hard time pulling the trigger on NUGT right now. I’m sure I’ll regret it.
I dont blame you- GDX just hot the 10sma and many bounces have ended there. If it is a DCL, it should go a bit higher. You could always watch it play out & see how GDX acts if it gets to the 50sma , it may be time to get some DUST for a drop into the ICL at that point.
The last DCL in miners didnt do hardly anything actually, barely popped above the 10 sma .
Man, oil just got HAMMERED today. Glad that you warned us. I got out of CLNE at 7.2x; it’s a full $2/share lower. Should have taken SCO as I was watching breakdown last week, was hard to pull trigger with long weekend.
Any thoughts on gas? Might have been down with oil in a sympathy trade?!
Is there such thing as an inverse Cup & Handle? Double bottom soon, See USO attached.
Noticed that for all of the news, Greece drama and negative futures last night, S&P really didn’t end up too bad. 200 day and 2055 seem to be providing support now; 150 day may if it moves up any. 1 trade I’m contemplating is XIV, and inverse VIX play. Seems to be finding support at about 38.5 – down from almost 50 last week. I would only look at this if you have a solid understanding of VIX instruments and term structures. The nice thing about XIV is it’s strength is the weakness of VXX – i.e. it goes up when VXX suffers from contango, which it almost always does. So, if the S&P finds its footing, this would go up quickly, but can also do good in a sideways market as well as VIX can just kind of melt off.
One other risk note – cannot ever recommend options on these – learned that one first hand. A major part of the option premium is volatility. So, betting volatility is going down with an item that loses value as volatility goes down…doesn’t end well. You can get the call ‘right’ and still lose on the trade – ex. VXX puts – don’t try that one!
But won’t chase a higher open tomorrow, certainly without confirming signals.
USTs did well in the otherwise down day yesterday. TLT up 1.9%. On good volume.
Interesting pukllbacks (up) in major indices. FXY seems to be building. If a rally ensues – and signs are that it will – could be very bad for general equity market.
If you do a comparison chart of XLE to SPY you’ll see relative prices back to 2005 levels… Attractive.
What happened to OIL overnight? Wow
Got down to just above 50% FIB as CF alluded.