EDIT: This report was finished by Sunday late afternoon. When the futures opened, the Greece Crisis had taken a turn for the worse and the reaction was strong. Interestingly, most of the reaction is as expected in this report. I decided to wait until Monday morning 7 : 00 a.m. to release it to update as needed . Not much needs updating, since the expectations were downside anyways. Lets take a look at the charts/ report as written Sunday, and I will add new thoughts in blue if needed.
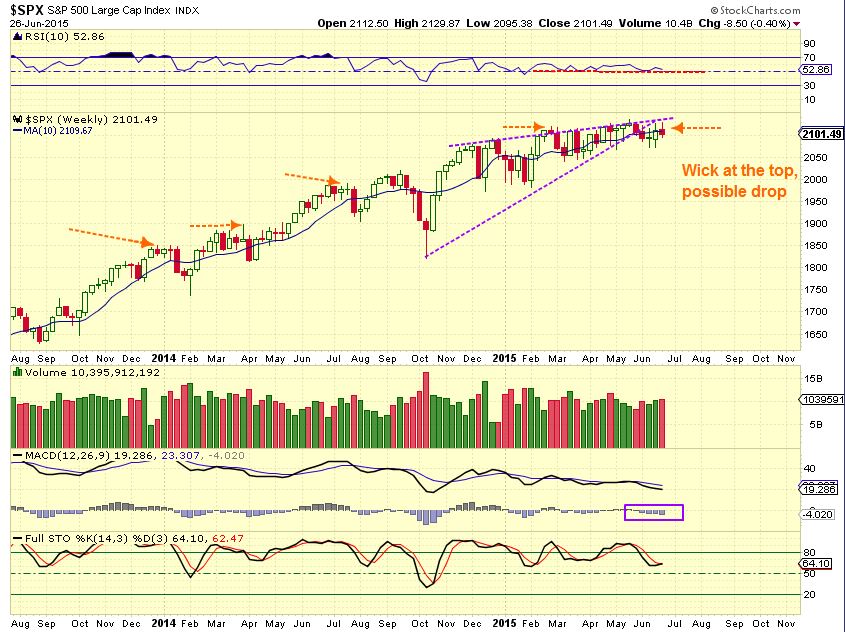
SPX WKLY – This week we still have the bearish wedge, and a wick on top could signal a drop
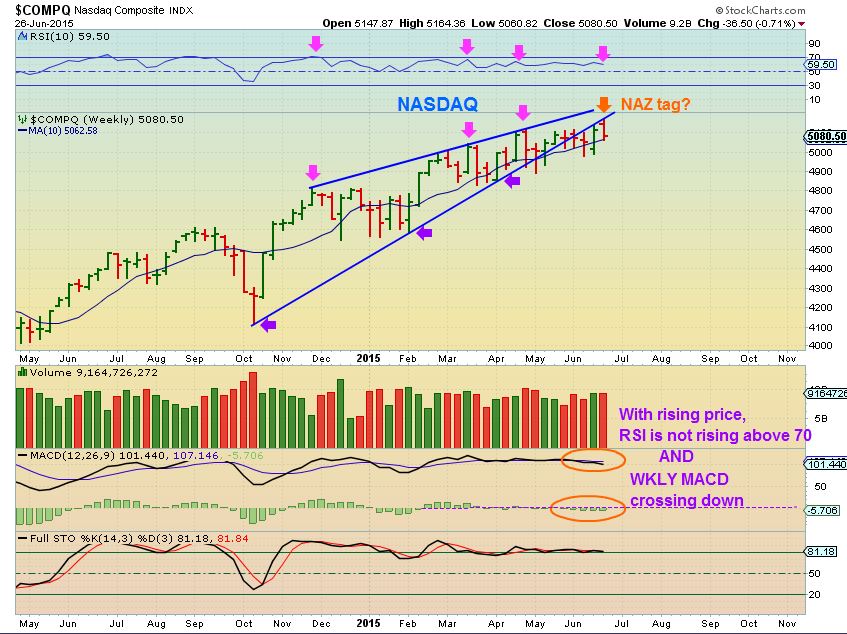
NASDAQ – several indicators are showing weakness on the weekly chart
EDIT: It has been announced that Greece will not open their Banks until after July 7th and their stock market is closed. ATM’s will only allow 60 Euro withdrawls. Our futures are down as expected above, but knee jerk reactions do not always have strong follow through after the panic subsides. We will have to let the dust settle. Next is IWM, USD, OIL, NATGAS, Precious Metals, etc
I will leave this report as written Sunday pre-Greece reaction, and edit in blue if necessary. OIL needed a new chart added.
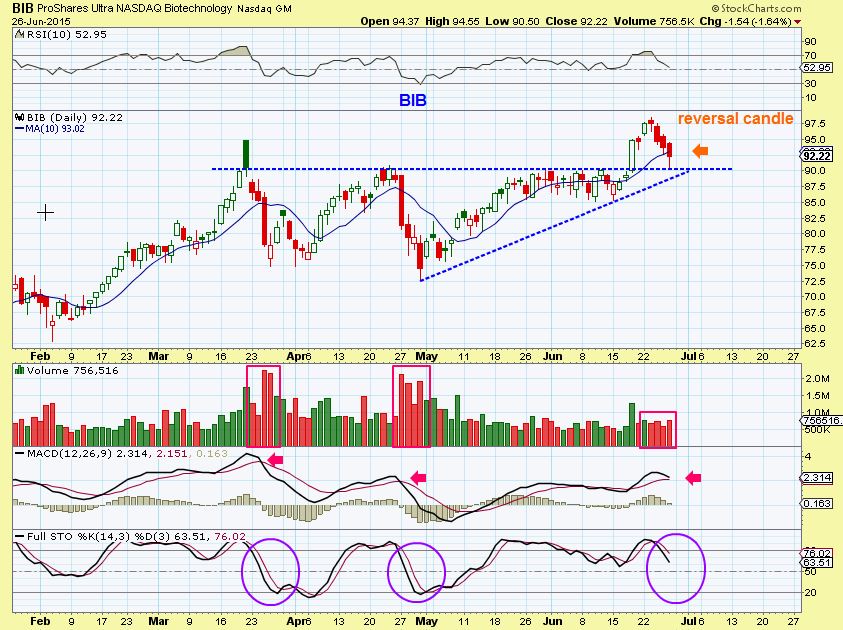
Last week I had pointed out the break to new highs in the IWM, RUT, BIB , etc. I expected a back test and pointed out support
IWM June 23
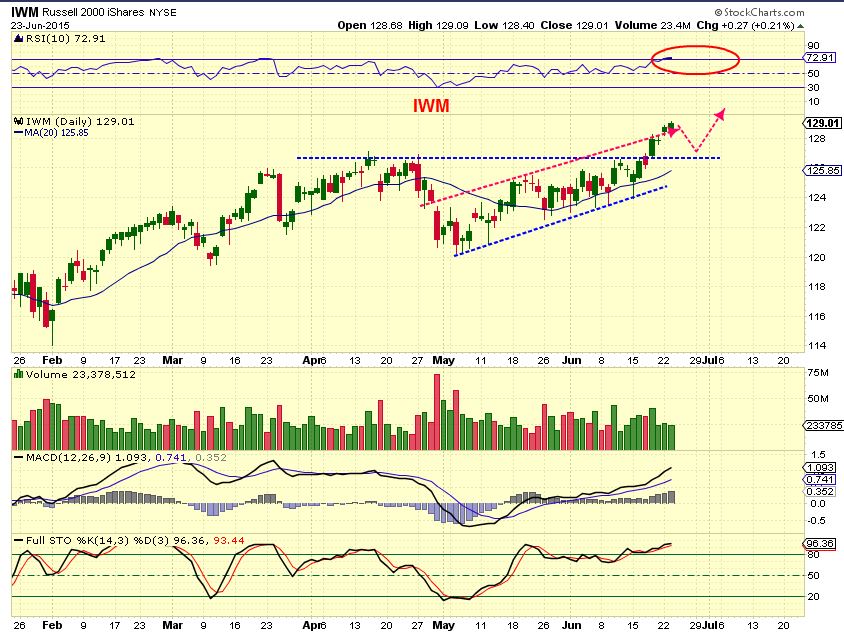
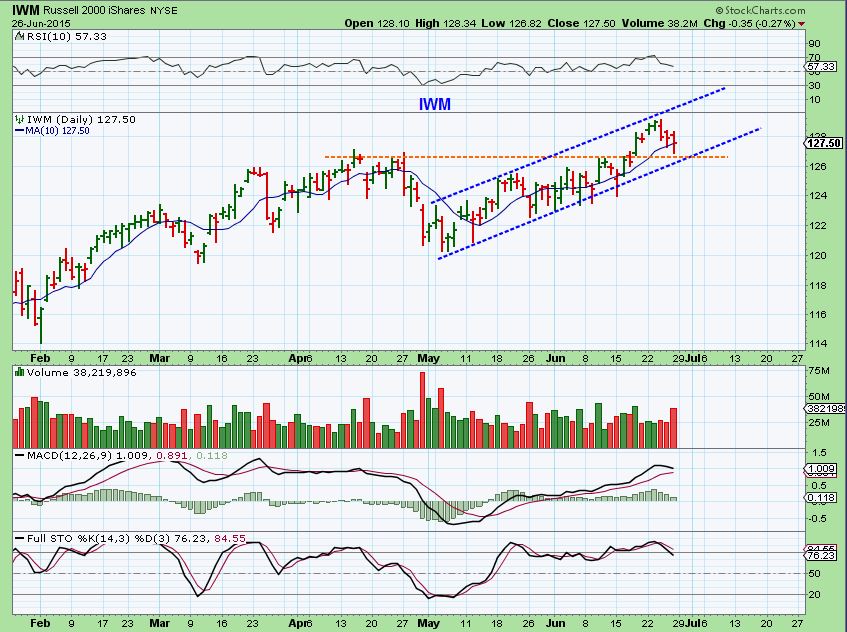
IWM – Back test at the support area and buyers came in. That could be bullish, but the volume was pretty strong for a down day. If selling were to pick up, support could be broken.
BIB– looked bullish with that reversal candle at support too, and volume was much lighter this time than in past selling.
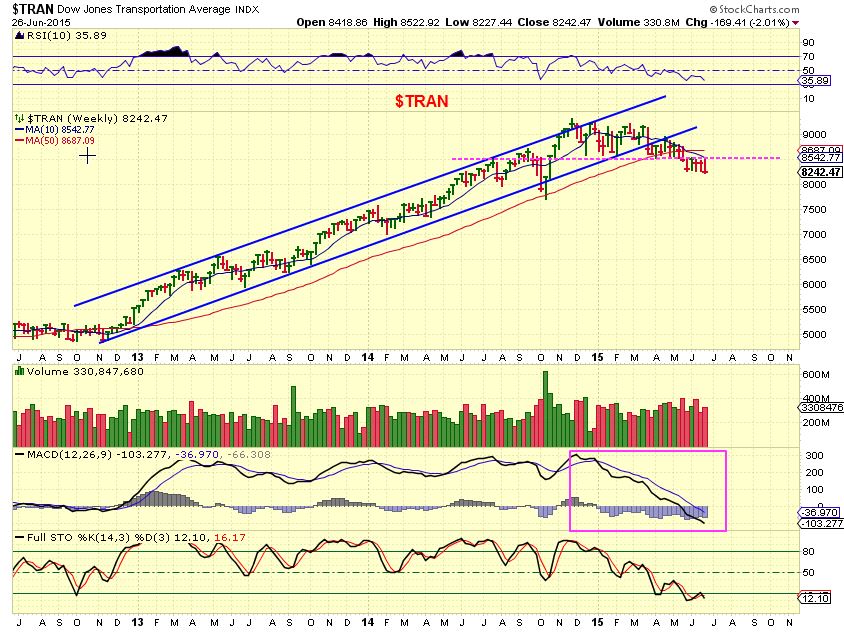
More bearishness – The TRAN (Think Dow Theory) tested the break down and couldn’t recover on a weekly basis twice
Reminder:
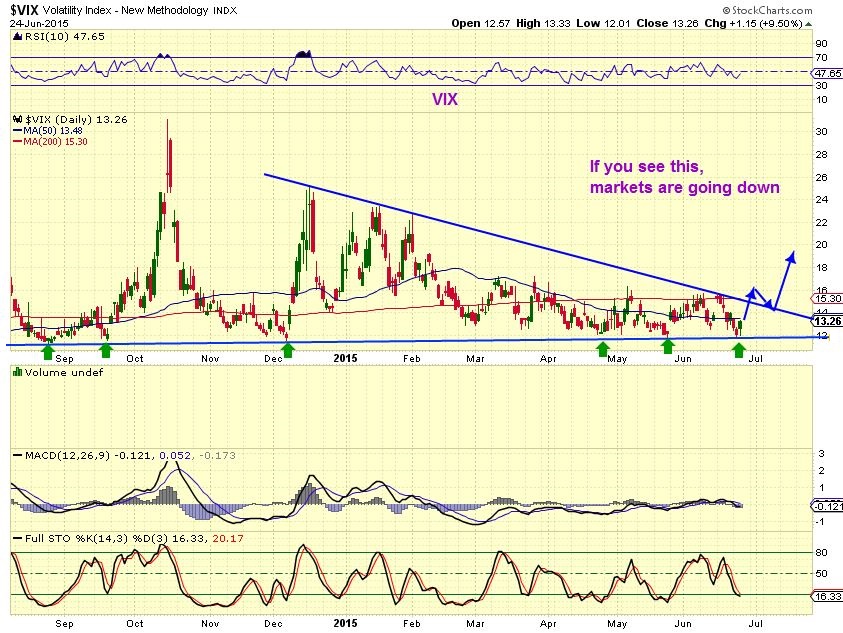
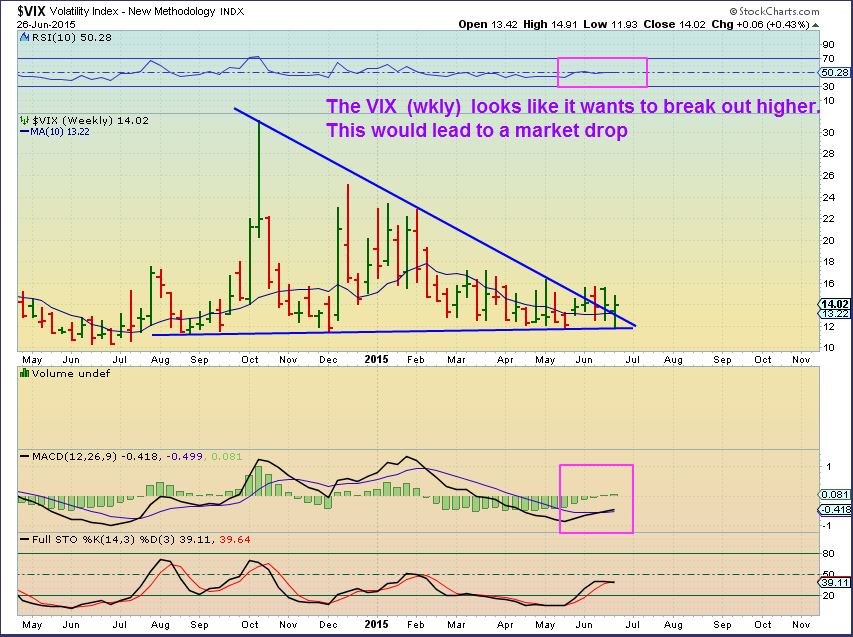
I pointed out here on June 24 that the VIX breaking out toward 16 would likely send the markets lower.
Friday the vix turned down at resistance.
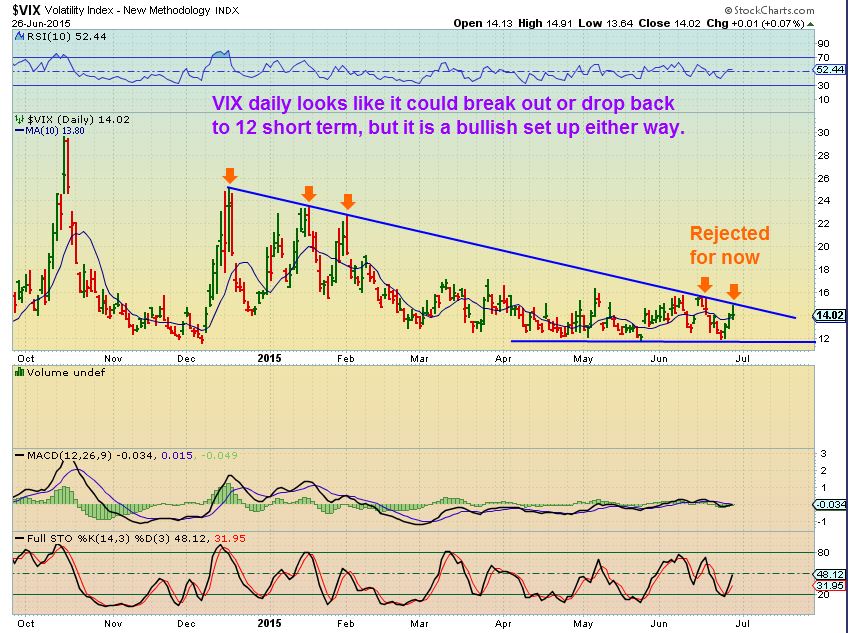
However – The weekly Vix chart looks like it could be breaking out higher. The Vix has a bullish chart. As for possible bearishness in the equity markets ? I will discuss another observation at the end of the report.
On June 8 & June 12 I pointed out that I would be watching for a possible H&S forming. It could lead to a trend change, but…
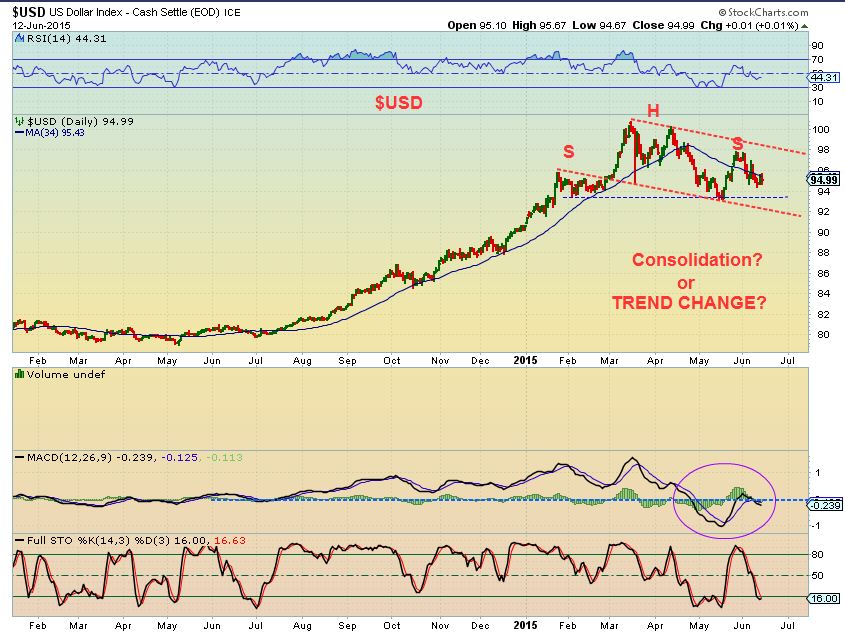
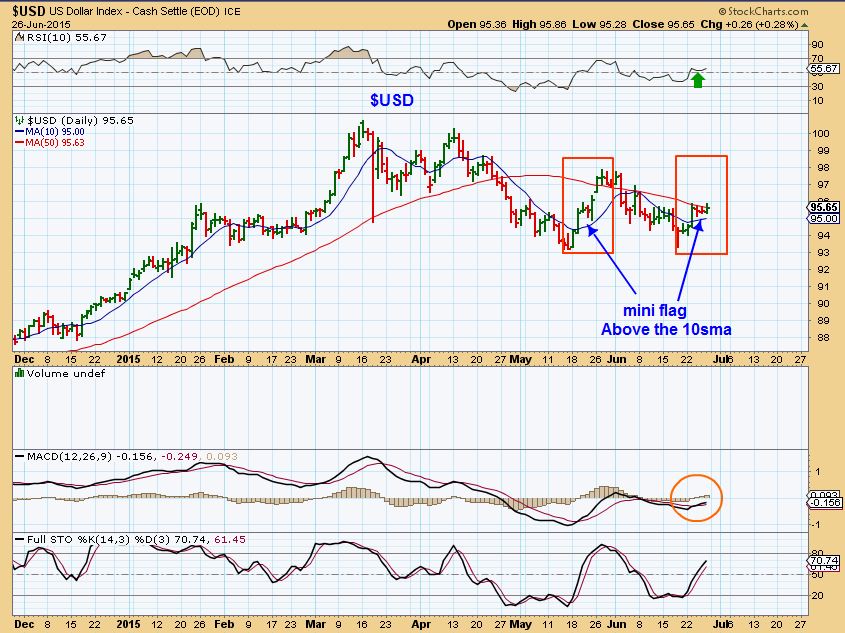
USD – Even though the H&S hasnt been negated yet, this daily chart looks more like a bull flag coiling under the 50sma and above the 10sma. A similar bull flag occurred in May (orange boxes) . In both cases the MACD crossed up , so for now, watch for the 10sma at 95 to hold. I expect a Higher dollar and that could affect Gold & Silver .
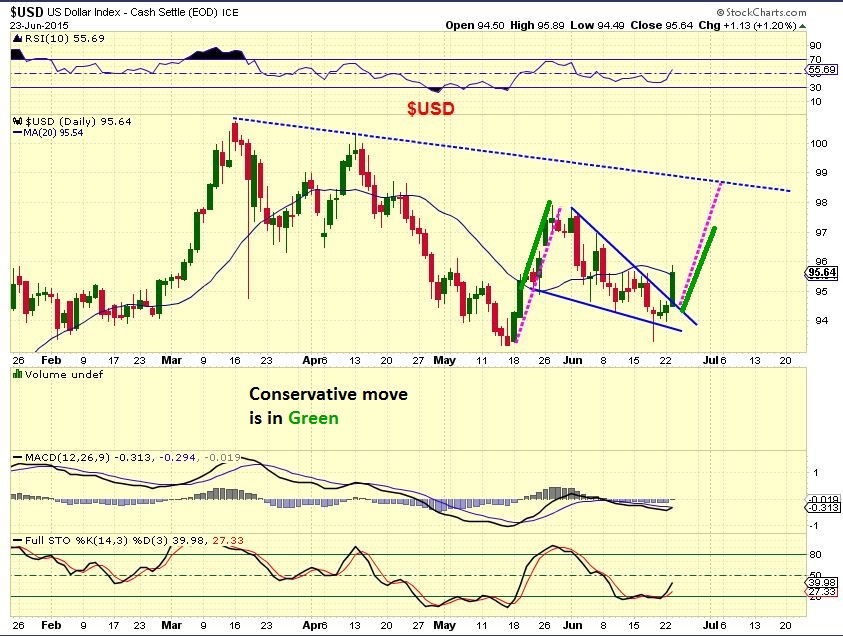
I had posted this bullish chart of the dollar on June 23. I am watching the 97.88 May highs. (EDIT: The Greek crisis has popped the dollar higher since writing this)
In past reports I have made it clear that I had been stopped out of most Oil stocks and I was not jumping back in just for the sake of being in. I want to see some follow through. I am currently getting a mixed picture in OIL.
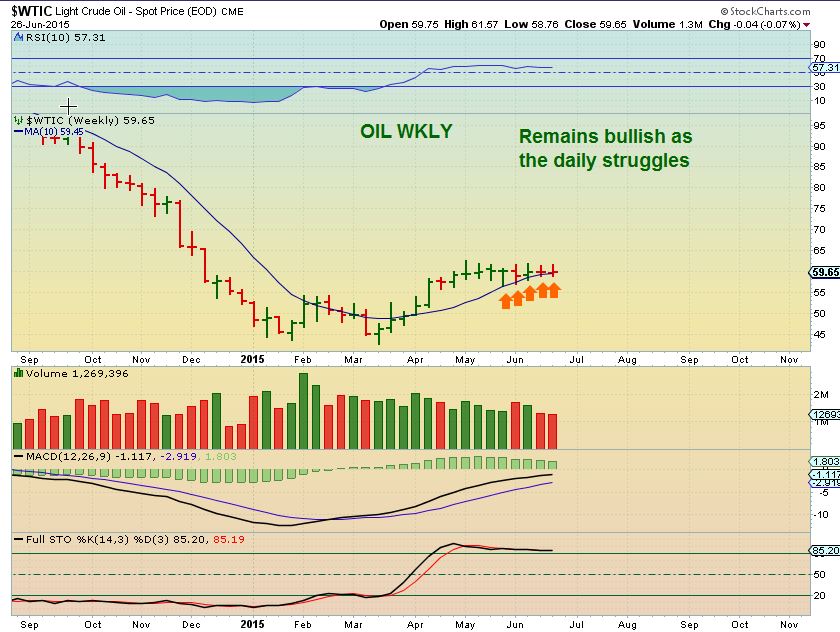
$WTIC – Wkly chart remains bullish
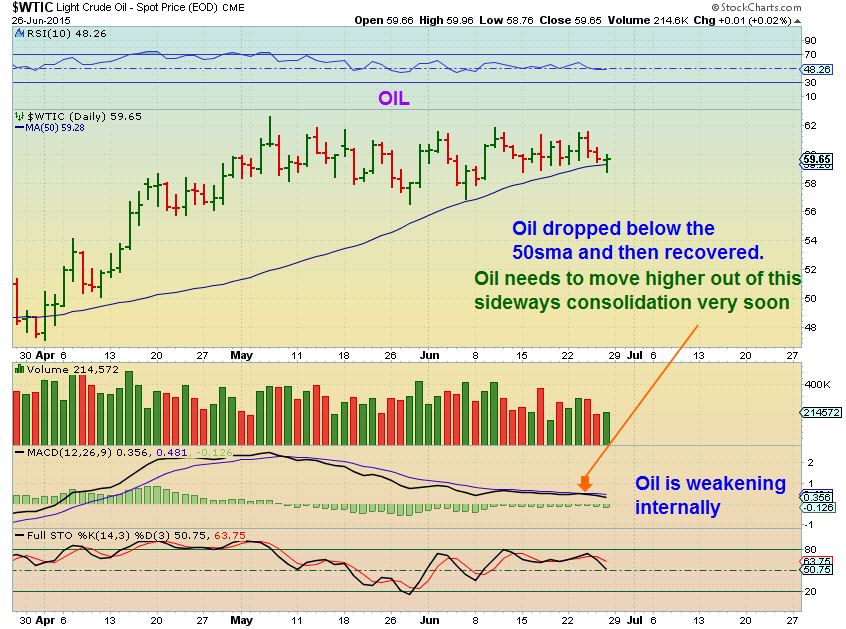
WTIC DAILY – Weakening MACD, but recovered the 50sma after a brief dip below Friday. We really need to see some follow through buying here soon.
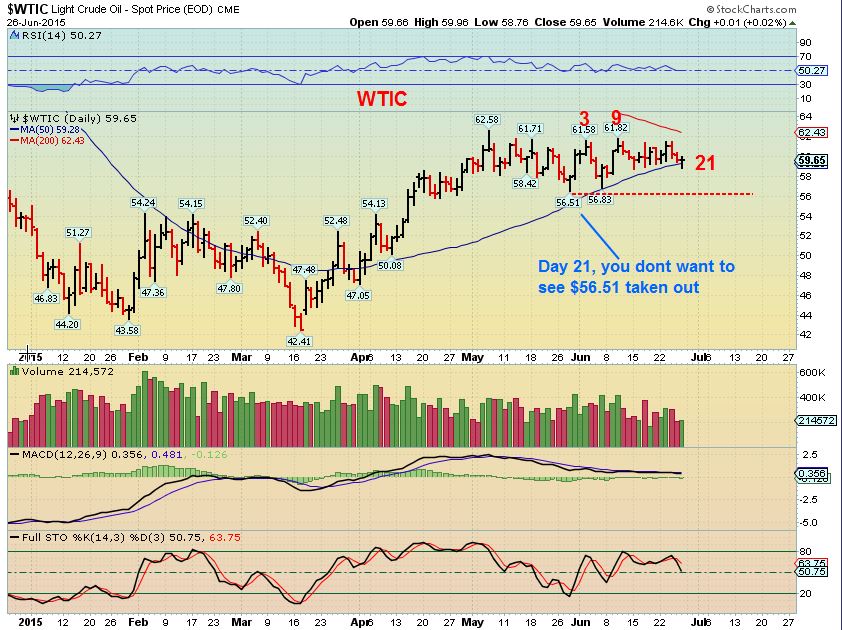
(EDIT: New chart added here monday morning. Oil has dropped $1.50 since I wrote the above. The lows are well below Fridays lows this a.m. , and it’s on day 21- likely dropping down onto its DCL. You dont want to see it take out the May lows of $56.51, but you also probably dont want to hold ‘long positions’ waiting to see, especially if you’re leveraged. Better safe than sorry) I have no position as mentioned last week until I get clarity.
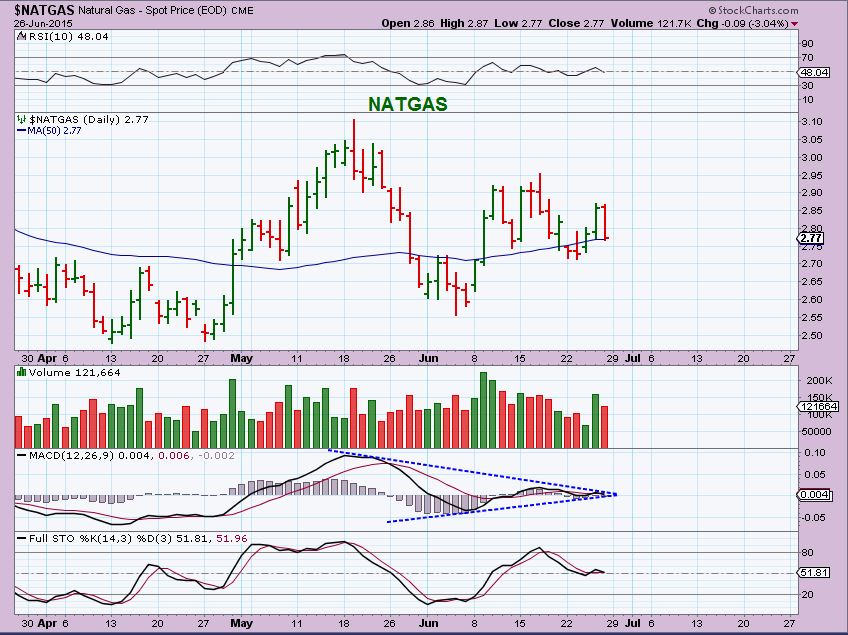
NATGAS – Looked great Thursday, turned lower Friday resting on the 50sma. It is lacking the follow through buying so far. (EDIT: NATGAS is slightly positive this a.m.)
GOLD, SILVER, and MINERS
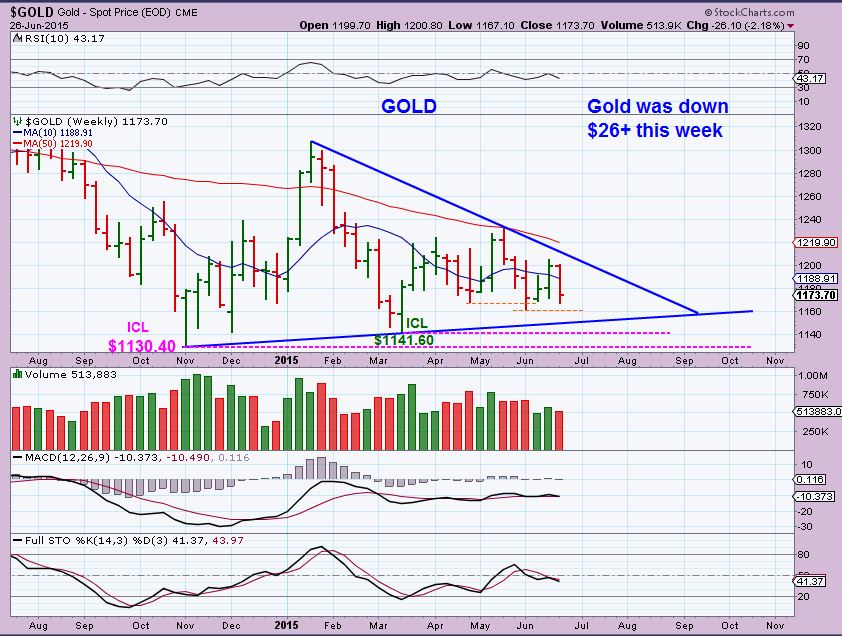
GOLD – Gold was down $26 last week
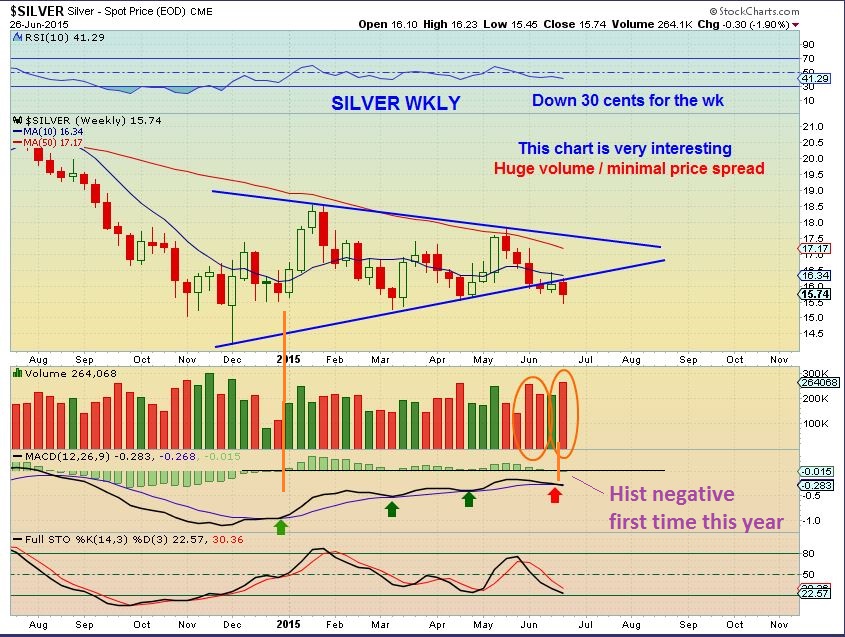
SILVER – Notice that Silver was only down $0.30 with Gold down $26. It did break down here on heavy volume, but price spread was small with such heavy volume. The weekly MACD & MACD HIST are weakening and the triangle is violated. Watch the $16.34 as overhead resistance.
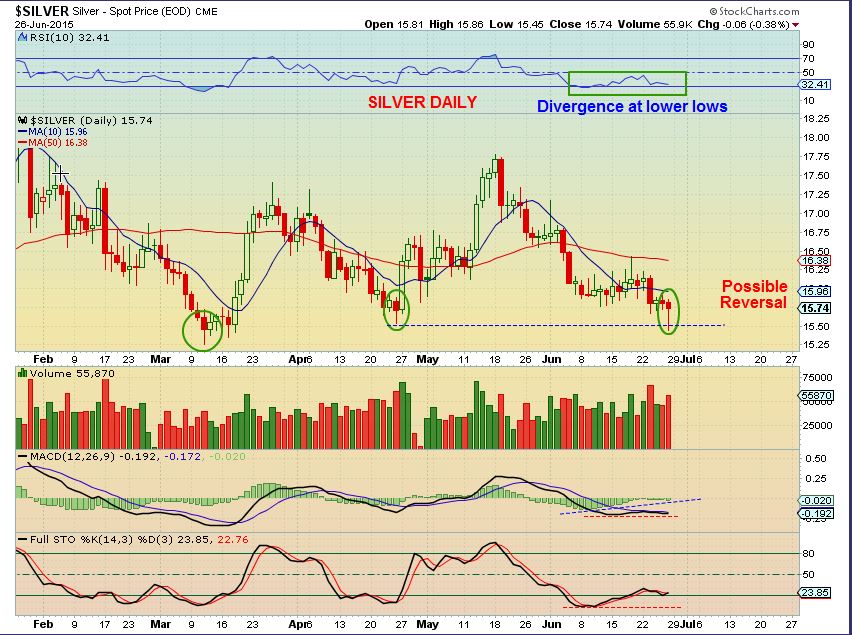
SILVER DAILY – Looks like a reversal candle after breaking prior April lows. I also see divergence at new lows. Being in the 3rd daily cycle, I would expect Silver to pop but struggle if it bounces. Watch for failure if it gets up to the $16.38 (50 sma) area.
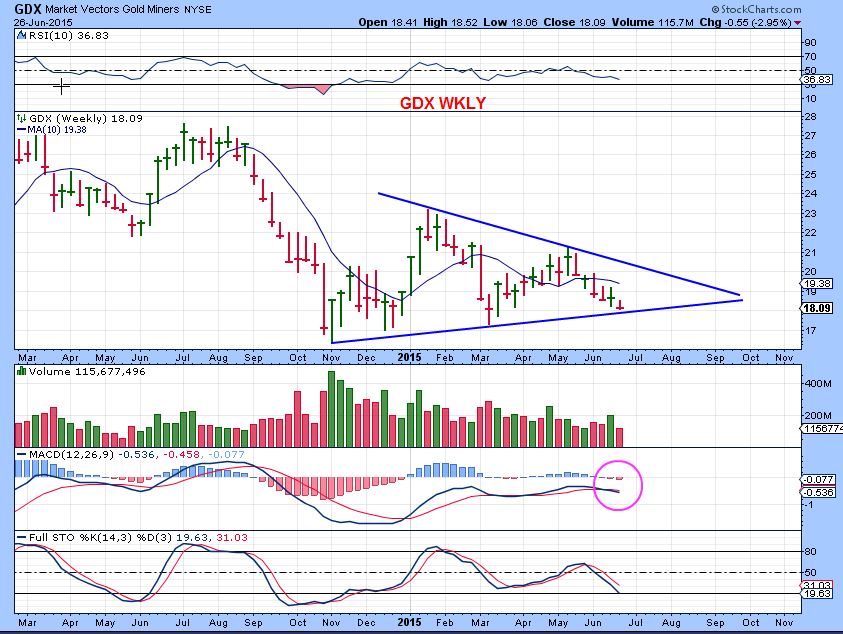
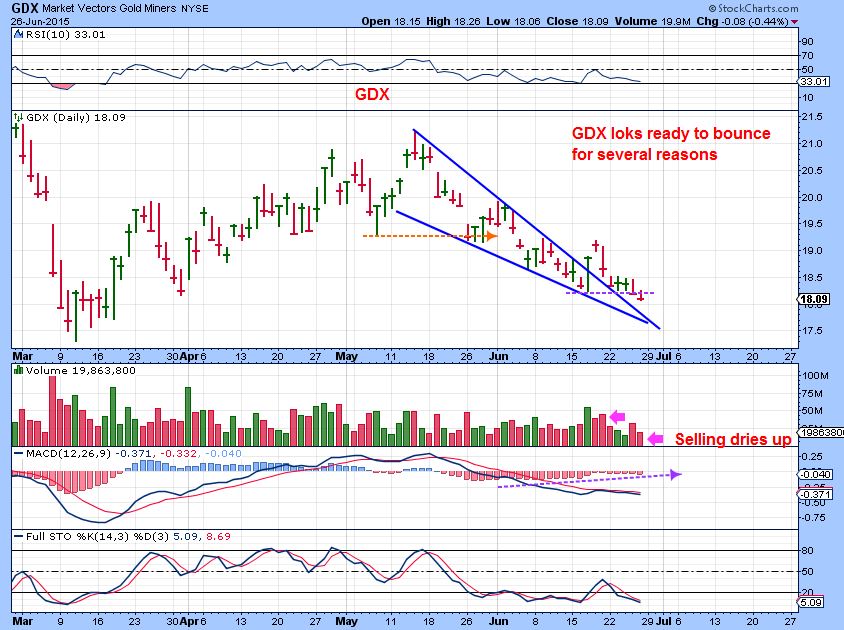
GDX WEEKLY – Miners could bounce here if the metals do, but like I mentioned last week, I do not expect a strong rally and it has been too sideways to short easily. No position at this point.
GDX DAILY– we made lower lows Friday, but selling volume is drying up. I would expect a bounce.
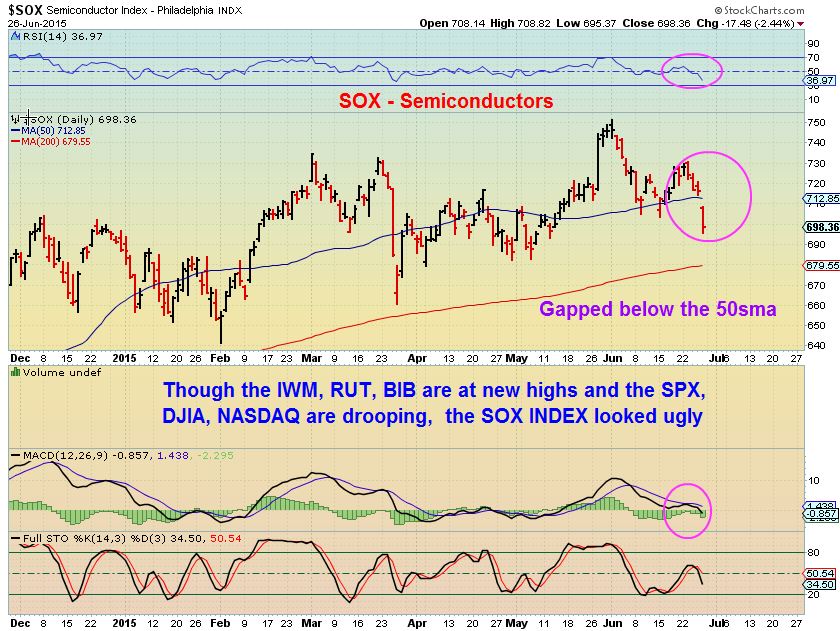
I mentioned that I would point out a couple of other bearish signs in the markets at the end of the report. There was a time when the Semiconductors would lead the markets up and lead then down, so I wanted to point out the SOX INDEX gapping below the 50sma.
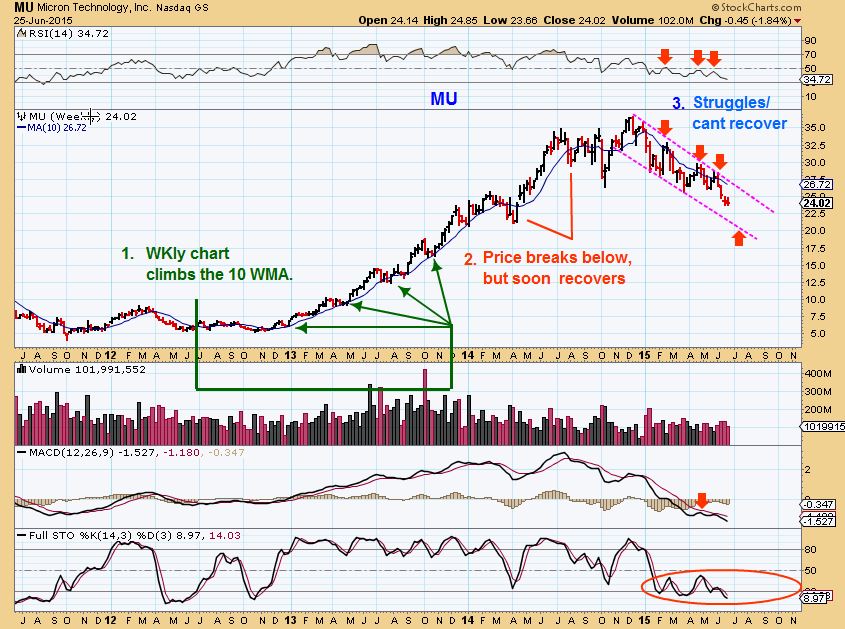
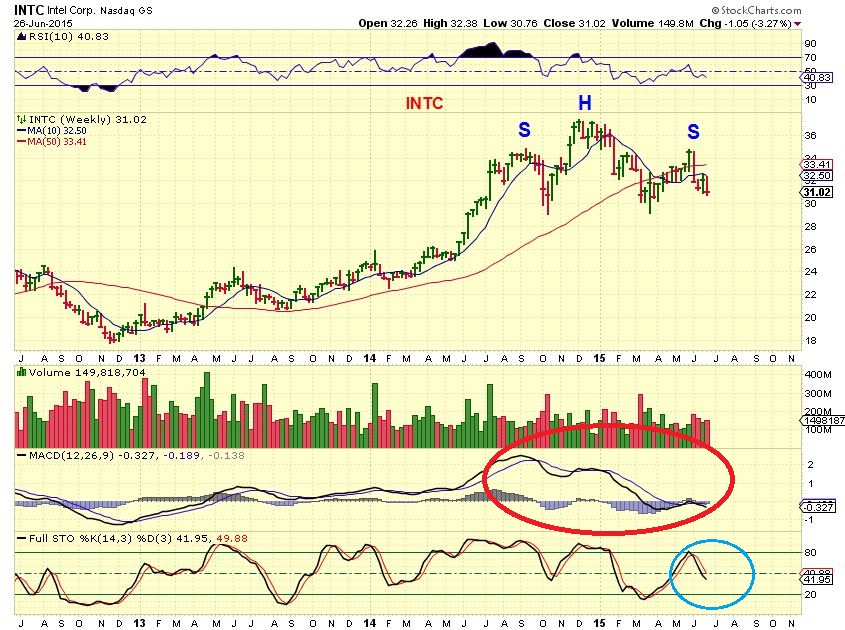
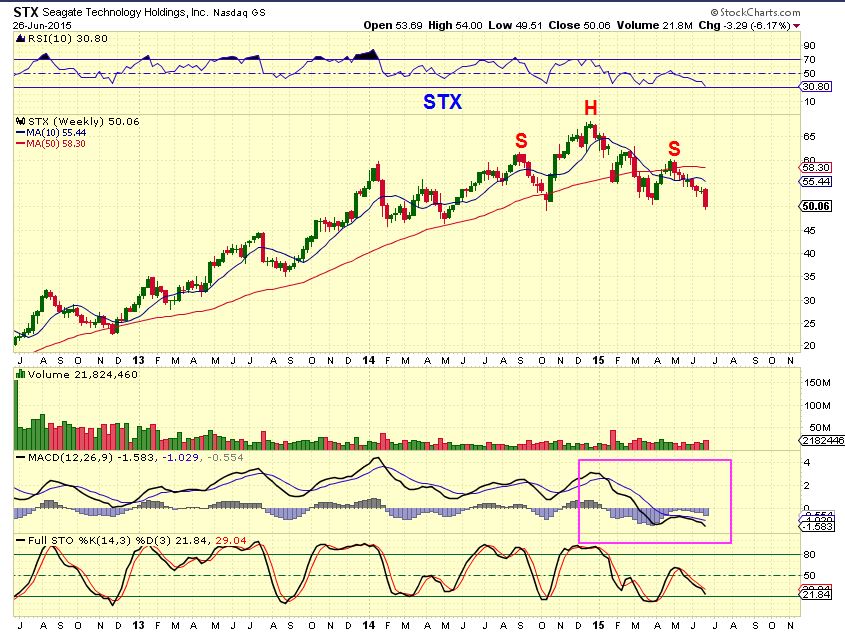
Charts below are companies that were once leading markets higher. They have broken down below their 10 WMA and their 50WMA. Very Bearish.
MU
INTC
STX
WDC
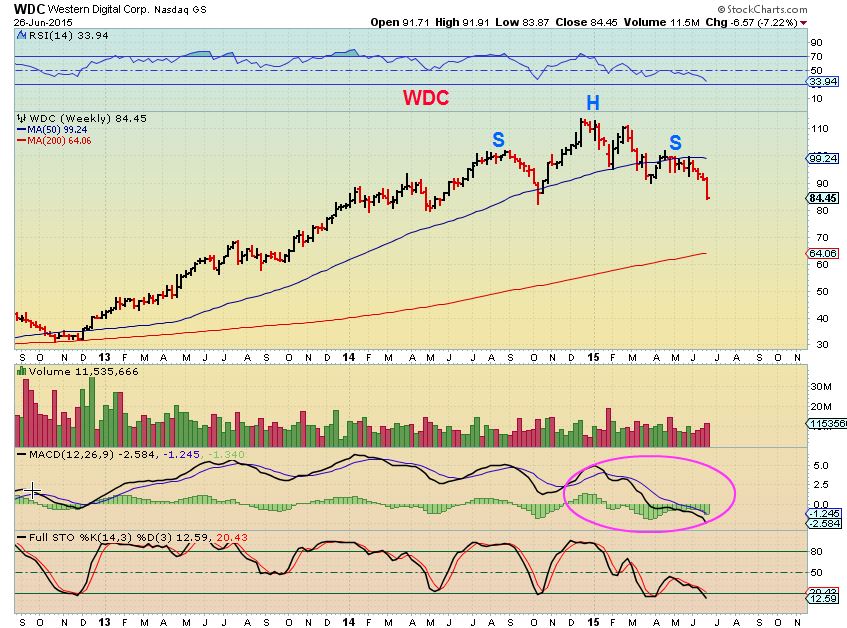
I wanted to show these charts so we can see that some popular companies that were flying high in the past 5 ys are no longer hitting new highs with the market indexes . CNBC is chatting about a healthy economy and growth, but well known and popularly traded companies charts are struggling. The VIX looks to be warning of a strong correction or pull back soon.
Edit: This week will be interesting to watch with the Greek Crisis in the headlines. There is no real way to know exactly how this may play out short term, isnt it wise to stay on the sidelines and let things shake out a bit? News currently is that the Banks and Stock Market will be closed Monday in Greece, and that can cause knee jerk reactions. Its best to let the dust settle in times like these and not guess future direction too much. We’ll stay alert.
~ALEX
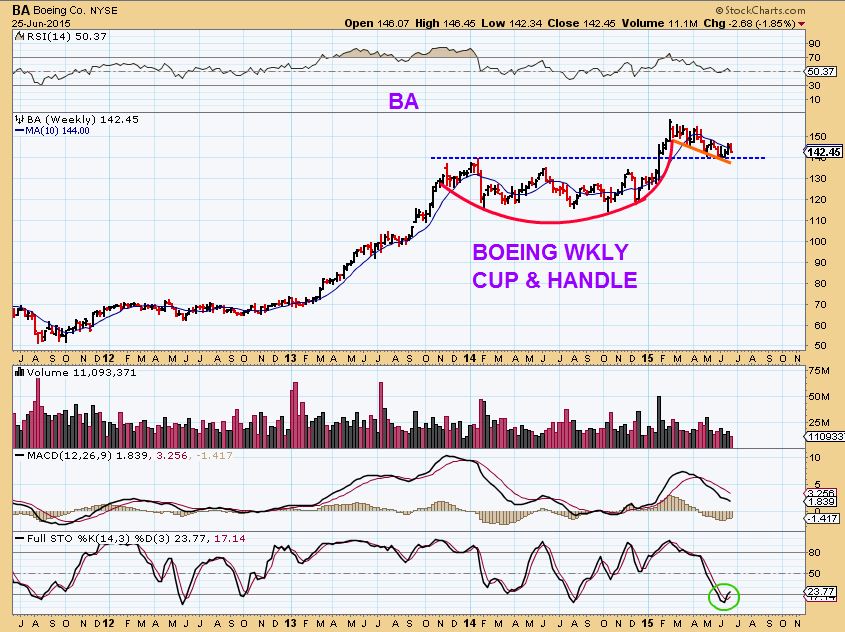
I was asked months ago which Company would I recommend if someone had a retirement account and wanted a longer term position to just Buy & Hold? I said that I liked Under Armor ( UA) and Nike (NKE) as a couple. I should have said FB too :). Well, I may have just found another nice long term set up in Boeing. (Note: This section was also written before the Greece Reaction. Caution is recommended short term until we see how things play out )
BA WKLY- This chart is almost as perfect as they get. It shouldnt pull back very much more.
3 past trade ideas that are still working out & valid.
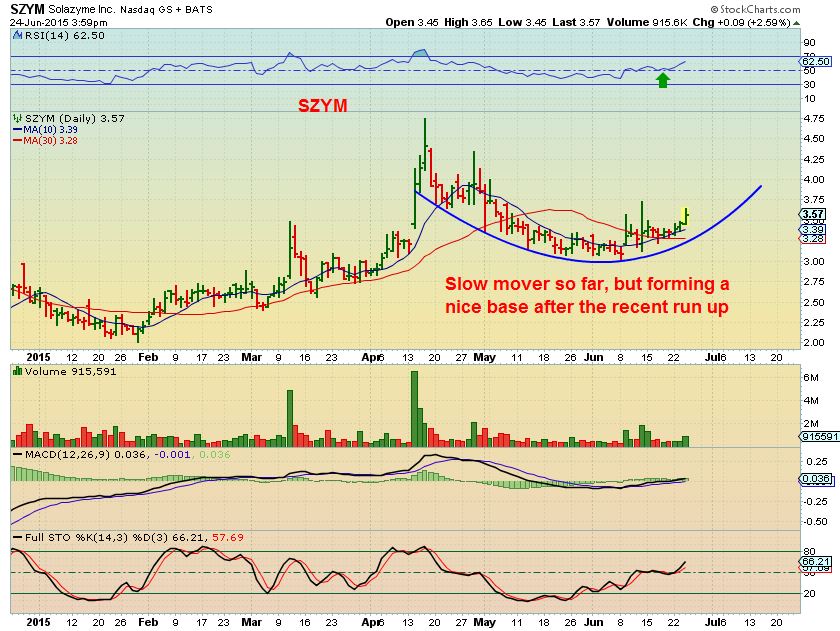
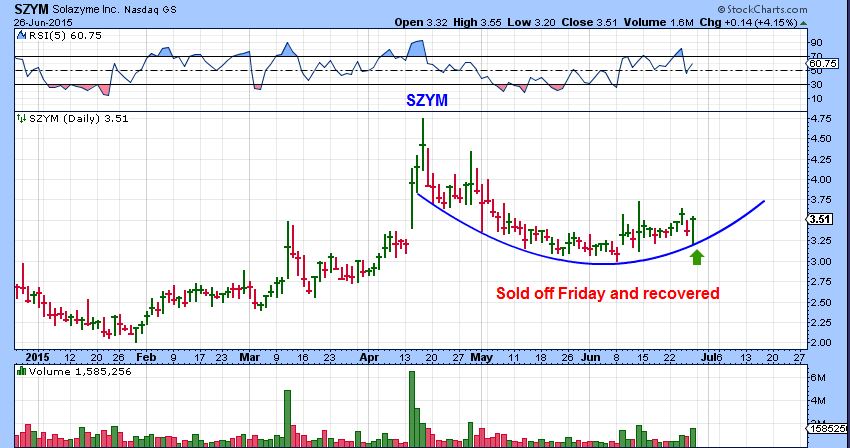
SZYM June 24 & then Fridays reversal
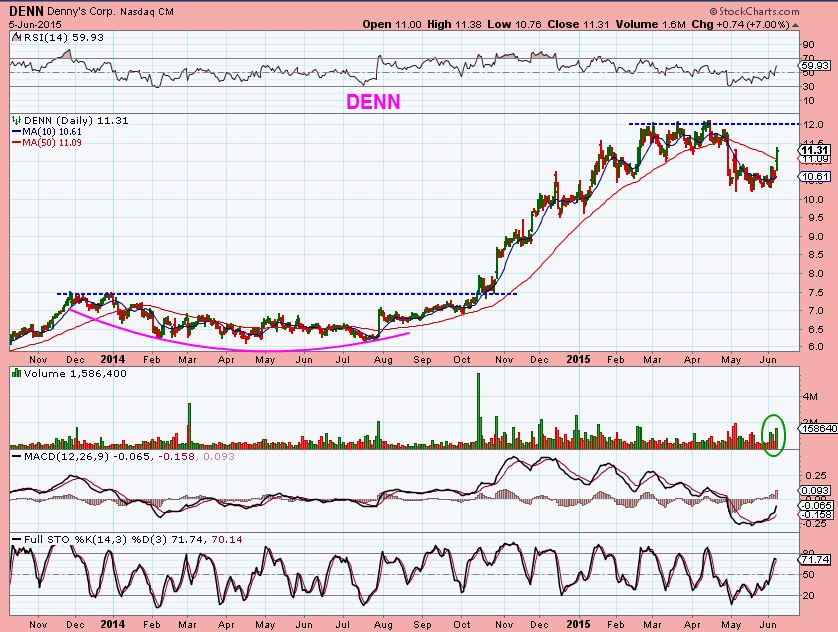
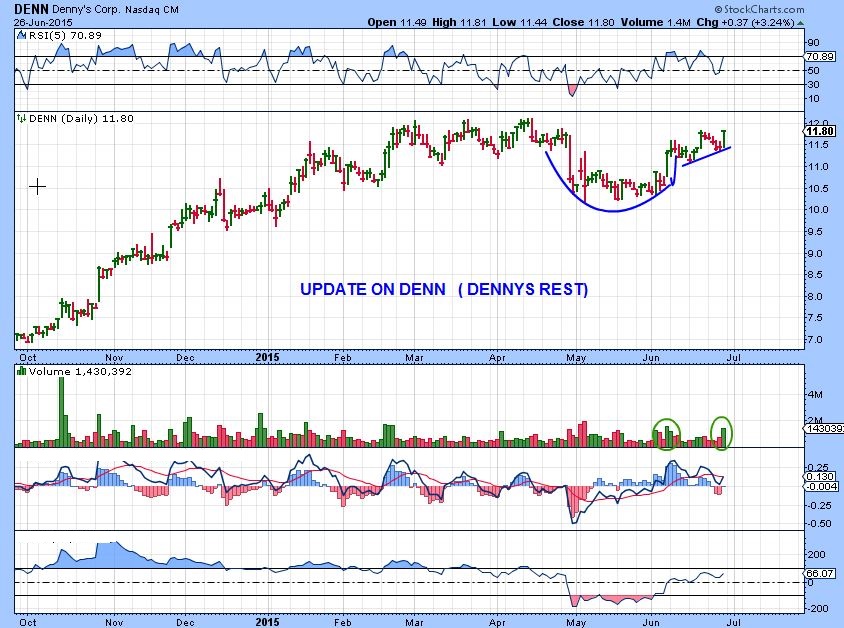
DENNYs restaurant, then and now , working its way up
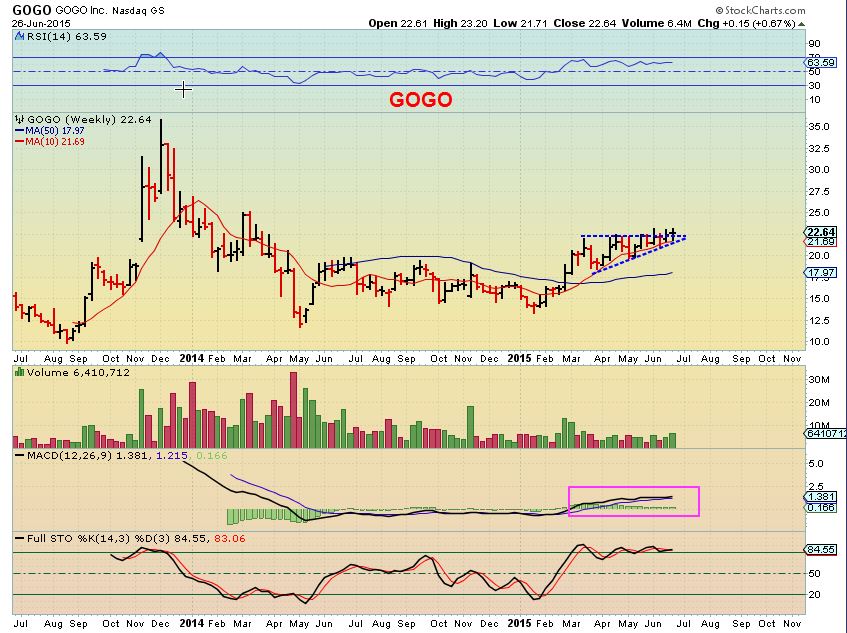
GOGO – a little bit higher, but still within the pattern mentioned earlier in June. Weekly chart below shows improvement.
VOL-A-TILITY 
 Warning Signs
Scroll to top

I have been getting not so comfortable with the market action over the last few sessions and thanks to your cautiousness I’m 100% cash pretty much since your”cash is king” post. Have only beenDT since. Absolutely will stay on sideline till things pan out. There will be many bargains after things settle down, and we will know when uptrend continues. Thanks for your ‘heads up’ and guidence : )
Thank You & I’m Glad for you. I have been quite light too, except for the occasional day trade. The charts were showing uncertainty and even Oil went from niley bullish looking in that consolidation to weakening on the daily charts. The VIX seems to be indicating a market correction, but the knee jerk reaction today may just be a quick panic drop and then bounce/ recovery short term. We’ll have to see how it all plays out.
Wish I had headed better myself!! I was stopped out on a few plays, and hate that on such a sharp drop since it usually over reacts on news like this. Meaning you may be selling on swing lows. 🙁
ditto on the cash is king..;o) except I’m not sure what niley bullish is? ;o) lol… Happy Monday All :o)
Me either, where did it say that ? I’ll edit it. thx ( I could guess that something was “Nicely bullish” ??)
welllllll, i couldddddd… but it’s much ‘funner’ teasin u…
jussst teasin…;o) look down
fixed it, thx
Nice recovery in Oil so far
The security stocks mentioned in the past have dropped sharply, but reversed higher off of the 50sma. ( HACK & VDSI for ex). interesting VDSI chart using the 50sma.
TLT appears to be bouncing at double bottom. TMF?
Strong volume too for the first hr
Is (looks) the chart from TLT healthy ALEX ???
WLT, ANR, ACI, BTU- big gainers on a losing day , big losers on gaining days 🙂
EDIT: Wow, these were up 20% when I wrote, now gave it all up in ANR and the others selling down a bit too
looks like CLF may have finally finished B and crossed over into C …. https://www.tradingview.com/x/oyesczME/
Helluva candle at the moment on ANR. Long tails up and down doji
Heres two charts of BAS. I drew the H&S on 6-10. Couldn’t understand why this former star was no moving up while other energy stocks were. H&S didn’t sound right. refresh for then and Now. Predictive
Any current thoughts on BAS, still up for the day on higher volume confirming reversal from last week? Maybe to the 50 DMA? Oil is scary though?
It was a leading indicator on the fall of energy stocks, but I wouldn’t buy anything in energy until something positive happens to more stocks in the sector. Or the USD declines, etc.
NBG again. Interesting historical context of price movement in situation similar to today. Refresh
Very interesting, what did you use to generate the results?
Twitter. 😉
I thought you had some software, TOS or something like it.
There are so many contradictions when doing charts. Sometimes, you just don’t believe what you are seeing. Refresh for a pair of charts on miners. One from 5-26 and one from Today. I was trying to point out the similarities with the two arrow points. I did take the trade, but got out way too early. Never sure.
Last night in EU every economist on the planet was telling us how Euro was collapsing. FXE up 0.8%…
NB. More importantly FXY up 1.1% and gaining strength. THIS could be surprise of the Summer. A rally in the most hated major currency on the planet. As has been discussed here before, if Yen has a major rally it could well be strongly negtive for S&P etc due to Carry Trade.
Puerto Rican Governor Padilla has just stated that the Island is No longer able to make payments on it’s $73 Billion debt owed to creditors.
Here we go ! Heads up.