
VOL-A-TILITY
Thursday the Dow shot up 230 points. Friday the Dow sold off, down over 100 points. Monday the Dow shot up 166 points. Tuesday the Dow went up another 60 points, but sold off and gave most of it up into the close. Wednesday we gapped down and closed down 178 points. Currently at 6 a.m. , the Dow futures are up 100 points. Volatility is the order of the day, I should have used a picture of a roller-coaster.
.
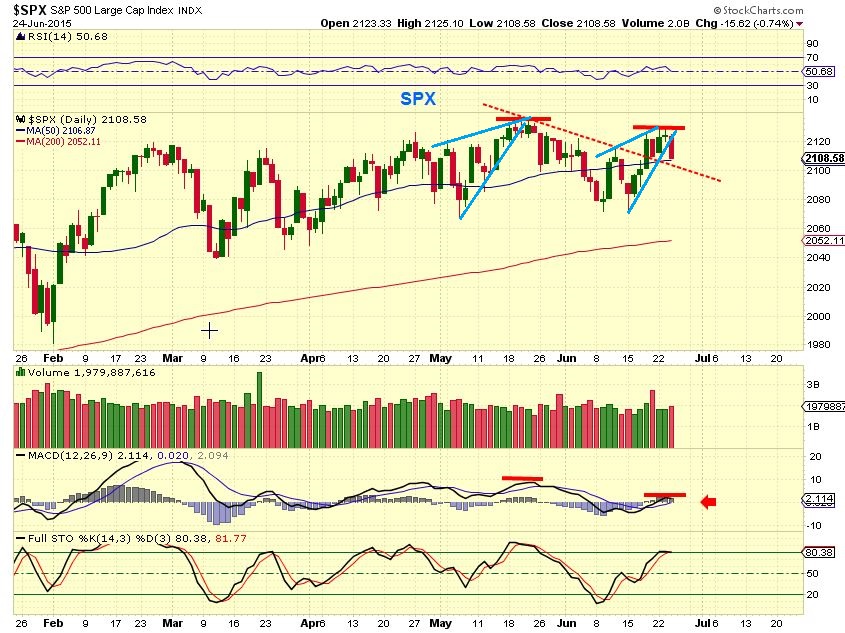
SPX – I pointed out these wedges and said I was expecting a sell off. Now we have a back test of the trend line break and a tag of the 50sma. Will this hold and give us a genuine break higher to new highs, or just more up & down action?
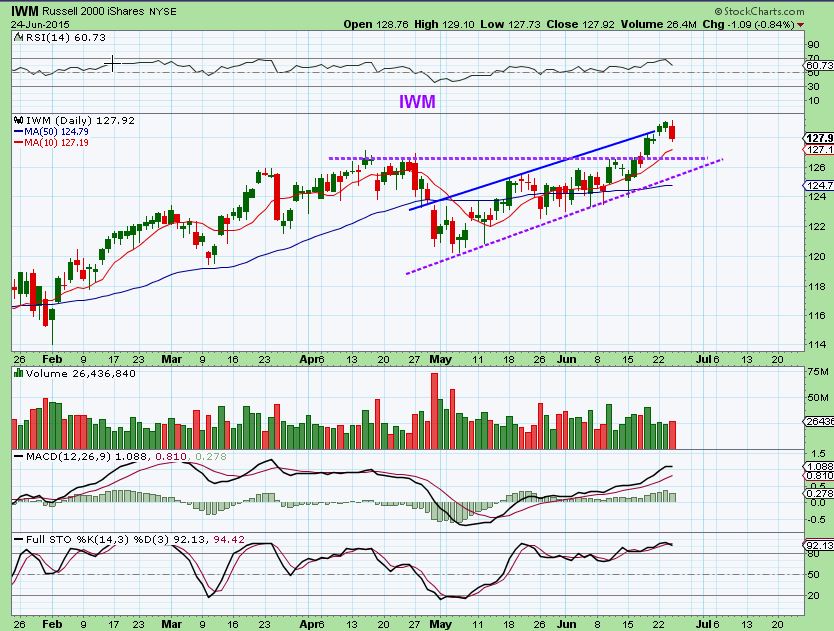
IWM – the IWM actually already broke to new highs, but I expected a back test, as shown here
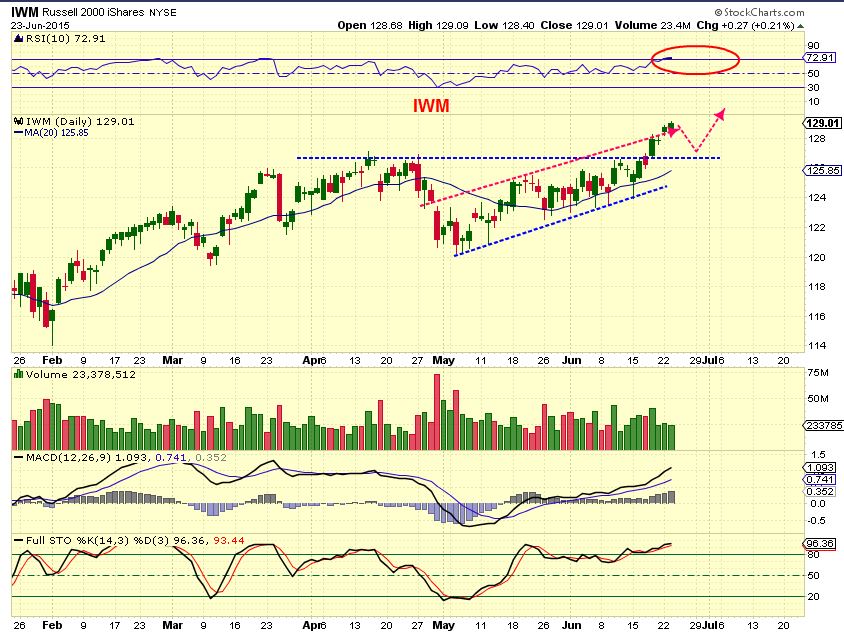
This is where it gets interesting…
After also breaking to new highs, the IWM did start a normal pullback Wednesday
BIB – Also breaking to new highs had a normal pullback
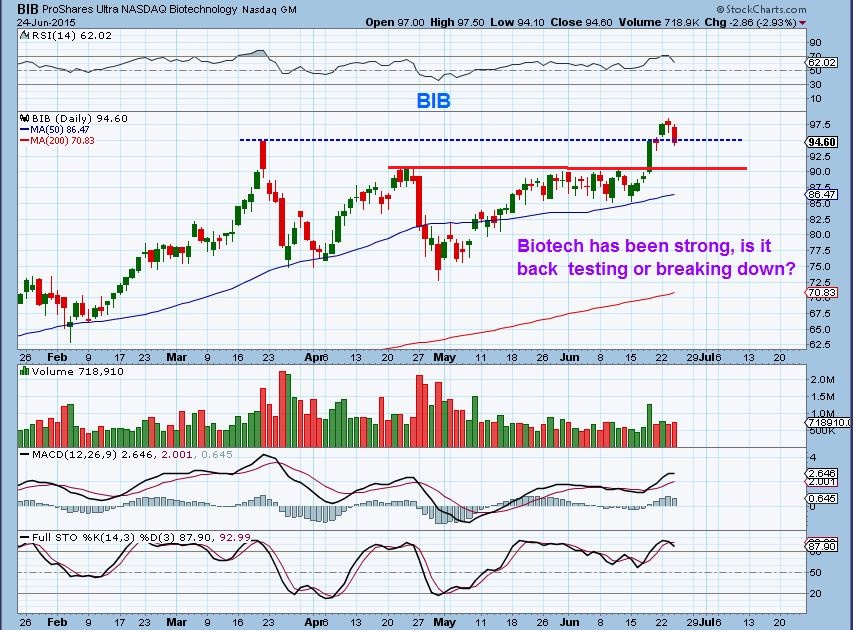
The question is, will these remain normal pull backs?
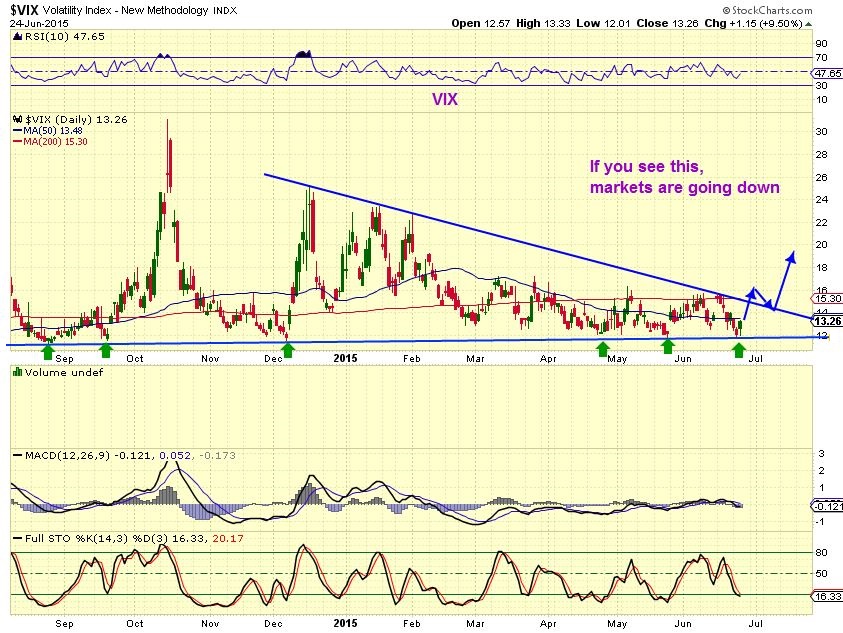
The VIX repeatedly bottoms near 12-13 and then bounces. When the Vix bounces up & Down for a few days, the markets bounce around (Volatility). When the Vix runs higher like October and December, markets sell off. This is getting interesting, lets keep an eye on the vix and remember the Dow Theory.
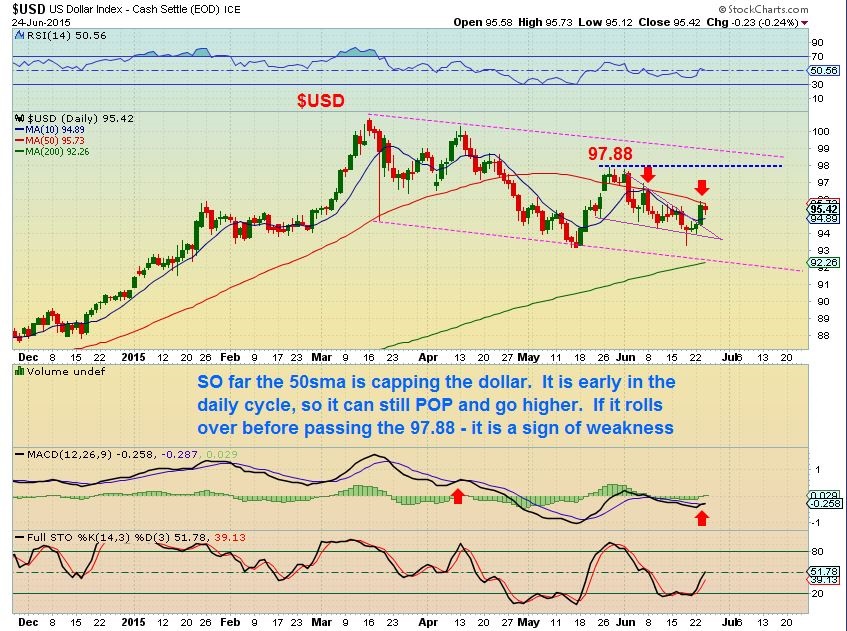
The USD is a complex little set of moves too, held under the 50sma recently. I expect it to break through, but can it move higher than 97.88? Thats an important area to me.
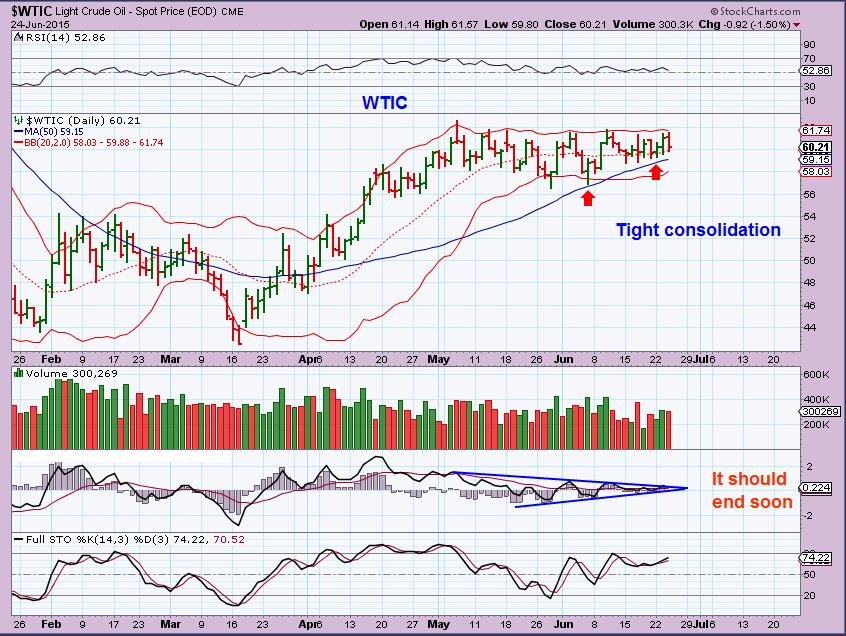
WTIC – oil is a bullish set up so far, squeezed between its B.Bands. This should end soon.
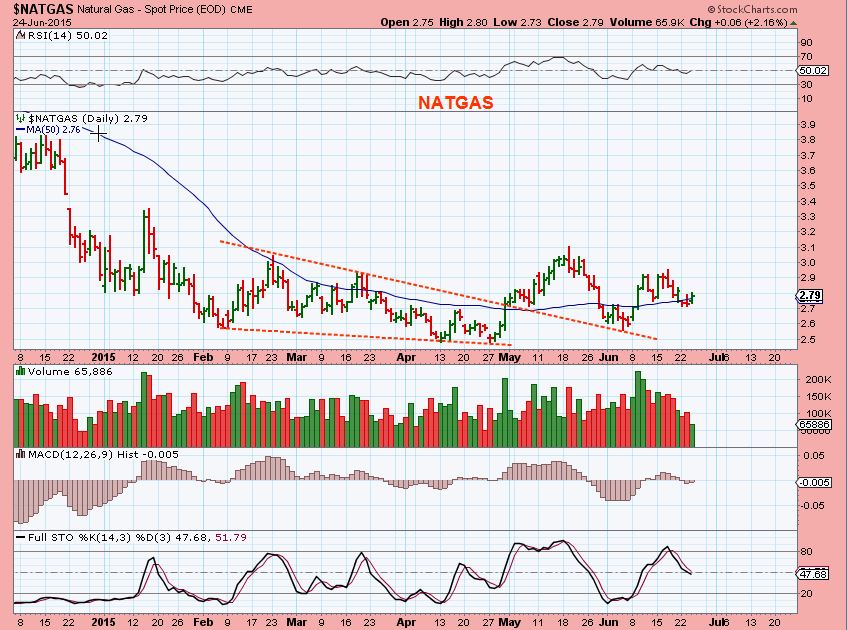
NATGAS – Broke out in April, back tested and is now dancing around the 50sma
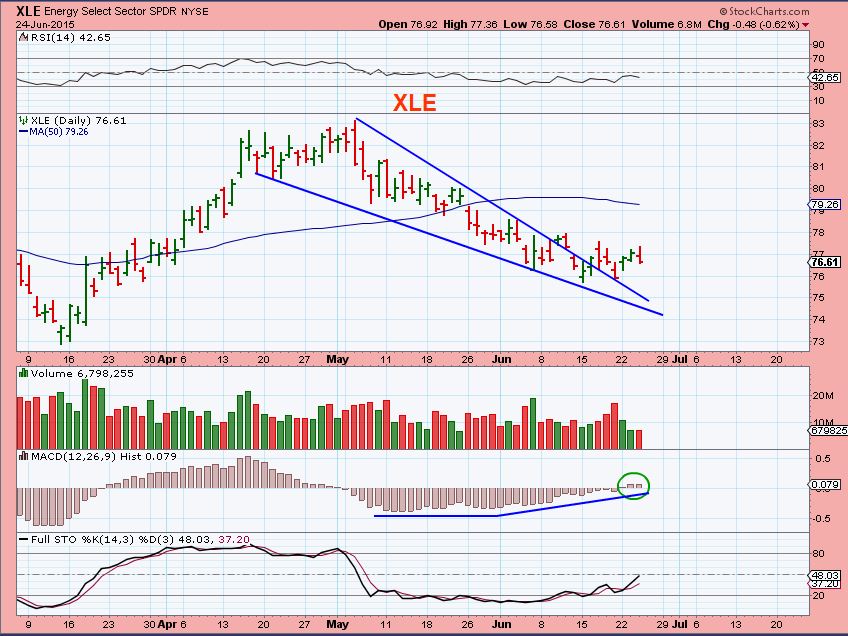
XLE- I see this as improving ( MACD HIST ), but I’d like to see some solid buying come in. I think if OIL breaks out higher, the XLE will move up too.
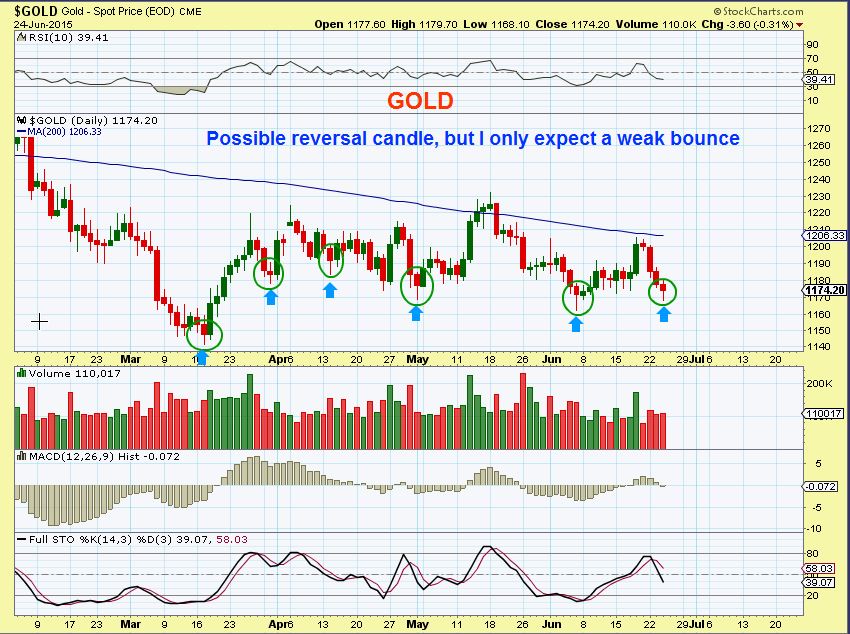
GOLD – that may have been a reversal candle yesterday, but I am not expecting more than a bounce. We have had these candle before, I’m watching that 200 sma. I am still not trading this, but “MIGHT” short a bounce expecting it to then drop into a dcl.
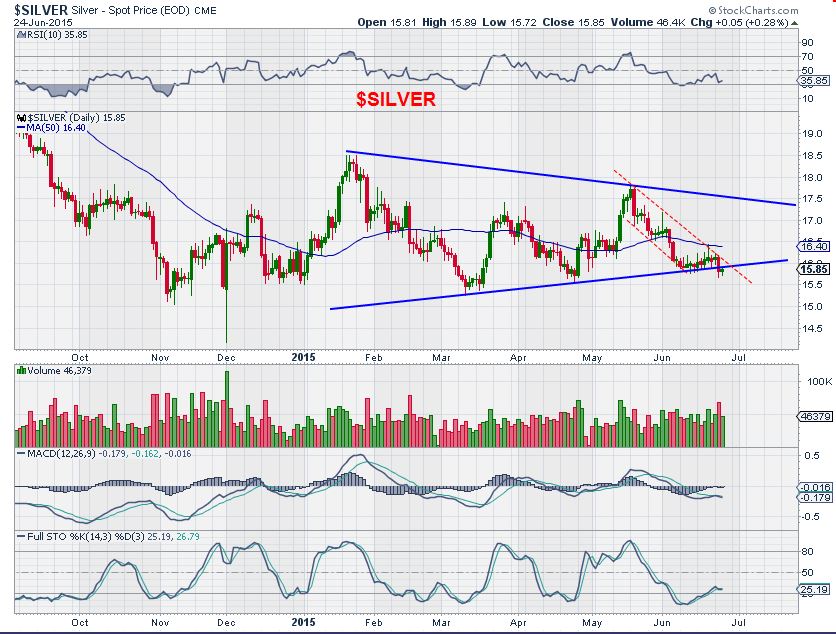
SILVER- Silver finally sold off Tuesday, but had no follow through on Wednesday.No position long or short expected right now.
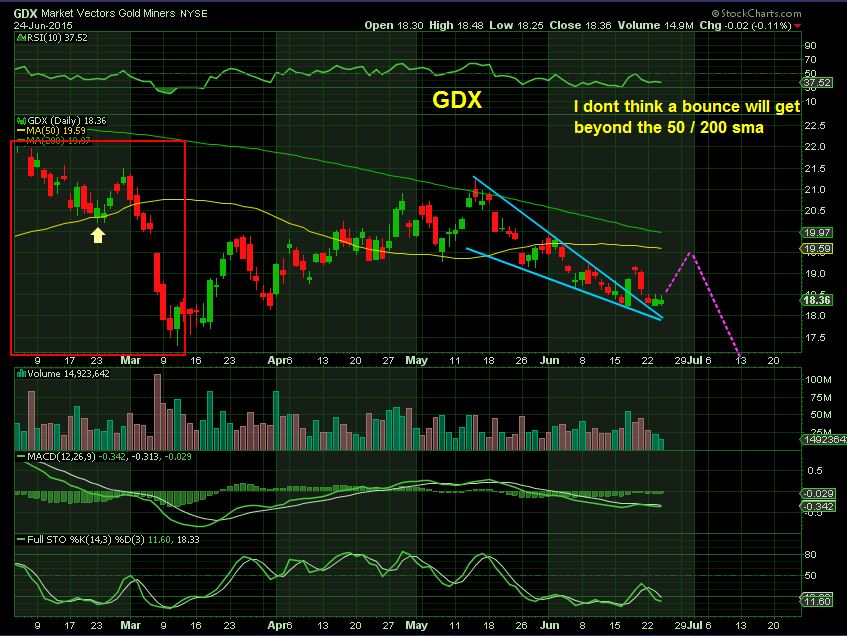
GDX – I drew this to show the bullish look to GDX, even though I’m not overly bullish. I wanted to show this so people wouldn’t short it really.
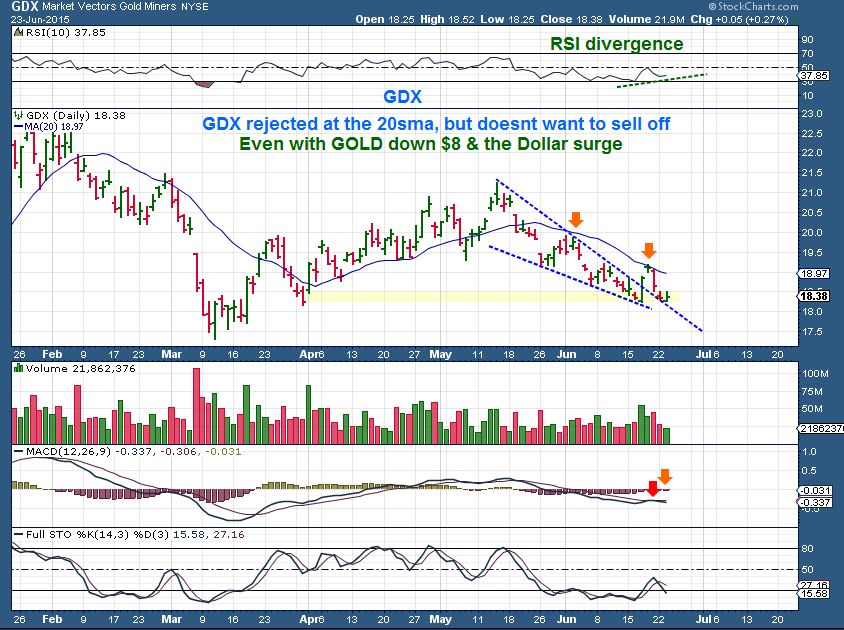
GDX – SO now I still see that it could bounce after this back test. I am not buying NUGT or Calls or anything at this point, because lately its up 1 day , down the next up 2 days , down 2 days. I expect a bounce could go to the 50 / 200 sma and roll over. THAT could be a DUST buying opportunity. I wont know until we get there.
I am still seeing plenty of trades with bullish set ups, but these markets are volatile and jumpy. This can make it difficult to go long and hold positions confidently. There is nothing wrong with being in Cash until the markets present some real nice low risk set ups. As I mentioned, we wake up and Dow futures are up 100 points, then next day they are down 100. The sideways chop makes it difficult, you can wait for a trending move (possibly Oil soon) .
I will still post a couple of charts for our experienced traders that are just looking for a few trade ideas. This does NOT mean “Take this trade”, it is more or less being posted here for those that know how to trade on their own . I am mostly cash, taking an occasional trade intraday or holding for a day or two while waiting for OIL/ENERGY to break out 1 way or the other. I am also waiting for a possible trade in Metals / Miners, possibly short at first. Experience shows that Patience and waiting in Cash for a better trade set up can be better to your account than repeatedly getting stopped out.
Best Wishes
~ALEX
FOR EXPERIENCED TRADERS LOOKING FOR IDEAS
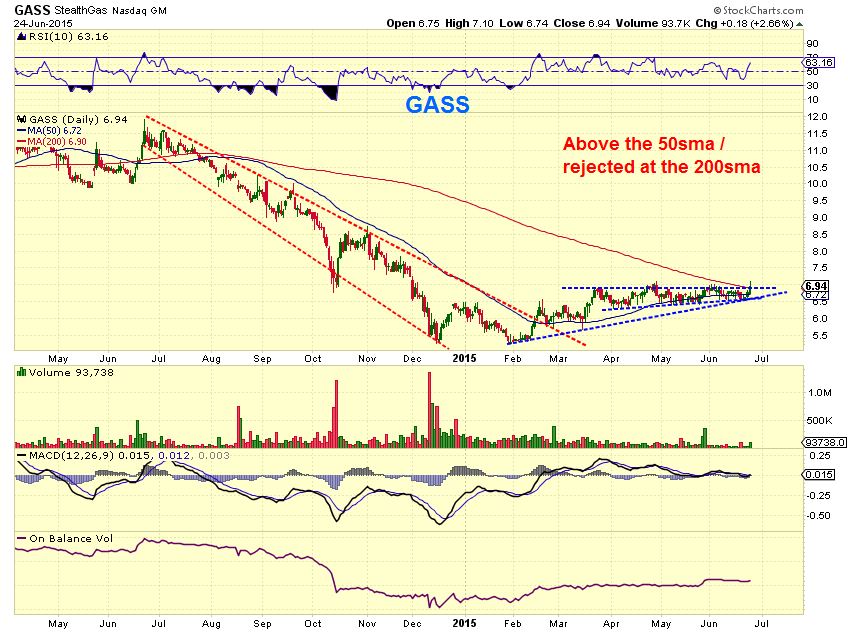
GASS– interesting consolidation out of the Feb lows. It moved above the 50sma, but was rejected at the 200sma yesterday. You could buy here or wait for a close above the 200.
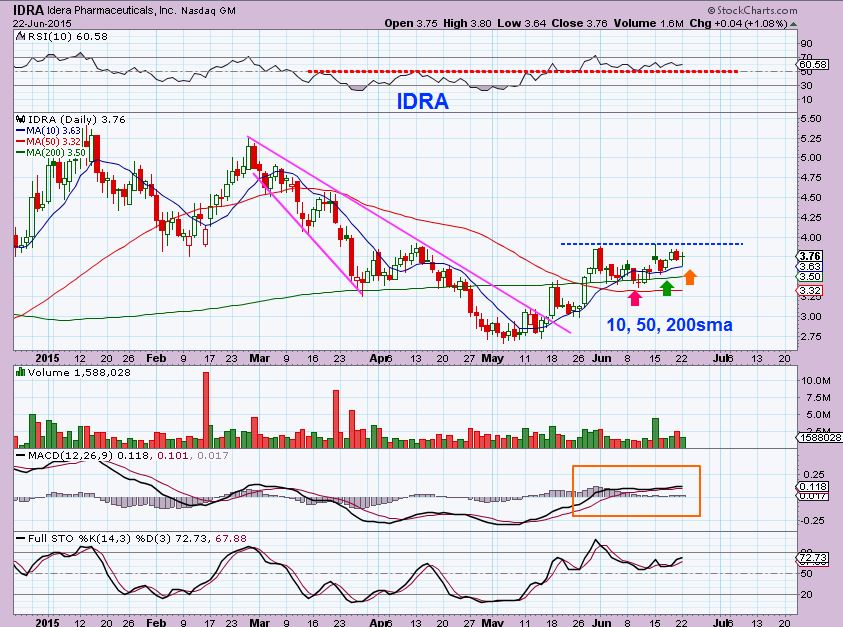
IDRA– this is my old chart. I was asked in the comments if its still ok. Above the 3 arrows should be fine, and it has pulled back so a lower risk entry is now present with a stop a little below the 50sma.
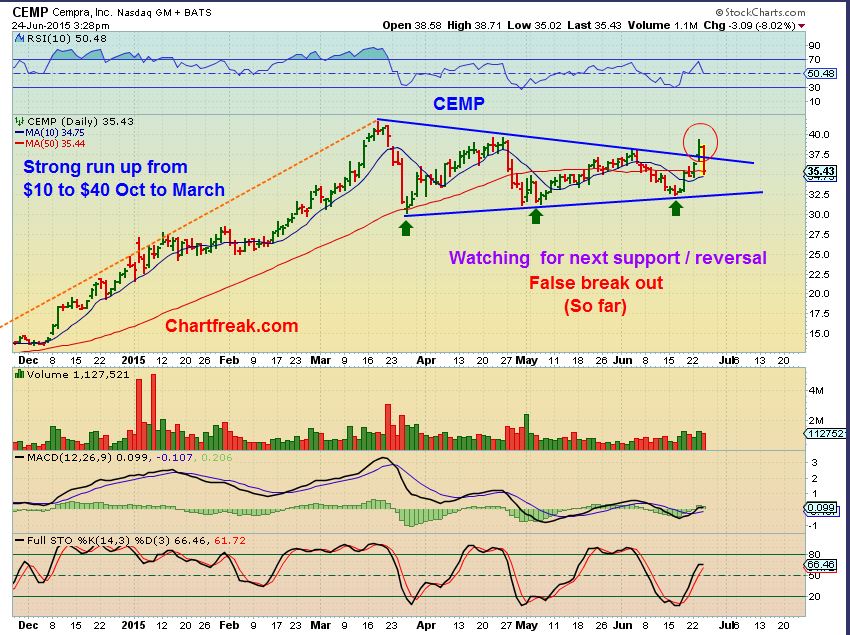
CEMP – I posted this before the break out. It broke out and reversed back inside the bull flag, but is still a valid set up so far for a possible future entry.
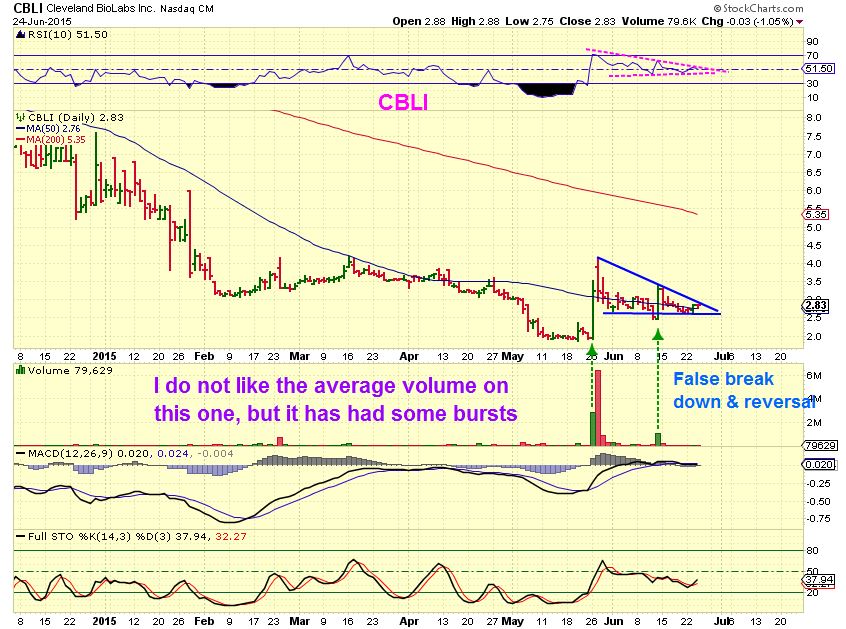
CBLI – short covering on release of phase 1 findings on preclinical potential in the immunotherapy of cancer occurred at the end of May and Mid June. This stock is trade-able but I wouldn’t hold it because it did a 1:20 stock split recently. That makes it a 14 cent stock.
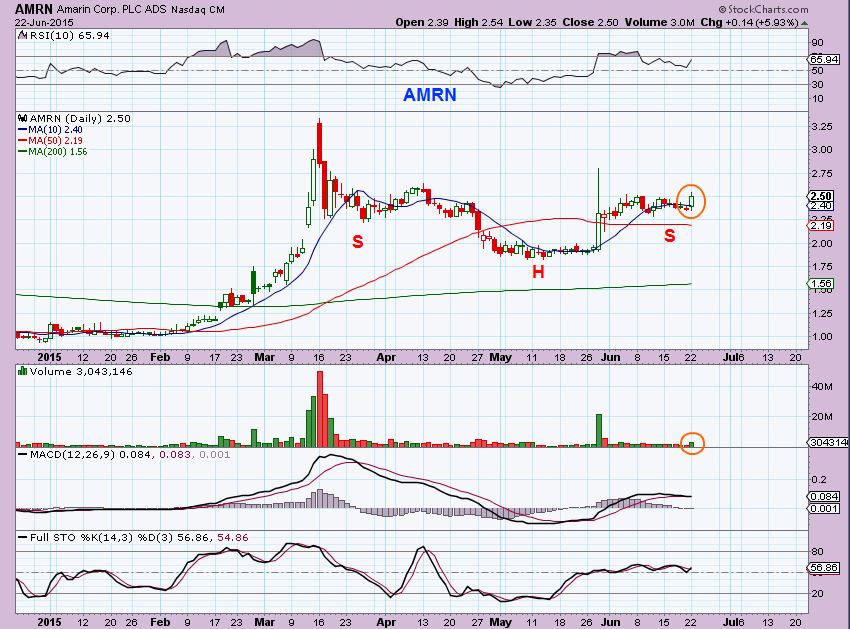
AMRN – repeat posting, still valid, but might consolidate 🙂
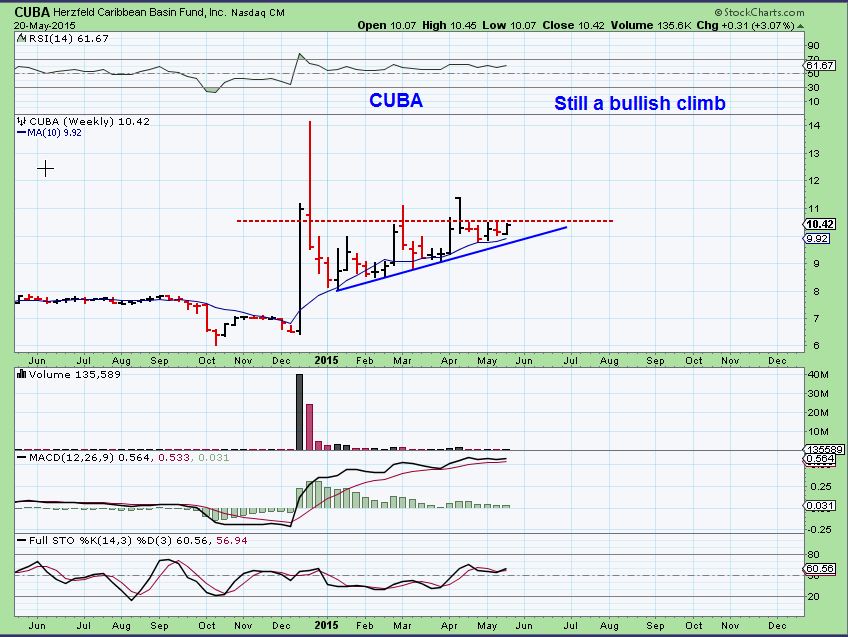
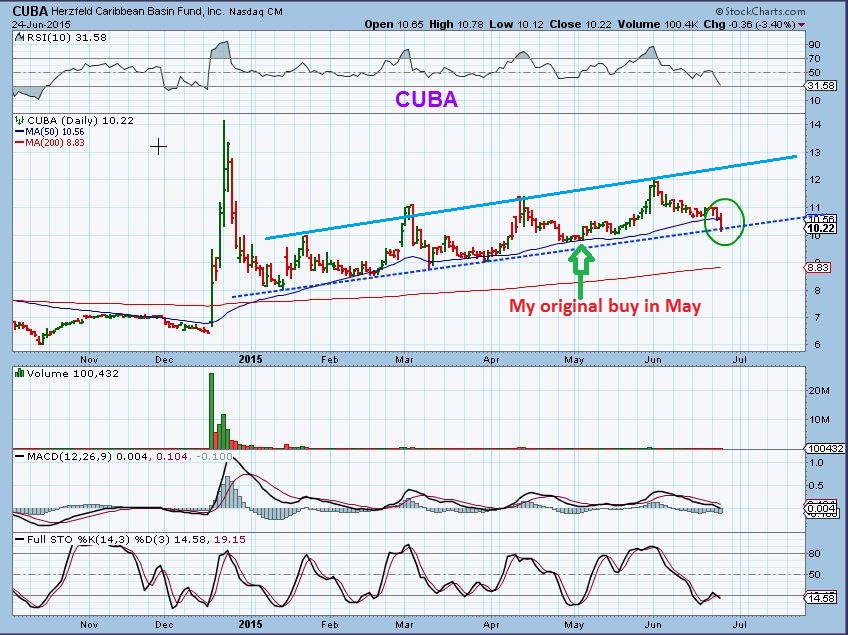
My post on “CUBA” weeks ago in May was because it remained above the 50sma ( Orange Arrows) I also liked the weekly, so here were my charts then.
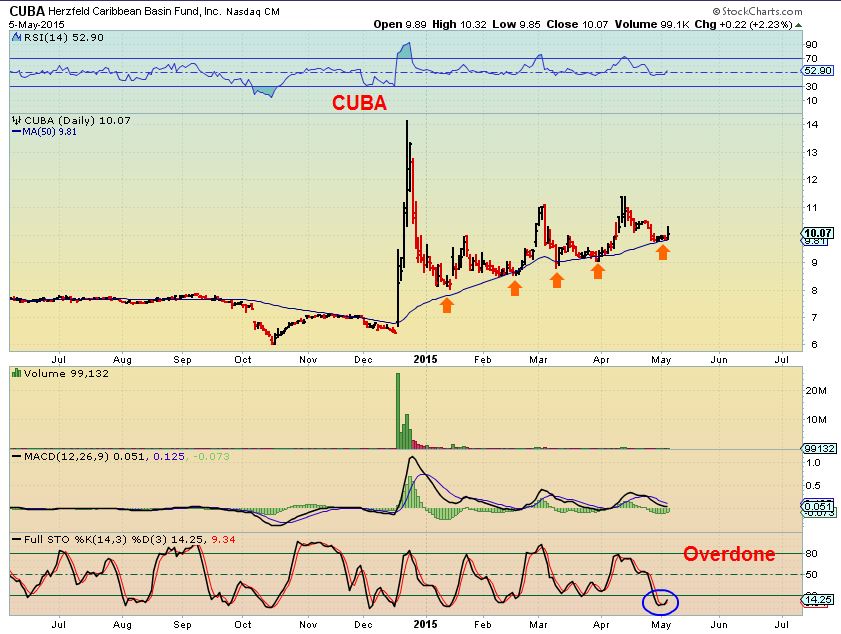
I was asked in the comments is it a buy again on the last pullback. It broke the 50sma, but it holding on the trend line. A reversal could be bought with a close stop. Sell at the top trend line $2 higher.
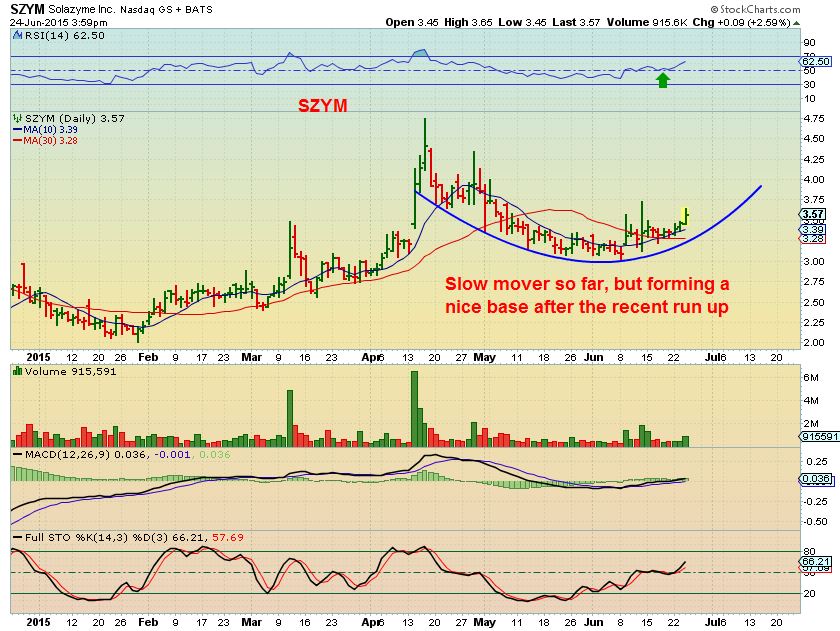
SZYM looks good again
See also AAOI, FBR, ZBB, CDXS, ICD, VUZI
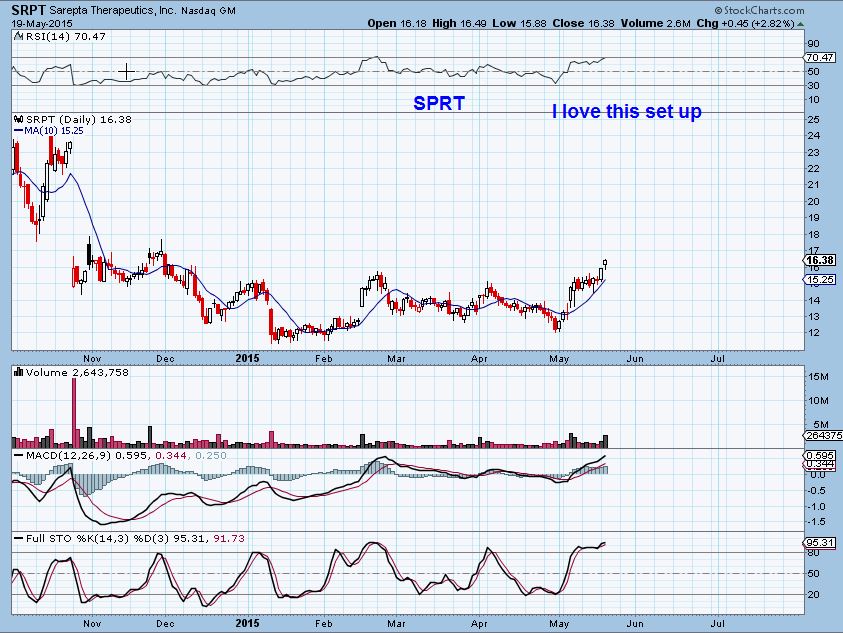
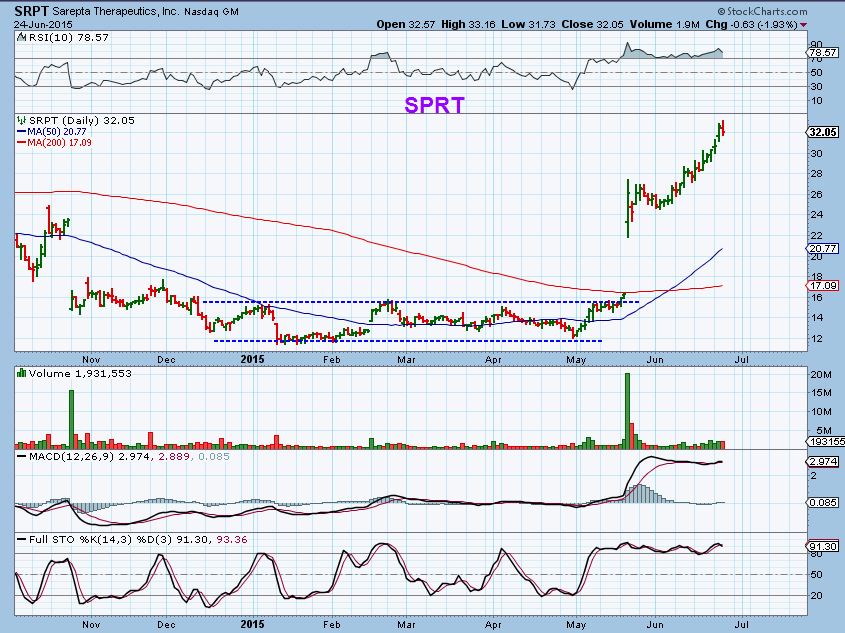
Just to show why I love these long bases after a sell off: You may recall this chart that I posted of SPRT. My recommendation here was based on a long base and some volume pops in SPRT May 19.
We have a double 1 month later ( No, I didnt take this trade that day) 🙁


Subs…. where can I find (a link ) for the VIX chart what see in this report from Alex?
THANKS.
stockcharts.com – its in the ‘Consistently Popular’ paragraph. You can also type $VIX into the symbol box on whatever chart platform you use.
http://stockcharts.com/h-sc/ui
Type $VIX in the ticker space (maybe you are only typing VIX without the dollar sign first?).
A different perspective on energy stocks. The intermediate trend line has been broken and they are having trouble recovering. They might struggle if the stock market were to start an intermediate degree correction. This is going to be the longest intermediate cycle of this entire bull market (36 weeks and counting). One has to wonder how much longer the Fed can keep the market propped up, especially with the transports breaking down.
Othet ideas in different sectors, ADRO (biotech) tight consolidation, look closely – higher lows every day. IMH big move recently. Coming in some this morning, under 19 a gift. Sorry, no chart not sure how to do on mobile.
Hey Cason,
I’m not sure I understand. You say “under 19 a gift”.
The stock is $35, what do you mean by under 19? thx.
Think that is IMH @ $18.75 now
Thanks
Sorry, I was talking about IMH. I edited the above for clarity.
Whats IMH’s business?
Hi, Bill. They do mortgage originations. Currently trading at only 6x earnings. Could be sketchy with Fed rate raise, but the housing data as of late? Real Hot.
Geez, make a suggestion and then ADRO gets hammered. That’s bio-tech for you. Still like it but tread lightly and have a plan!
Not sure if anyone wanted to try the IMH trade, but now $20.xx
And that’s what I get for saying something. A recommended stop on ADRO could be 31.15 so at this point real low risk on Monday. You could get in and if it’s not right up, you try something else.
CLF ?
I dont see a sign of strength yet, are you basing it on a wave count? Thx
yes…waiting 4 it to finish B soon… sorry i should have said..’watching’ ‘o) https://www.tradingview.com/x/m2GwzXMk/
I knew it 🙂
Thanks for the chart, I wasnt sure how far back U were going.
SZYM – watching the 20sma. Had some news on a possible lawsuit . Sometimes those knee jerk type reactions do not stick.
Forming nice daily hammer so far.
CF: word on the wider mkt. Consider AAPL:SPY, direction of breakout may determine wider mkt…
Alex, you out of PLUG? Remember my chart before and now. See below
Yes, out . It formed a wedge and broke the lower trend line so I sold it in the $2.70’s
REN, REXX, SFY, WLT, KEG showing signs of life. DOES ANYONE HAVE ALJ? Nice ride
ZBB is doing it. Remember my wedge chart
(I will buy the re-test)
This was the weekly Buy chart in May at 85 cents. ( refresh)
Nice call, it may not retest!
I dont think it will, it is an inverse H&S , and when they break its usually a straight line move
Tough stock to own though. You have to buy it when its selling off and sell it when they’re buying .
BWEN has had some really nice volume & price spread lately.
Refresh
Why is it that most energy stocks took off the first month of the year, and BWEN continued down until now. REN was another lagger. If you bought REN in January you would have lost $$$ until April while (almost) every stock in the sector moved higher. How to pick the right stock is critical. Even now if you bought ERN in January you would still be up 170% if instead you bought GDP you would be down 15%. ETP, CLNE, GDP, and RIG were other late starters.
I’m looking at this to try to find stocks that might be the early tell when the energy market turns. Oil didn’t really bottom until March, but many sector stocks started moving higher in January.
Bill, hope CF has your answer b/c I don’t! REXX threw me out 2 weeks ago and has now moved sharply upside while CLNE, the last I monitored as still looking good is down over $1/share in the past week. I haven’t figured it out so I stopped trading energy stocks for now.
Alex, I think we are all seeing some movement higher in some of the energy stocks yet continued lower for many. Is this a bottom for some of the better ones? What are you looking for before you say “lets buy”? WTIC hasn’t moved higher really.
It just doesnt look convincing in many ways. I’m hoping that Oil will break out higher & run and then we’ll know if the energy stocks want to follow, but they definitely seem to be performing on an individual basis.
I dont see a lot of GREAT looking charts either. just a few like REXX. At least its still near recent highs
USTs:Tomorrow looks likely to give a third consecutive bullish weekly reversal candle on TLT
IYT breaking down…? (Though I understand Dow Theory needs Rails and Transports agreeing)
There is room to the downside on a daily chart. The weekly almost looks like a “last engulfing” though – which usually reverses the next week. Its tough to read
Alex maybe you should take a look at MHR setting up nice
Thanks Dumanj
I was looking at it, but didnt see today’s reversal. I also like the similar POP & consolidation in HK. The volumes on both look good.
Alex, maybe a spot here for quick oil trade? Seems one could play the rails in recent consolidation zone? Last 3 inventory reports have featured withdrawals above consensus but have been met with selling, so I’d be quick. I’ll throw out to the group that calls (options) have not been working here and would recommend that, time premium just getting eaten up constantly.
Nat gas finally back on track today? Great afternoon close well above 10 day on back of solid inventory numbers.
I did like the way NATGAS looked today
And that’s why I hate NATGAS. Each time I say last gas trade… 🙁
GDX almost there? NUGT to$8.12 would be a steal.
Not getting an impulse down, seems like it will just bleed nickels all the way down. If we could get a rally, I’d short the pop. But we can’t.
Do you Bill have a GDX charts for me?
Many Thanks.
Guert, the chart above is for GDX. maybe you have to refresh to see it.
Got in NUGT for a quick trade before the pop.
Thank you Bill!
Thank-you-very-much BILL, it helps me.
Have a wonder full weekend.
Looking to grab a short trade in UWTI to play oil continuing range bound trading. Will exit before next Wed inventory report regardless. Lower BB in crude equates to UWTI at about 3.10 so stop just below there keep your risk lower.
What’s going on with REN?
seriously wrong.
REN just got a buying spike in volume.
REXX looks great, terrible that it threw me out 2 weeks ago at 4.92 🙁
But look at CLNE, it got taken to the woodshed. Each is working individually, seems random to me, don’t have the time to find which one is the right one for sure.
USD H&S pattern? I don’t like that one other peak but? What do you think? Refresh for chart
Maybe. I’m still in the blowoff peak for USD camp for now unless we get more evidence to the contrary. Metals low, USD parabola, S&P wedge break (finally and for good), and rate hike all seem potentially to line up end of summer/Sep. But I like wild theories like that.