
Cash Is King
I started last week with a good number of trades on, and while I still see a lot of good looking set ups, I find that I am slowly going to Cash. Some trades I cashed out of and others I got stopped out. Lets look at the charts and discuss future possible opportunities.
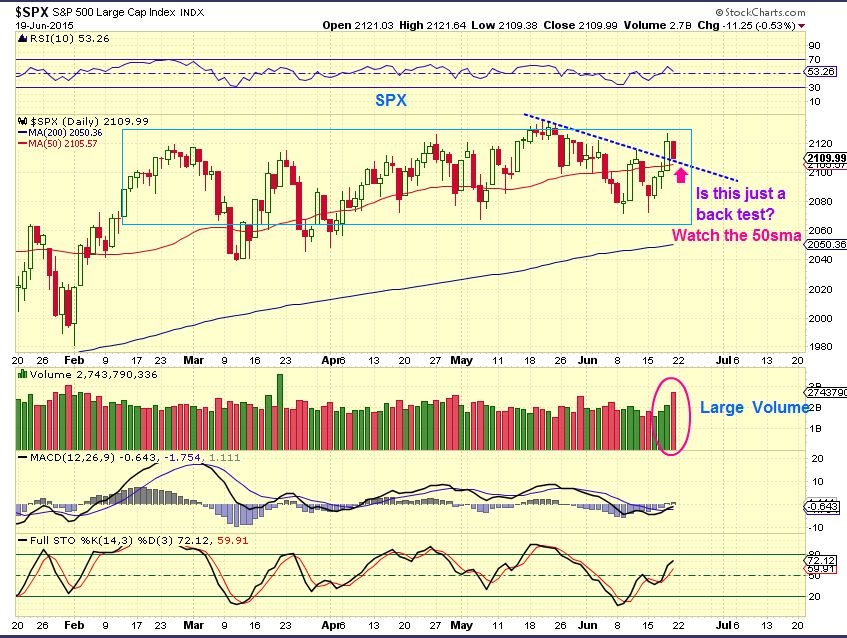
SPX– High volume reversal . Why was volume so high? Is this going to just be a back test of the break out & 50sma, or does that volume indicate a larger drop? We will know soon enough.
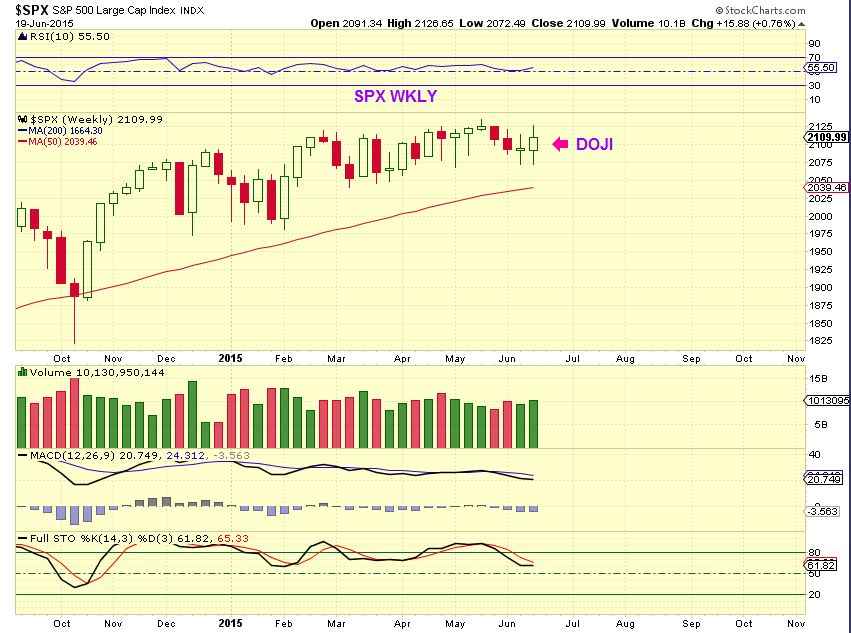
SPX WKLY– Doji candles can indicate indecision, and for the 2nd week in a row, our weekly chart is a doji.
Lets look at the NASDAQ…
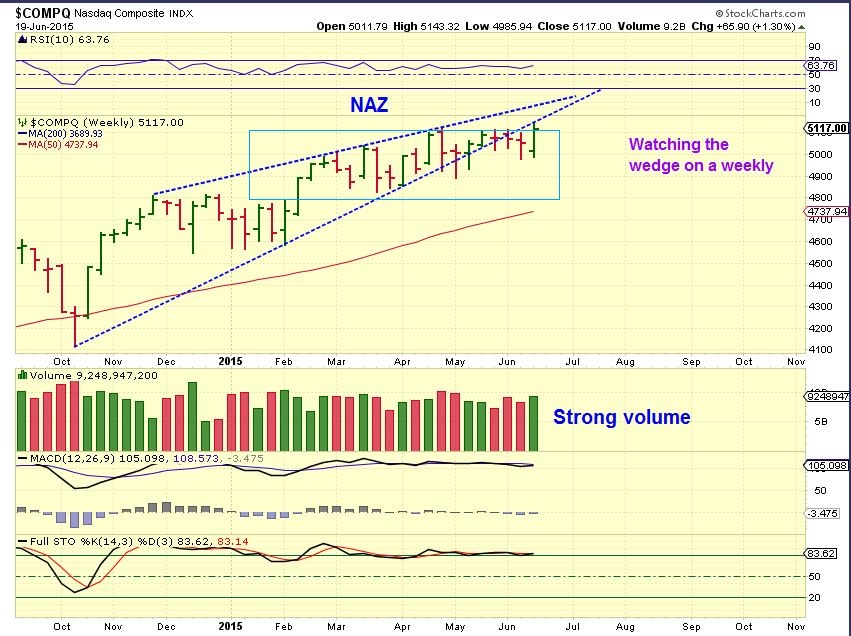
NAZ WKLY – I am still watching the wedge. Back test? Without the wedge, this looks like a strong reversal higher.
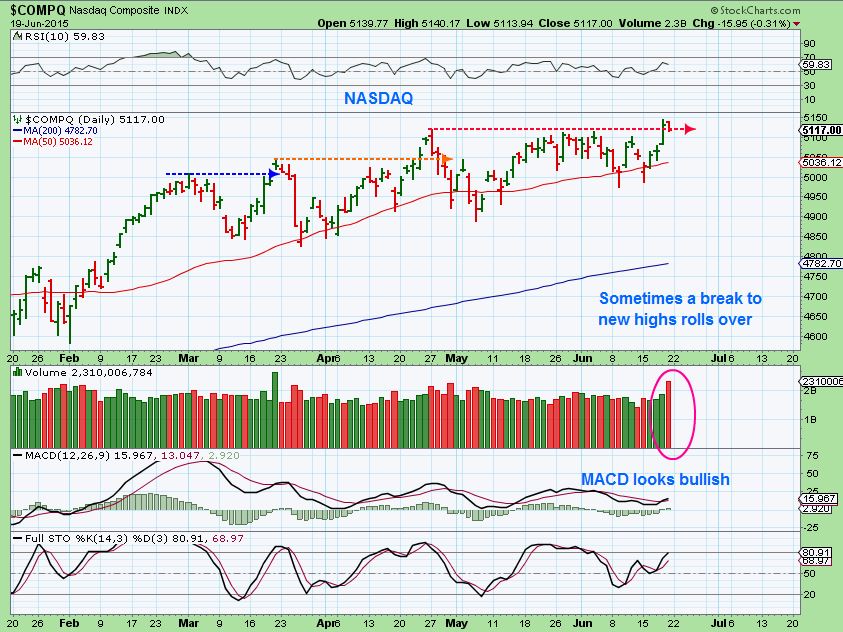
NASDAQ DAILY– Prior pops to new highs have rolled over. Again, for some reason Friday was a high volume reversal off the top. Those USUALLY have follow through. Price spread was Minimal however. Odd.
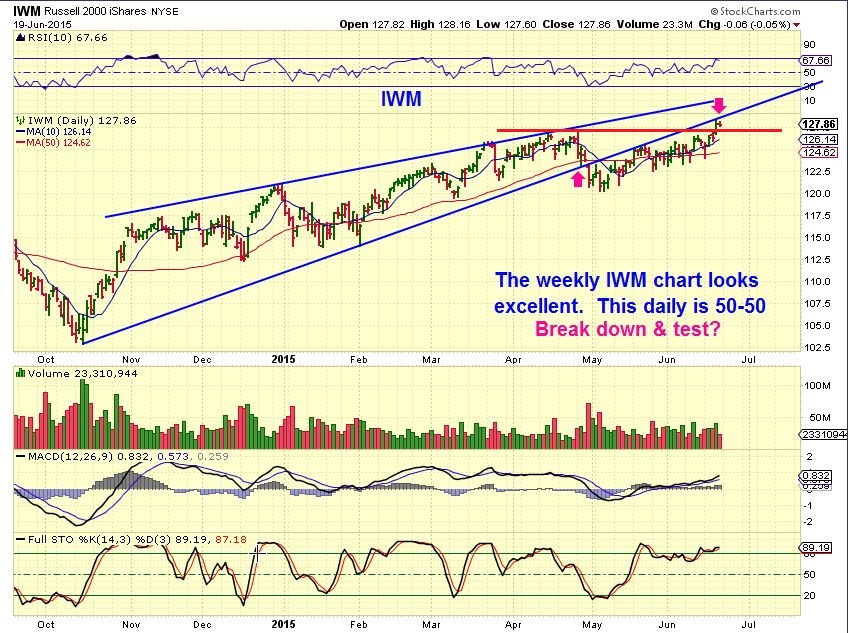
IWM – Did NOT have a high volume day Friday. You can see that the IWM broke to new highs Thursday, but no immediate follow thru. I am again pointing out that Bearish Rising Wedge here, it may be back testing ( & Fail) .
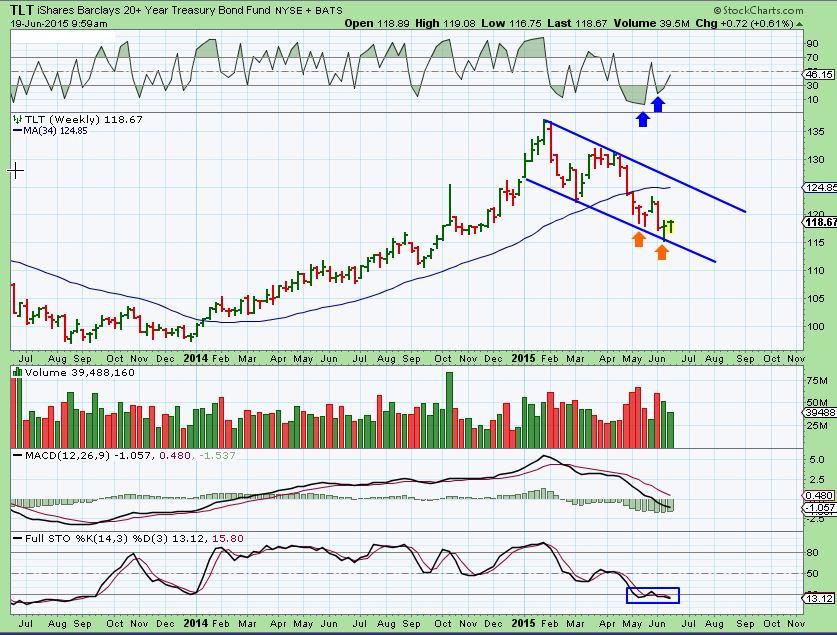
TLT WKLY– I captured this chart on Friday morning and it actually closed a tad higher just over $119. It looks like the TLT wants higher price. It is in a downtrend ( Correction?) currently.
I want to discuss Energy here a bit. I closed some positions because I had to be away from my computer for a few days last week, and I got stopped out of a couple too. While OIL & NATGAS Appear fine, some Energy stocks are weak. I want to take a good look at several things and tell you what my conclusion is.
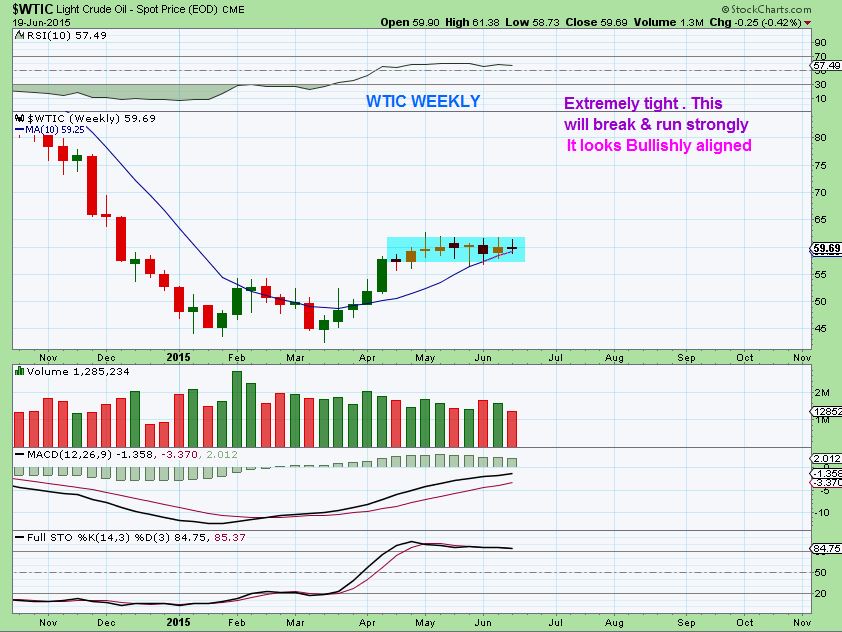
WTIC WKLY – This is a very tight pattern and should break & run strongly. Up or down? It looks like a continuation higher, but we’ll see.
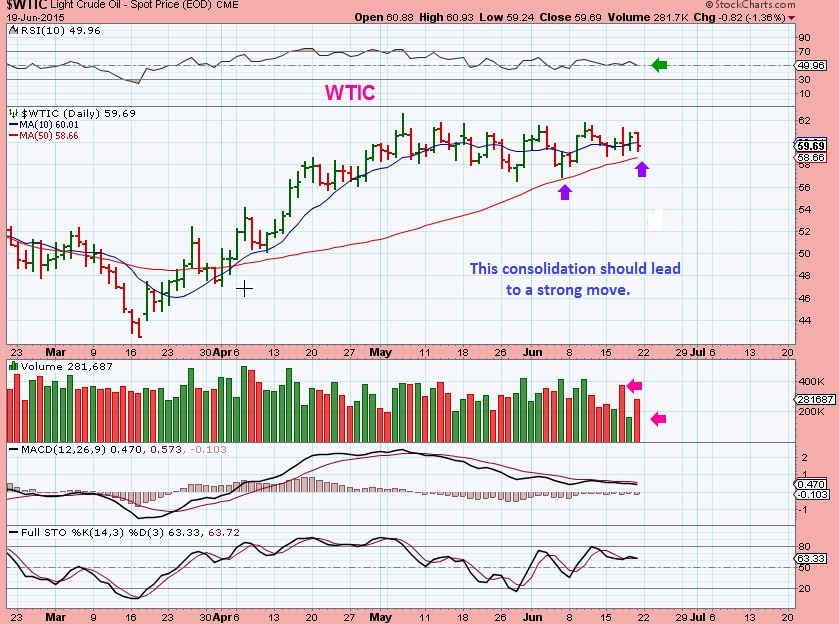
$WTIC- Bullish above the 50sma.
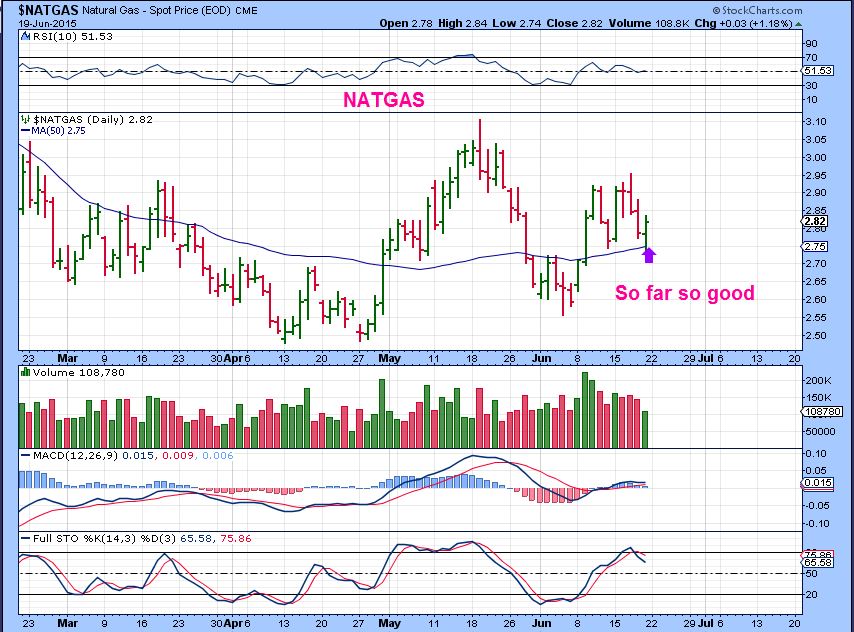
NATGAS– bullish reversed off of the 50sma. Safe for now.
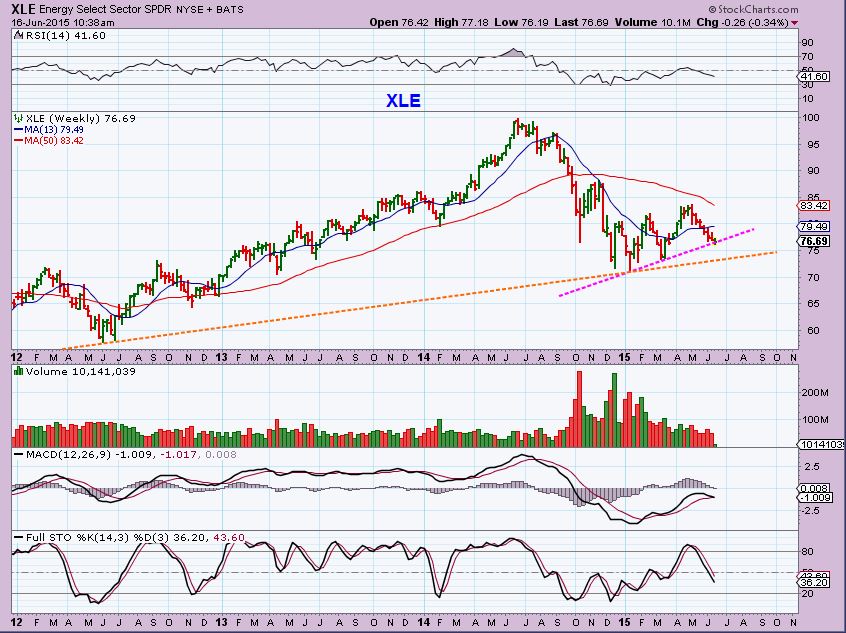
So lets look at the XLE. Some energy stocks look fine, however I would say that more look weaker below their 50sma. Others are just ugly. When we consider that OIL is holding up in a sideways pattern, we would wonder why Energy stocks are not.
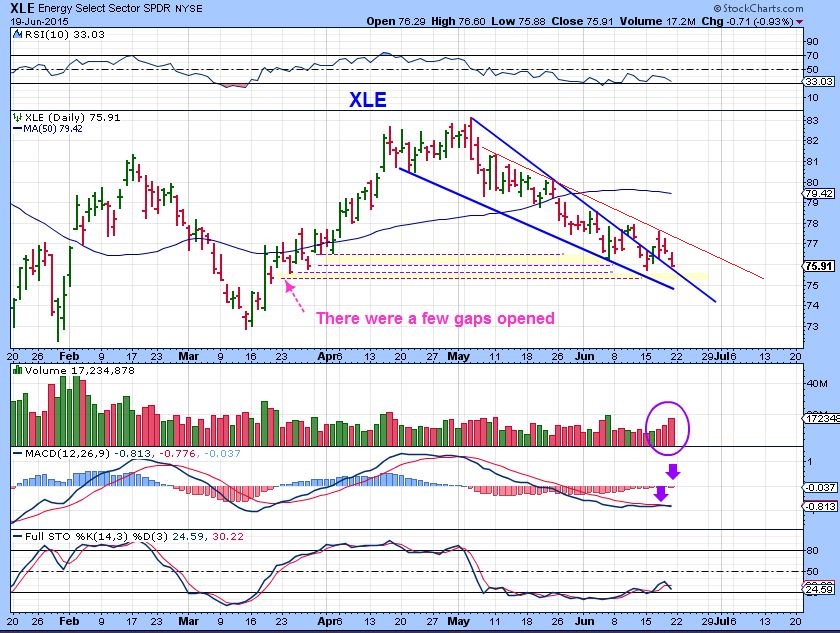
XLE– currently I see weakness in the close up here. It COULD BE a bullish descending wedge break out & Back test (Blue lines), or a red channel selling off lower. Gaps have filled and it’s oversold, but also MACD is weak and volume selling increased. Mixed signals.
Lets get a big picture view and see if we see anything of interest.
.
I looked at the 2009 vs The XLE now , and see similarities and differences.
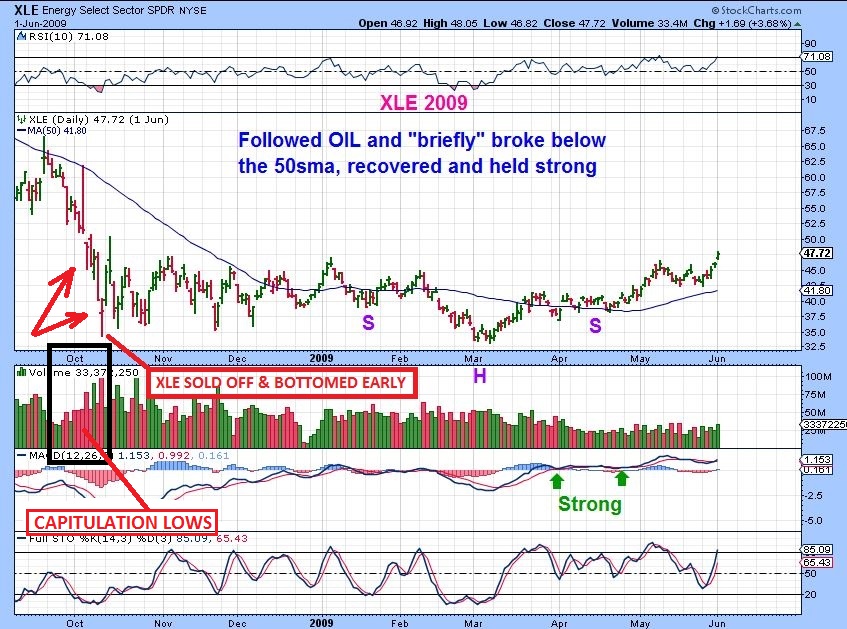
XLE 2009 – it actually bottomed WELL before Oil in 2009. Oil had a capitulation & final lows in Feb 2009.
1. For this chart of the XLE , Let me just call THE REAL LOWS the high volume capitulation lows in October.
2. Then you can see that there was a long consolidation for 4 months.
3. XLE then made deeper lows in March. These were really just a “Stop run” , but they can be considered the final low .
4. Cant help but notice that XLE never went below the 50sma after the final lows in March. It followed OIL nicely.
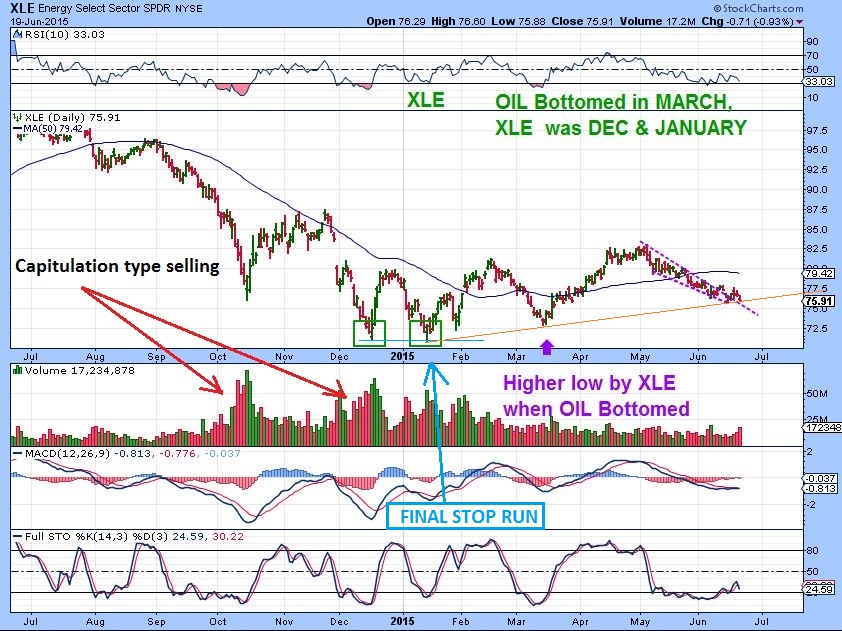
Looking at XLE Now- Cant help but notice that the XLE has dropped below the 50sma this time, but also I notice that the XLE is different in many ways than the XLE of 2009 ( Oil is very similar to the OIL 2009 Bottom).
1. Currently the XLE also has that Capitulation type lows in OCT , and then another final high vol capitulation drop in Dec.
2. A stop run took place in January (lowest lows to date)
3. XLE already put in higher lows in March when Oil put in its lowest lows. XLE also put in higher Highs.
4. Currently the XLE is at a trend-line support ( orange line) with higher lows and higher highs. It is oversold and the MACD is shaping up. This may be bullish in its own way.
What can be concluded here? SO far the XLE is putting in higher lows and higher high, Oil has put in lows and gone sideways. We really want to see the XLE hold at this point. A break out in OIL may save this pattern of higher lows and higher highs in the XLE. MANY oil stocks are in consolidation. ( Some are breaking down badly GDP, HERO, VTG, etc) . So it is risky until OIL or the XLE resolves the current set ups. It is a stock pickers market in energy, since they are all acting differently at this point.
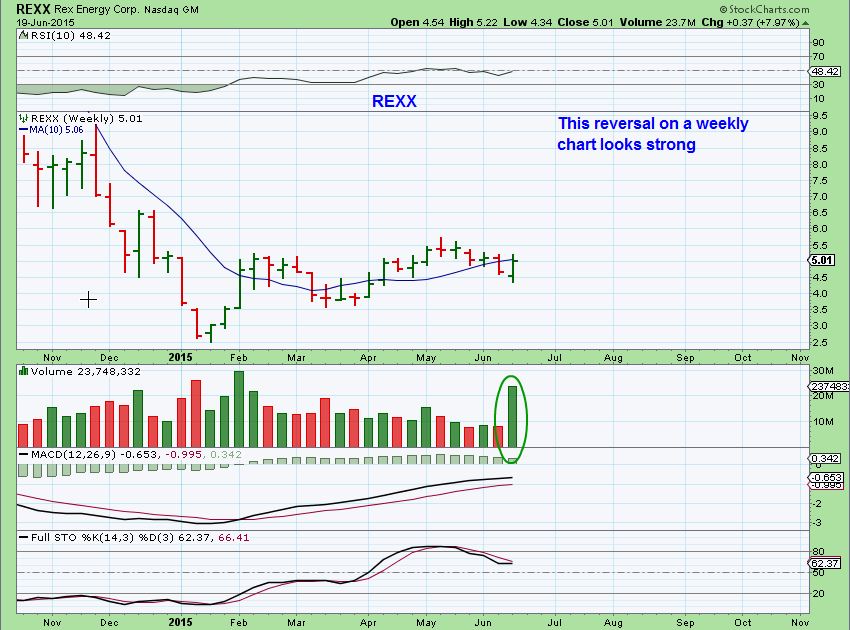
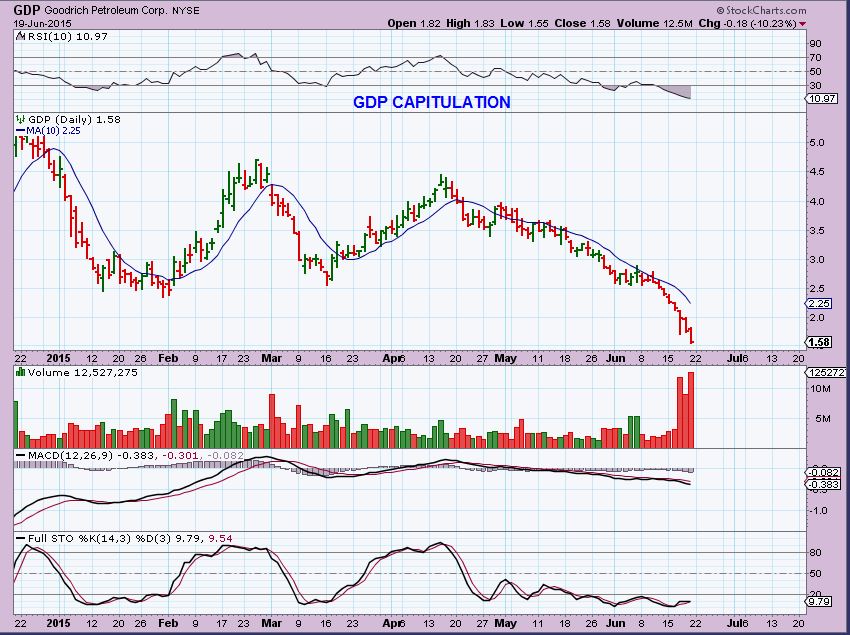
Example of pleasure & pain in this sector.
REXX WKLY- Nice strong reversal so far
GDP- capitulation sell off
Caution is warranted until we see what OIL wants to do … and how these and the XLE react. Keep & Honer stops if you own these already and if you were stopped out (I was in a few) , dont just jump back in – in a hurry to catch the next move. Allow these markets to show us what they want to do to avoid risk. It is somewhat Mixed currently.
I also showed this bigger weekly picture recently .
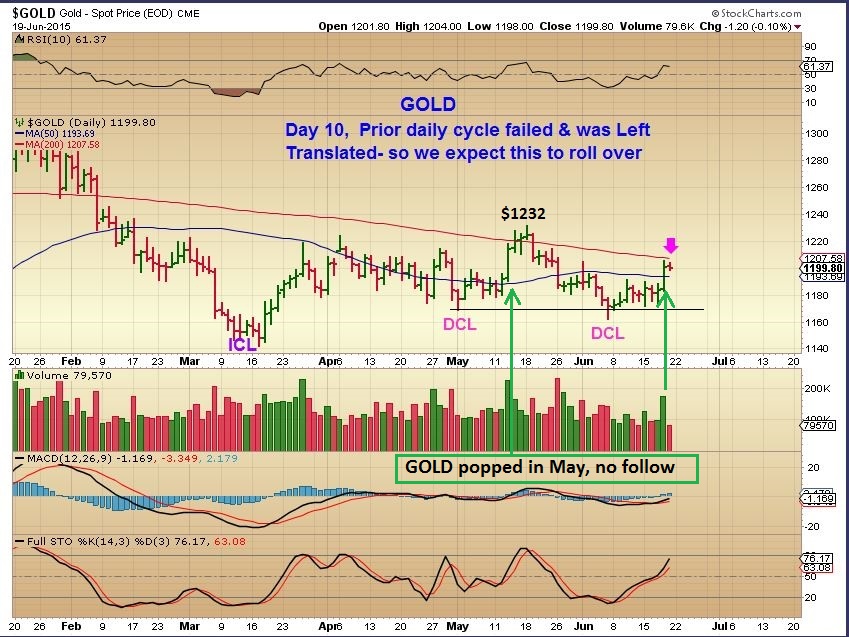
GOLD, SILVER, and MINERS
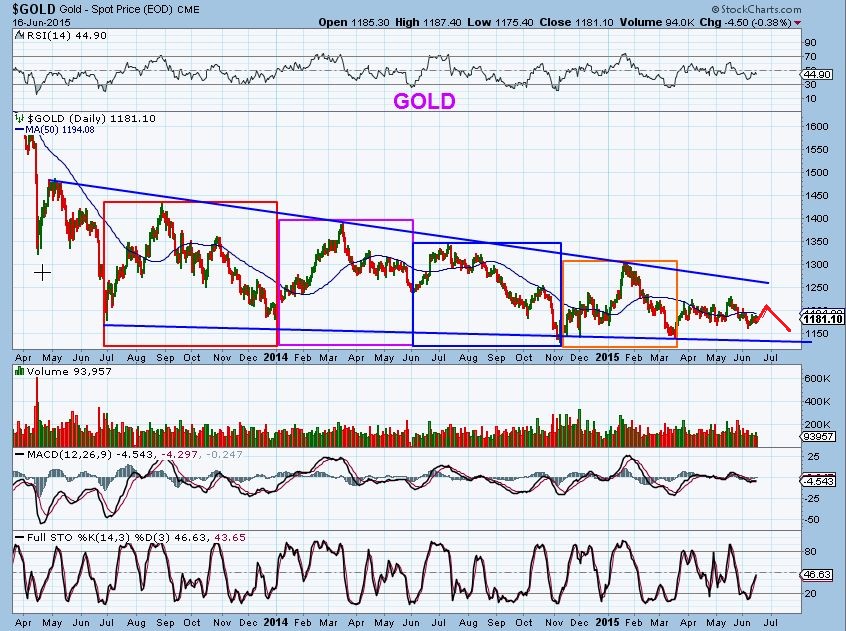
GOLD – popped and looks bullish, but in Cycles, it should not make much progress. It will draw in many Bulls, but I expect it to likely roll over. Note the POP in May didnt get very far either. Both seem capped at the 200sma.
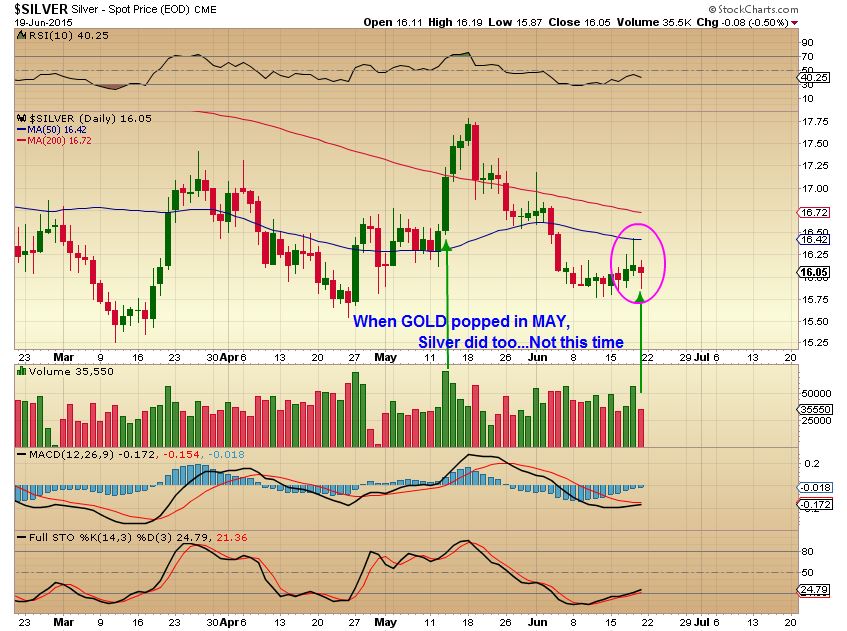
SILVER– Looks worse. Silver Popped with Gold in May, it has NOT shown any strength on this Pop in Gold. That may be a warning.
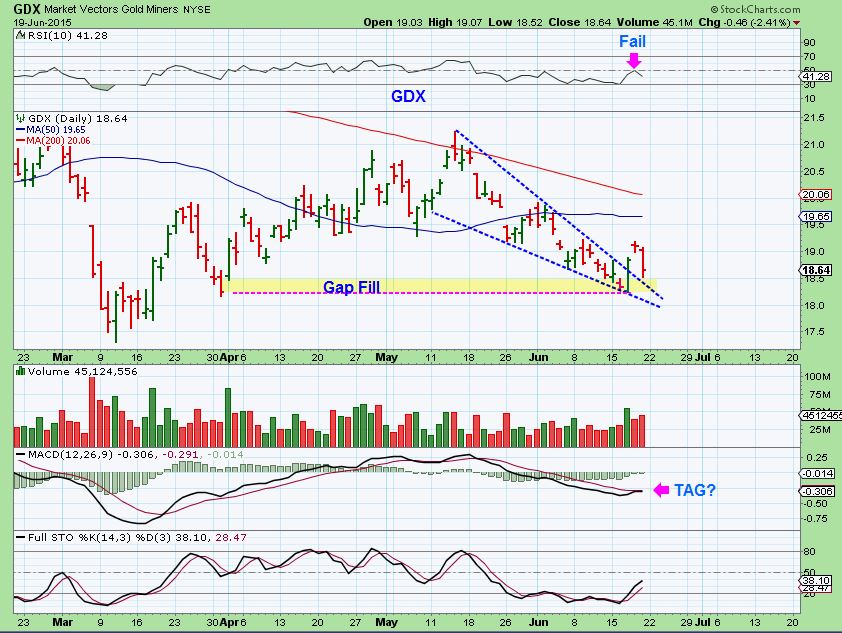
GDX – Popped and reversed quickly. The RSI turned at 50%. This actually doesn’t look too bad, but lets be cautious. Some Miners have shown themselves to be acting differently from the metals, but I have to recommend caution. Look at that drop in March, that is how Miners usually drop into an ICL.
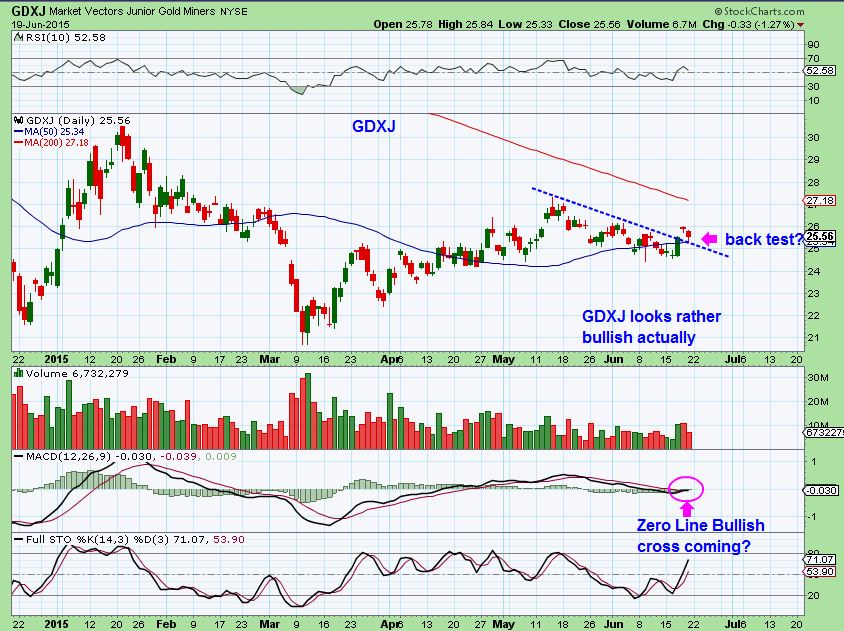
GDXJ- The juniors have acted stronger in this Investor Cycle, and this chart actually looks pretty good. As a warning , take a look at GPL, MDW, PAAS, Friday. Volume was monstrous too .
Its funny, I drew this chart in May and never posted it. GDX was $1 higher than now. This shows us that this sector has been difficult to make money in. The sideways chop is frustrating, but I believe a very good opportunity is coming. It may be worth not over trading and trying to save capital for that ICL. 😉
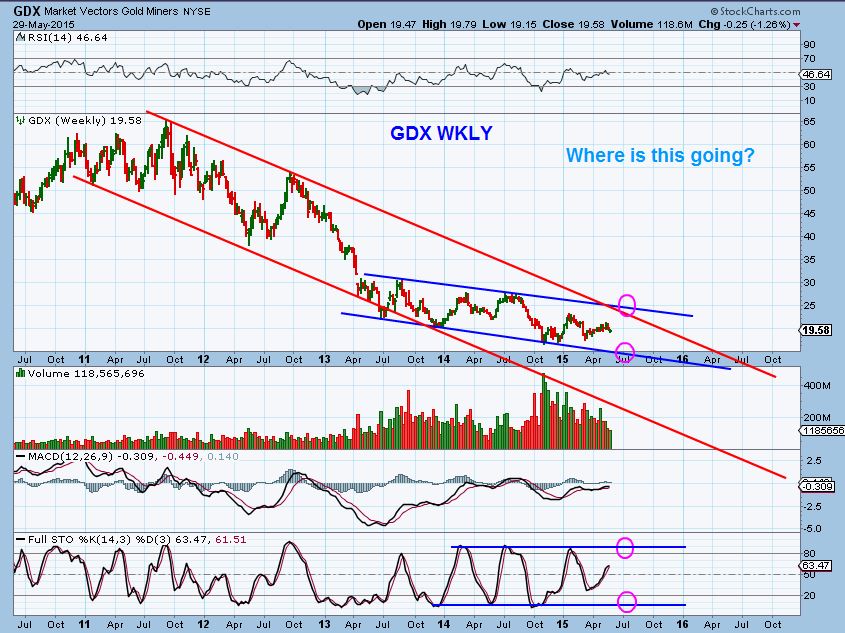
As you can see from this chart below, the deep meaningful lows ( ICL) were arriving roughly every 6 months (See the colored boxes) . They contained on average 4 daily cycles. In March we were surprised to see only 3 daily cycles and a 4 month investor Cycle. Will the next ICL come after 4 months? 6 months? More? I’m going to be watching closely.
Here are 2 (of many) possibilities of how this could play out.
1. Gold crashes down to $800- $1000 ( like everyone thinks ) and makes final lows in that ICL. Since everyone & their brother wants to BUY THAT DIP, it would likely be a V-Bottom that rockets higher with short covering and massive buying. I do find that just too easy, but anything can happen.
2. Look at the above chart again. Gold actually put in a higher low from Nov to March . We could bounce around and go sideways, eventually dropping into the next ICL. This happens in accumulation periods, when big money buys each dip . If the next ICL was also a higher ICL , no one would probably see it or buy it. As it rallied higher , many would be waiting for that final ICL drop .
Wait- That 2nd scenario… that would not be a steep enough drop for an ICL , right? It couldnt just go sideways and then a quick drop. Well look at the ICL in May 2014. Sideways and a quick drop. We will just have to see what this market delivers.
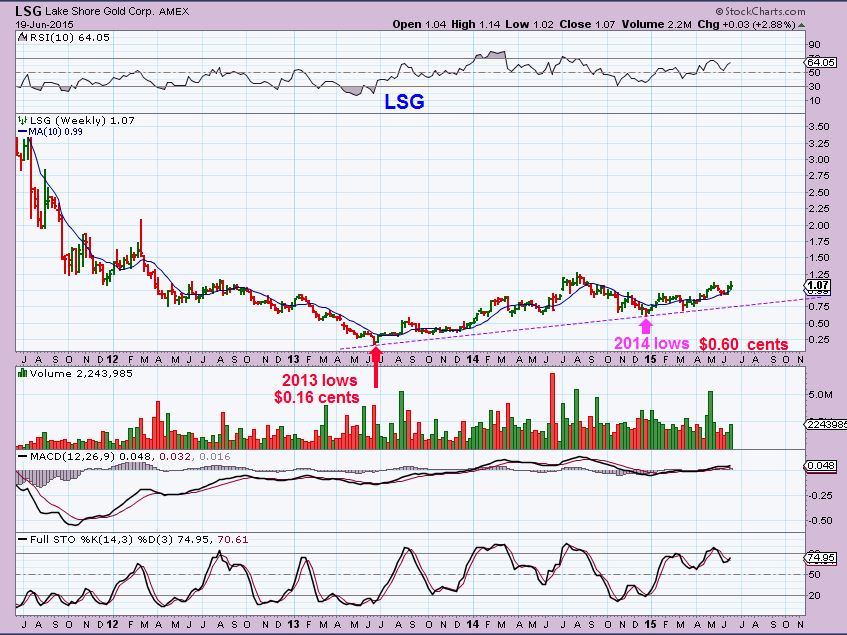
SIDENOTE: As mentioned here any times before, Some MINERS possibly already have put their lows in. See LSG, RIC, TRQ, BAA, GSS, etc
LSG – Lows in 2013 so far. Up over 580%
I want to release this report Sunday Night instead of Monday morning. I also want to add a couple of ‘trade ideas’ for the active traders, so I will release the report now and draw up a few charts to add on later. I will notify everyone in the comments section when those charts are here, or you can just refresh the report in the morning and they should be there by then.
Thanks for reading along and best wishes on Monday.
~ALEX
TRADE SET UPS / Trade ideas. I’m just going to add a couple of ideas here , until we see which direction the markets want to take. Please keep in mind that even good chart set ups can fall apart under bearish conditions. I am adding these here because I know we have very active traders here, but for some it is simply best to wait and see what the Markets in general want to do.
.
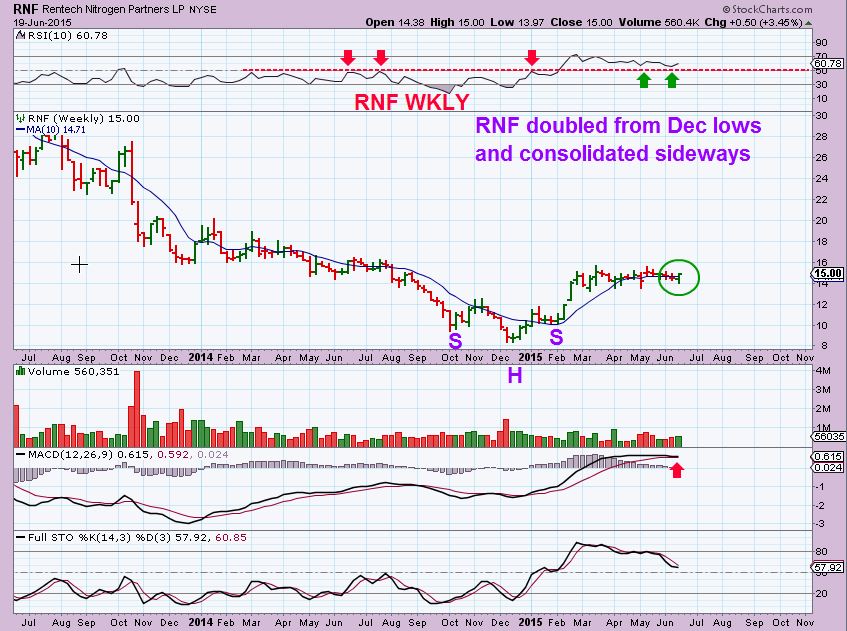
RNF WKLY – Fertilizer / clean energy company. Nice reversal back above the 10WMA. Looks ready to break out higher.
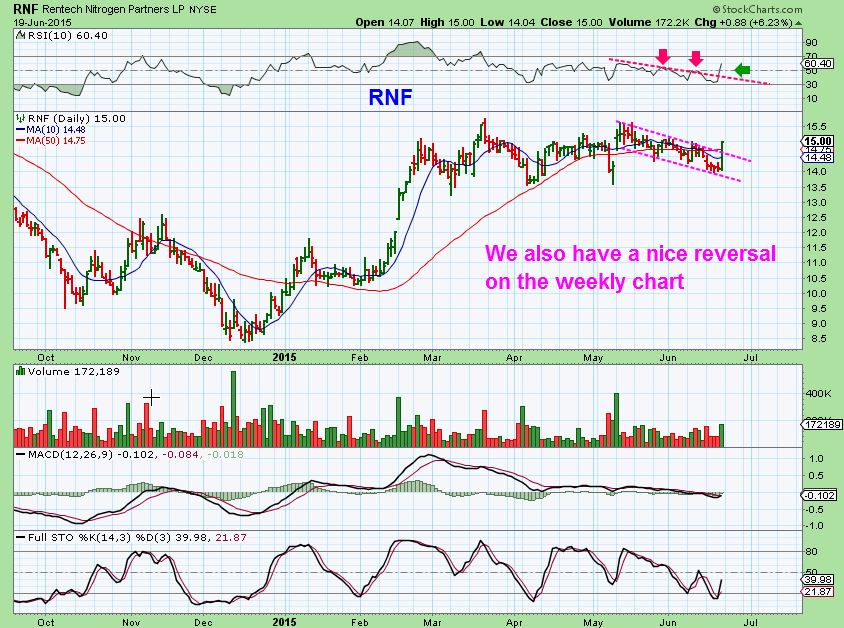
RNF DAILY– This would be a buy here above the 50sma and the break of the RSI line. If this gets follow through, it could run nicely. Semi sloppy consolidation , so keep a stop loosely below.
I posted VUZI last week . It is still valid.
VUZI last week-
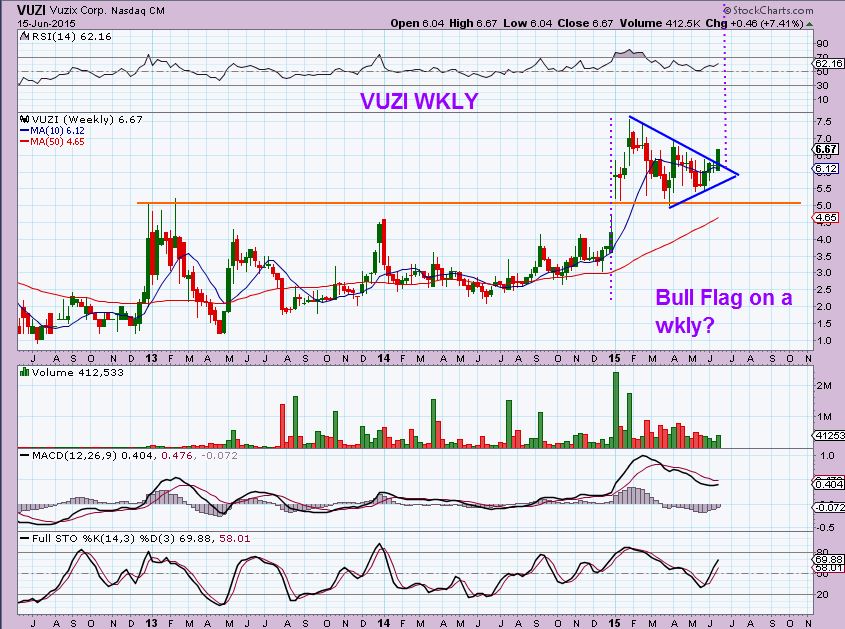
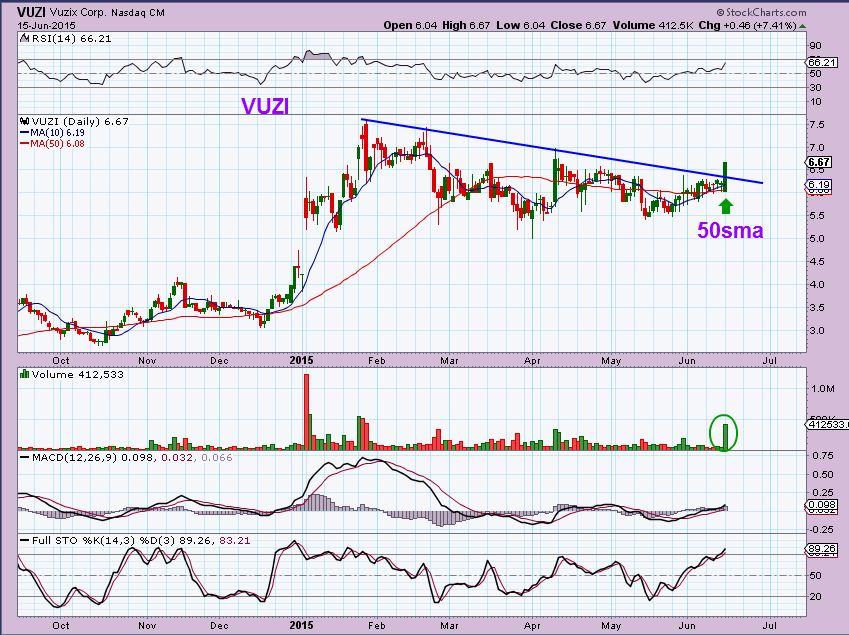
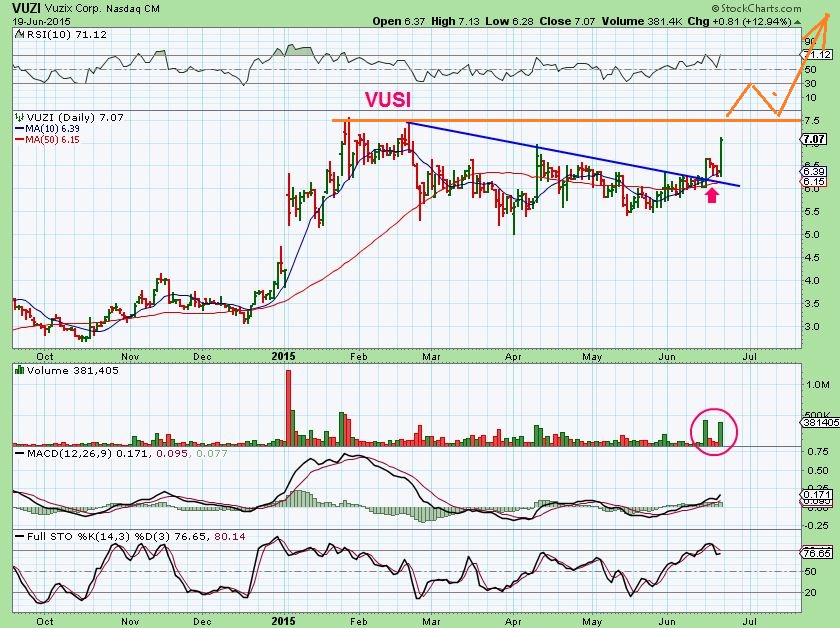
NOW- follow thru. It may just break & run, or form a cup, etc. I would buy any pullback like last wed, Thurs, Fri with a stop below the 50sma
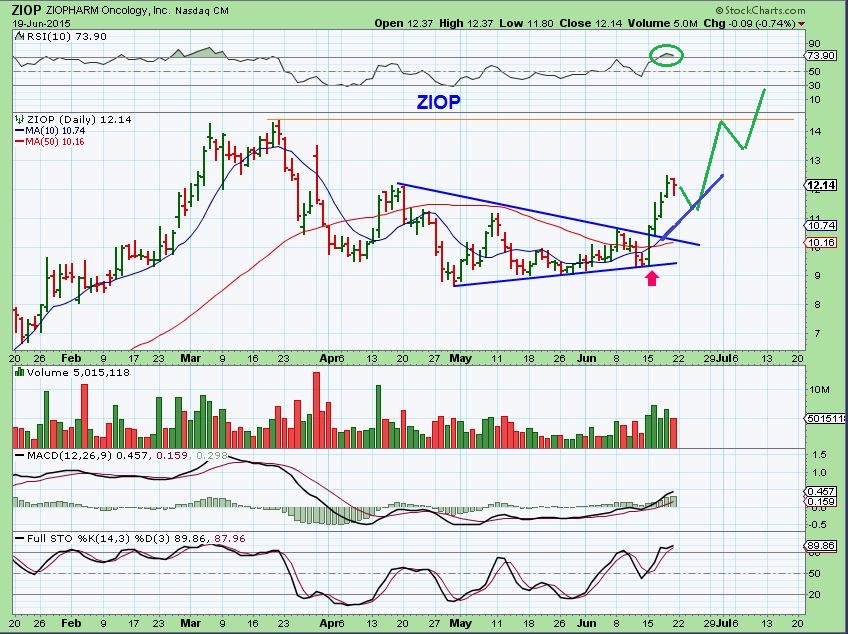
BIOTECHS have done very well. I posted MNKD , ZIOP , and a few others. All have follow through. This was –
ZIOP- pointed out here that it was a buy at $10 as it crossed the 50sma
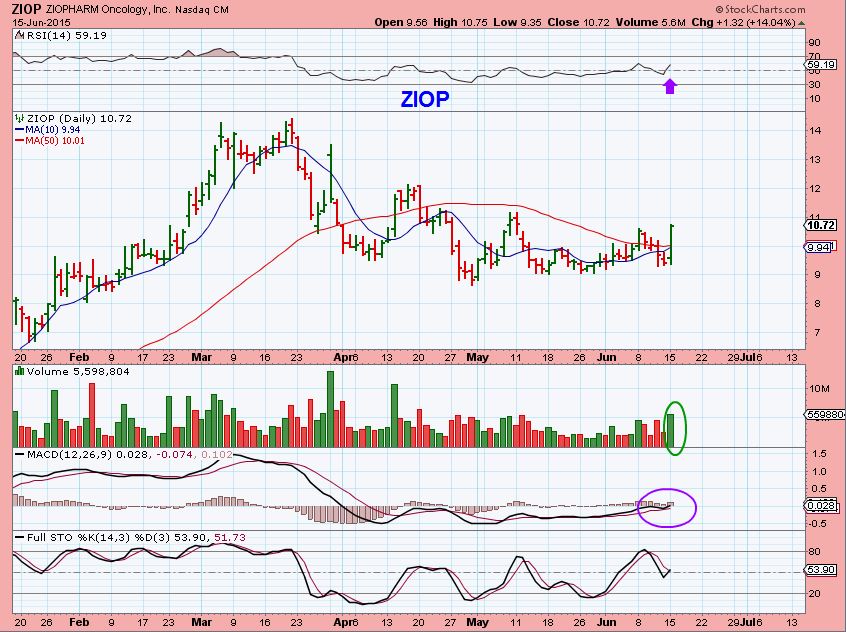
Now- Ran higher and paused Friday. A pullback to the 10sma could be bought. It may form a cup from $9 to $14.
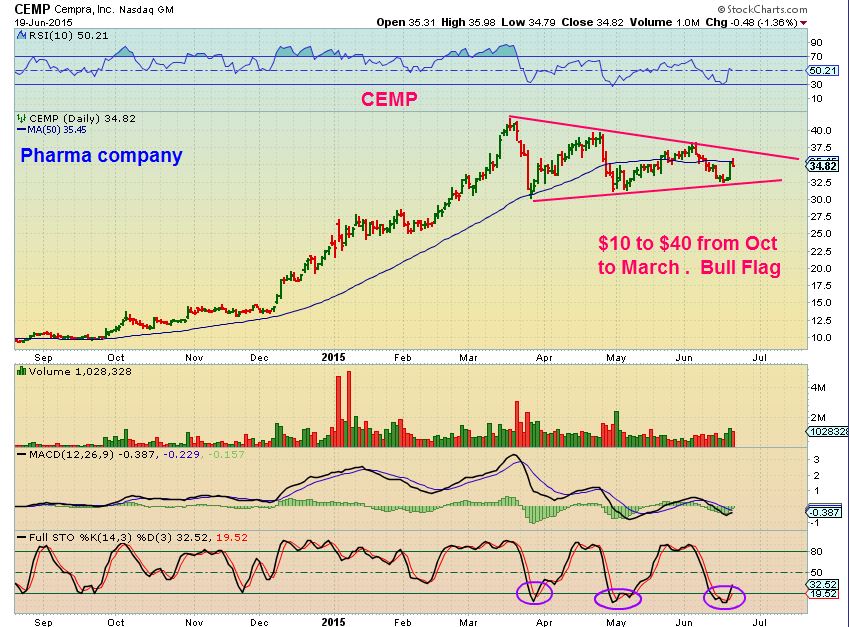
CEMP– Sweet run. Buy a break out of the flag, place a stop at the trend line.
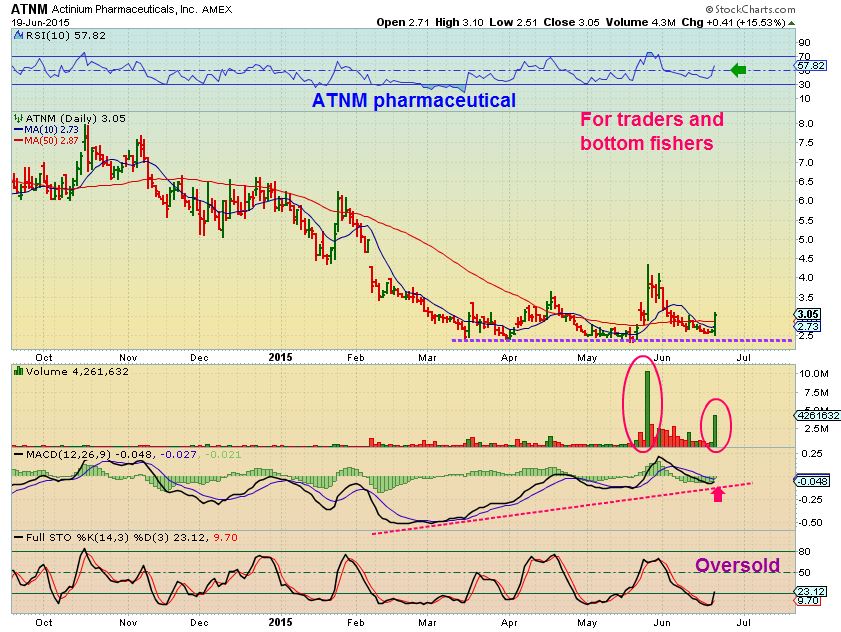
ATNM– Pharma have been popping. Could be a quick trade for bottom fishers. Theres no way of knowing if this will break out higher now or just continue sideways. The set up looks good. In May it almost doubled on that little pop.
If the small caps or Tech stocks continue to rally, MM may be set up to break higher.
MM WKLY– long base moved above the 10WMA
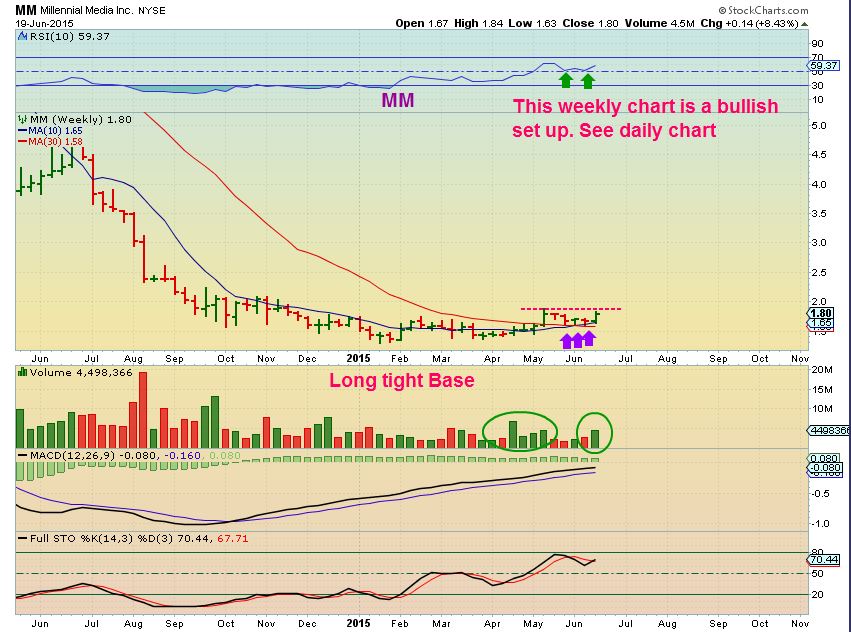
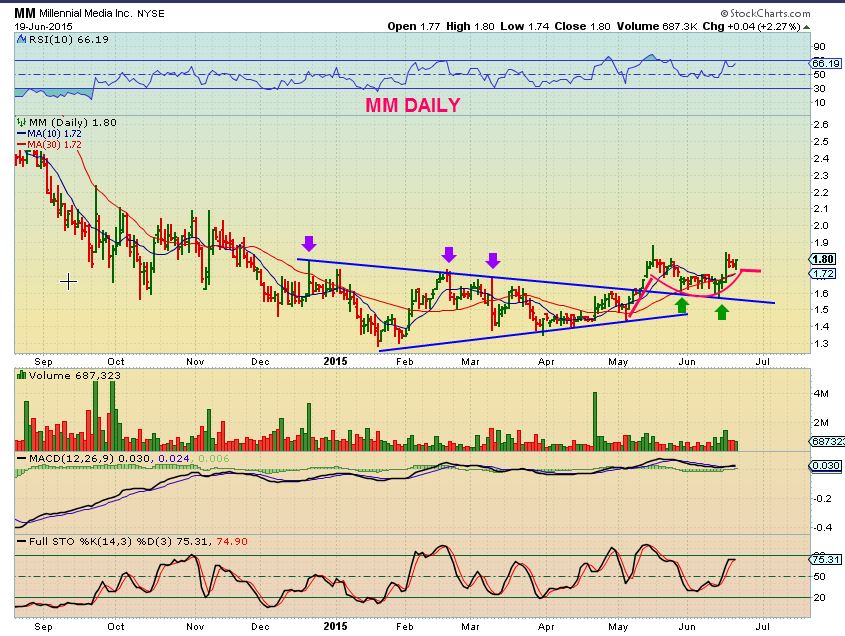
MM DAILY – Broke from a triangle and dropped to it as support 2x. Could be a small cup & handle setting up to break higher again.
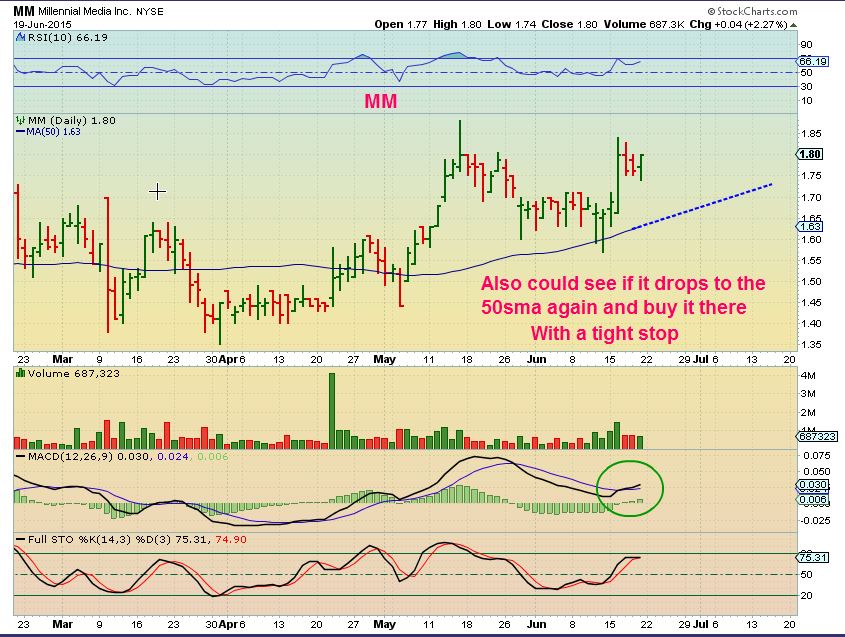
MM Close Up- It looks like it wants to break higher now, but you may watch list it and see if it drps to the 50sma on light volume too. Thats a buy.
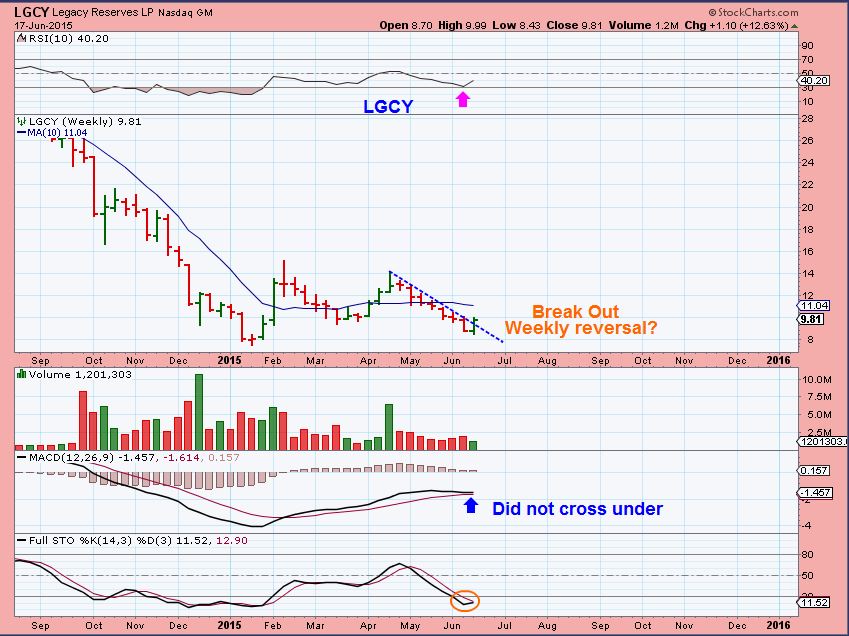
Do I trust an energy stock? LGCY looks good. This was the Weekly posted here June 17th.
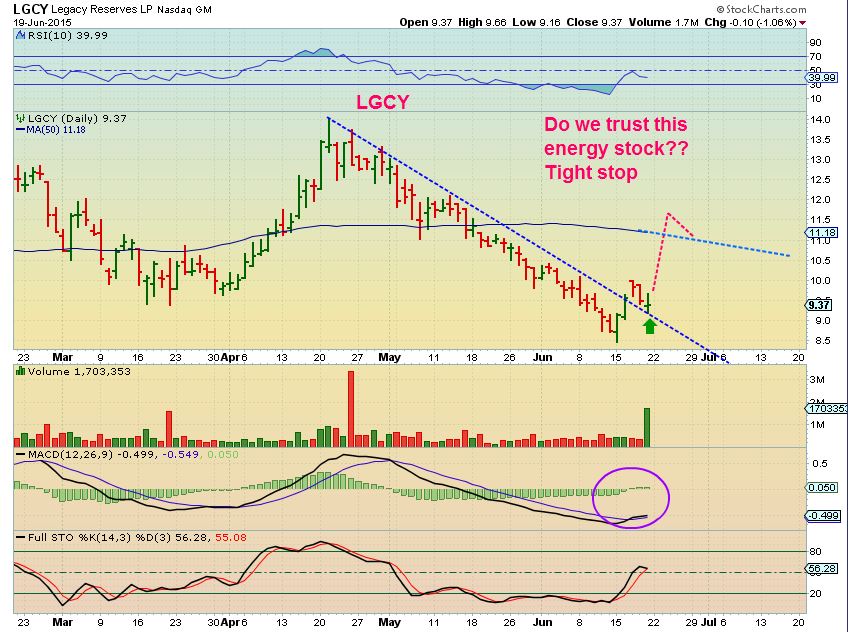
LGCY DAILY – If Oil breaks higher, this may do well. Break out & back test here? Watch that trend line.


The volume was probably because Friday was quadruple witching options expiration.
Somehow I missed that. I had a busy week last week. I would say that that was definitely the reason why.
I posted the extra chart set ups at the end of the report. Please dont take a trade just because it is presented. I include them here because I know we have active traders that want to see a few trade ideas or bullish set ups here and there. Market conditions have been choppy , and that can make trading difficult if you are not in front of a screen all day.
Wow Natural Gas going crazy..sick !!!
Yeah, what’s up with that? Keeps getting hotter so usage up which makes price go down??
Thanks Alex for checking SAN for me on Fri. Up this AM 4.80% (so far) : )
Wow – Theres some crazy action out there. look at 3 month charts of GPL, NAK, UEC, UUUU, SOL, XCO, etc etc Its not just chop, its Vol-a-tility galore
UEC got smashed last week by announcement of a shareholder lawsuit, but quite the bounce off the low so far. Who knows where that’s going. It had been the cream of the crop (technically) before last week.
UUUU is also interesting. They announced acquisition of URZ last week and both sold off about 5% on that (I hold a small pos in URZ). But now UUUU has launched quite bullishly from that sell off. Interesting times
Yeah, I keep seeing over reaction everywhere and some strong recovery. ( WLT is up almost 50% today LOL) Nak got smashed & recovered.
Even ZIOP took a hit today right to the 10sma and then went green.
I’m mostly in CASH right now & may stay that way until I either short gold or go long at the ICL. Also Odd that GOLD was down $18 & silver was green.
Mostly cash myself, I did buy some BIIB and KITE last week. Up some.
Yeah, Some Biotech and Pharma have been the best charts lately.
No apparent news on GPL. Huge capitulation?
Same for XCO.
I had a good run recently in SOL. Got stopped out this morning, but made some $$$
NBG back up there. Up 17% today and indicators pointing up.
Yes, we are sure has a deal. At least for next 5 minutes. 🙂 Honestly, am sure they will work something out, aren’t really going to let this fail. Too costly politically.
By no means is this on its way. What we know is higher lows and positive indicators on daily and weekly. Has potential. Apparently 20 July is crunchtime as Greece has to agree by 30 June then has to 20th for determination of default or not.
I have this as a long term.
Right, but in general I don’t think EUR will let this fail, just my opinion. Too much volatility for me, though. I used to dabble in that level of risk and did very poorly, so I’ll leave it to the pros.
Indeed and the charts suggest exactly that. On verra. The risk is clear – bankrupt or huge. And the former is not indicated by the charts.
Constructive volume too
Euro (quasi opposite to USD) back up to the c1.14. At resistance. FXE moving averages looking good and indicators pointing up.
If this breaks up, $ should break down.
But notice commodities are selling off with the dollar all morning…
Really, really upset that I waited until today to short gold, would have been up big if I had grabbed Friday. Basic concept is to short any pops and continue building intermediate term swing short until we hit lower target or Alex sees the ICL coming in. Not being all at once, accummulating slowly. Nothing else working for me right now.
CLNE hanging by thread, looking to wait that and crude on any minor strength at all, will sit on sidelines with energy at that point.
Alex, what are you’re thoughts on this chart? I do not own it yet.
Hi Bill, the pattern is good, but I am so glad you dont own it 🙂 It has like 1600 for volume and it just gaps all over the place. If you took position and it gapped down on say 200 shares, you’d probably never be able to get out without matching the “ASK” (BID/ASK) price .
I have seen those spreads get ridiculous.- Like its priced at $24 , but you can BUY it for 24.25 ,and can only sell it for 23.60.
Thanks Alex
Someone mentioned Walmart WMT last week? Its looking good to me. Should at least get to the 38.2% retrace. Any other opinions?
That was me. I like it. I will be starting to build a position most likely today as it is working on a wave 2 down with a stop below 71.70. Good risk reward imo.
JNK looks toppy….
Look at AMBA….great run up , but this is why stops are important . If you owned it and walked away this morning happy with your entry last week…ouch. 2 1/2 weeks trading gone
REN…. flirting with <$1
Nat Gas may be moving. UGAZ is coming out of its $1-3 range.
Not sure why the sudden spike in oil, but not complaining. They let me out final 1/2 positon in UWTI at exactly breakeven. Just gonna watch now. CLNE up, a couple pennies above stop. I’ve pretty much married my Nat gas position at this point.
double down on UGAZ at $2 today (my average cost is $2.14). It’s gonna be good!
I added Fri so sat pat today, will relook add in future but expect to move up from here.
Stopped out of CLNE at close as it gave it all up today, 4.5%. Completely out of oil and energy stocks, no plan to add any time soon. Remain in gas.
GDP! UP 20% thought it was going to zero.
So was WLT—up over 50% today 🙂
Is the worm turning! The timing isn’t right is it? Isn’t the USD starting a new cycle?
USOIL starting to move. Lower Highs, Higher lows, something has to give. regained the lower curve. Some bottom feeder energy stocks are moving higher, WRES, SFY, GDP
I exited UWTI at today’s pop. No position, didn’t like bad reaction to last 2 EIA reports with neg draws and extended consolodation. Will get back in once it breaks higher. For now, 61.5, 62 proves just too much to overcome.
IMH might look good here. Very quick pullback below 19 and bounce. Think it looks good below 19. Not commodity or $$ linked. Seems to trade in its world, which can be good for diversity.