
It Looks A Little Mixed
Yesterday was Fed Wednesday and as usual we had a little reaction to the Fed Release. Lets take a look at the charts
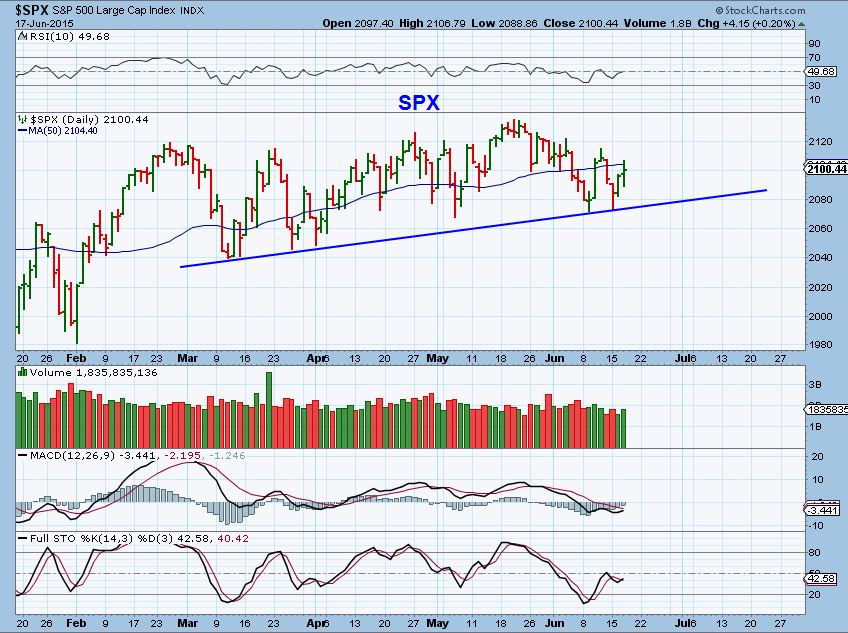
SPX– closed higher but couldn’t hold above the 50sma. It still looks bullish at least for a run to the highs of this trading range. Why would that looked like a mixed picture?
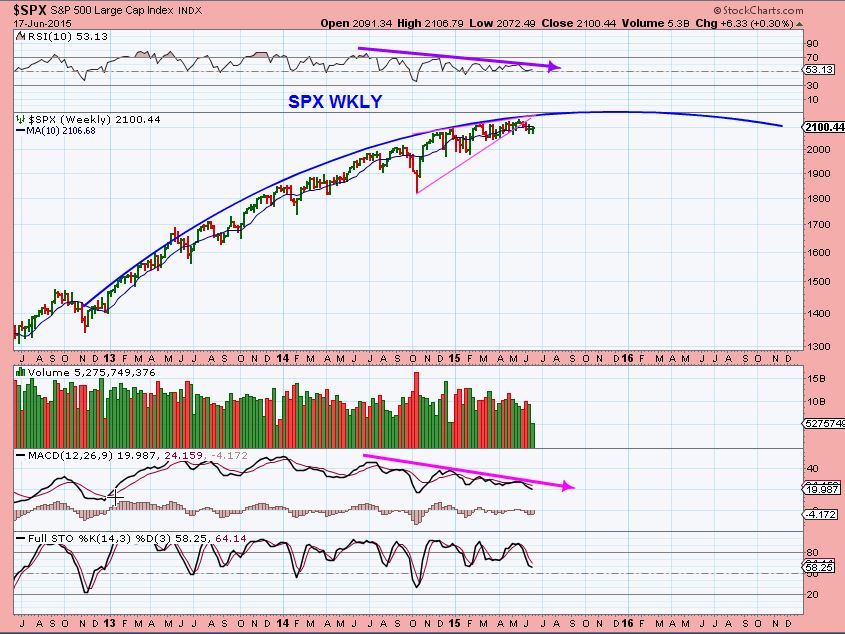
The weekly SPX looks to be weakening over time. Tops are a process and we could be seeing that process playing out now.
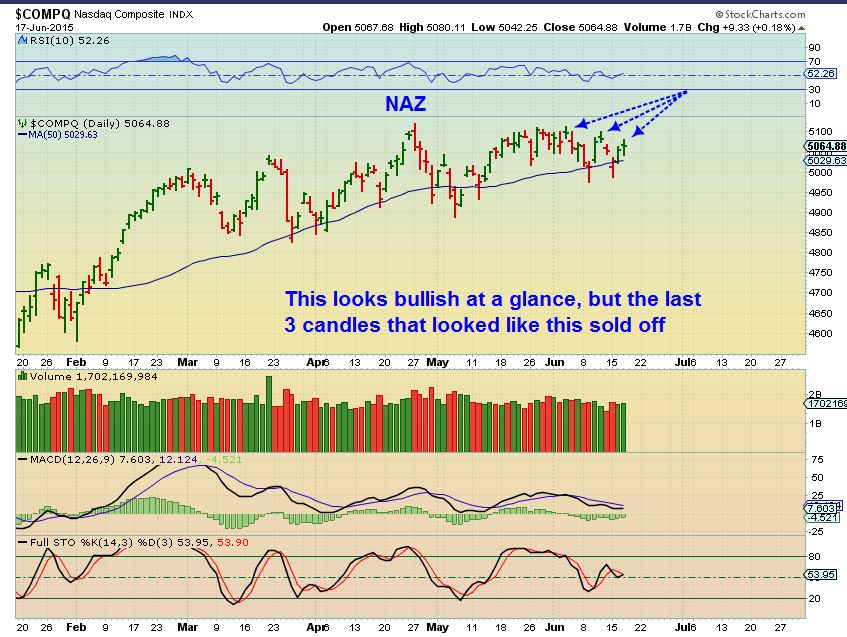
NASDAQ– the candle yesterday can be a reversal or continuation. Many tech stocks have bullish set ups and sentiment s low, so it likely goes higher .
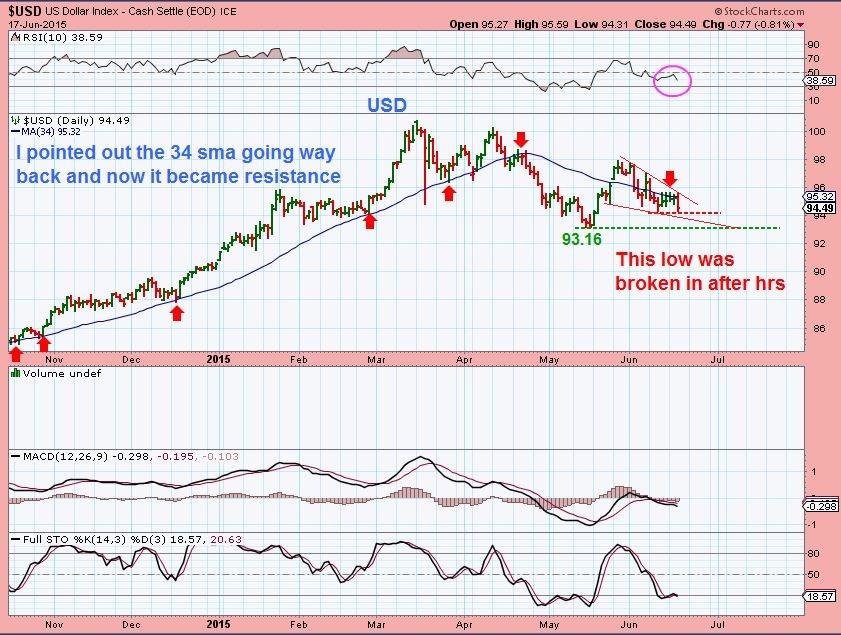
USD– We are on day 24 now, the dollar has been weak at resistance that I have pointed out. There is a possibility that June 10 was a DCL & it just failed on day 5 (Yikes), downside would be huge in that case. I dont think that likely, but watch that $93.16 area. Any way you look at it, this is L.T. and may be showing weakness. I see a small bullish wedge possibly forming?
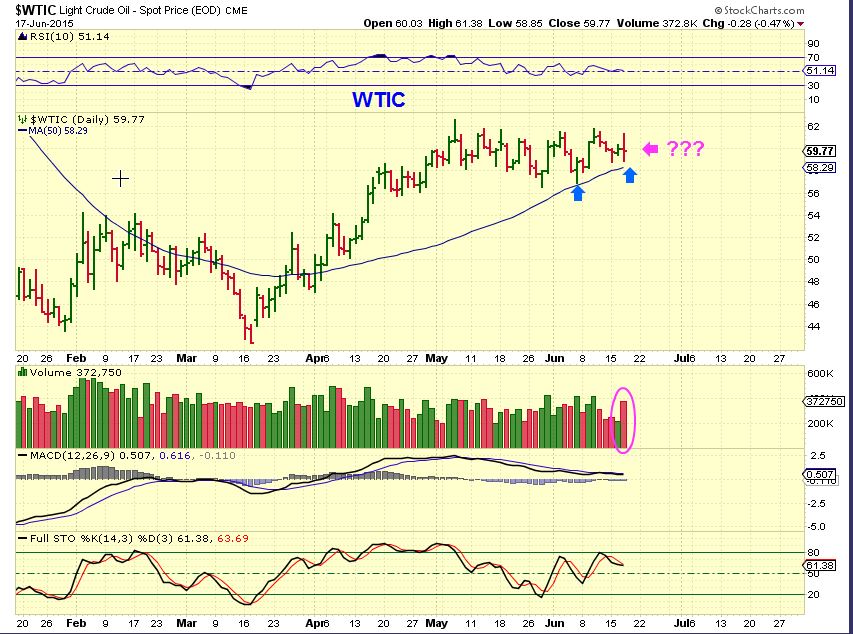
$WTIC– I do not have any idea why OIL took off so nicely in the morning and then put in a Doji by the end of the day. I got called away from my desk at noon yesterday and missed ALL of yesterdays action pre and post Fed 🙁 Above the 50sma, it is still fine.
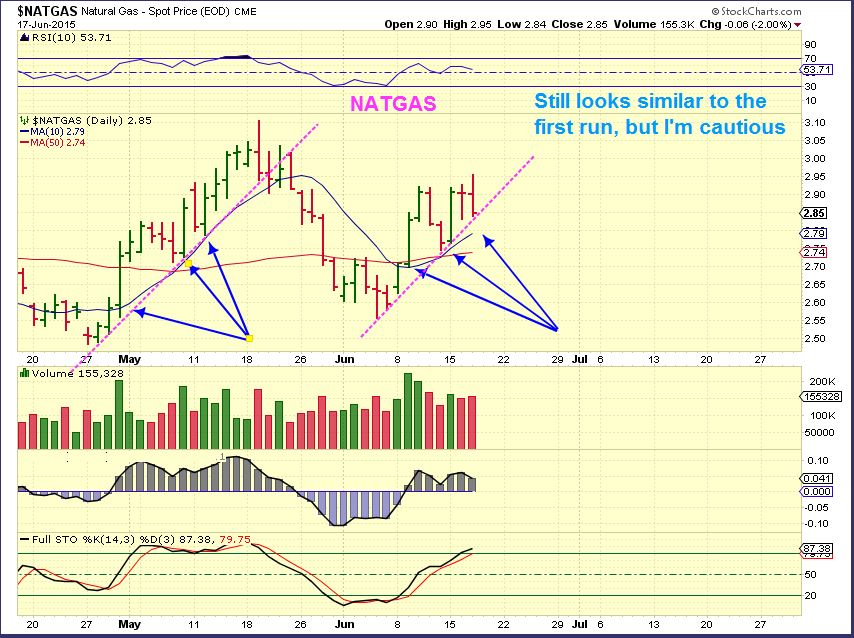
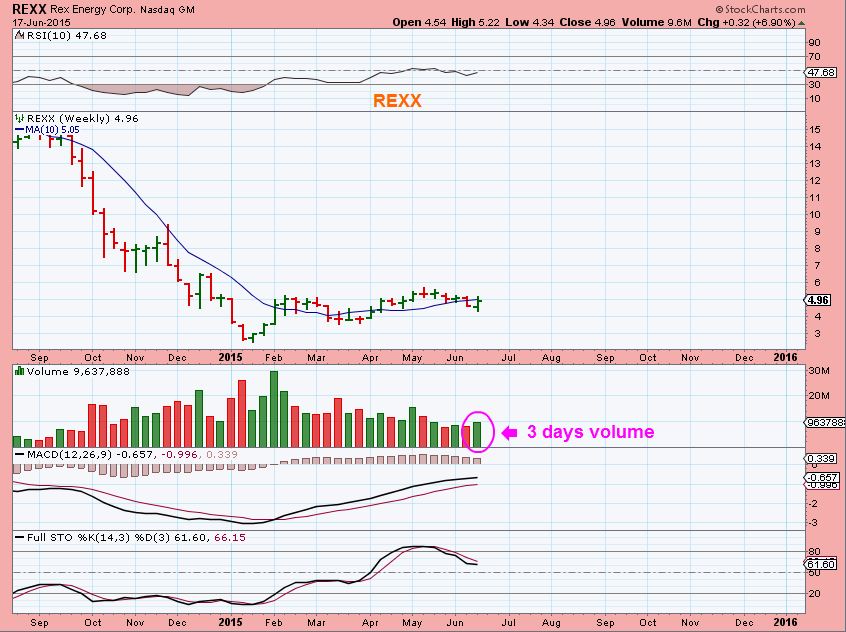
NATGAS – When I look at NATGAS , it looks similar to the first run higher, but I am watching the 10sma at $2.79. We should tag that and reverse higher today. I suppose we could drop to the 50sma and be ok, but I dont want to see that so early in the run.
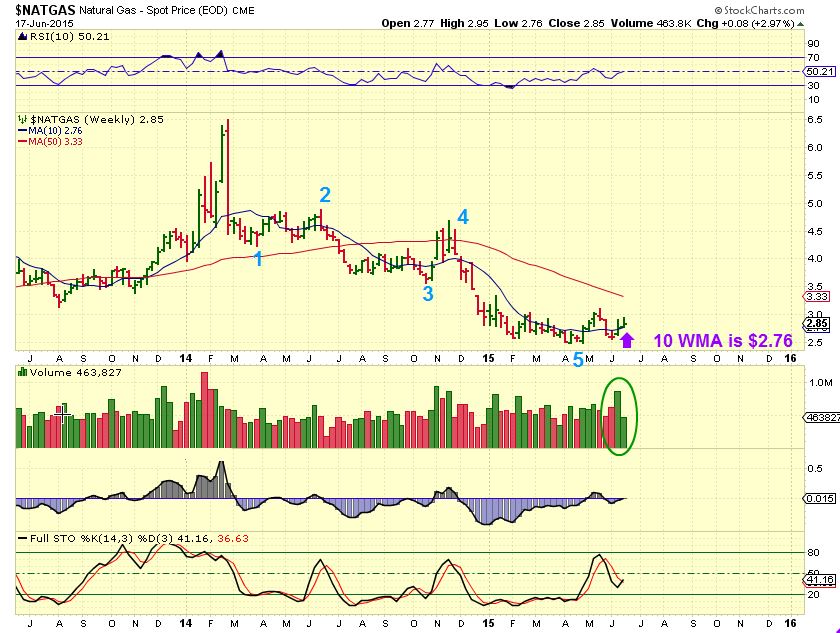
NATGAS wkly still has me seeing 5 waves down and a bottom reversal with good volume. That last vol bar is only 3 days old.
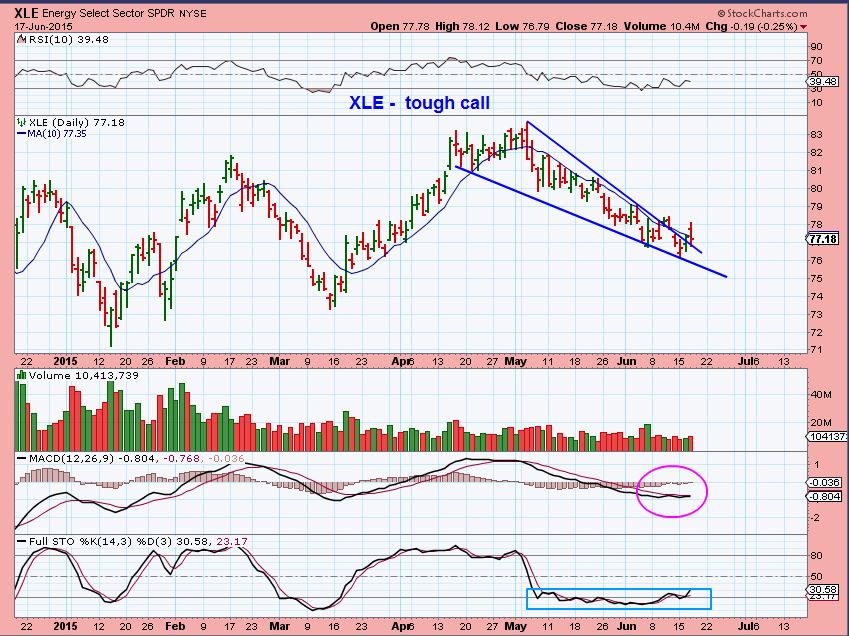
XLE– another piece of the MIXED PICTURE . Very oversold, it Popped above the trendline of the wedge, but sold back off. The MACD looks like it is flat & crossing higher. Some energy stocks look ok, others are in bases ( and yes, 1 that I watched , GDP, fell away).
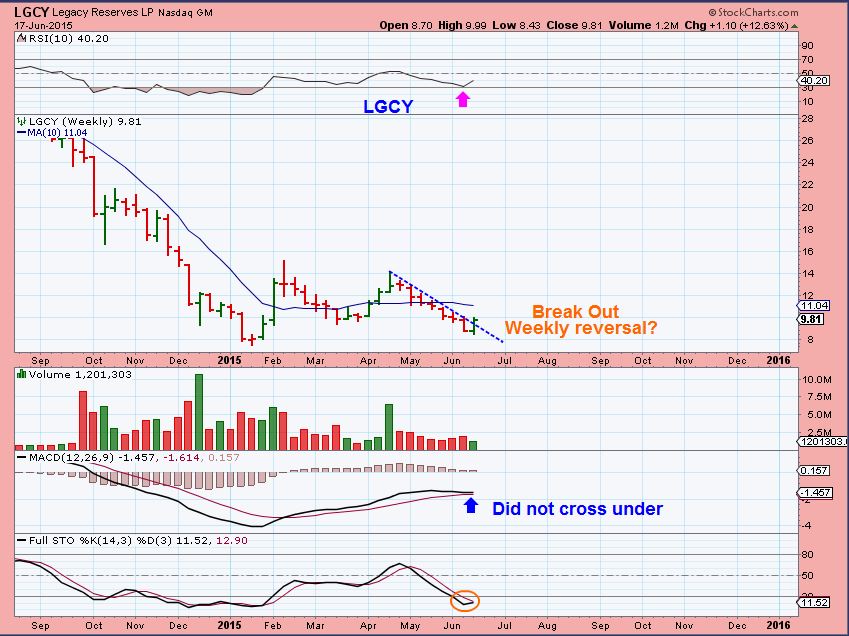
I decided to take a big picture look at a couple of stocks that I follow to see if this week they show any signs of strength, since I was expecting a 2nd leg higher in Energy. Its only WEDNESDAY on the chart, so there is more time to improve or weaken. Some look good, others need to improve. REXX, LGCY & OAS look like they are improving here.

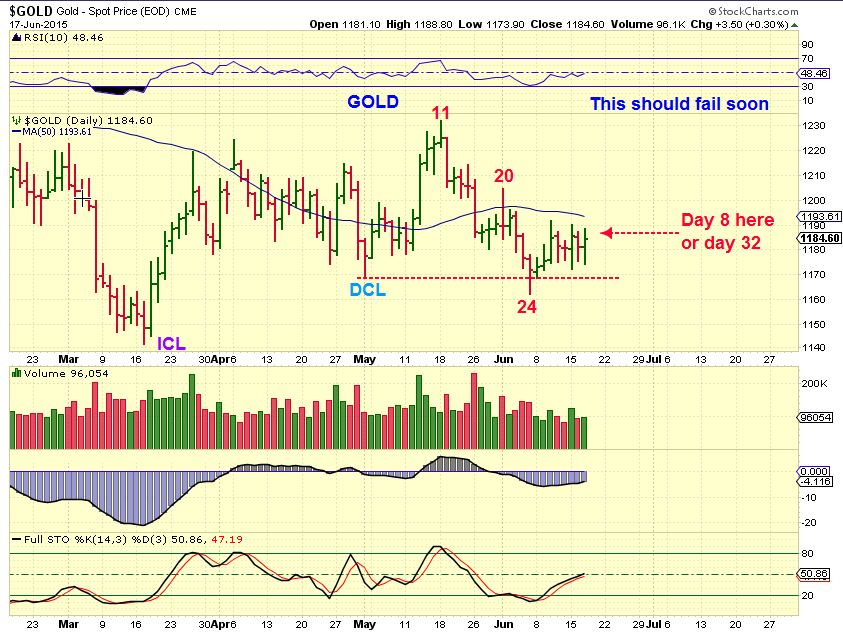
The Picture really gets mixed here, because Silver and Miners look very bullish and GOLD (Using cycles ) look more bearish or tricky. Gold looks like it is on day 8 of a failed cycle, SILVER and MINERS look bullish. Miners look like they are on Day 1.
.
GOLD– Thinking that this is failed & left translated cycle, this should fail soon. SUCH A MIXED PICTURE. Normally I would look at day 24 as a ‘stop run/ shake out” that leaves people behind. In pre-market we are due to gap over the 50sma, and that is bullish. Cycle-wise this has failed and should roll over . Be aware of that.
SILVER– This actually has resistance at the 50sma and trend line. Look at the moves out of prior lows. Silver can really POP out of lows when its bullish, so we’ll see if Silver can break higher through the 50sma . 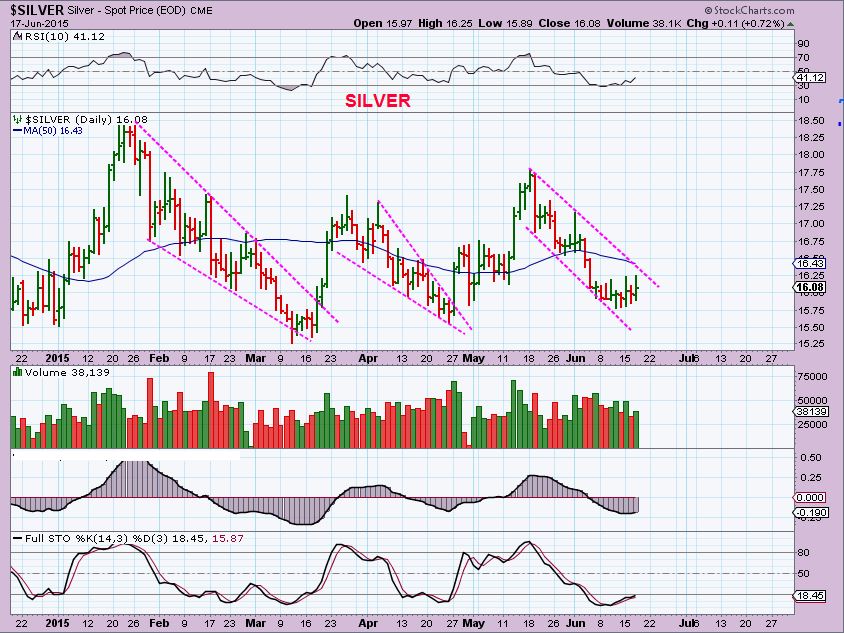
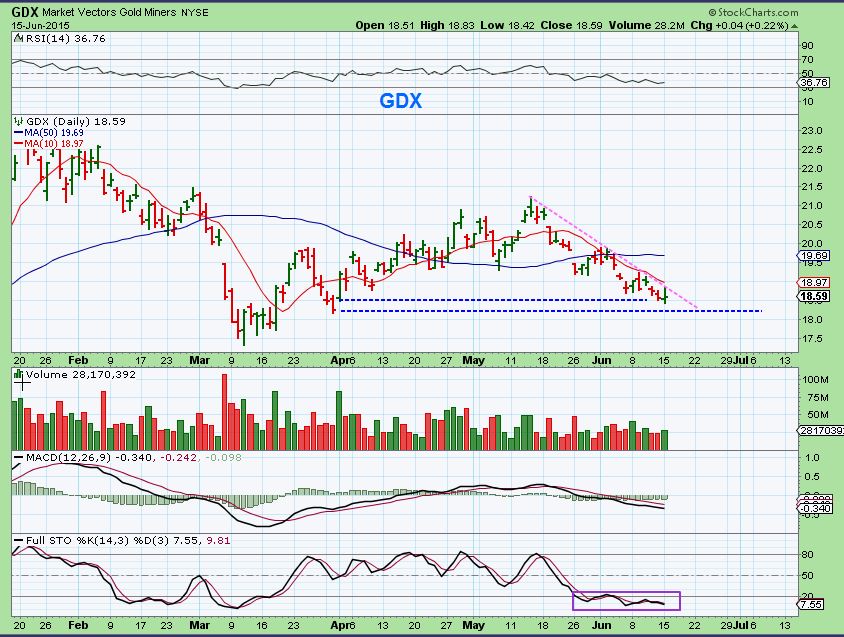
GDX- Back on June 15 , I was looking at this descending wedge and tiny gap fill.
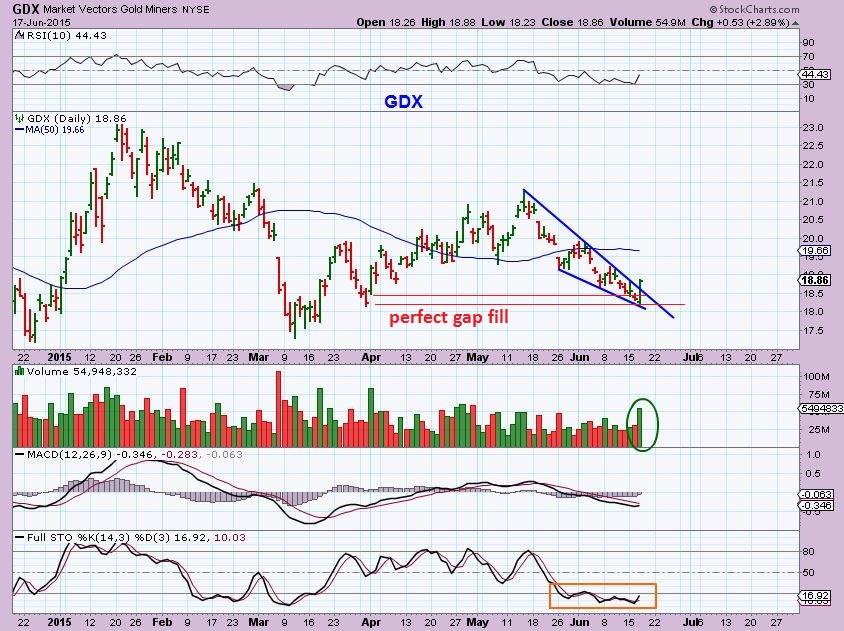
GDX – It acted perfectly , and reversed strongly yesterday. It looks very bullish. It was worth a trade ( I wasnt in front of my computer , so wasnt able to buy that reversal, but I definitely would have) . Some individual miners may be worth a trade here.
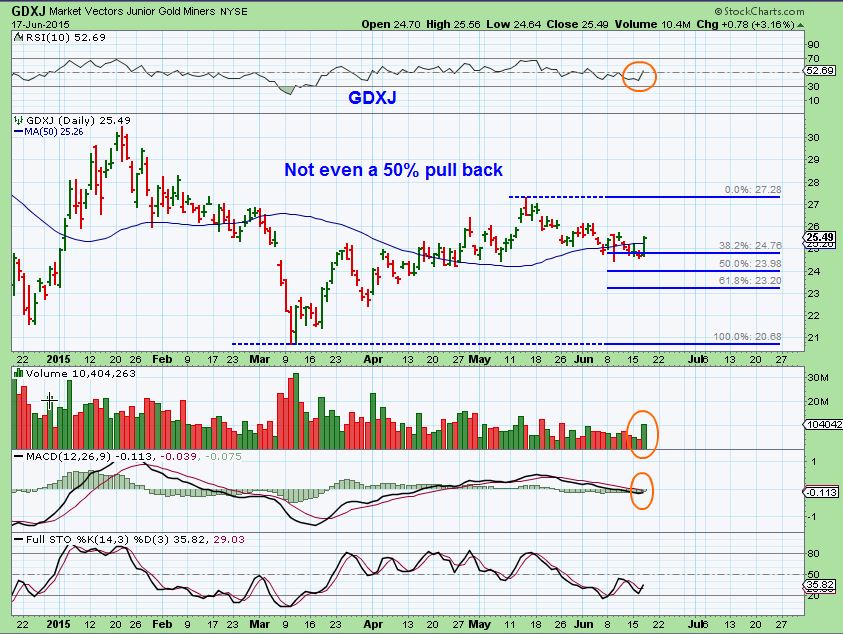
GDXJ– Speaking of strong, GDXJ never pulled back much below the 38.2% area. It also just re-gained the 50sma . It would not take much for GDXJ to break to new highs above the May highs. Everyone is so afraid to touch miners , and yet I have been pointing out strength in some areas. This looks very Bullish too, so its a Mixed bag in the Precious Metals sector.
I have repeatedly mentioned RIC, TRQ, LSG, BAA, etc as showing strength & Accumulation despite selling in Gold & SILVER.
Here are a couple of examples of recent consolidation and strength since March (short term, not long term)
In fact : Let me show you what I am looking at 1 more time. In past weekend reports I have mentioned that I see an illusion show going on. I see metals selling off and yet some Miners holding up very well, possibly being accumulated.
Notice the selling again in Silver recently. Note: May through June $17.75 to $15.75
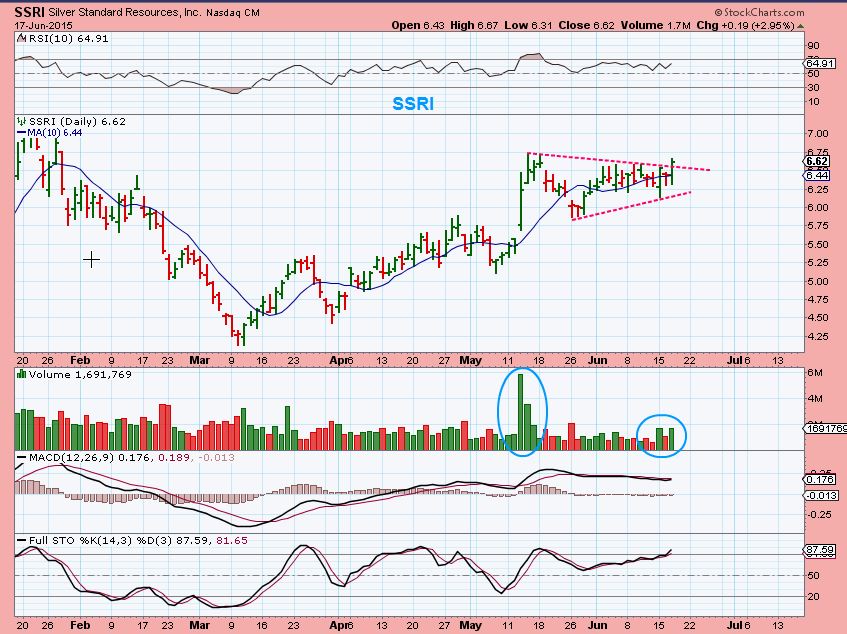
Here is the silver stock SSRI. It is at recent highs while Silver sold off to recent lows.
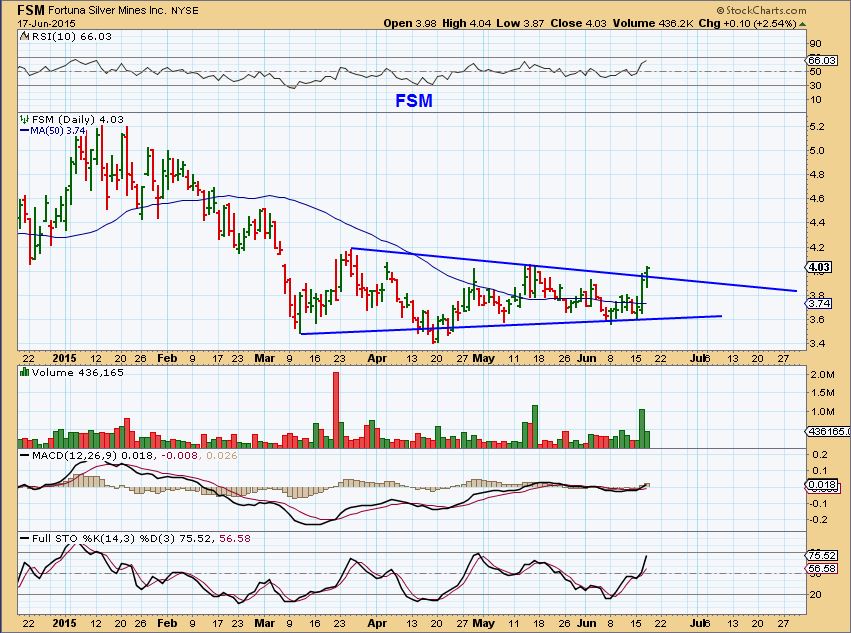
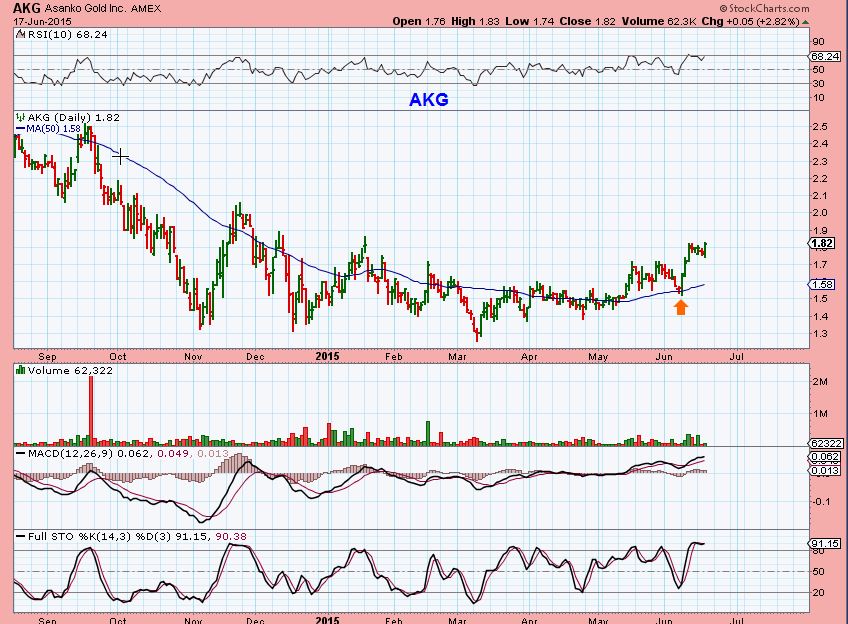
AKG– a Silver junior. So while Silver sold off to recent lows, AKG is what…?
I may cover this a bit more again in the weekend report. Draw your own conclusions, I definitely have mine. I wish GOLD would get smashed to $800-$1000. These Miners would be a screaming buy in my opinion.
I got called away from trading yesterday afternoon and missed the whole crazy action. When the dust settled not much changed really, but we did get the expected volatility. Metals reversed higher and the Dollar got knocked down. Futures are currently green in many areas except for the US Dollar and Natgas. The Natgas price is $2.81, still O.K. above the 10sma . Jobless claims is being released this a.m. , we’ll see what that does, if anything. Since I was away yesterday, I dont have any new trade ideas today, but prior trade ideas mentioned are still valid. I need to see how things play out a bit more in Metals / Miners . Some traders may want to risk a trade in Miners, because Miners look like they are on day 1 of a daily cycle. Very odd. Stay alert with Miners, they move fast and can fail. Keep in mind that the Metals are set up to fail according to cycles theory, please be aware of that. On the other hand, as I have pointed out, Some Miners are ignoring metals movement and look like they are on day 1 of a new Daily Cycle. Silver sold off recently and some silver juniors went higher. Interesting. STAY ALERT & USE STOPS.
Happy Trading


The dollar cycle may explain the unusual patterns. It always bothered me that the dollar didn’t retrace at least back to the 38% Fibonacci level. It also seemed strange that a first daily cycle would top in less than 12 days. First daily cycles in new intermediate rallies should be right translated. Even if the intermediate cycle is destined to be left translated it should still have at least 1 right translated daily cycle. So I’m thinking the dollar is still moving down into it’s ICL and that ICL will bottom when the current daily cycle bottoms. It’s now on day 24 and I could see the GDP report next week being the trigger for the ICL at either the 38% fib (92.50) or the 200 day moving average a little bit lower.
Then at that point the dollar would be set up for the next leg up in the secular bull market. That would presuambly push stocks down into a true ICL later this summer along with the CRB moving down into it’s 3 year cycle low.
Food for thought…
GOLDS last IC did not have at least 1 R.T. cycle. The first was left translated. Day 13 high, 32 day cycle
Translation is determined by whether the cycle fails or not and makes a lower low. The number of days are just a guideline to determine whether the cycle is likely to make a higher low. In the case of gold the high came on day 13, which technically usually indicates a right translated cycle and that is what happened. The DCL held above the previous DCL so the cycle was successful. AKA the intermediate cycle is still advancing by making higher highs and higher lows. The dollar looks like it is still making lower lows and lower highs so the assumption is that the declining phase of the intermediate cycle isn’t done yet.
Confusing-
You say – “Translation is determined by …..Whether a cycle fails & makes a lower low?” Doesnt this contradict what you said above in your first statement about the dollar. . you said
“seemed strange that a first daily cycle would top in less than 12 days.
First daily cycles in new intermediate rallies SHOULD BE RIGHT TRANSLATED . Even if the intermediate cycle is destined to be left translated it should still have at least 1 right translated daily cycle.”
You speak there as though the dollars first daily cycle is L.T.. The dollar didnt break the lows, yet you indicate that the dollar seems left translated?
According to what you said in this comment, you would view the dollar as currently right translated since The lows werent broken? So the dollar did put in an ICL and remains a weak R.T. cycle in your view? Confusing.
Translation is ultimately determined by whether the cycle is making higher highs and higher lows, or whether it is making lower lows and lower highs. The number of days is just a guide to expectancy of which it will be.
Usually a cycle that rallies for 12 or more days will make a higher low at the next DCL. That’s what the gold cycle did. Most of the time when a cycle rallies for less than 12 days it will make a lower low. That’s what the dollar looks like it’s getting ready to do. So the number of days is a guide but not a hard and fast rule.
I’m going to guess that once the dollar completes it’s DCL then the next cycle will rally for more than 12 days and the next DCL when it comes will hold well above this one. That would indicate an intermediate cycle that is in the advancing phase.
Ok , thx for sharing-
I think it depends on which cycle analyst you follow. I follow 2 cycle analysts, I believe they view translation differently from you. They would view the dollar currently as locked in at left translated, though the lows were not taken out..
Here’s what I think is about to play out.
yeah, Quite different from what you wrote 2 days ago. Thx
Yep we have to adapt as things change. If somehow the dollar can hold above the recent low then I will go back to the long sideways triangle scenario but after the last two days it looks like the most likely outcome now will be one more leg down and then a strong rally into a new intermediate cycle.
If you take the above chart and overlay on some of the possible scenarios for gold you might have something. What if…miners test but hold Nov lows, gold and silver final plunge with dollar blowoff top, .25% interest rate hike, metals start new bull. Just saying. And have to figure out where oil is on there, too.
HERO- restructural deal reached….DOWN 66%! OUCH.
Assuming the deal is enough to get the company going again, is it a buying opportunity here?
In Vegas it is ; ) I would avoid it.
I was looking at GDP and that type of capitulation usually is indicative of a trade able low for a dead cat bounce. If heavy volume keeps piling in and lows arent lower each day, it can be short cover and so on… but I am not taking it or recommending it.
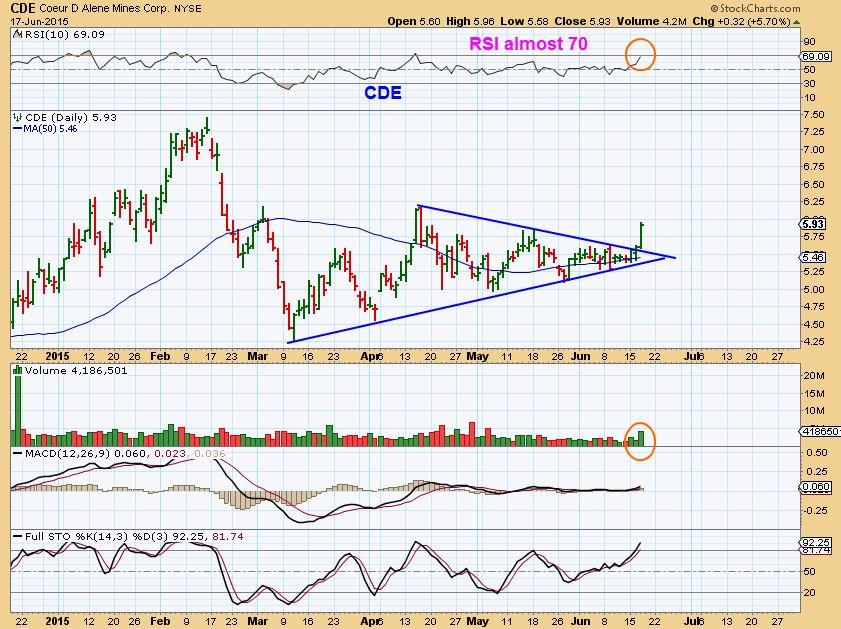
Some Silver Miners (CDE, SSRI, AKG, FSM breaking may highs). Interesting 🙂
Interesting since Silver gave up midday to close flat while gold stayed strong. I felt GDX was pretty darn mediocre considering gold was back up to 1200 and holding strong.
BIB and IWM breaking out to new highs and look strong.
How do you buy BIB here? How can you predict where it will go? Double top?
Someone asked me about KITE recently.
Refresh for a chart, breaking out . Similar to the ZIOP trade I posted last week
Did you see REPH?
Wow- I recommended that at $8 and its at $14 already?? ARGH
Man,it looks like there are no clear directions in anything right now. Gold?Silver?Miners?Energy?Dollar?Market? sit in cash I guess.
Will GDX close the gap?
These are stock picker type markets, where good set ups break out and run. The Biotechs are acting so well, but personally I have traded them with mediocre results .
Ex of ZIOP, REPH, MNKD, & MANY more running well these days
HACK security plays have looked good. Shame I sold FEYE at $45. 🙁
There is a Blue Chip stock that has sold off 20% since January and is the largest retailer in the world…..getting close to a Buy imo.
Any one wanna take a guess?
WMT, looks like a buy here! CF?
Could be , but I dont love it as a set up off of lows.
It looks like it may run tot the 50sma again
10s:2s TAs looking positive which suggests strength in prec metals
Looking to add Nat gas, $3 or bust. WTI seems happy to stay in range for now – can probably play the rails, $58-59 on the bottom but cannot get through 61.5-62. Of it does, I expect +$5 could come quickly.
Nat gas storage very disappointing. Prod is just so so high right now. WTI yesterday down do to gasoline # not headline crude.
Greece: GREK up 10%, NBG up 9%. Higher lows…
NBG rejected hard at the 10 DMA and the break down pt of roughly 1.20 It’s got some proving to do before I’d feel confident again.
I stopped out when it was rejected at the 100 DMA again and lost the 50 DMA. I’ll watch it.
Sure. But it’s not breaking (yet) to new lows
Just read bookmaker odds are:
GREXIT: 3.7
NO GREXIT 1.3
Hmmm…
I had to leave for a while, and I raised my stop on CLNE. Got stopped out and now its higher. Thats no fun : (
CLNE stopped me out, ran all the way back to $7.90, now back below where I got stopped out. crazy.
Sorry to hear, Alex. Though I guess it’sgood I’m not the only one that has that problem! She did give it up at close. Again. I’m still in CLNE for now, was going to raise stop today, but still down a bit. Funny how it’s working sideways to down but 50 day higher b/c recent blowoff top. Hasn’t been great action, thinking of just selling out at breakeven and trying again later.
CMCM – Gorgeous run since April
Love how EGI is setting up nicely.
I like GSS better, simply because it has more volume. EGI only has 60,000 so far, tough to sell if it sells off. GSS has 1/2 million so far today. similar set up.
True. Good point Alex.
Got some GSS too today. The commissions on these under $1 stock are crazy though.
Spent $104 (TradeKing…)
Wow, I thought that they only charge that way when the stock is no longer listed ( OTCBB or PINK SLIP). I think I bought BAA and GSS with normal commissions.
what broker do you use?
ETrade & Scottrade, but I used scottrade to buy GSS & BAA
just chatted with scotttrade about GSS and commissions.
Here’s their answers:
The commission for trading
stocks under $1 per share online is $7 + 1/2% of the principal. The
principal amount of the trade is the number of shares multiplied by the
price per share. So, you would multiply 20,000 shares times the stock’s
price, which is currently around $0.32, which comes to $6,400. Then,
multiply $6,400 times .005 and you get $32. Finally, ad $32 to our base
commission of $7 for a total commission of $39.
I see. I bought down at $0.20 and $0. 22 – probably didnt notice the extra. I usually get $7 trades and it looked fairly close buying 5000 & 10,000 here and there.
Is that what Trade King does?
Yes, it looks like about $12 commission on one of my 5000 share purchases. I usually pay $7 , really didnt notice.
Jumped into VXX 17.96 while everything is green, and everybody happy. A few witches going to show up Fri.
Alex, Any thoughts on $natgas? Sitting on 10dma but not seeming to move. Hold or let go that is the question…
No thoughts other than what is in the report. It CAN drop to the 50sma, but I dont want to see it close below the 10 myself. I am actually out because I got called away for the day yesterday & closed a few positions that I thought needed constant attention/ babysitting.
I dont own UWTI or UGAZ anymore, and got stopped out of CLNE today .
COG worth a shot here imo
That shot just misfired. Out very small loss
Silver stocks CDE, PAAS, SSRI, (AKG too, but it will pull back soon) looking good today .
SILVER itself hit the 50sma and dropped sharply.
EXXI also imo
I look at PACD & Hero – and I am growing cautious
UWTI looks good guys…. Still in.
ALSK looks great ( I do not know anything about the company). Tight Tight consolidation.
how beautiful!
Moving Stop up on EEM LeChiffre…….nice call !
Sure, glad you’re sharing the fun.
Still riding my calls :)))
Me too 😉
Look at a 6 month chart of EEM. I look for personality patterns in different charts.
It has a habit of bottoming 3 months apart, then running up for 8 days out of the lows, then drops, then continues to new highs. Refresh to See a chart.
Does NOT mean it will this time, but it has that pattern 🙂
.
Great Eye Alex. Thanks !
Yeah Ken, And no doubt you see the 1-2-3-4-5 in those mini runs 🙂
Why yes yes I do 🙂
Shall I add at the bottom of wave 2 😉
Exactly 🙂
another one with a higher low
Alex, if and when you have a moment please take a look at SAN to see if it meets your criteria. It’s very tempting. Thank you. 🙂
Its worth a try. Not exactly Ideal, but nice volume today and a semi tight consolidation ( triangle?)
Two nice consecutive candles with long tsils on TLT at major support. TMF?