
How Does It All End?
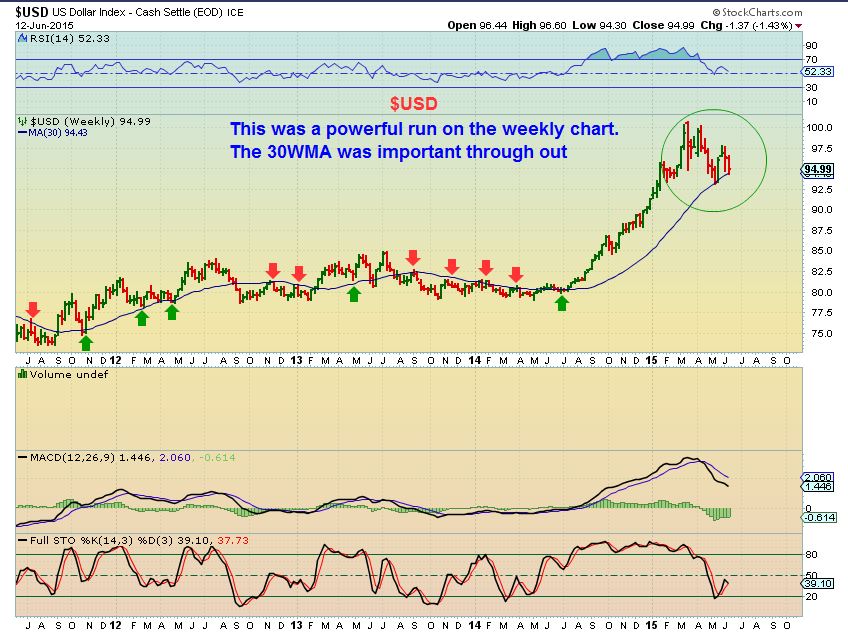
USD WKLY – looks strong and found support in an important area
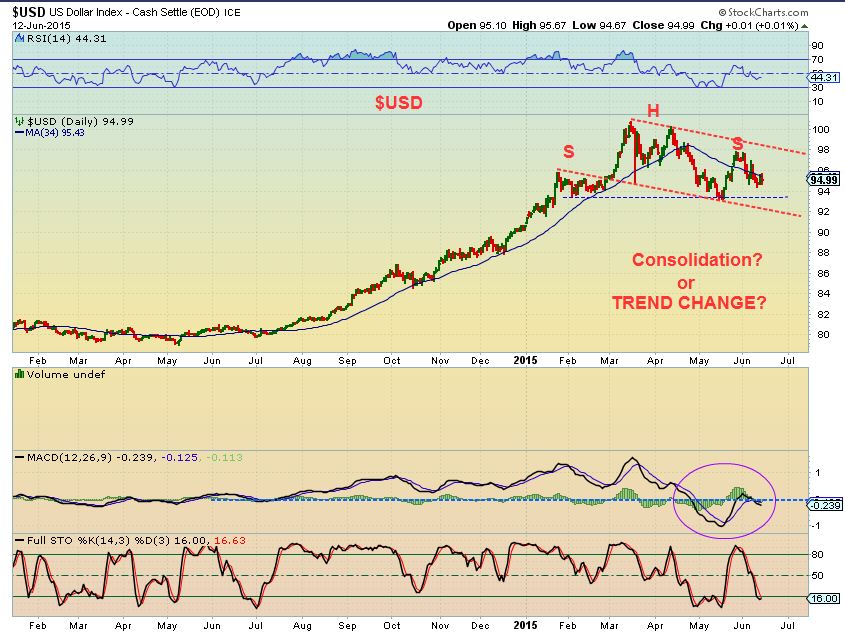
The DAILY USD – looks a bit more bearish. The MACD dipped well below the zero line for the first time in a long time. Is that a H&S forming? The outcome of this move could affect all markets.
Lets look at several other sectors…
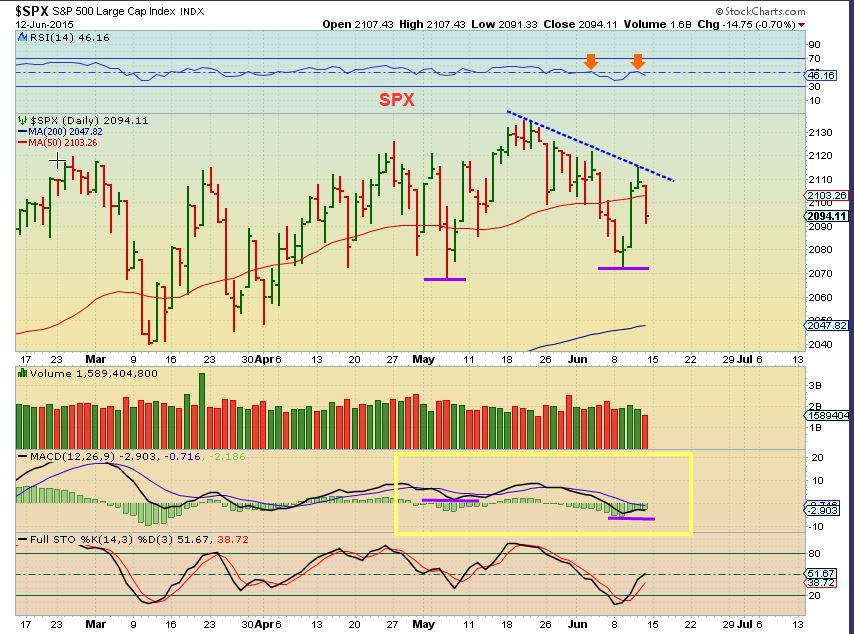
SPX WKLY – I’ve been watching a bearish rising wedge for a weeks. As price continues higher , the MACDis dropping, a sign of near term weakness.
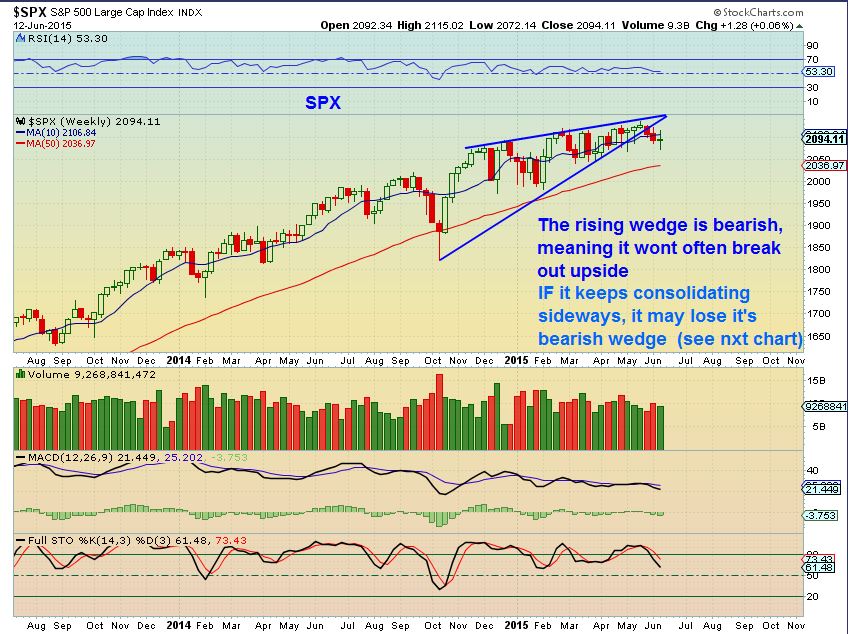
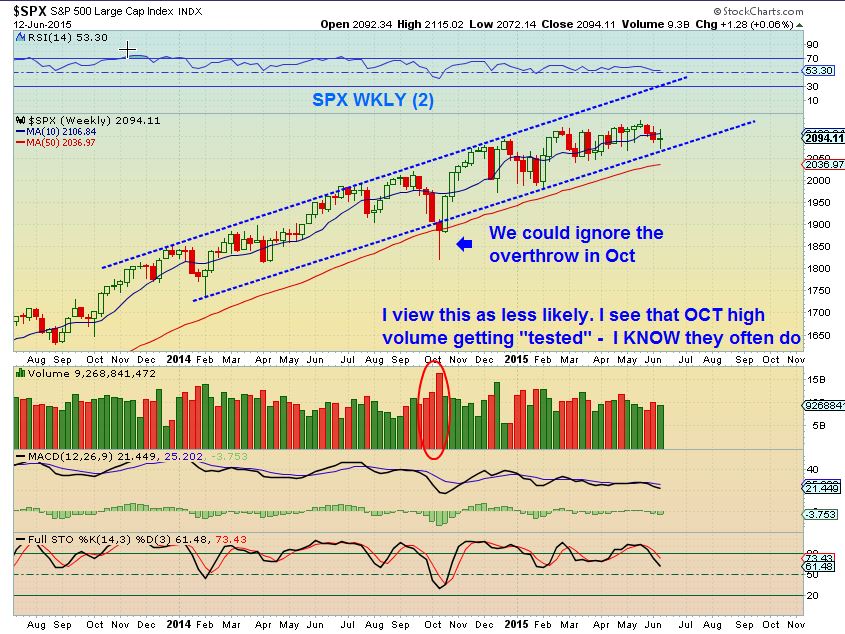
If price fails to drop and continues sideways, it could morph into this rising channel. I view this as less likely for a couple of reasons like the MACD weakness, a high volume spike, etc .
SPX DAILY- This MACD is currently showing weakness
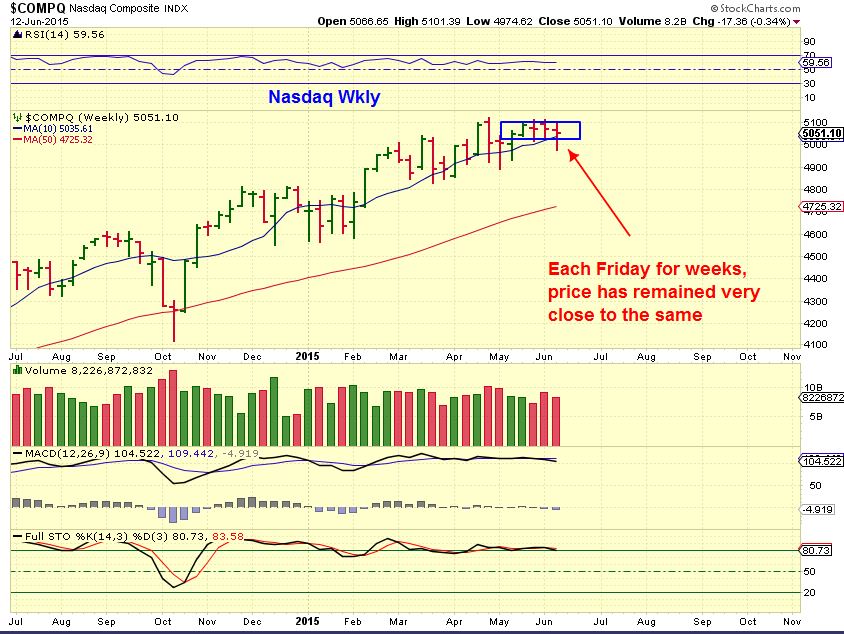
NASDAQ WEEKLY – The NASDAQ has been stronger , remains above the 10 WMA and price has remained roughly the same for weeks. This could be a form of coiling known as ” 4 Weeks Tight” Pattern ( Bullish consolidation) and many TECH stocks are breaking higher.
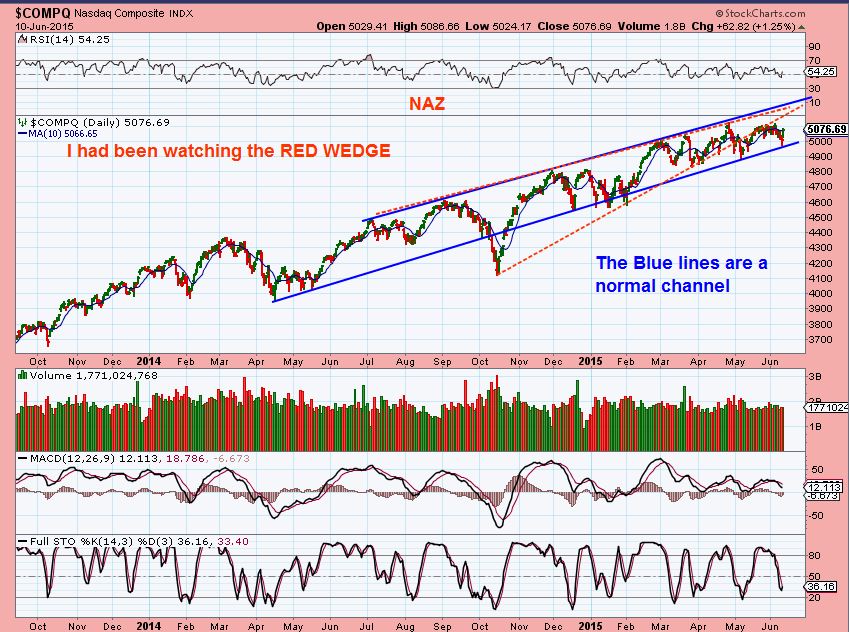
Reminder : This daily NASDAQ chart that I posted JUNE 10 remains Bullish and Bearish. The Daily charts MACD is weak. Current price is now also 25 points lower than this June 10 chart.
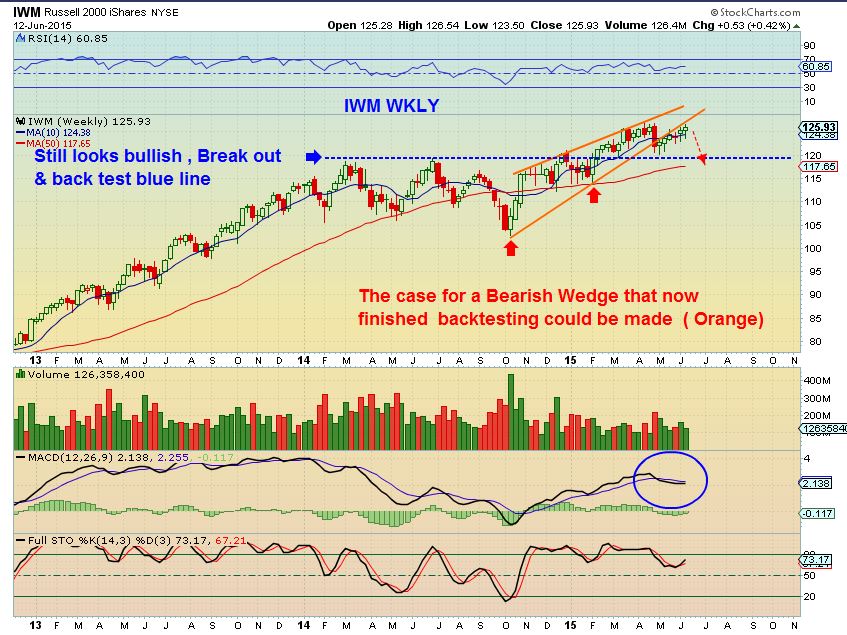
IWM – This looks like a short term double top with the wedge back tested.
Also the VIX has been basing, if it breaks out higher, markets will pull back.
Summary: There are plenty of good chart set ups in various sectors, some have been posted here. They are breaking out and continue running higher, so for now its a stock pickers market. As you can see, the above charts are leaning towards bearish at this point. Being Weekly charts, it may take time to play out.
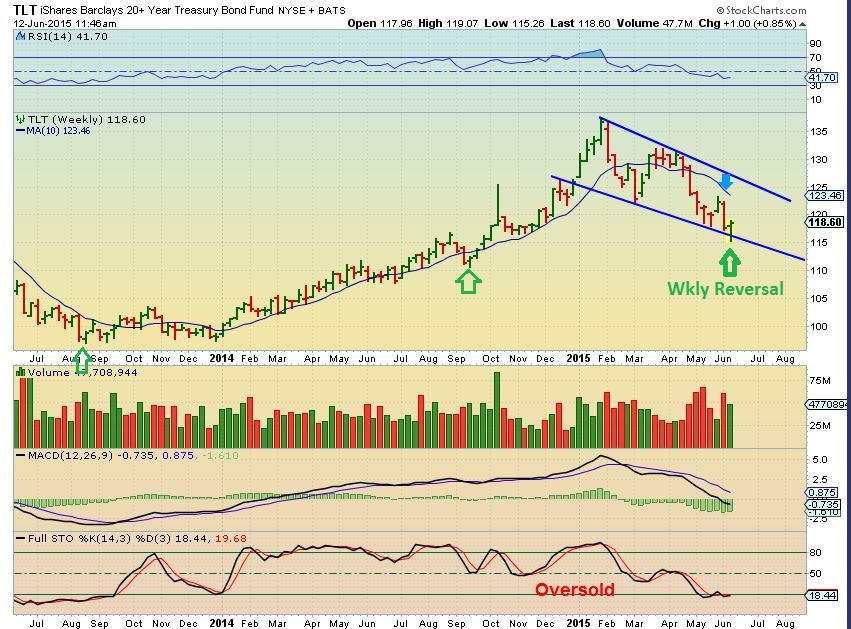
I was asked to post charts of TLT and what I am thinking
TLT WKLY – Oversold and we had a reversal last week. It should run higher, but it does look like it could be forming a down trend now. Watch that MACD as price rises to the 10WMA.
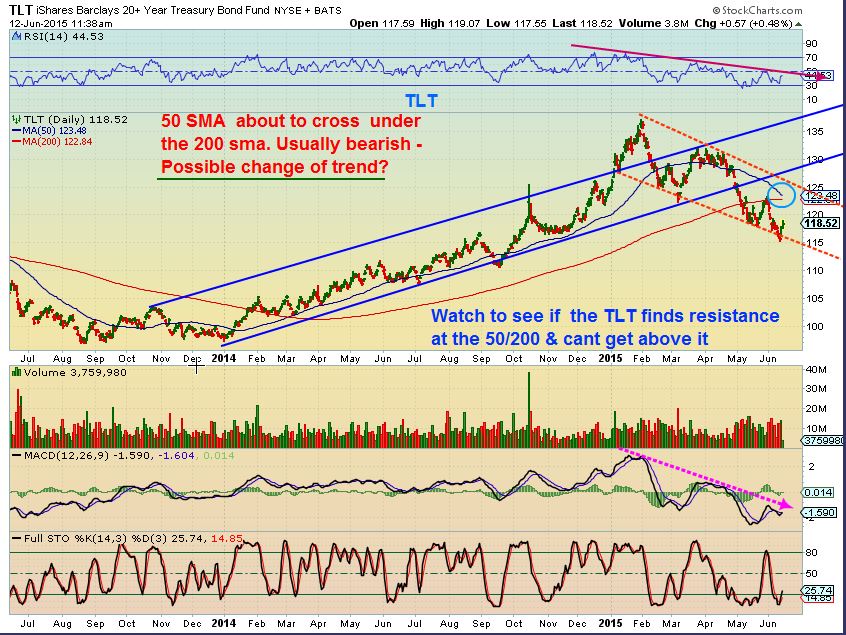
TLT DAILY – The 50sma is very close to crossing under the 200sma. Known as the death cross, it identifies persistent weakness. When price broke below the 200sma, it back-tested it and kept falling. This could be a trend change taking place. Even a strong bounce may only “Test” the underside of the channel. Watch the 50/200sma for resistance too.
$WTIC – Still a bullish consolidation closing above the 10wma

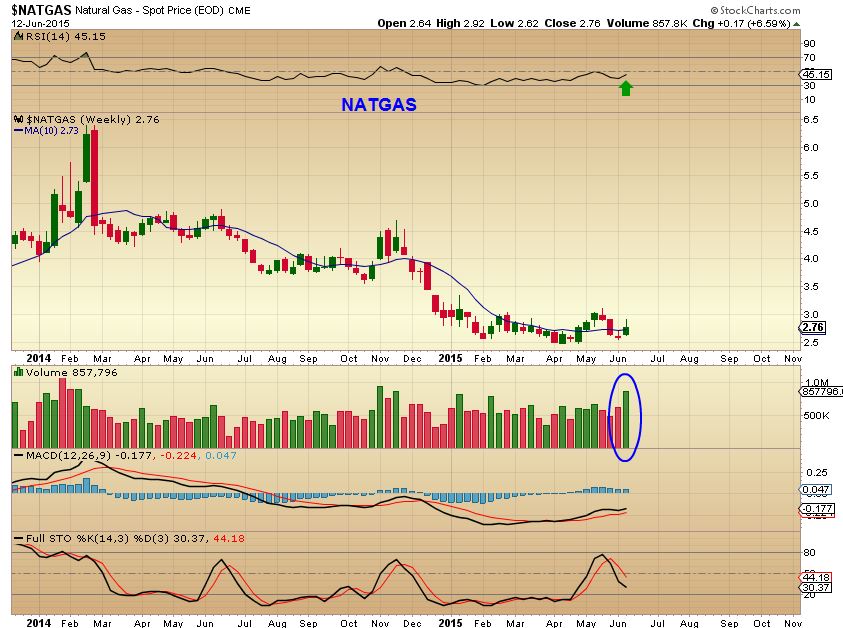
NATGAS WEEKLY– should be preparing to run higher again
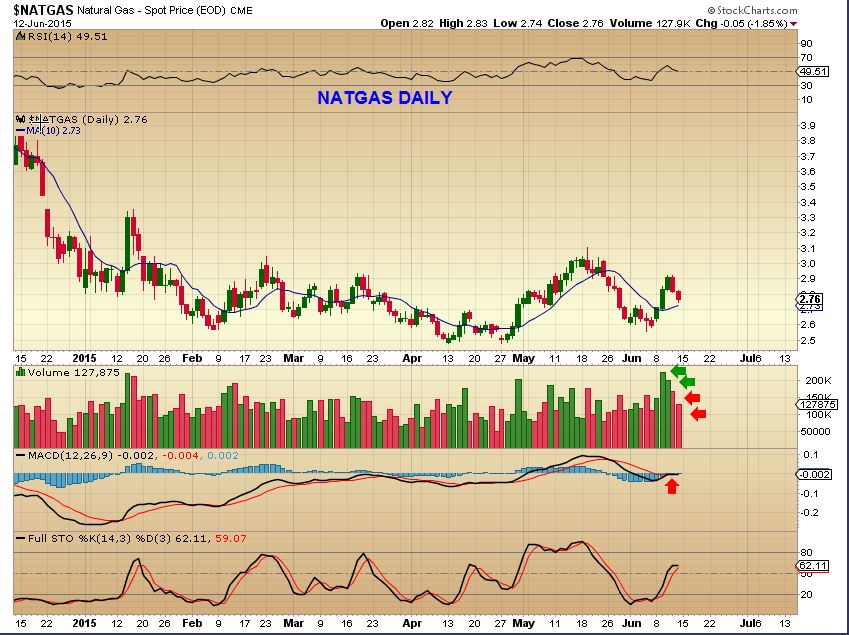
NATGAS DAILY– We saw an initial burst higher, then a 2 day light volume drop . This could be bought with a stop loosely below the 10sma.
With OIL & NATGAS looking bullish, why are some ENERGY stocks selling off below the 50sma, and so on? Is there something wrong? Does this mean OILS rally is a false rally , as mentioned by someone in the comments. No, not necessarily. While anything can happen, instead of just guessing, which causes emotional trading – I wanted to do solid research and I will point that out my findings at the end of this report.
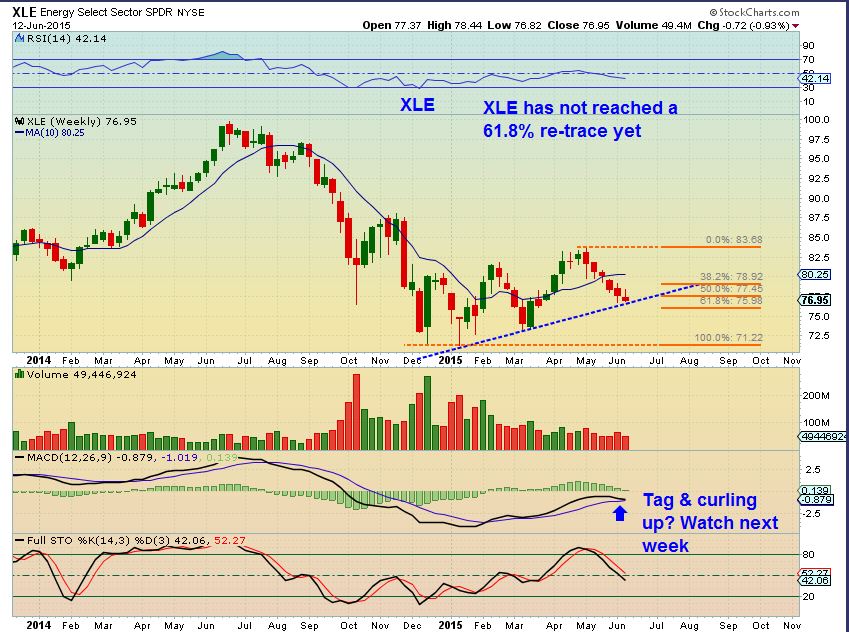
For now, lets look at XLE ,
Despite selling off for 6 weeks, XLE is above its 61.8% re-trace and on a trend-line of higher highs since January. I do want to see this move higher this week.
Next is GOLD SILVER & MINERS-
Let me just say that I believe that a great opportunity is coming in this sector. Will it be that the dollar begins a downtrend after a bounce sends Gold into a final ICL? Will it be rotation of money out of the current bull markets and into Precious Metals? A Rise in the EURO and YEN? Bonds dropping? Interest rate hikes? Time will tell, but I believe there are already signs now that such a change is coming. The hard part is foreseeing how things will unfold. There are Many opinions as you know, the majority cannot wait to buy a drop to $Gold 800-$1000. CAN IT? Yes, that would be a V-Bottom type drop & recovery. Will it? I have repeatedly said that the CROWD often get it very wrong due to emotions and bias. We want to avoid that, so we will keep alert to all of the possibilities.
In this weekend report, I want to look at many things. I dont want it to be confusing, but there are a variety of possibilities, and I want to discuss a few. I will try to release this early so you have time to read it, and re-read it if you wish.
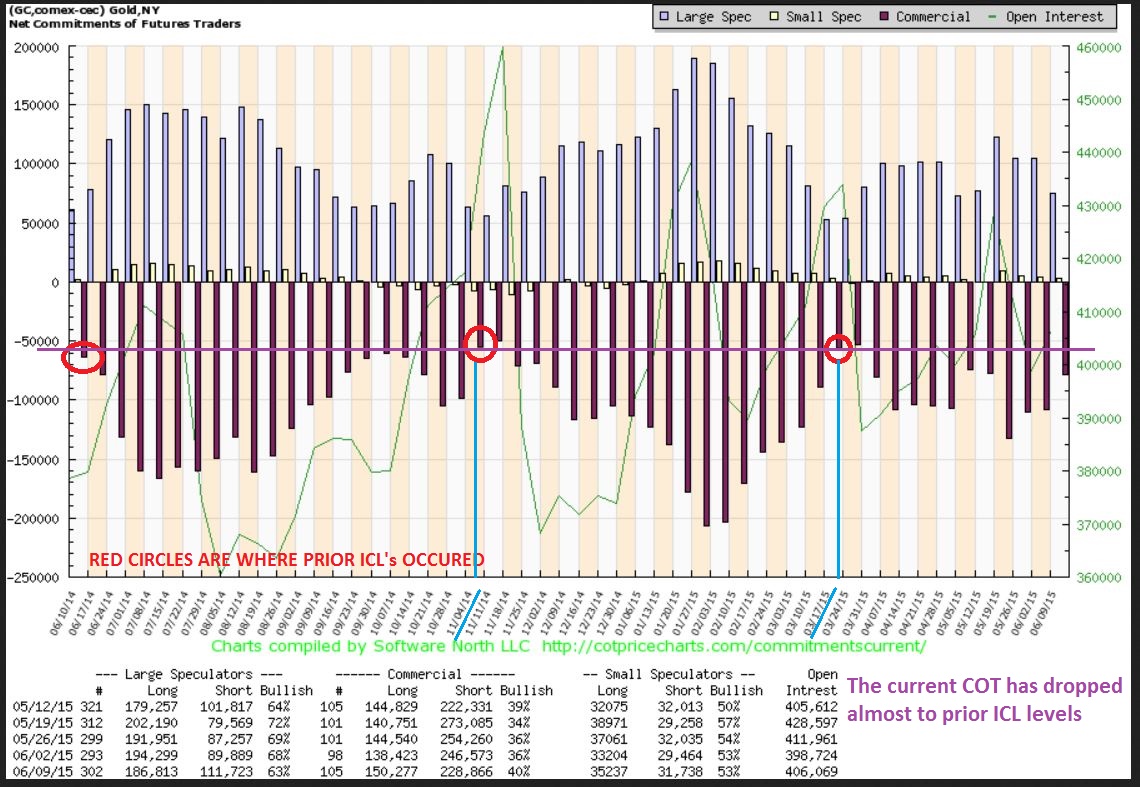
I was Amazed at the GOLD & SILVER COT readings this week! Even the SILVERS COT is nearing prior ICL readings. This is the GOLD COT.
.
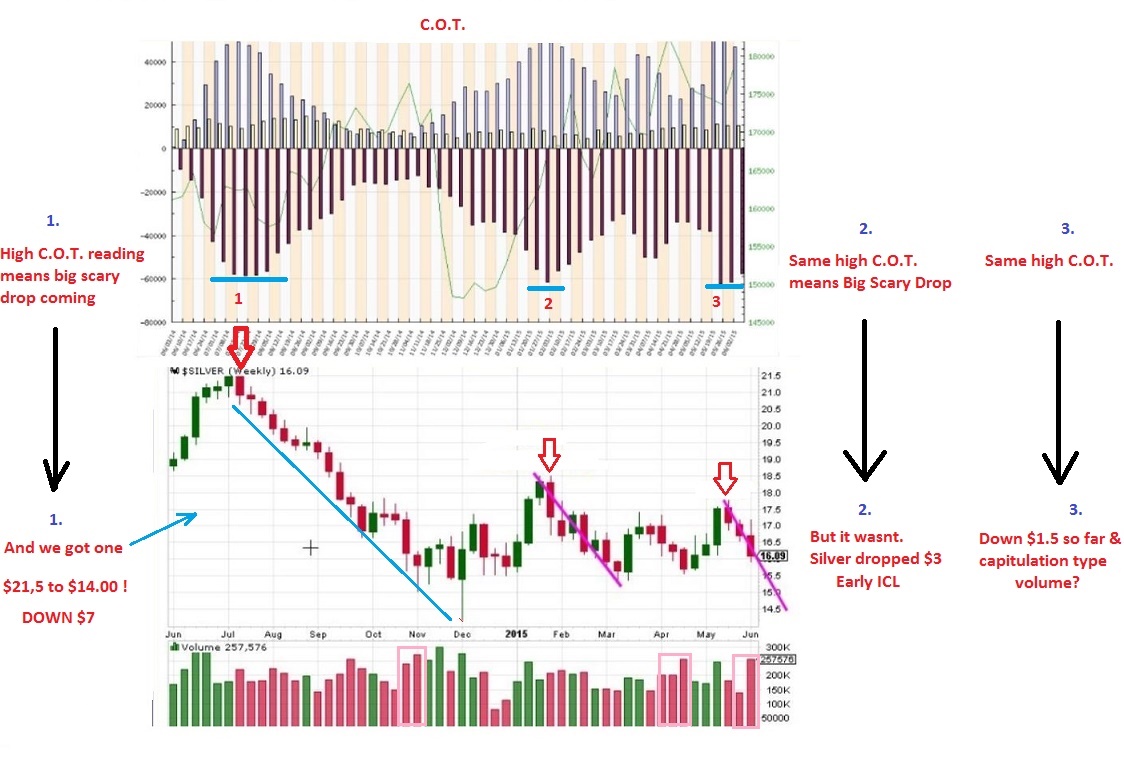
I pointed out this high SILVER COT reading a week ago. I said that everyone expected a HUGE DROP in silver with the readings this high, but I showed that the last time it was this high, the drop was not all that huge ( see #2- click charts to enlarge ).
 .
.
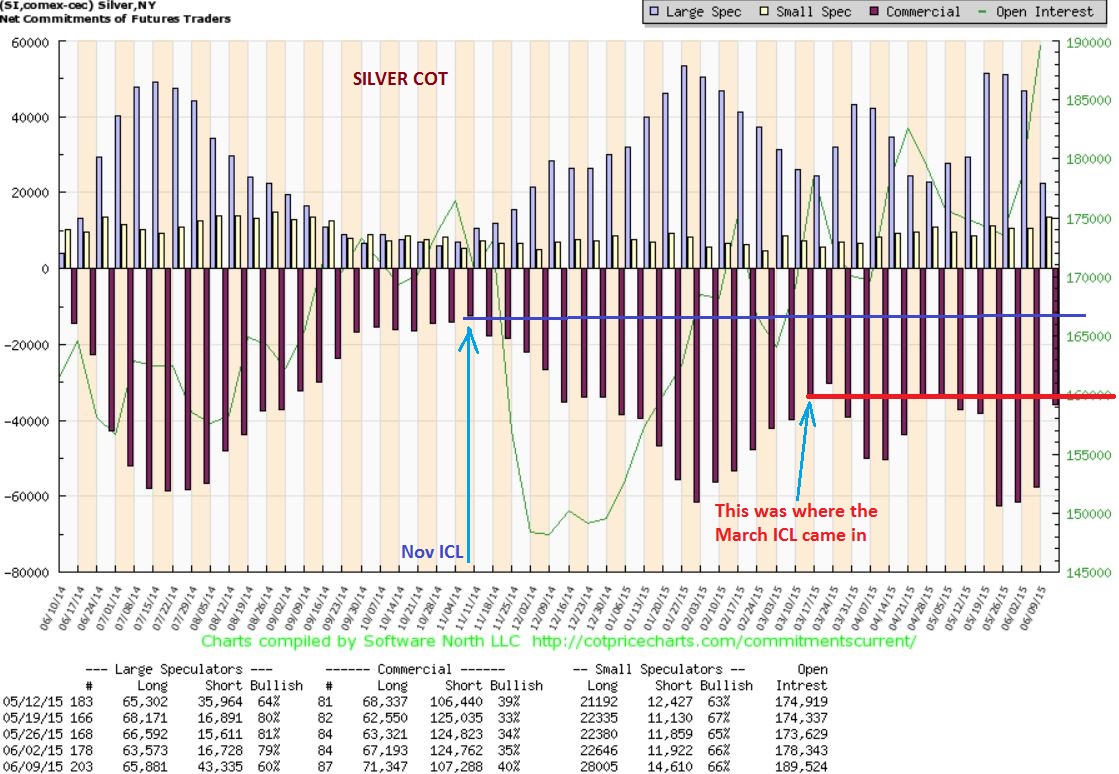
WOW! Suddenly this week, the SILVER COT has dropped rapidly. Smart Money is rapidly closing their short positions. The SILVERS COT reading is now similar to the MARCH ICL reading. Not as low as the NOV ICL, but remarkable improvement with such a small drop in silver. Silver dropped 17 cents for the week.
So lets look at the charts and in my opinion, GOLD is not as clear as some may think. COULD WE DROP FAST TO $1000? Sure, but I am not seeing signs of that yet. Let me review another view, a very different one JUST TO LOSE THE BIAS.
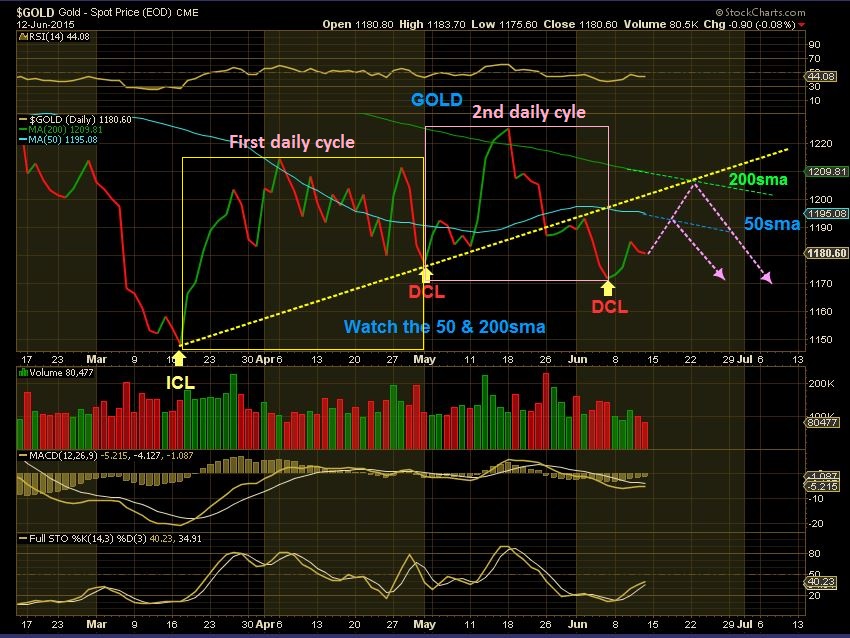
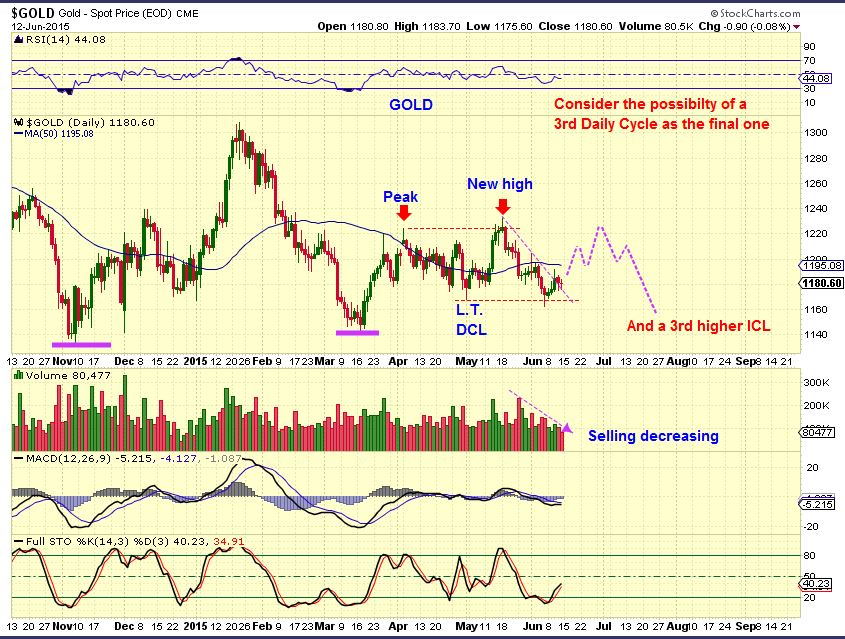
Here is a simple chart showing an ICL & the 1st daily cycle, then the second. We would now be in the 3rd and expect it to roll over .
Does it tag the 50sma & drop ? Maybe.
Does it tag the 200sma and yellow trend line? Seems logical. SO short term we could get our 3rd daily cycle pop & drop .
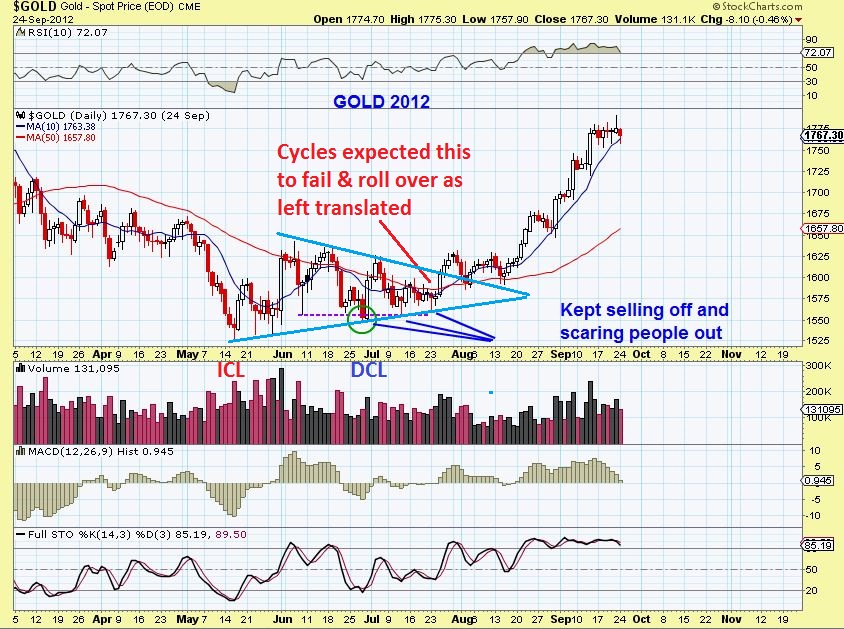
Here is what is on my mind: I dont want to confuse anyone, but most know that I use a mix of technical analysis and Cycles. For GOLD- I have said in the past that when GOLD has moved in the form of a triangle, it can throw off cycle counts. It acts differently. Lets look at GOLD in a triangle in 2012.
In 2012 Gold kept going sideways, making higher lows , lower highs ( triangle). The 2nd daily cycle looked left translated, it was expected to roll over. It broke from the triangle and extended the daily cycle. Where was the 3rd DCL? HIGHER! And off she went. TRICKY TRIANGLE.
GDX 2012 was worse! It had ‘stop run’ after ‘stop run’ and most said that it was thus a “FAILED CYCLE ” and must roll over. Notice that GDX broke day 30 lows, then day 39 lows, etc. A definite Failed daily cycle- Frustrating everyone…. So look at it now, was it a 47 day cycle and then it took off upside? It didnt make sense.
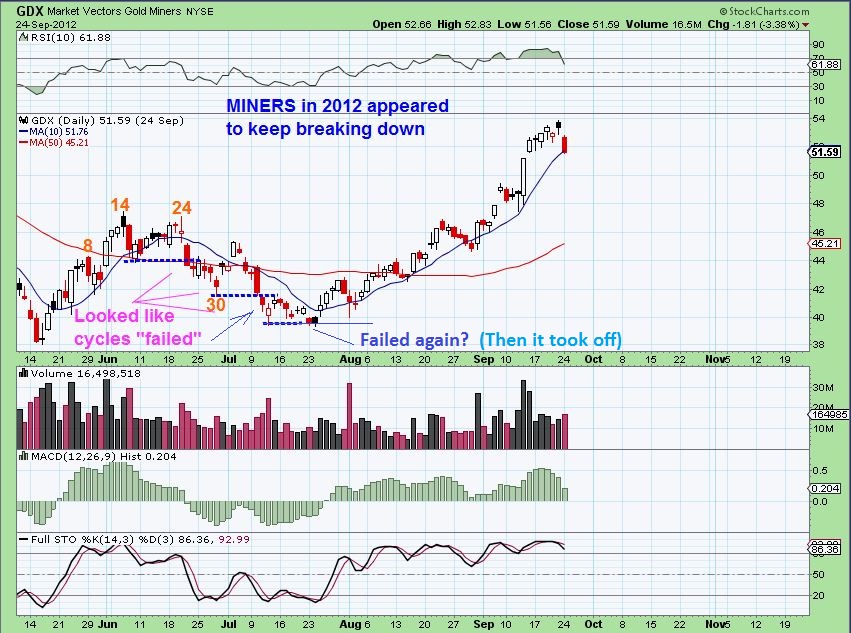
My point? I use CYCLES a bit less in TRIANGLES. Cycles are great timing tools, but when a Triangle forms , they seem to act differently. BACK in 2012, I relied on CYCLES more and missed that first week or so higher.
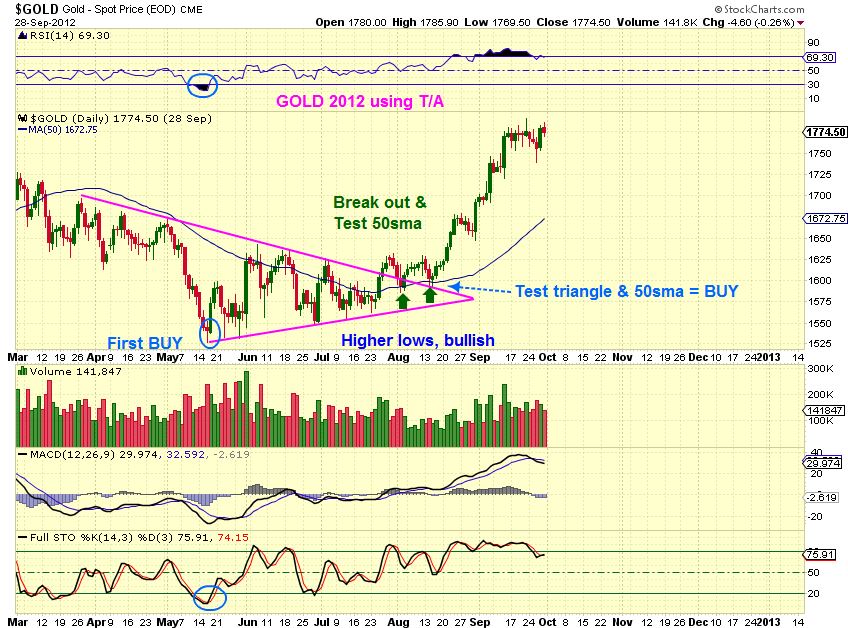
Now look at GOLD 2012 just using Technical analysis
Break out, back test. Test of 50sma…perfect buy signal.
Fast forward to today. GOLD WKLY- Oh no. Higher lows , lower highs = Wkly Triangle? Maybe . I see some interesting changes too. The ICL’s were coming 6 months apart, the last ICL was only 4 months long ( see the chart below). With the current COT readings, could the next one also come early? 4 months would be Mid March ICL to Mid July.
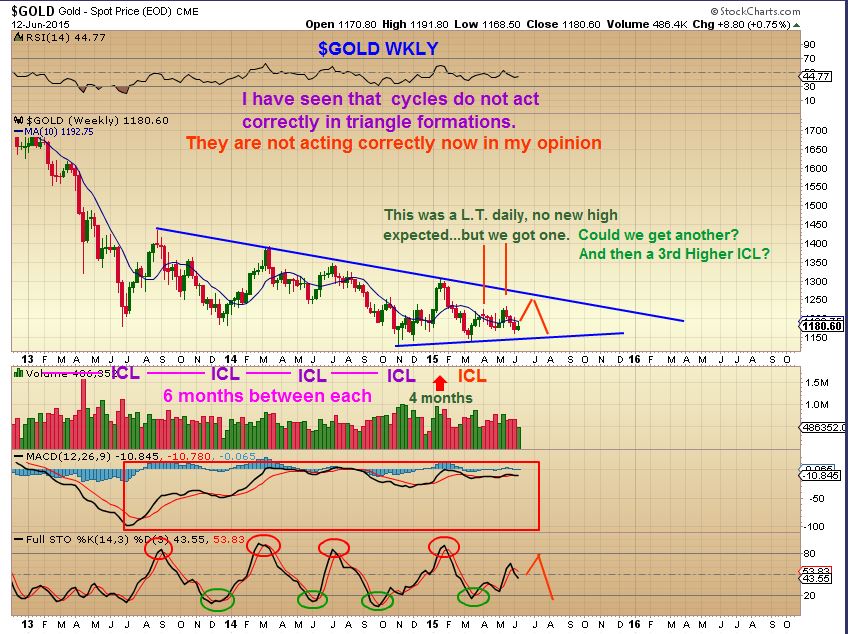
Why do I say on that chart that GOLD is already not acting correctly cycle wise? See the chart below. We had a higher high after a left translated daily cycle. Now what looks to be a DCL is barley lower than the last one (chart below). What if this 3rd daily cycle also just goes sideways and higher , eventually dropping into an ICL that makes a higher low after 4 months? In my opinion it would be very Bullish.
EVERYONE waiting for $1000 Gold will be left out. Likely they will watch it run off and they’ll be expecting another drop to a 4th daily cycle of $1000.
IS THAT MY THINKING FOR GOLD? Not in a big way, but I can see it as a possibility. I just dont want to expect a drop to $1000 so much that “IT HAS TO COME and we will all buy there”. The above scenario is not out of the question, but it is way too early to say. I do currently see things that make me think that GOLD not going to $800-$1000 would fool everyone. I cannot tell you how many letter writers and Gold bugs in blogs and forums are ALL GONNA BUY THAT DIP at $1000!! THAT alone makes me look for another scenario.
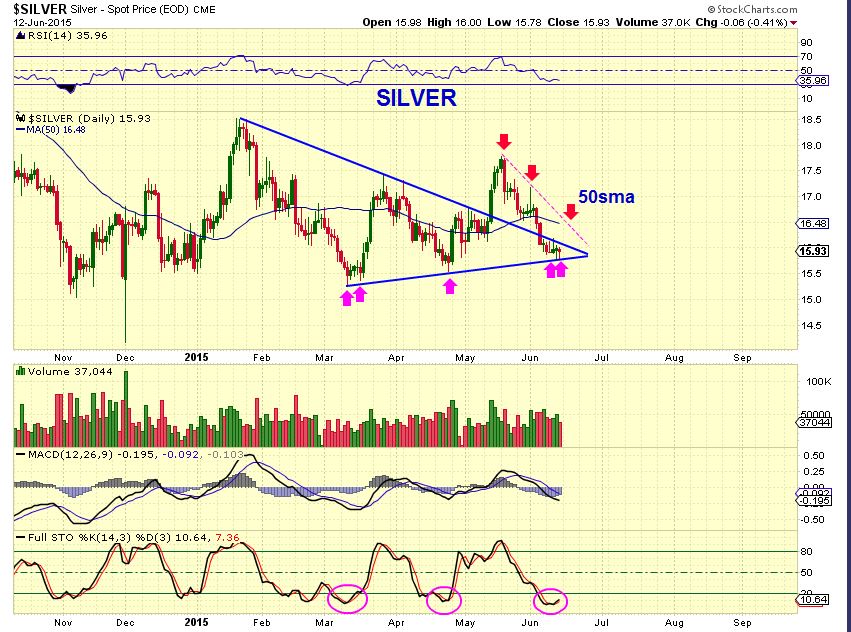
At least SILVER isnt in a Triangle too 🙂 That huge COT reading a week ago and still in this same triangle pattern? Quite oversold.
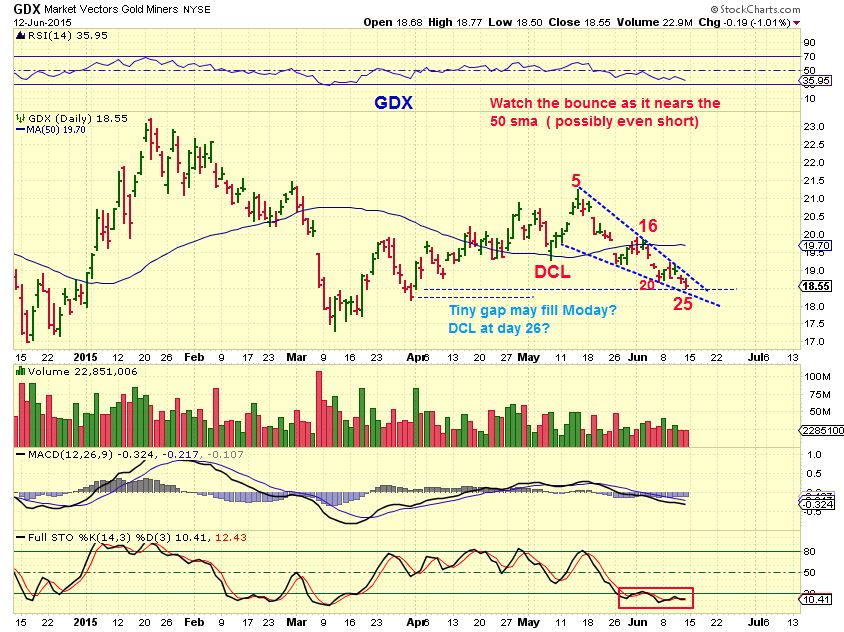
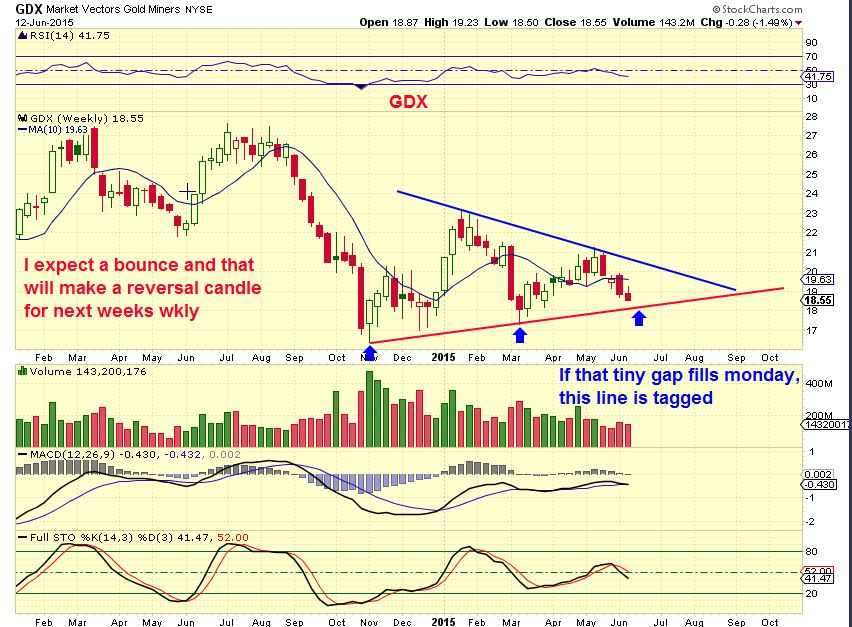
GDX- Again , keeps dropping and running stops. Frustrating & pretty oversold , this is a Bullish Descending Wedge in tech Analysis. This could be a BUY for at least a quick trade, but a tiny gap could also fill Monday. Its likely to just bounce and roll over as a 3rd daily cycle possible. I’ll be watching it as the week plays out ( 50sma) .
GDX – at least GDX WKLY isnt in a Triangle 🙂
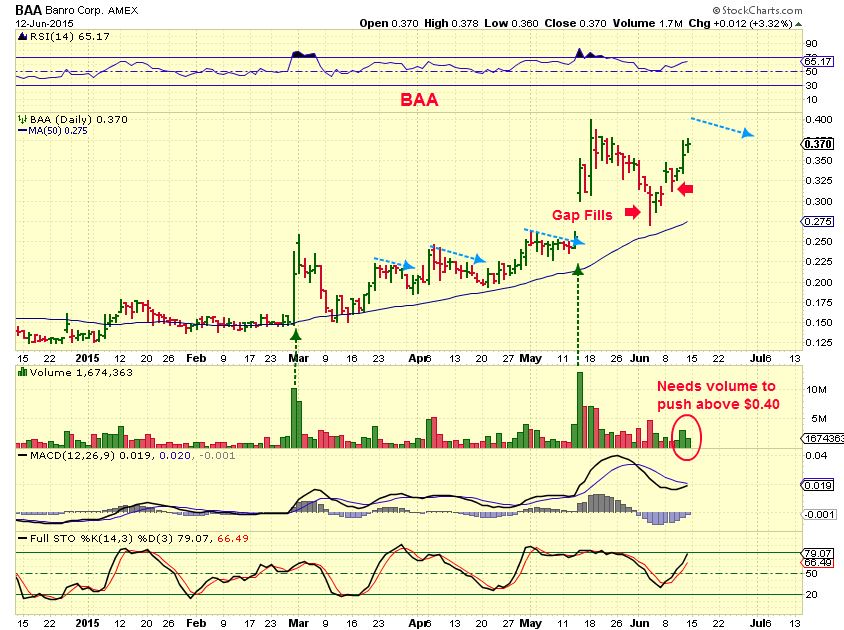
So thats what is on my radar as I study the Precious Metals . I will not be biased either way. I want to study and report what I see unfolding, and this is just another of my studies for the weekend report. I keep saying that certain MINERS are bullish ( LSG, TRQ, RIC, BAA, etc etc ). Some put lows in in June 2013 and havent looked back. I mentioned Buy the dips on BAA last week. Lets review that…
JUNE 8 – I mentioned the good report by BAA/ stronger & improving earnings potential, etc. Buy this gap fill / trend line tag near $0.31
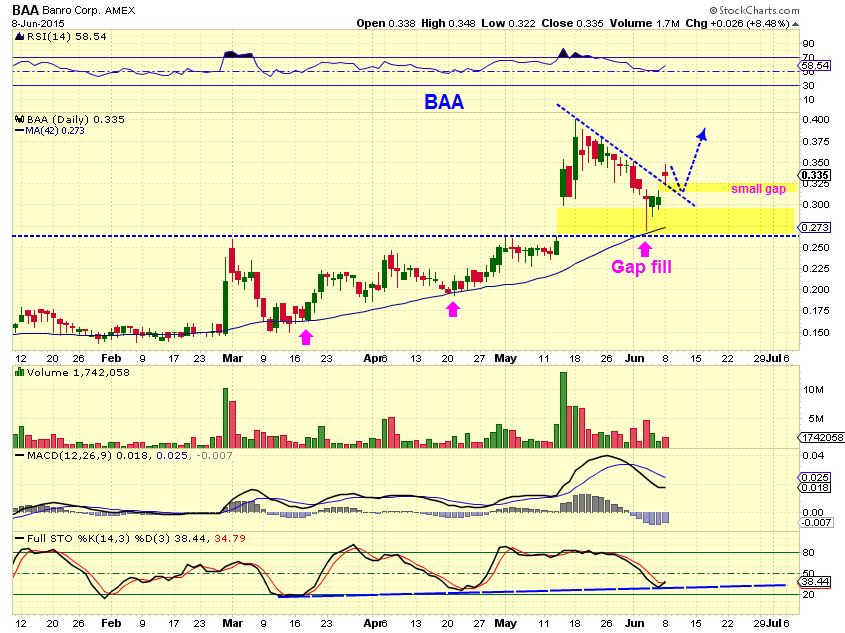
BAA – That small Gap filled, but it’s rising on lighter volume so far though. When that happens it often drifts in a slant downward . It may do that next.
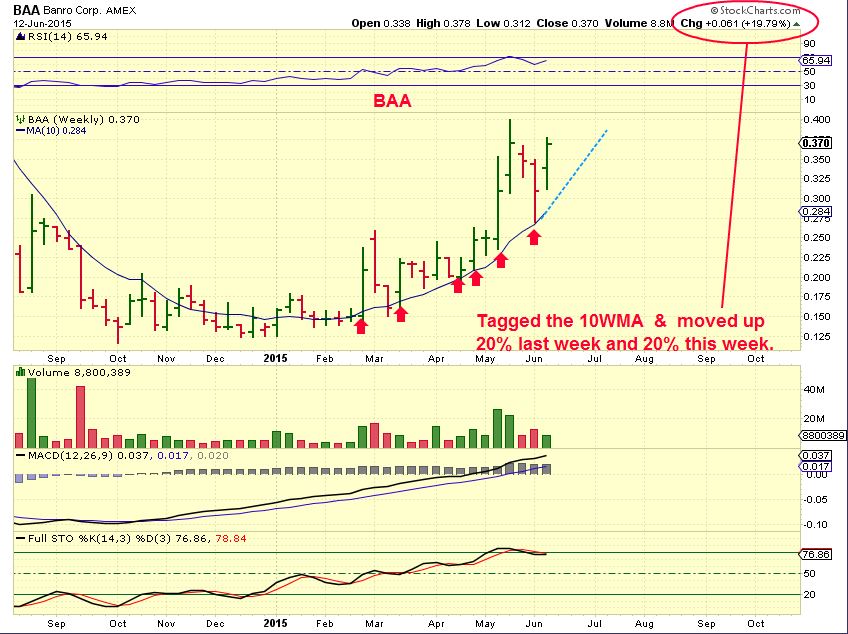
BAA WKLY- I posted here that I started accumulating BAA at $0.15 to $0.22 . I add on every tag of the 10WMA. If we drift there over the next few weeks, I will add again. THAT 10WMA has held very well since April on this run higher. It can be a stop now (Loose mental stop). BAA is up 20% this week and 20% last wk from that gap fill / tag of the 10WMA.
So that’s our weekend rap up and what to expect next week. OIL & NATGAS should resume their move higher. GOLD,SILVER, & MINERS are oversold and should at least bounce. I have said for the past 2 weeks that I am not trading , it wasnt clear. Now I think its clear that we are going to move higher soon. Patience for clarity usually pays off. Also The COT has improved a lot ( Smart money closing short positions) so I have to wonder if we again only get 3 daily cycles? That would fool many. It fooled me at first in MARCH with that early ICL. It was 2 months from what we had been used to. The DJIA, SPX, NASDAQ, etc remain the same for weeks, but inside these markets are some great trade ideas and break outs. It is a stock pickers market until things get clarity ( topping pattern? Consolidation?, etc ) . We’ll have to remain patient in some areas and learn more from the action. Thanks for reading along and again, there are some great opportunities in the near future where we should be able to really make some nice %-Gains in the Gold, Silver, Miners markets. LONGER TERM I expect a strong rally in that area .
~ALEX
NOTEWORTHY RESEARCH FOR OUR ENERGY MARKET
It was mentioned in the comments, “Maybe the energy stocks not rallying indicates that OIL is a false rally and will fail” . I accept anything reasonable as a possibility, so that could be what we see , time will tell. I personally dont like to just guess or wonder and leave it at that however, so I like to do research to be more confident in what I see and share here. SO I did some research.
– Lets look back at the REAL LOWS for CRUDE 2009.
We are looking for ‘past precedence’ – what happened then could be happening now. Did we see some OIL stocks recover well with OIL, and yet others took longer in that base process? If so- that COULD BE what you are seeing now. To the charts !
OIL 2009 WEEKLY – Initial run up in February above $50, then sideways like now ( red arrows) .
Note: 2nd leg up began first week of MAY
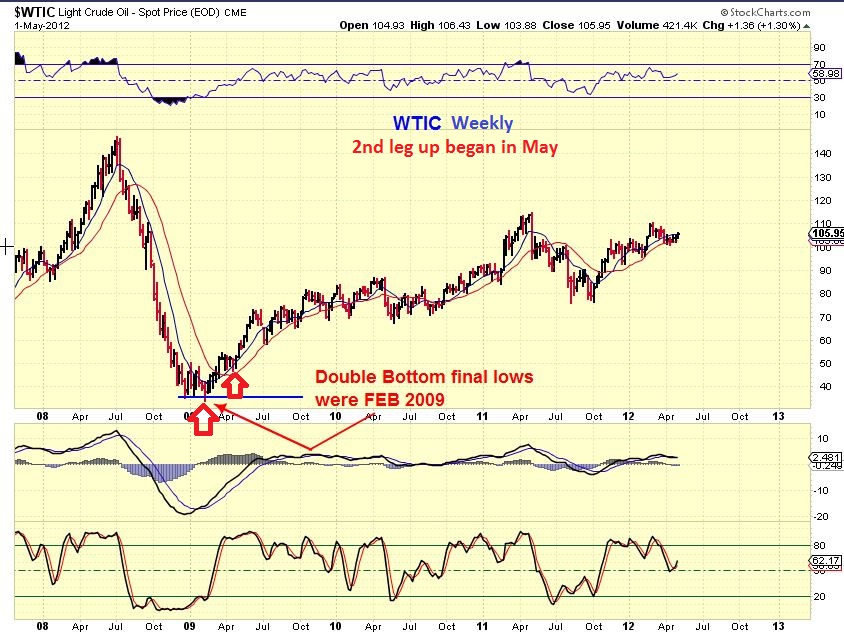
Lets look at oil stocks at that time.
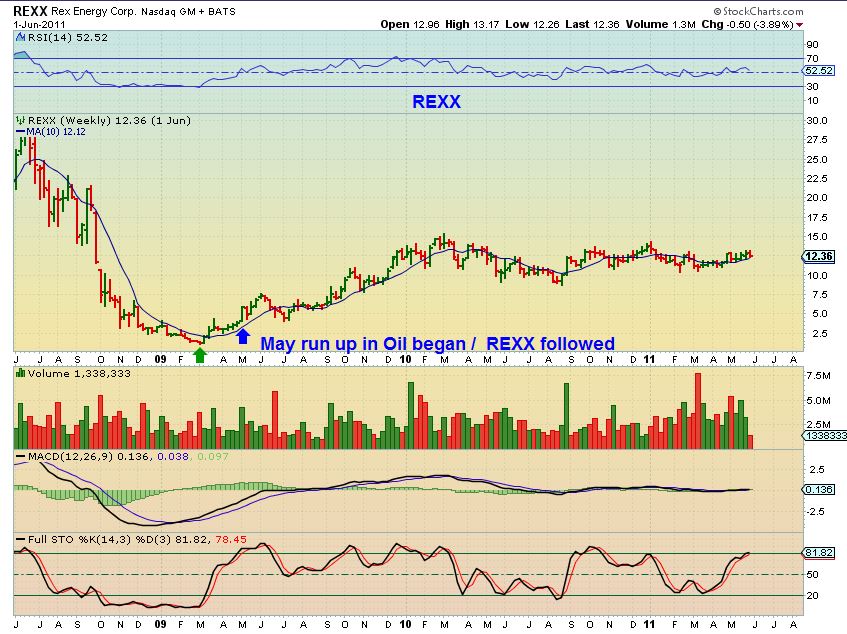
REXX– 2nd run higher began 1st week of May, dropped sharply 2nd week of may, then higher (followed Oil )
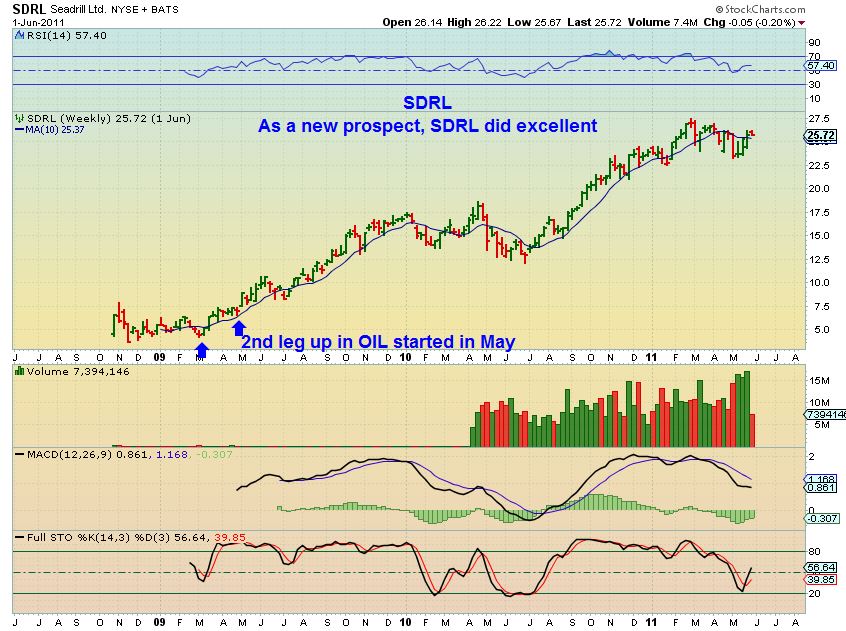
SDRL– VERY STRONG , newer company with good prospects, 2nd leg up begins in May.
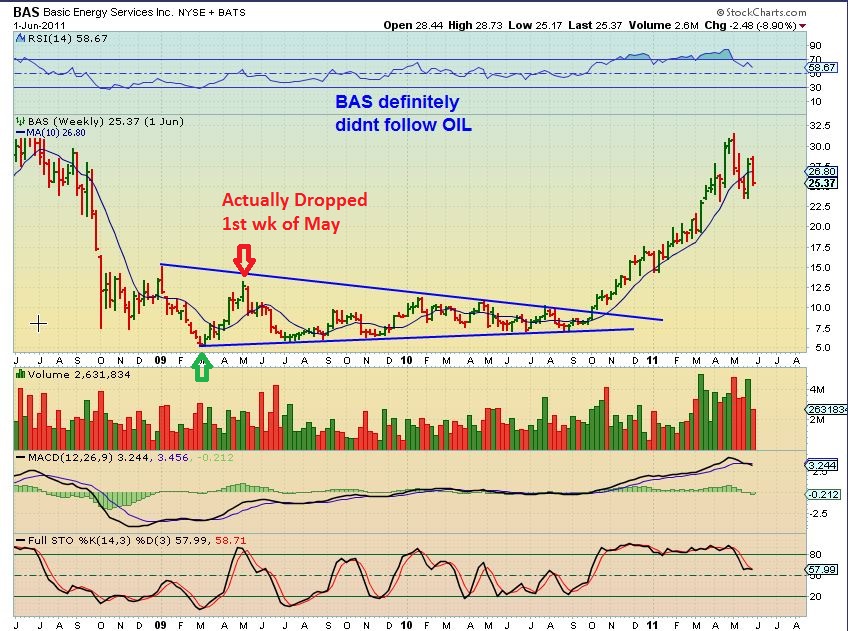
So I found a good number of Oil stocks followed Oil in the first week of MAY. Now check this out…
.
BAS– TOPPED the 1st week of May and dropped when Oil rallied. Eventually it ran from $7 to $32, but lagged & based longer.
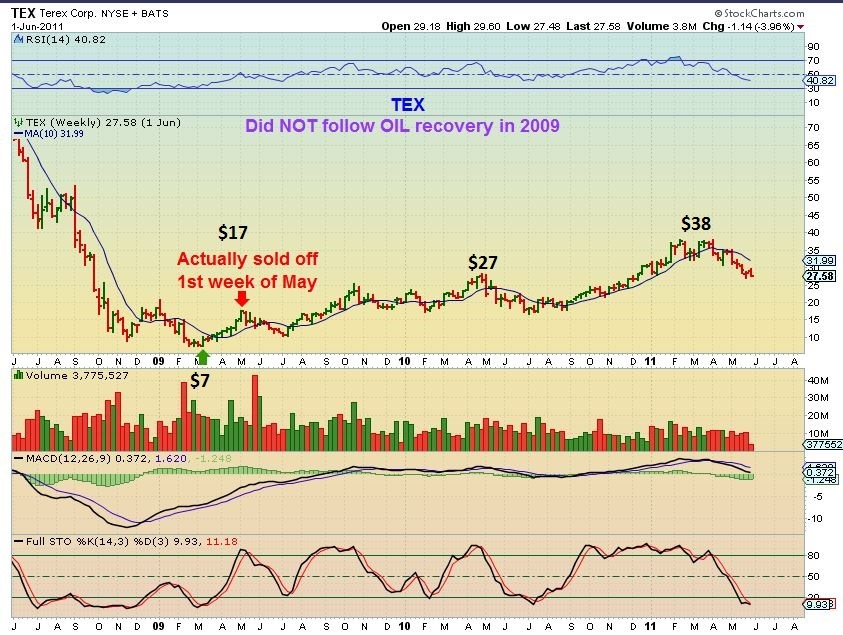
TEX- TOPPED the 1st week of May when Oil rallied. Just did its own thing from $7 to $38 over 2 yrs.
The conclusion that I can draw from this research?
Just because our favorite oil stocks may not be following OIL, it doesnt mean oils rally is a fake out. In 2009 we saw that some just began to base out differently, as individuals. They all did great over time, but maybe for trading , we need to select those that are holding up better. It does not necessarily mean that OILS rally is a fake out. Actually, the 2nd RALLY PHASE of oil hasn’t really shot up & taken off higher yet either. Again see oil below…wheres the big rally ? Currently OIL is holding strong in a sideways consolidation, and our energy stocks ( XLE) are dropping to a 61.8% retrace.
Today some OIL stocks are still holding up too. We could be seeing some shorter term “Trading in Bases” for some stocks that are basing near their lows , longer term trades in other stocks holding up better.
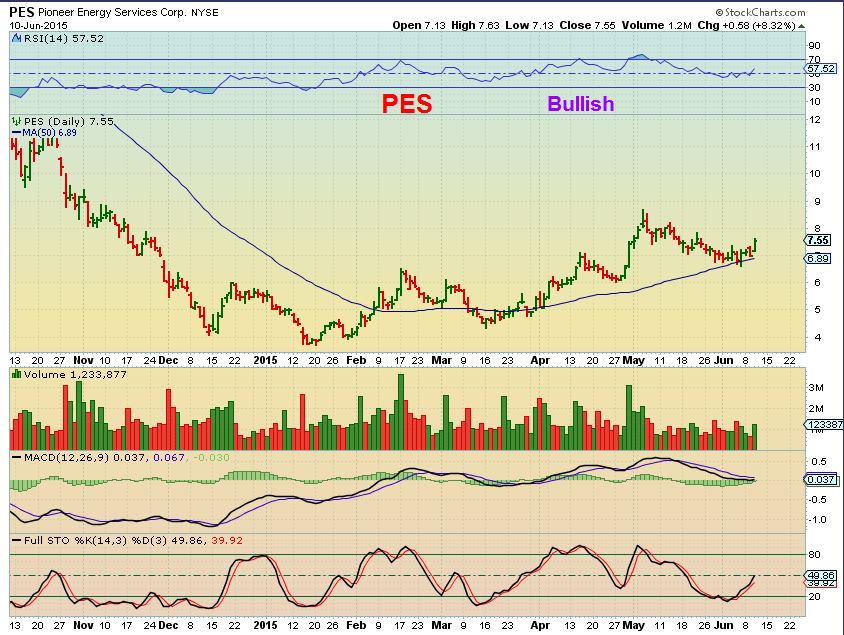
Remember PES –
SDRL was the new frontrunner in 2009, as posted above. Now we have
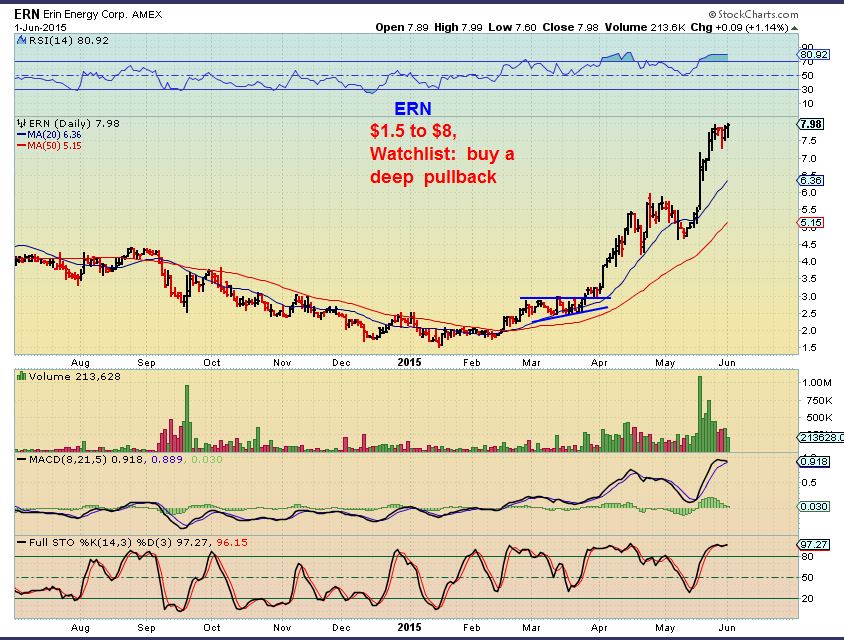
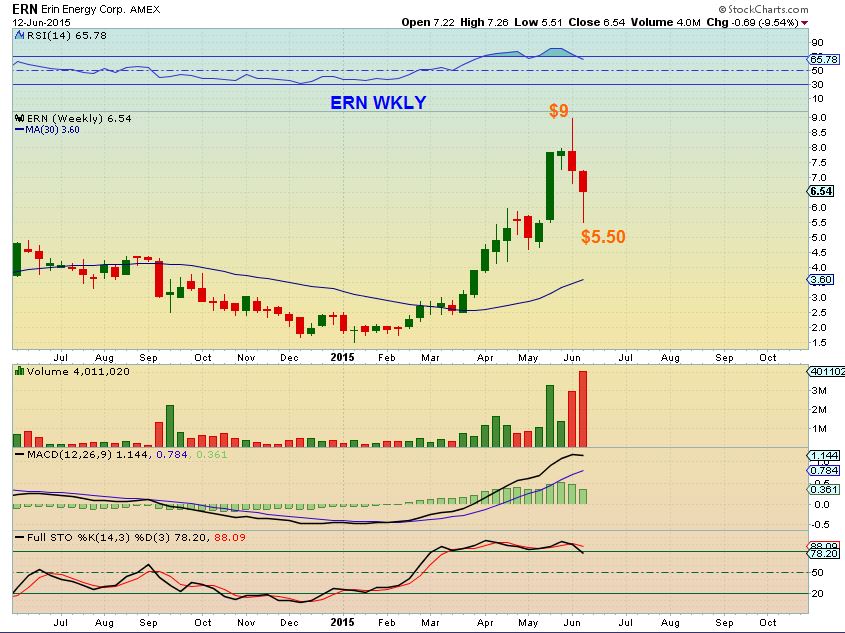
ERN- Boom $1.50 to $9 before pulling back this week to $5.50 & recovering to $6.50
ERN WKLY- strong run $1.50 to $9 .
P.S. – This report took well over 8 full hrs just to draw charts and research, and I want to release it early. I cannot proof read for typos/ errors due to time. so please enjoy & ignore any typos – thanks in advance !


superb job as always!! Thx Alex.
Thank You Deshy, ..appreciate it.
Interesting triangle analysis. That has been my expectation for the dollar. Since it didn’t correct deeply enough at the recent ICL to launch another leg higher I’m thinking the most likely pattern would be an extended triangle to allow the 200 day moving average to catch up to price.
Of course it’s anyones guess as to which way the triangle would break, but I tend to think that the kind of impulsive rally we got over the last year isn’t finished yet and would be more likely to break higher once the consolidation is done. For that analysis to hold water though the dollar needs to stay above 93.
I agree with that idea that the ICL topping on day 8 was odd. I had mentioned that in the comments a week ago and I somewhat expected it to just rally strongly last week & make a quick day 18 or so higher high and then drop to a DCL, but it never did.
I’m not sure about the timing of a dollar triangle, it seems like it would drag things out in Golds ICL , but they actually have not correlated lately anyways, so it could be possible.
I would like to see the dollar break higher and double top or slightly make a new high with divergence as Gold put in an ICL, but it is difficult to see the timing of how all of this would play out, at this point . Should be interesting!
FIBs and volumes suggest Euro further to go (inverse – ish to US$)
I could not agree with you more Gary.
I am Long USD via Calls, hence the reason I am Not trading many commodities stocks other than Nat. Gas via Calls also.
If Oil breaks the wave 4 triangle up I will then reconsider entering oil stocks.
Now, that is really thinking outside the box on both gold and oil and thoroughly defended with a heck of a lot of research. Explains so much of what may going on. Impressive Alex.
Thank You Mark.
It’s definitely a little outside the box, and maybe getting ahead of my self 🙂 but at times I have more questions than answers and I just have to dig deep until I’m satisfied. At least to visualize some “possibilities”
dannnng gina… shoot .. sit down…. wooooh…my eyes started to glaze over there for a minute and my legs got wobbly ;o)
…bravo Mr. Chartfreak…. can’t wait to study that later…say..do we get awarded an honorary degree after our year is up?
lol…i spend more time studying here than I did for my BS and MS put together!!
as always, thanx for the variation, versatility and of course your vigilance ;o)
Lol Maria,
Yes, you get an honorary degree in patience and putting up with the lengthy ‘Freak-end’ reports : )
Thanks for the kind words in the form of 3 ‘V’s
Alex, you provide way more than what I paid for. My cup runneth over.
Thats great Shermo- Thank you
I’m glad you feel that way. I’m really trying to be prepared for whatever is happening now ( OIL) and whatever comes our way in the future for precious metals ( And the markets do not allow that…we all know they’ll pull the rug somehow). I think there is going to be some great trading in Precious Metals at the next ICL.
Solid, emotion free unbiased research and charts. You really see the big picture when the emotions of the rest of us cloud our vision and judgment. Bravo. I have no idea what metals might do but feel good about oil and gas here. Greece stuff and Fed mtg with press conference this week should really help to muddy the waters for us! Shake ups and outs definitely a possibility!
Thx Cason, and yes- I’m sure this weeks events will shake things up a bit. Fed always seems to get a reaction. Hang on tight ! 🙂
Nat gas only item holding up this morning (besides USD); interesting gold can’t more of a bid from the Greece issues, especially considering the havoc it is wreaking on equities and,bond markets recently, though I certainly wouldn’t trade based on geopol rumors!
Alex, I bought NATGAS on Friday at the 10 and 50 SMAs, do you expect this upmove to continue for a few days? I want to hold at least until Thursday and perhaps sell before the inventory report comes out…what would you do? Thanks
From charts I reviewed this weekend I saw resistance at 3.0-3.02. If it gets there before inventory, I’ll likely peel most of not all off. Much warmer weather this last period, though, I would expect pretty solid numbers this Thursday.
So sorry for the late reply, been out all day.
I do expect it to keep running, and I expect higher than $3 (much) but only if the run unfolds as strongly as I see it in A second leg higher. If it doesnt by Thursdays report, I would cut some (or all) of your position until clarity.
Really appreciate the time and effort you put in for your subscribers CF.
THX JD
Many thanks Alex for the awesome smorgasbord of info you provide for us. You give us the opportunity to concentrate on many different sectors, or just one or two. You got our backs and it gives me confidence in my trading decisions. : )
Well said…my sentiments exactly
I can’t say in a better way Wishful….???
THANKS ALEX…. you spend indeed a lot of time to teach us well.
Thank You Wishful, Geurt & Maria
Alex, thanks for the hard work. Do you have any low risk entries your looking at? I like UGAZ, but not a low risk entry.
Thx Bill…I will have some in the report tomorrow. I was out all day.
Just thought I’d throw this out there. SFY looks like a great risk/reward setup. Buy 2.20, sell a close around 2.12…5% downside risk
GDP also
Really? I have it taking quite a hit today. But then after being stopped out last week happy to be on the sidelines.
Here is what I am seeing in GDP. You can set your stop at the low for the day, very little down side risk. If it bounces from here, which I expect (because the rest of the players seem to be reversing), then you’re in the money. No guarantees, just low risk entry.
Love SFY. Great chart
This chart looks good here, but SFY has not been kind to me. This looks like a better entry than I made in the past.
Agree…got stopped out about a month ago but this looks pretty well defined.
HLUYY anyone? Rounding base. Pharma company just stole the president from NVO (note the big spike).
Bravo Alex! Brilliant analysis. Look at how much wealth you are creating with all of us!
Thx- I really am getting excited about the possibilities in GOLD/SILVER/MINERS soon. That should be good, even if you dont catch the lows, there should be a strong move higher & Good %-Gains 🙂
NADL at these prices?
REN giving us a new opportunity to buy on SALE!
Hopefully that was a reversal that sticks today, re-gained the 10sma 🙂
And NBG has probably had a failed break out, which means downward move could be violent, if breaks lower than where we are
It’s all news for Greece. When you have huge political overhangs like this technicals just do not matter at all. Might be better off just playing with a hand grenade.
True that stock is all Greece related. Good Greek news it’ll rise bad news it’ll fall regardless of the technicals.
Believe it or not, that looks Bullish to me.
I believe it. Could you say what you see is bullish. NB I’m not selling yet, rightly or wrongly
Bought SD this morning. near lows, low risk entry. SFY and GDP same setup. Others bouncing off lower trend lines. Things turning around? In miners, AUY and EGO look low risk.
Miners turning red ?
Very Good Call on MOBL Alex. Nice base.
How about that gas entry recommendation on Friday?!! Just need oil to turn around tomorrow and we’ll be banking. Markets continue to be schizophrenic, staying out of broad ETFs still.
Sold out of IMH, a mortgage play, after today’s 12% pop. If I see another entry around 18.xx will try to post.