It certainly looks obvious that various sectors are starting what could be a significant decline. I pointed out the VIX and the elephant in the room last week, indicating that one should be coming, it was just a matter of time. Lets look at the charts …
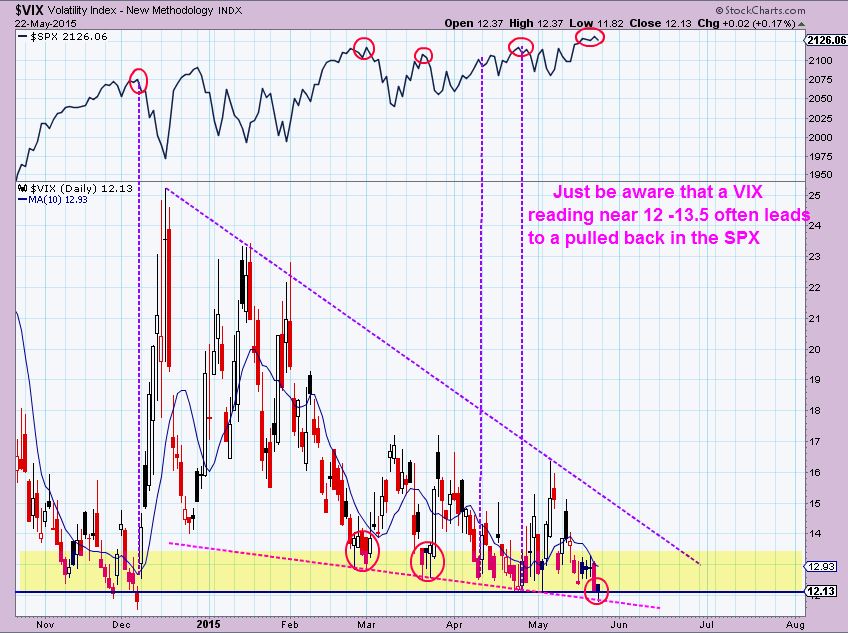
In this chart of the VIX I was pointing out that tops (maybe just temporary ones) often started with the Vix in the 12-14 area. It also did a reversal Friday
So this is what has transpired…
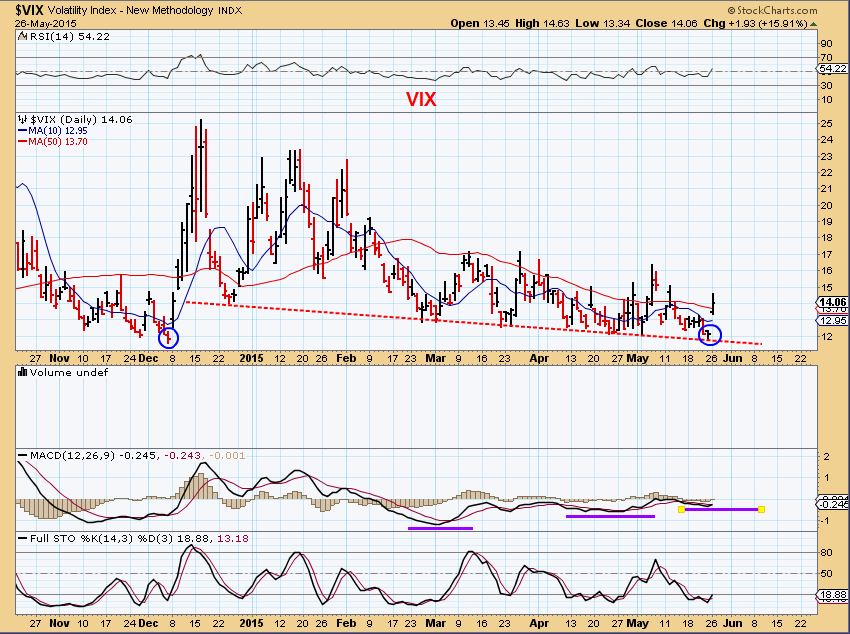
The VIX jumped
And the markets dropped
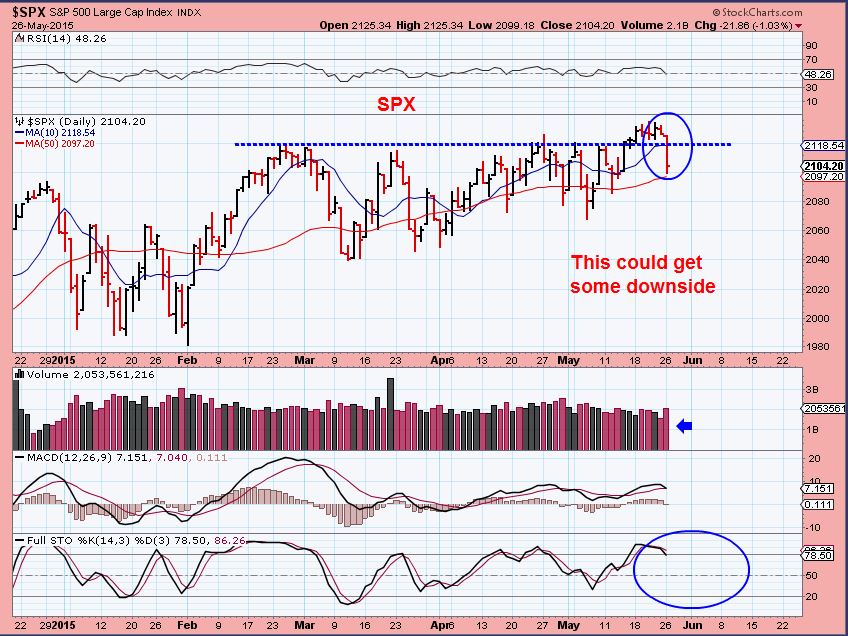
Please Scroll back up to the VIX chart and then that SPX chart. In the past, every time we get a sell off in the markets and a pop in the vix, the BUY THE DIP crowd comes in and saves the day. It has been very difficult for those going short to make money, and those going long have struggled too. Will that BUY THE DIP reaction happen again now? I do not think so . Why? Summer doldrums say sell in May and go away. We also saw The Dow Theory with transports selling off first ( That Elephant in the room that was calling for a drop), and now Volume increased the day after Memorial day/ Holiday. Thats rare. Lets review –
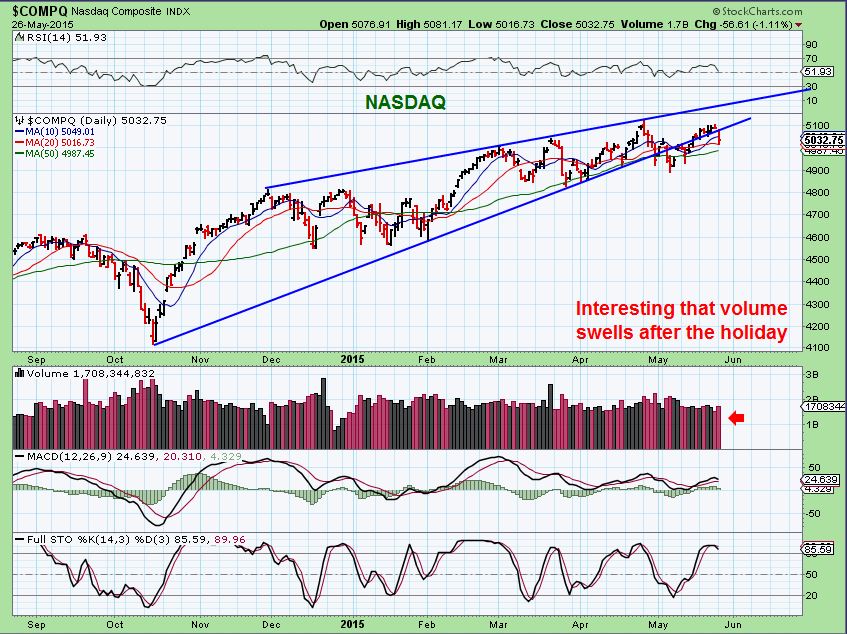
The NASDAQ is breaking down
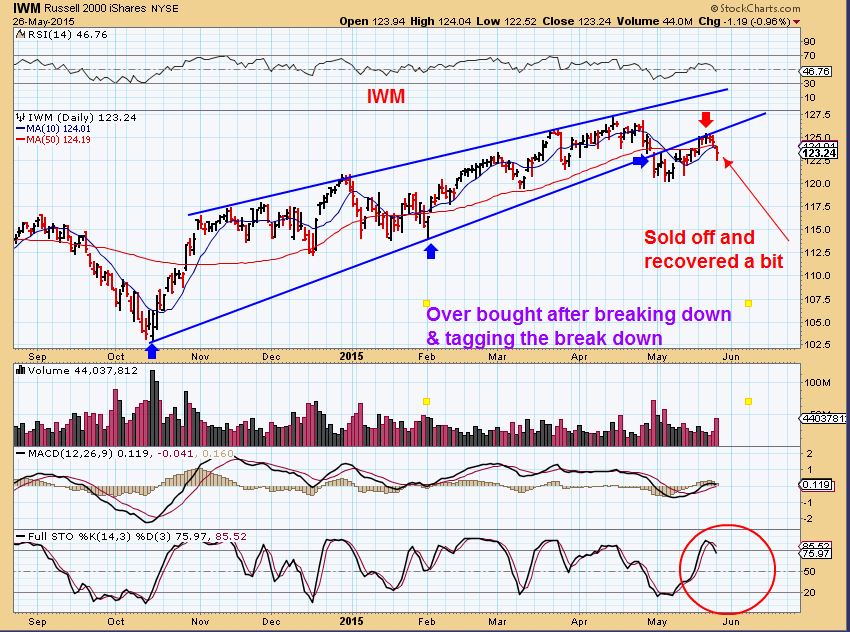
IWM – is that a perfect break down and back test?
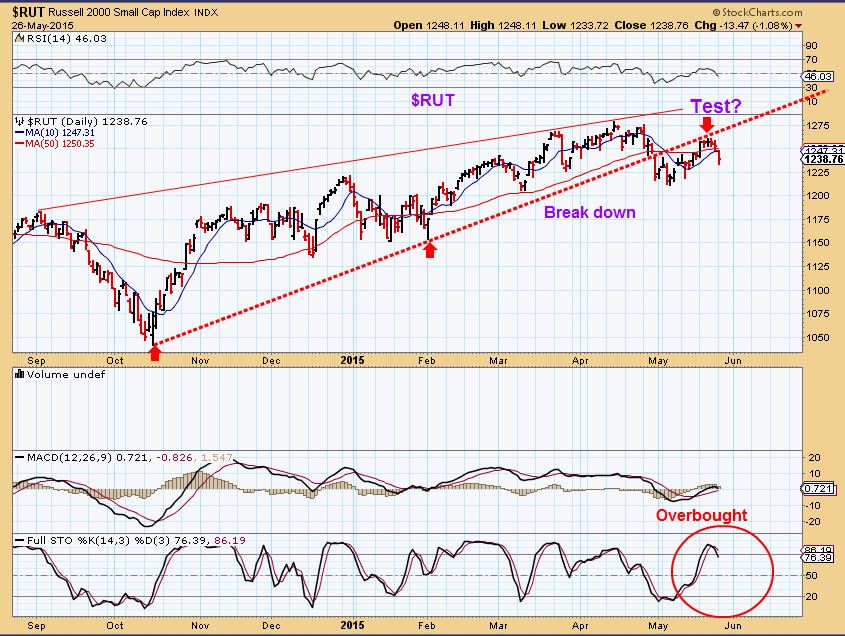
RUT – Same thing? Plenty of room for selling in the stochastics
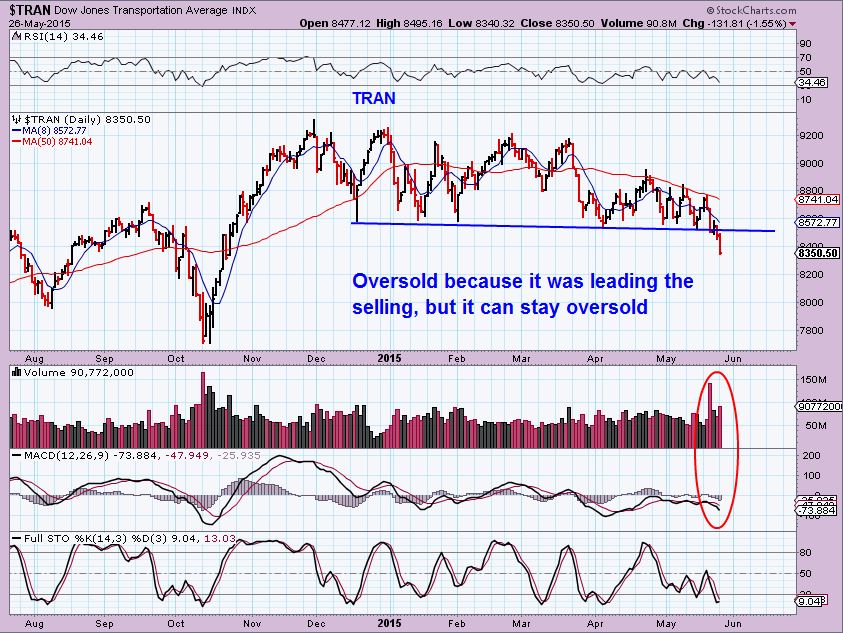
$TRAN – leader of the pack broke down
These markets have been really devious, breaking down and getting people to go short, only to recover when the buy the dips team steps in, but this looks a little more convincing. Shorting can be more difficult for some, because many like to wait for a trend to start (A stair step move down) and then they short the bounces, but at times there are straight down moves that do not offer entry. Scroll back to the IWM, RUT or SPX chart. See the sell off in OCTOBER. VERY hard to short a bounce.
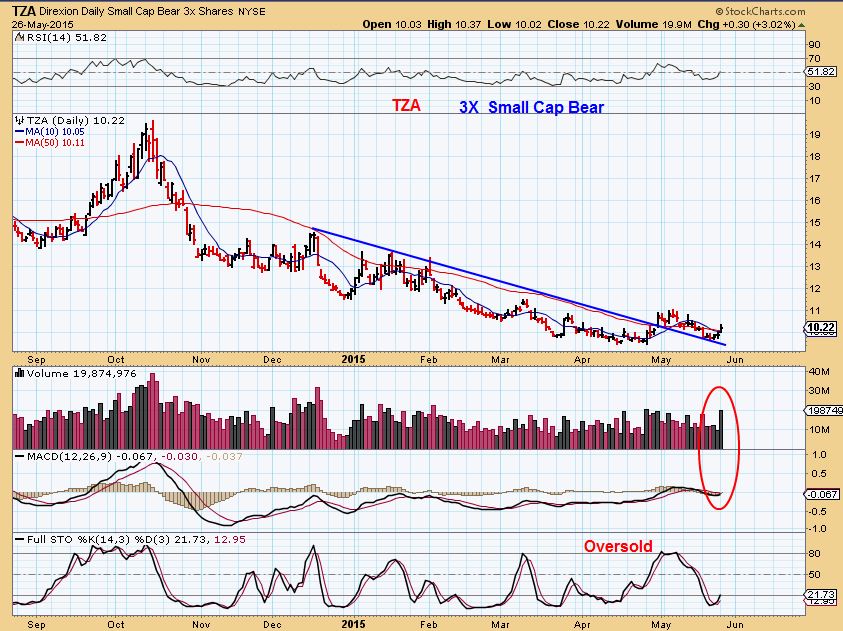
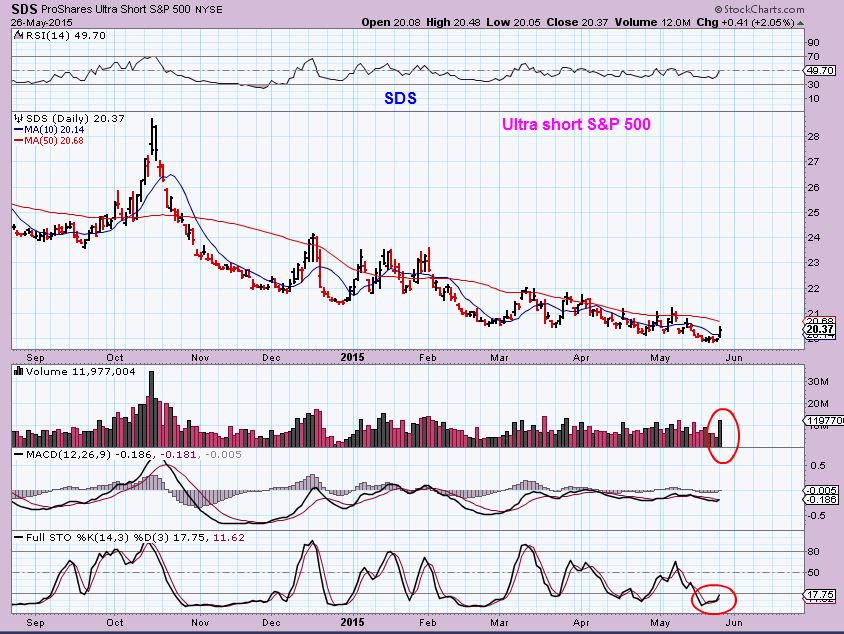
Some just take a chance at this point with a stop in place and buy the leveraged ETF such as TZA, SOXS, SDS, DXD and so on. They Popped with volume and are oversold. I wanted to buy TZA , but I didnt. I’m watching to see whats next, either follow through or the Buy The Dips team to step in.
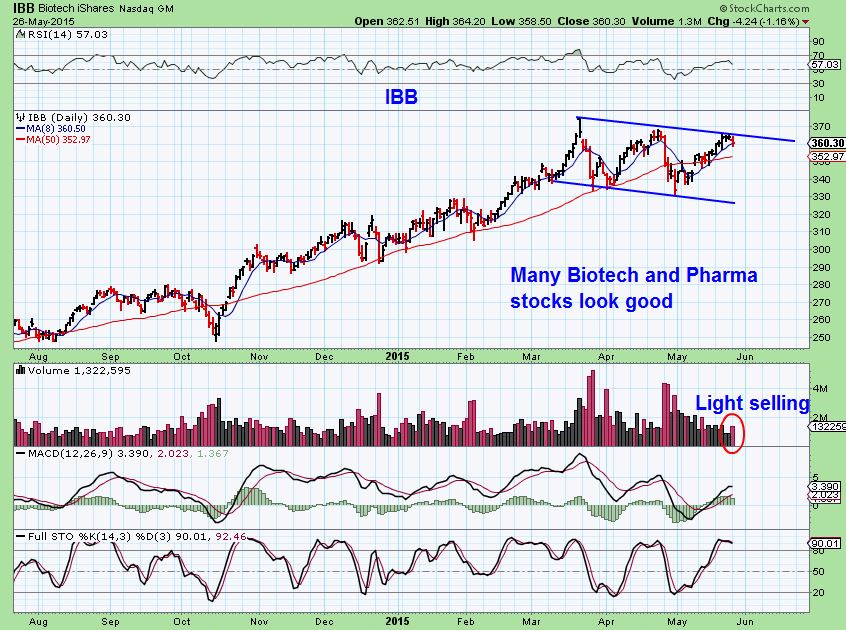
Though I feel that the selling will be the winner, I see a lot of Biotech stocks setting up nicely. The IBB consolidated here and had light selling so far.
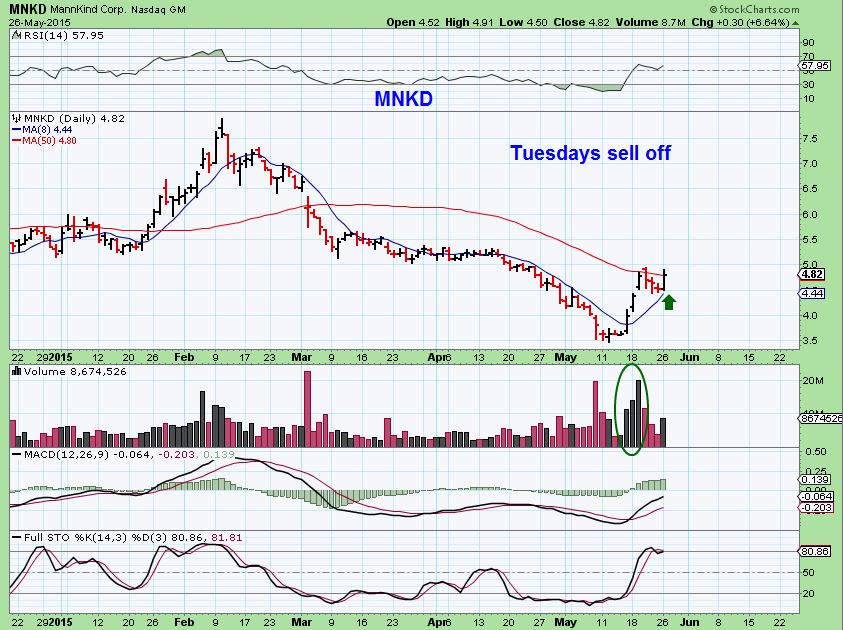
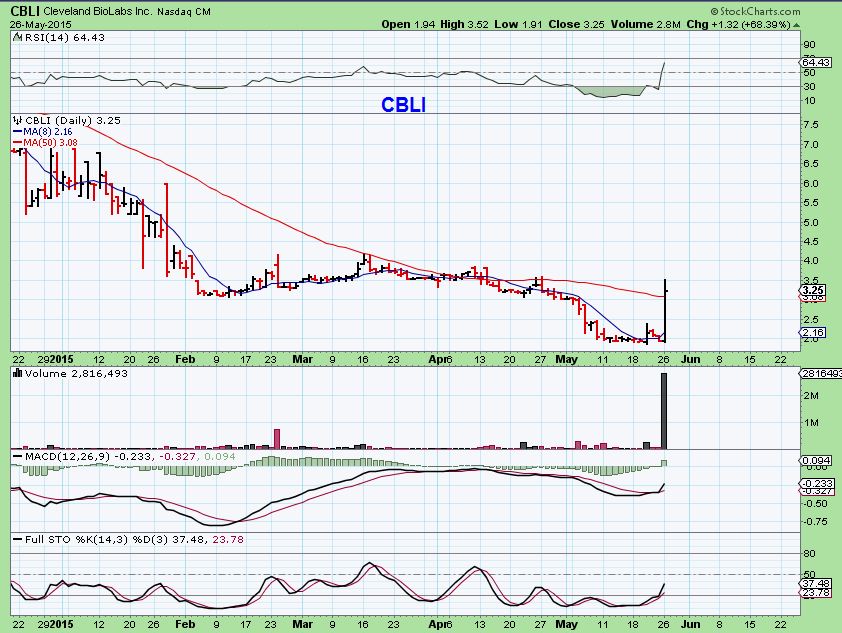
MNKD looks bullish. (See also chart set ups in CBLI , GALE , BPTH, ANTH, ONTY, BLRX, etc I’m not saying they are all “buys” , but they are bullish for such a RED DAY)
CBLI
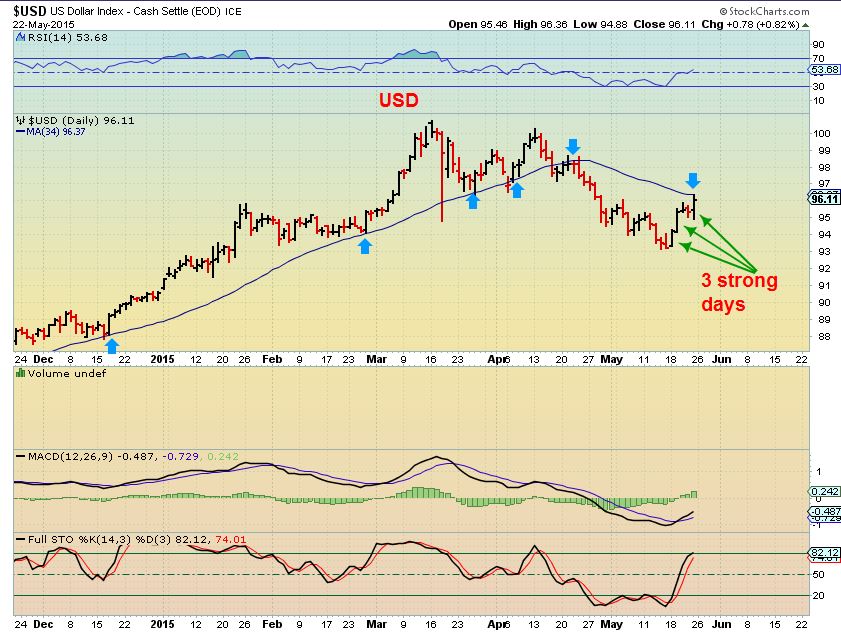
The USD – had 3 strong up days , but met resistance last week. Could it break through?
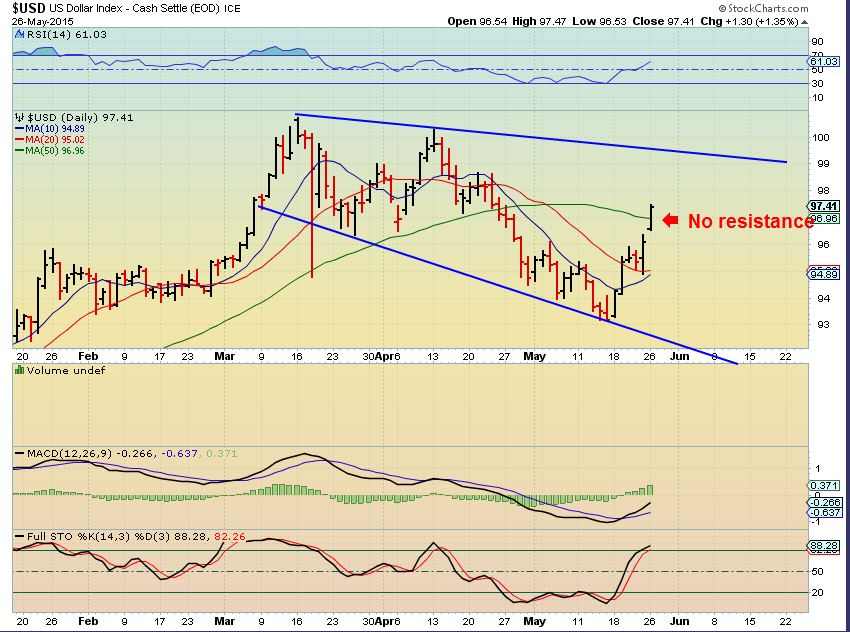
Yes, this has strength and so is likely an ICL as mentioned in the weekend report. The question is, what kind of Cycle will this turn out to be? That will be important to watch as it unfolds.
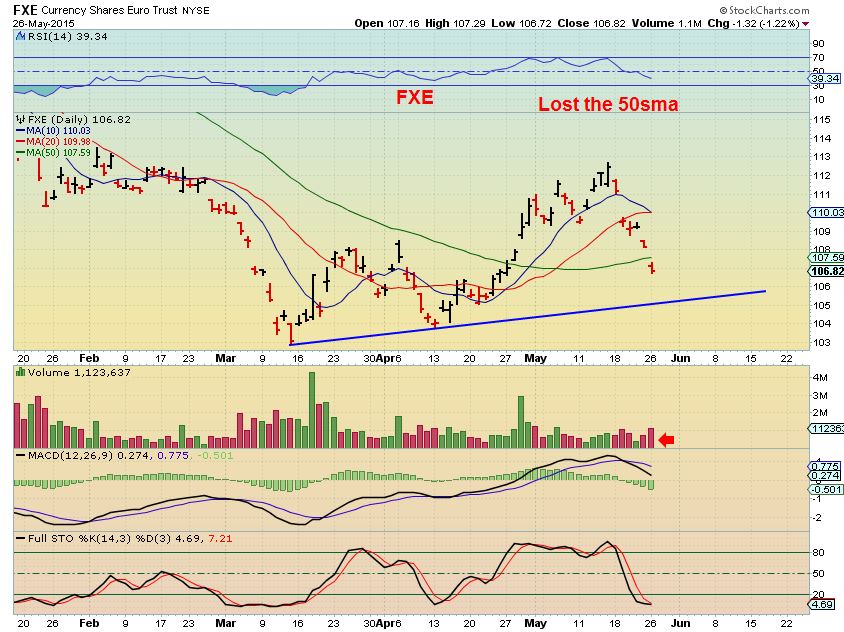
And the FXE did break possible support at the 50sma
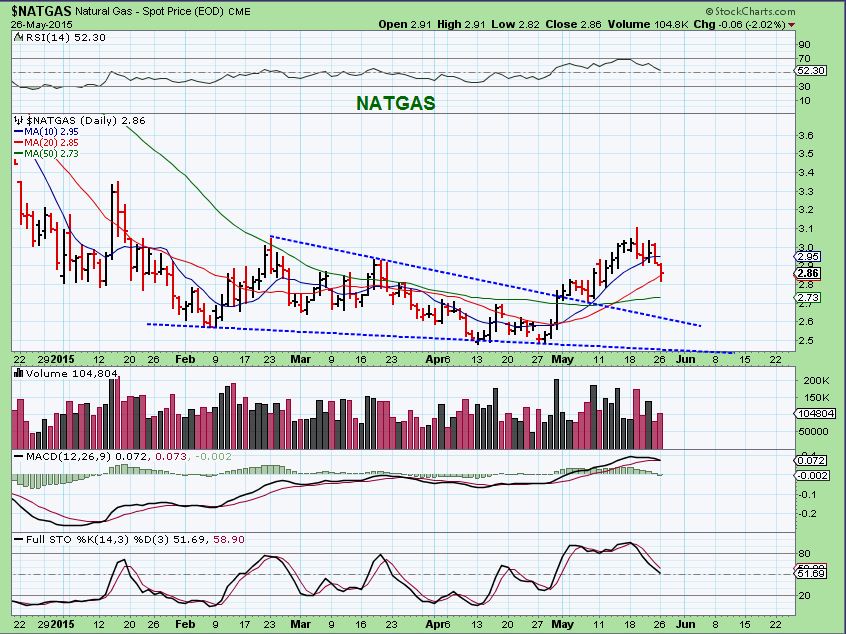
The NATGAS sold down, that was expected . It actually re-gained the 20sma at the close and put in a small reversal candle. It has been strong, I still like NATGAS longer term.
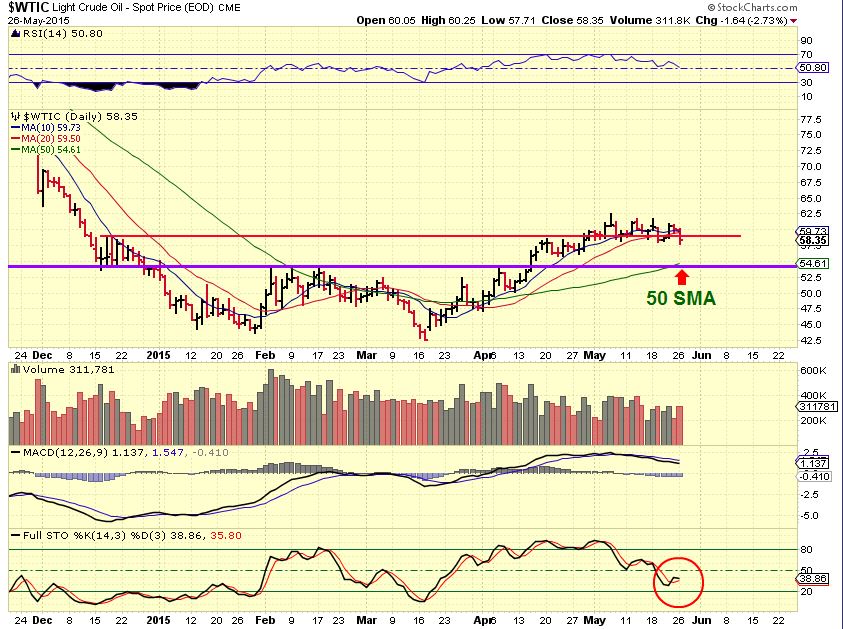
$WTIC – also dipped a little, but OIL has been very strong. Still eying a possible test of support at the 50sma and prior break out in the $54 area. While I liked the look of many energy stocks, holding up with the Dollar rocketing. see REXX, BAS still above the 50sma, NADL went green, etc etc the XLE broke the 50sma and volume was increasing, so keep an eye on that.
GOLD/SILVER/MINERS
There was damage here, but it was quite odd. With the Dollar surging higher, and the SILVER COT projecting heavy shorts by Smart Money, Silver did NOT look as bad as it normally would. Usually Gold drops 1-2 % , Miners get CRUSHED , and Silver is down 5%. Lets take a look-
GOLD- I didnt short GOLD even though this looks ready to slam down. Why not short it? It did have high volume selling and its only day 16. The last cycle went 32 days , that could be plenty of downside. I will explain with the Silver chart.
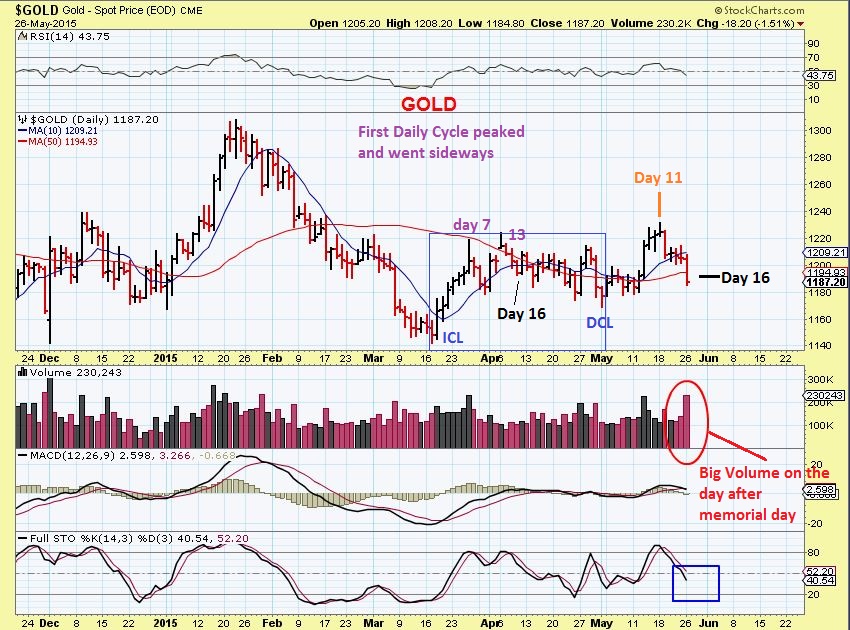
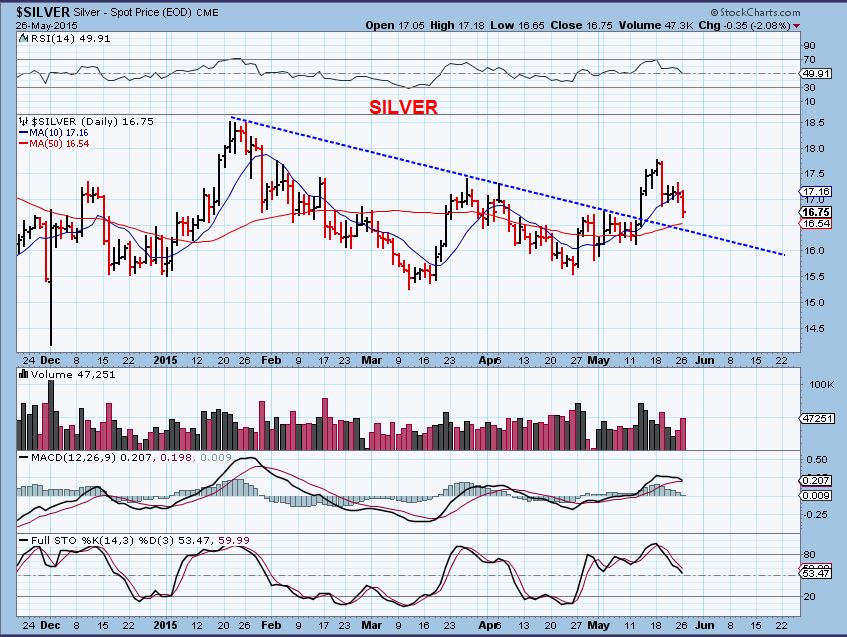
SILVER- this was (So far) a normal correction. Silver usually Slams down when Gold drops, so it made me wonder if GOLD could just do what it did in the first daily cycle. See in that Gold chart that it did drop hard and then went sideways in the first dily cycle. It then went sideways. Look back at the chart of Gold above in April after day 16. Easy money short? No. I do not need to be trading Metals /Miners all the time, and if a set up looks great and questionable at the same time… I need to wait. Silver will tell me more , probably even today.
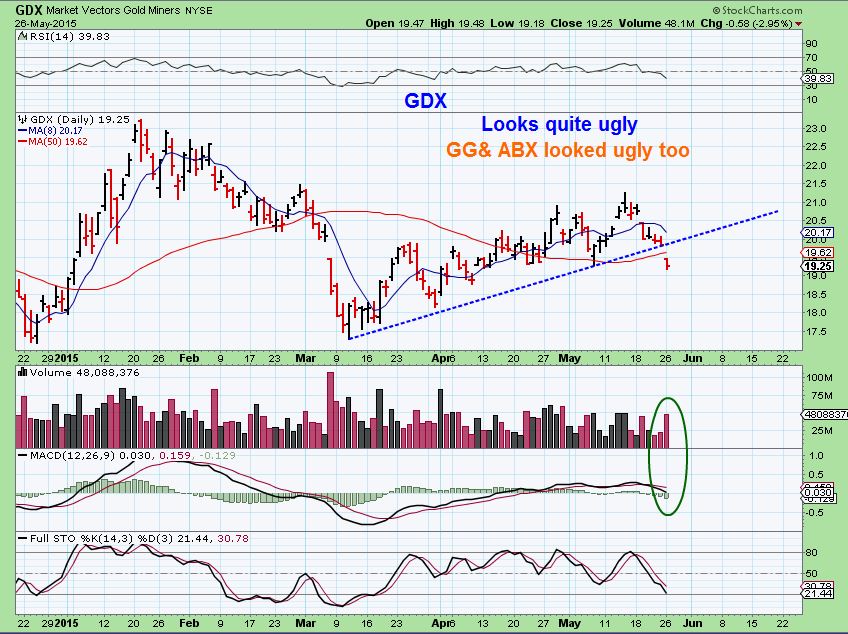
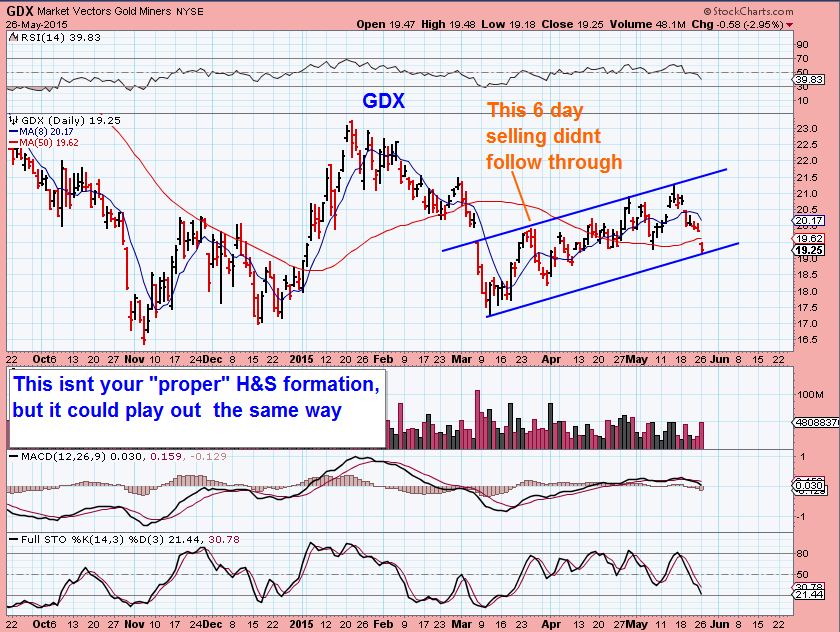
GDX- I think this looks ugly and GG & ABX are breaking down too. This could be a great short using DUST / JDST, but my gut has me holding off personally. If Gold is in its 2nd daily cycle and continues falling (Not going sideways) , then the 3rd daily cycle will be a much clearer short.
GDX view #2
Since the Miners and Silver held up well in April & May, I can view the miners in a second way. Until this is negated, I dont want to short GDX. I want to see the 2nd daily cycle end, bounce with the start of the 3rd, and possibly short that.
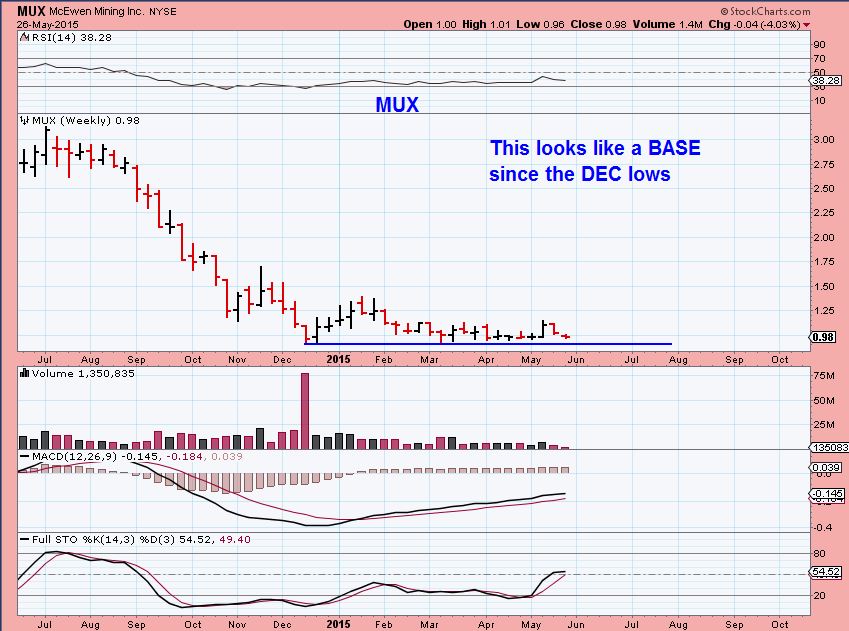
I’m looking at individual Miners and some of the Juniors do not agree with the selling. Look again at EGI, TRQ, BAA, GSS weekly charts. I still own BAA , GSS, from lower accumulation points. I see many that look like they are bases, so I will watch to see if they hold or break down .
MUX for example. Will this break down?
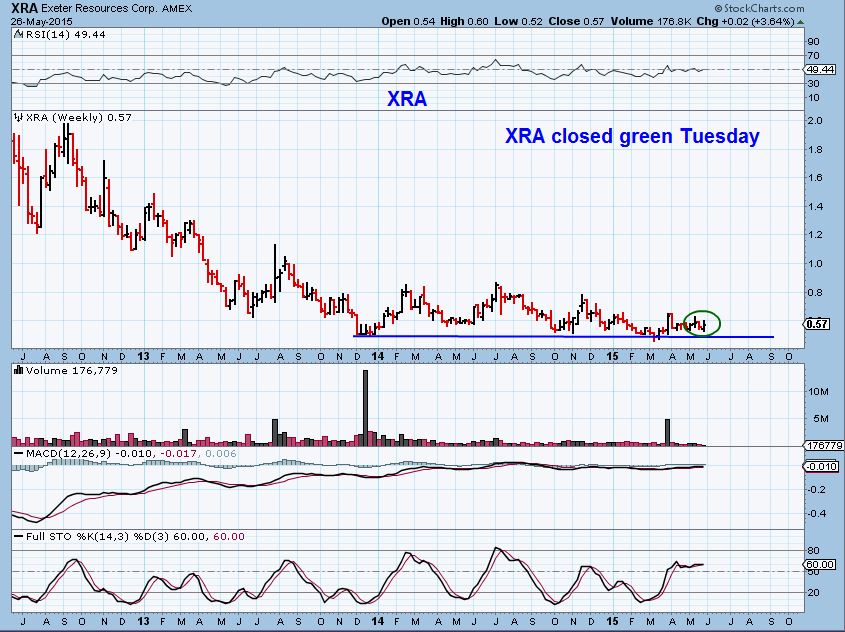
XRA was green with the dollar surge. This looks like a bullish set up of a base so far , and even looks like it had a shake out in March.
SO here is what I am thinking. I feel that the DOLLAR has started a new ICL . Moves out of an ICL are strong, but the dollar can still struggle near highs, go sideways , and top out with divergence at those highs. Then a 2nd daily cycle and then a 3rd unfold. Will they reach new peaks , or will the dollar top out? I wonder because I see many areas in commodities that have looked like they are bottoming for months. OIL, NATGAS, METALS, The CRB, etc. I am looking for possible trend changes. SPX, DJIA, IWM, RUT, etc ran strong with the strong dollar, now they look to be floundering . I want to keep an eye focused on this big picture. If it materializes, you are going to see huge opportunities to make great money materialize in the Metals/ miners.
For now we trade the wiggles if we are traders in front of the screen.
~ALEX
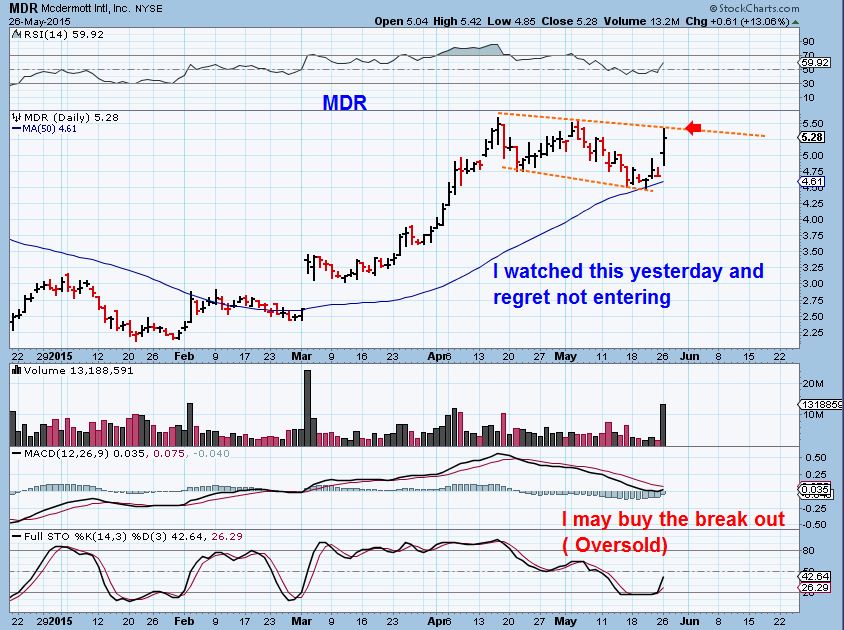
MDR
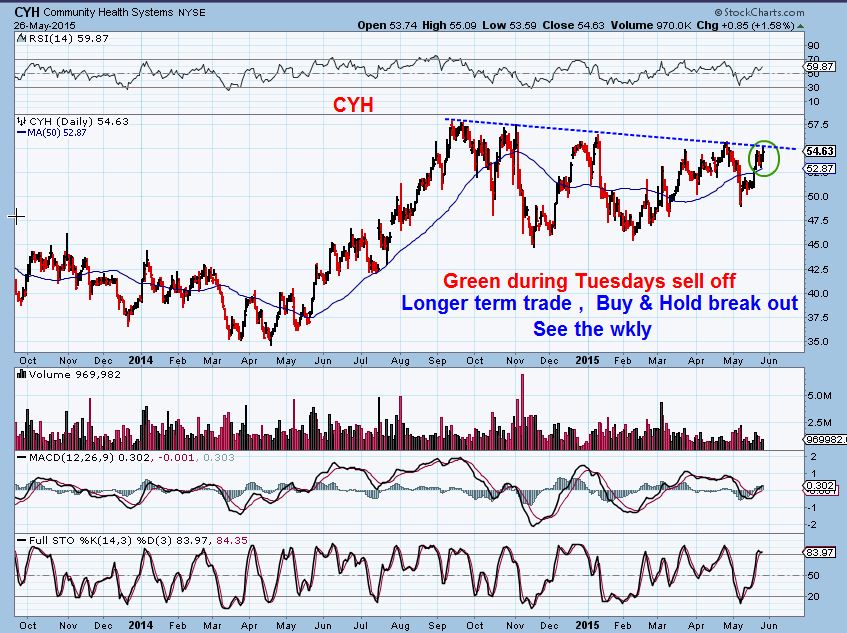
CYH – 9 month consolidation
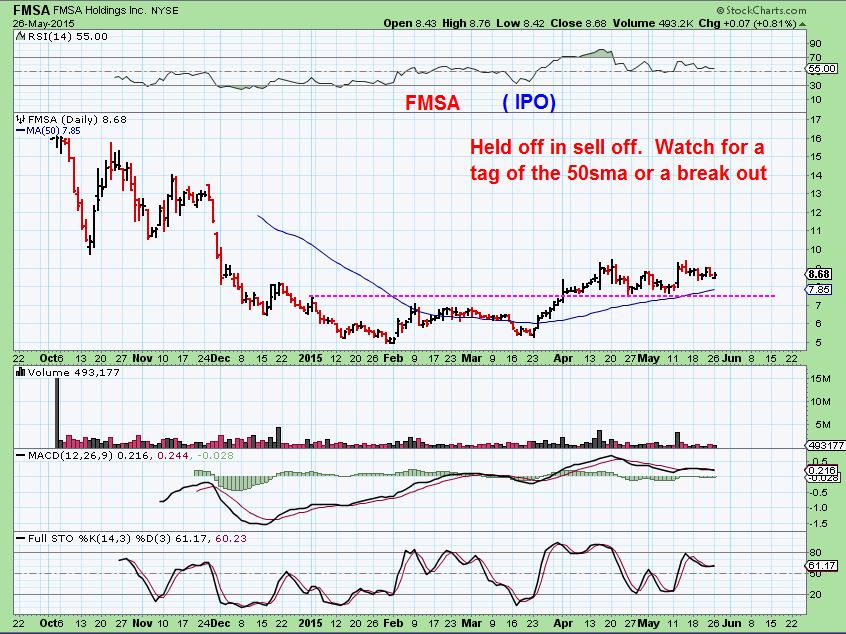
FMSA
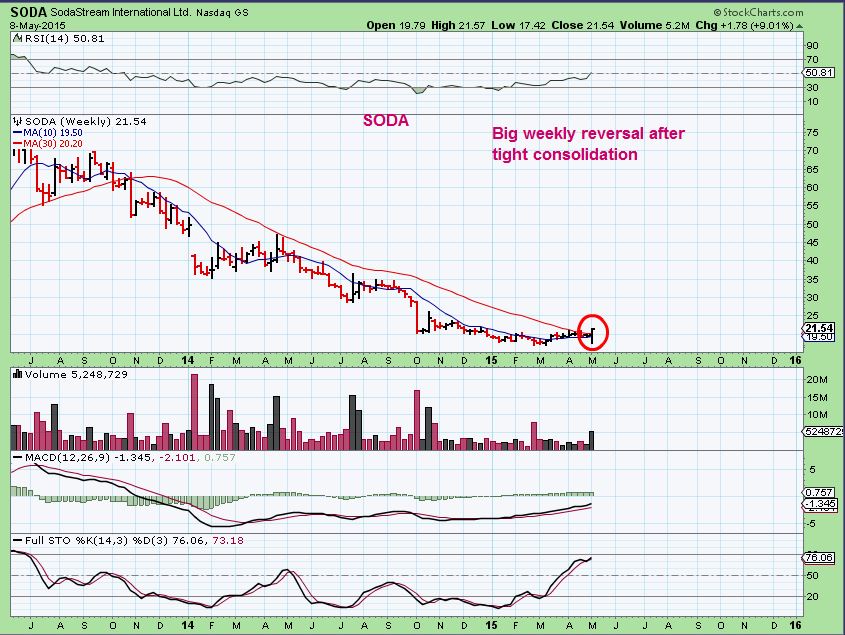
SODA- I pointed this out May 8 with 2 charts. This was may 8 , and it Still good
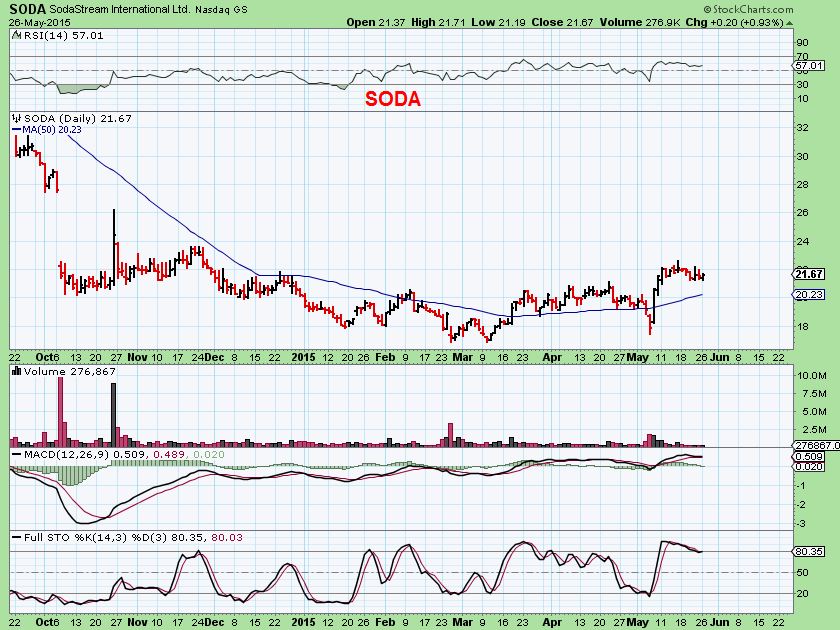
SODA now
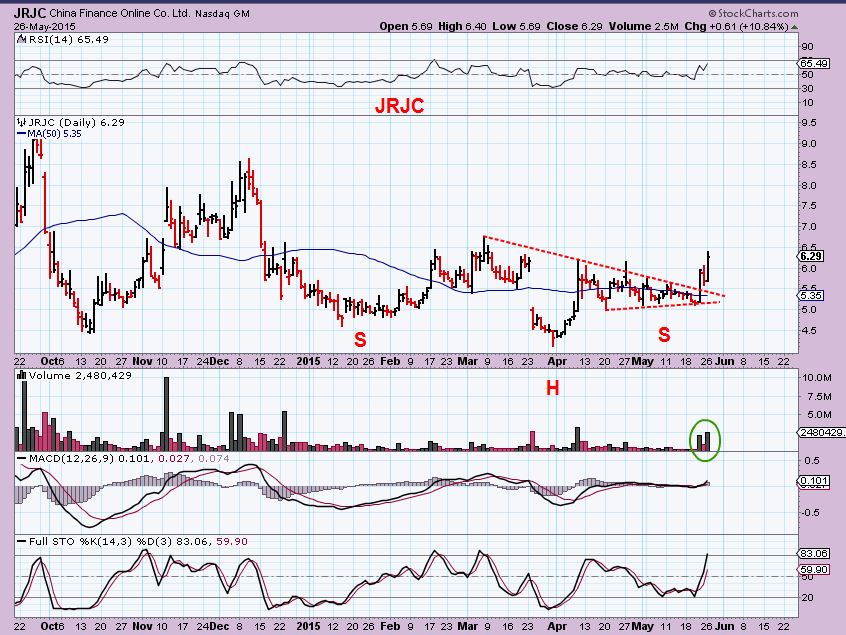
JRJC– in Tuesdays sell off. I have traded this. It runs well, but has been jittery lately. Nice volume higher on a sell off day in the markets. In October it almost doubled on that run . It looks to be breaking from its base now
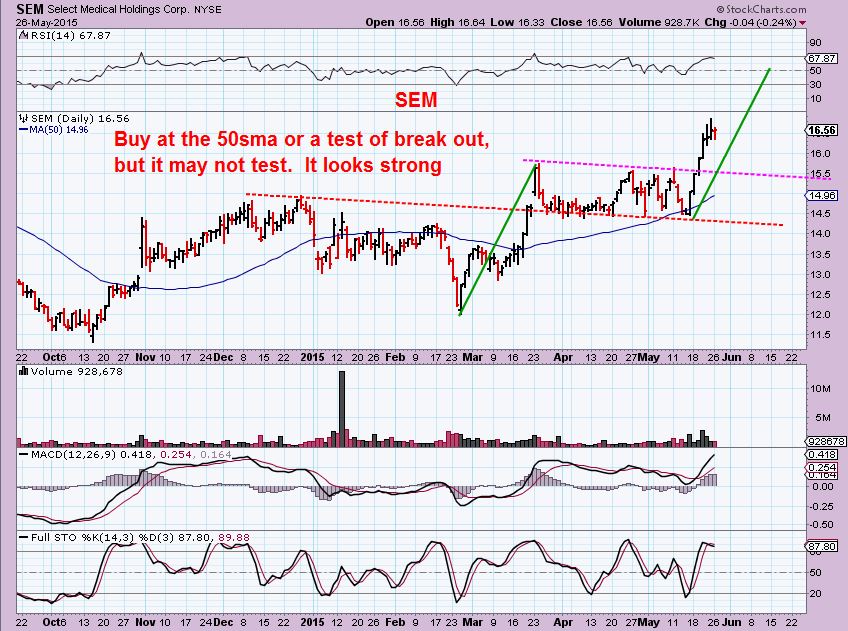
Pointed out SEM WKLY may 20

SEM yesterday after the sell off
See also AKAO, JD, ABIT
There’s A Chance There Is A Change 
 6 Month Premium Site Anniversary Offer
Scroll to top

Charts have been added to the end of the report for traders
With the USD strengthening at the start of an ICL, wouldn’t you expect the general markets to go up? Commodities should all take a hit.
Yes, exactly. If we weren’t going to see a trend change, I would expect that to continue. That is why I say that I feel a change in many areas. If this dollar has put in an ICL, and the markets sell off, its possible that smart money knows that this ICL will roll over at or after making new highs. Commodities would then rally , markets sell down, etc . Of course, if this is a new ICL in the dollar, it also indicates a lot of time may be left before it sells down.
The dollar has had some very strong days in the past week. The markets didn’t.
I just added to PLUG. 1 million shares traded in the first 10 minutes. Something is up in my opinion. May just be a quick scalp or hold for a few days
I saw that, really strong.
Yeah, now its 3 million in the first 1/2 hr. The highest daily lately was 10-13 million. (Could be some short cover too)
PLUG is likely up on this news…. http://money.cnn.com/news/newsfeeds/articles/globenewswire/10136084.htm
Careful, the setup looks similar to the last one. Didn’t end well. See my chart below
Use a daily and use the MACD and other indicators and it doesnt look like the same set up, but thx
H&S pattern?
Usually a H&S has weak volume in the right shoulder (buyers drying up , thats why it rolls over). What I wouldnt mind seeing is a drift down & fill todays gap at the 50sma . If it was just a light volume drift downward, I could add again at the 50sma .
I’m using this 1st weekly chart as my original set up , the second is now
USD rolling over here, or just resting? Down $0.50
Could get nasty on Friday (GDP release) I’ll just be scalping for now. Doing well with Apple.
Scalping works well in volatility. You grab the gains and dont keep giving it back .
Looking at the QQQ and its volume ….seems the plunge protection team, the “Buy the dips” crew didnt go on summer vacation yet. I was reading where many in public blogs were shorting this quickly yesterday, Tricky times in volatile mkts
USD going lower, GOLD not moving higher?
Could be setting up the next DUST buy
SLV:GLD ratio actually in uptrend (higher highs since Nov)…
refresh for chart
There are definitely some slow changes taking place in many areas , and I like what it points to in the long run
Good Morning,
Nibbling in the Energy sector. TGA and SWN.
Wave 1 top for the USD ? Possible, if so should be good for energy. imho 🙂
Also CLNE.
Waiting on MDR to come back to us. 🙂
I’ve been looking, cant quite see anything really jumping out at me ( ROYL is interesting, but I’m not chasing)
Now I know how it feels when a Coach to takes a player out of the game. Thought I was in the Zone ! 😉
I just want a little skin in the game in case the USD is topping. Controlling risk for sure !
Bill
You used to discuss MCP from time to time. It may not be ready to burst higher right now, but have you looked at it on a 2 yr weekly chart . WHen I see a nice base with strong volume surges , I look for it to close and hold above the 10 WMA and it cab then begin to really pay off ( BAA was that way) .
Its not riding the 10WMA yet, but its on my radar
Refresh for this chart Bill
I see it, you’re right looks like its getting ready.
I took a little lottery sized position back in first week of May at .57
I like the way it has spiked up a couple of times since start of the year on huge volume and then sold off on much lower vol, with a bit of upward bias since that Jan plunge.
It may just continue to base with a volatile ride along the way, of course. I’d add if the volatility settled down and the short term chart got more constructive. It’s an interesting one, for sure.
Or it’s going to go bankrupt (of which I have no idea) :-/
Yeah, it traded near $100 a few yrs ago, CRAZY. Bankrupt or recovery / sounds like a lottery, but I may tale a position over that 10WMA too
I hate to say this, because I have traded this and basically made money and lost it again, but…
NQ looks good again, especially on a 6 month wkly chart
Does anyone have the date for the last ICL for the USD?
I’m thinking it was March 26, but others may count it from that monster spike down.
March 26th? or Feb 26th? Miners didn’t sink much if its was March 26th
Euro looks to maybe be reversing here
Euro picking up. The low this week was at the 62% FIB retracement
I have the last DCL on April 6.
I have the last ICL on Oct. 15, 2014 sh
March 26 is possible too.
That would be a failed one tho, right
NBG weekly chart has an interesting reversal too
NBG and Greek stocks will absolutely soar if all goes well with Greece next week or two. The 200SMA on NBG is 40% higher than now. Expect that in June, assuming takes out 100 and not a fake.
Nice surge by NBG today after that nasty plunge yesterday (good sign was that vol was low). Close to the 100 DMA that has kept it down this month. Still feels like it’s coiling under that for a big move.
KEG has an interesting turnaround going today, after an opening one minute plunge that is forming a long lower wick. Also that was a bounce off a trendline from the bottom in Dec. Not much in the way of volume yet though.
HERO on the other hand has been no hero lately. The daily chart is on the verge of looking real ugly.
Wow, thats nice on Keg. Thx for posting
I mentioned (and took a position in) KBR last week. It’s bouncing strongly right off the 20 DMA today, after a nice consolidation above the 200 DMA. Looks good
WRES and SFY wow, glad I don’t have any.
I had a chart in the report MNKD as a buy. I owned it as a possible a-b-c-d type move. It passed the high volume swing at the 50sma on close to 1/2 the volume as it had on that day.
I usually lock in profits when that happens no matter how good it looks.
so….anyone buy MNKD? I am now Out.
DYY – Thats a little confusing
WTF? Nothing about that chart since the Jan bottom makes much sense. It’s trading at a big premium. The NAV at yesterday’s close was 3.61 for about a 42% premium. And today it has clearly gotten a lot higher.
It’s that efficient market! LOL
LOL- yeah, I saw it and thought I was transformed to a different time period.