I want to review the market moves from yesterday and their possible implications. WIth that I am also keeping in mind the FOMC minutes will be released at 2 p.m. Eastern today. That has the possibility of shaking things up at times.
My SPX thoughts are bullish, as shown in yesterdays chart. The SPX ‘paused’ yesterday after breaking to new highs.
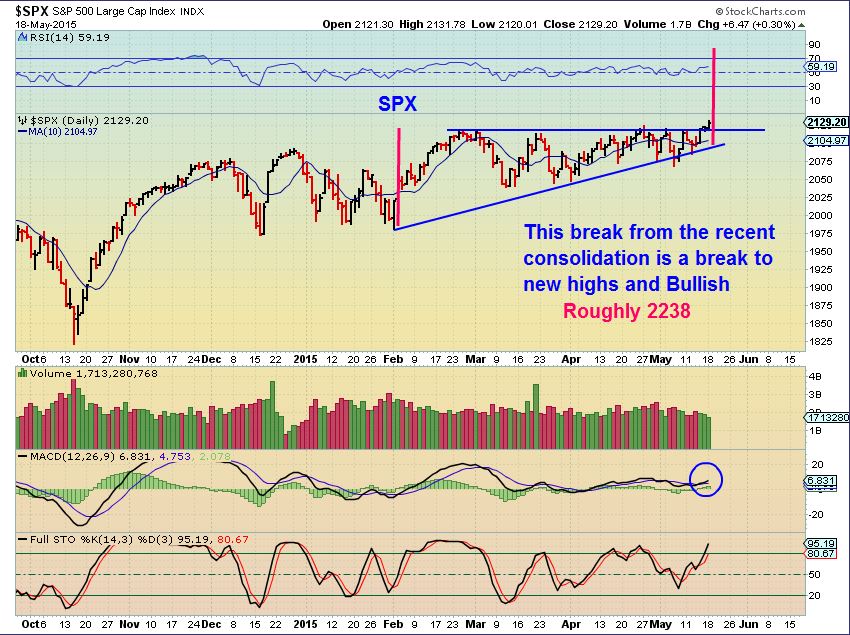
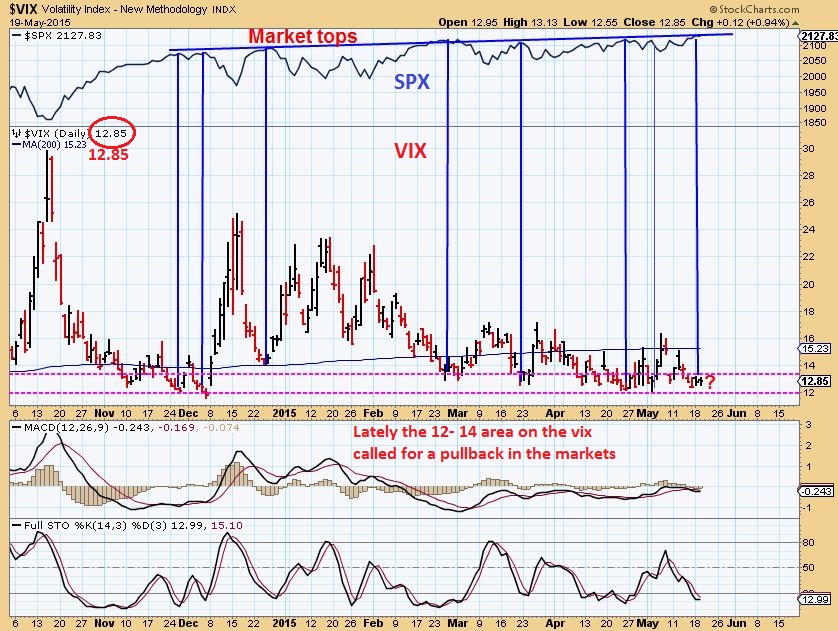
That said, I want to point something out that could weigh on the markets too…
The VIX down at these levels show complacency , which often pointed to a pullback in the past. A POP in the vix usually weighs on the markets , even if only short term.
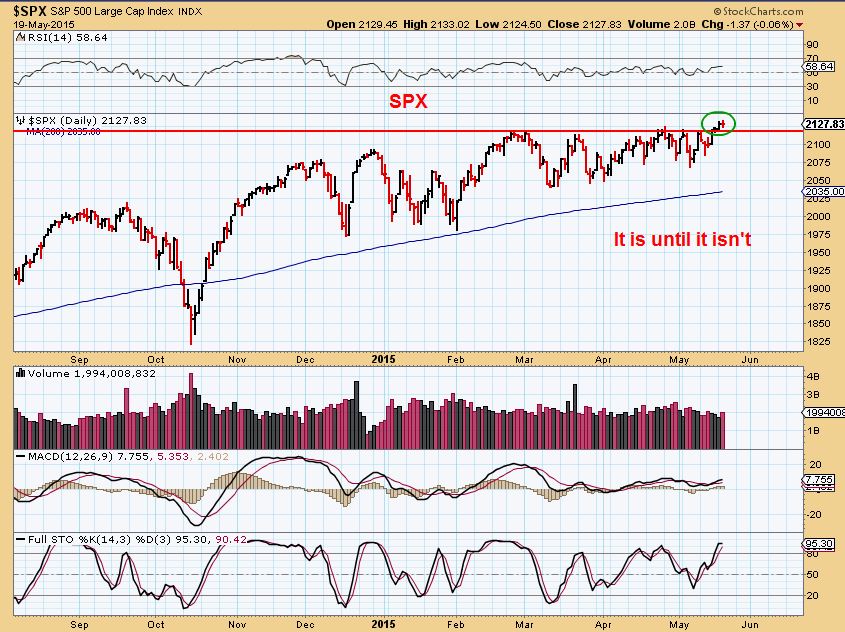
SPX – SO it is ( a break out) until it isnt. My stop would be below the break out
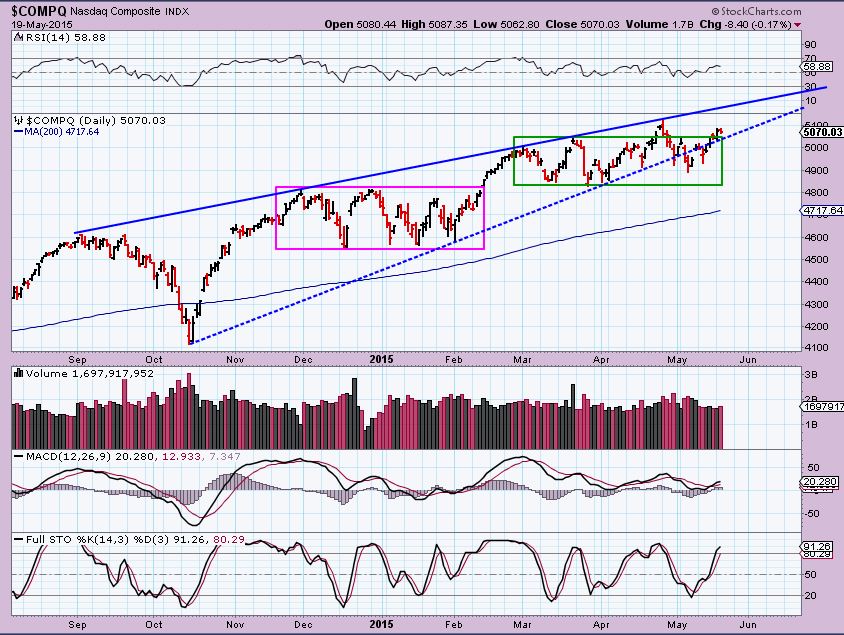
NASDAQ – it is inside its consolidation, has room to go higher and there are many bullish stock charts out there.
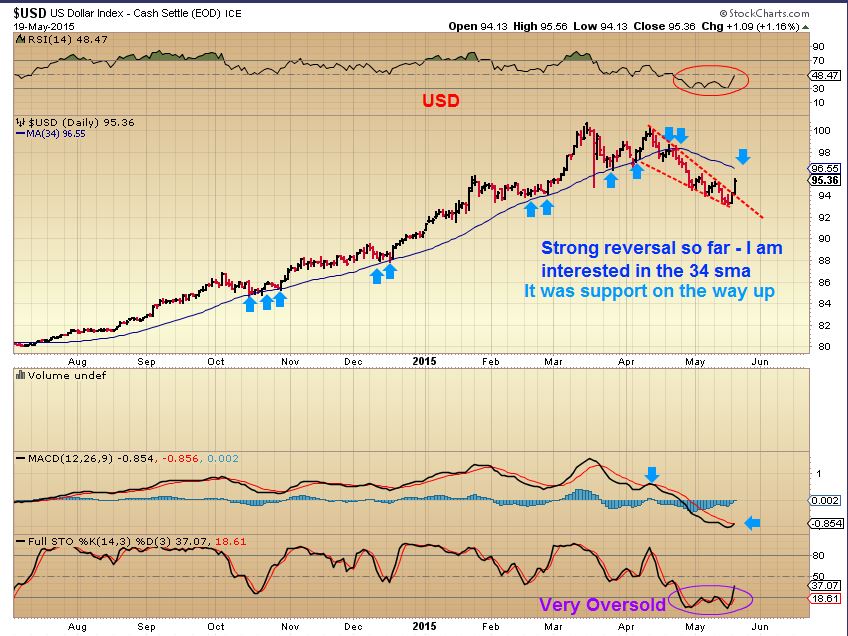
USD- Strong reversal in process. I keep hearing that the USD is going to break to new highs. It definitely could, The break of that descending wedge is solid and cycles support that a low is in. For me, the first area of interest is $96.55. My overall big picture is still that the Dollar is toppy and commodities have been bottoming. If that continues, I see the equity markets as “Sell in May and go away” and commodities will continue recovering. The Dollar & Commodities future track will be important.
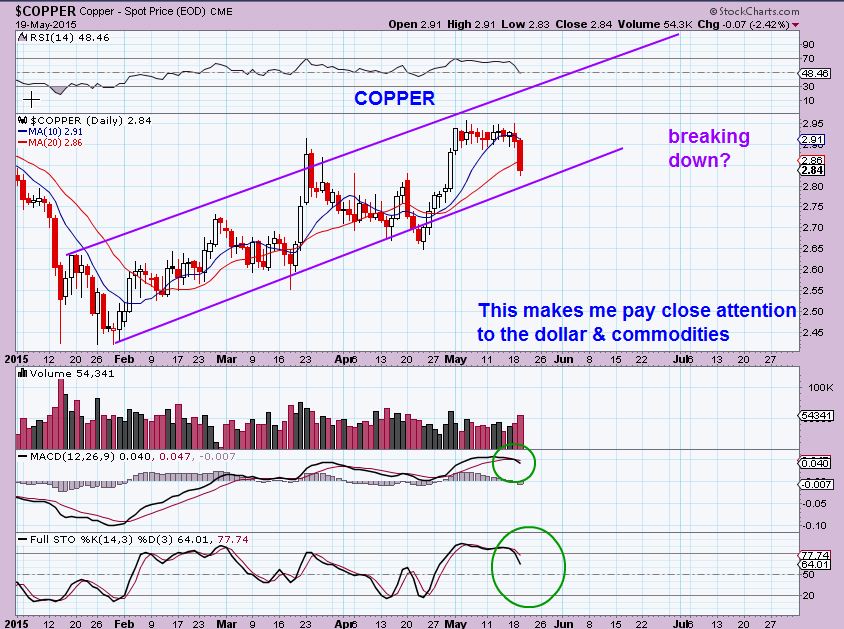
COPPER – did very well during the dollar correction April – May. Tuesday it took a solid hit, and this is a warning for commodities in my mind. If COPPER ignored the dollar rise, it would be more bullish for commodities.
In the 1st week of April , the dollar (See chart above of the dollar) shot up to its 2nd top. Notice that Copper dropped in small candles the first week of April. Copper traders didnt believe the dollar move toward new highs. Yesterdays candle was Large, down 2.5% . I’m watching copper too.
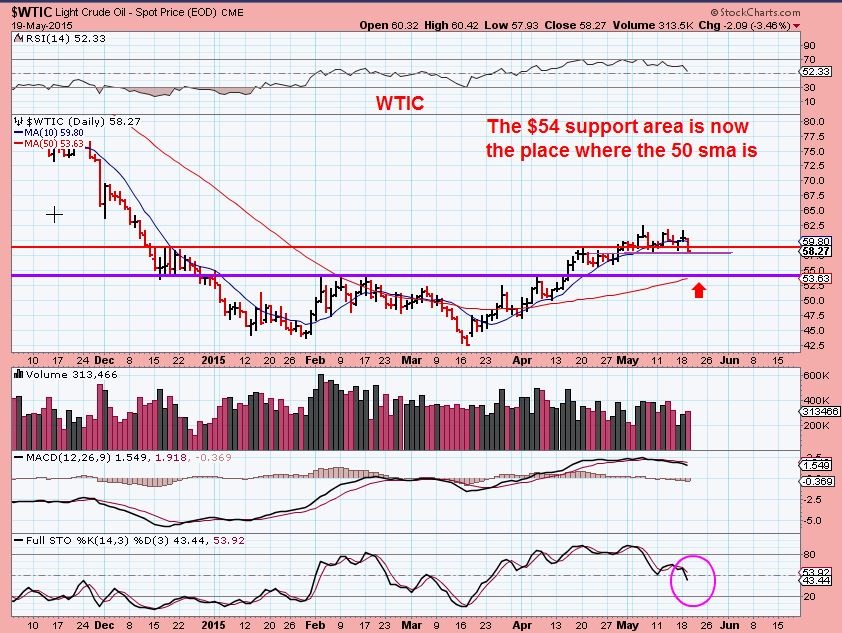
WTIC– I have mentioned all along that a drop to test the break out could come. The 50sma is in that area. OIL has been strong, and it did start to dip. Click on the chart & look closely, It is at recent consolidation lows, but could drop further.
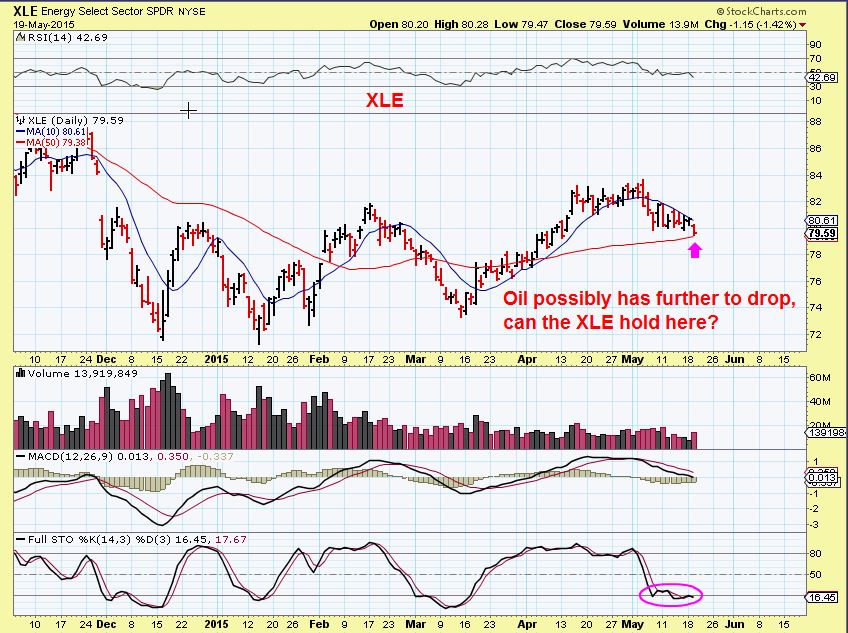
XLE– this is near / at the target that I had for it. It is quite oversold too. If oil drops to the $54 area, will some energy stocks break down? Or will the XLE lead , and reverse higher? Lets watch it.
NATGAS – remains bullish in my opinion, still above the 10sma. A high volume reversal in overbought conditions can indicate further selling however, so if you are trading NATGAS with leverage ( Many here use UGAZ) you likely sold. I still think NATGAS is going higher, but it does look like it can drop further from here. If so, I think it will be buy the dips.

SO now we have GOLD SILVER & MINERS
They went from bright & Shiny looking to a one day smash.
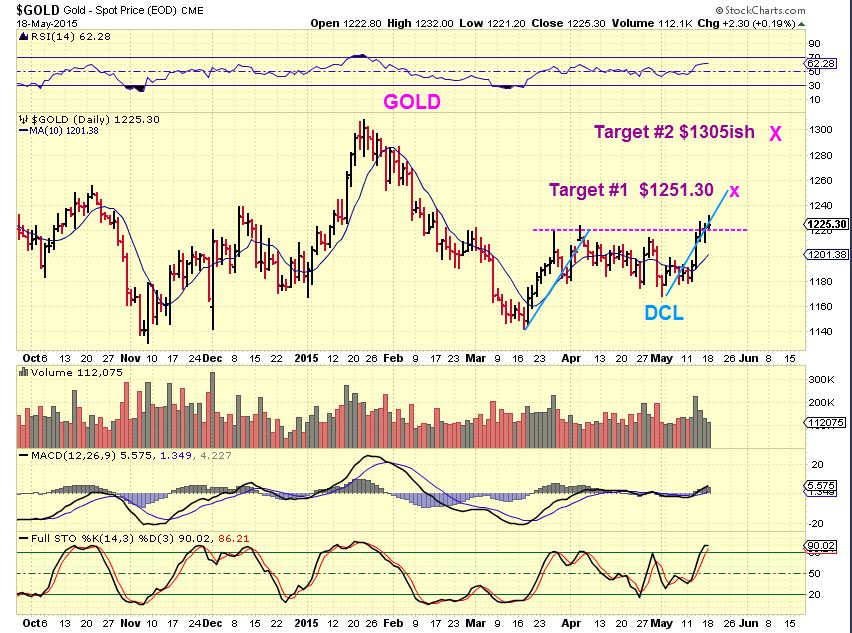
GOLD – I posted this and mentioned that we could drop to the $1200 area ( 10sma) , but I was looking at these targets. Then it got hit harder than I wanted to see…
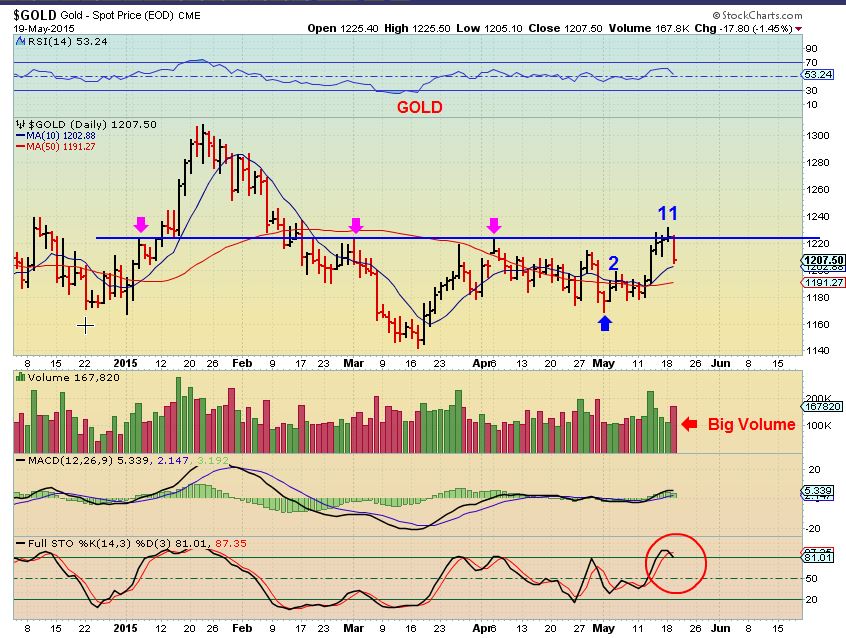
GOLD TUESDAY– dropping to the 10sma in 1 day is a little concerning. Volume was big. We have had 1 or 2 day slam downs in the past, but cycle wise we are on day 11. If my upside target isnt hit soon, it becomes less likely.
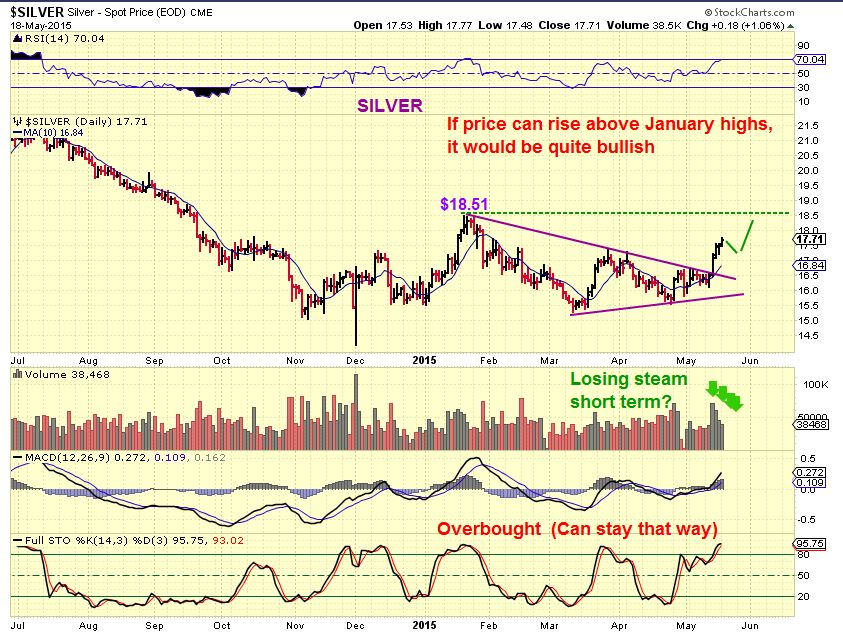
SILVER broke out and I posted this. It looked Bullish , but volume was quickly dropping off and I pointed that out, so I drew a small pullback before moving higher. I said a “small” pullback…
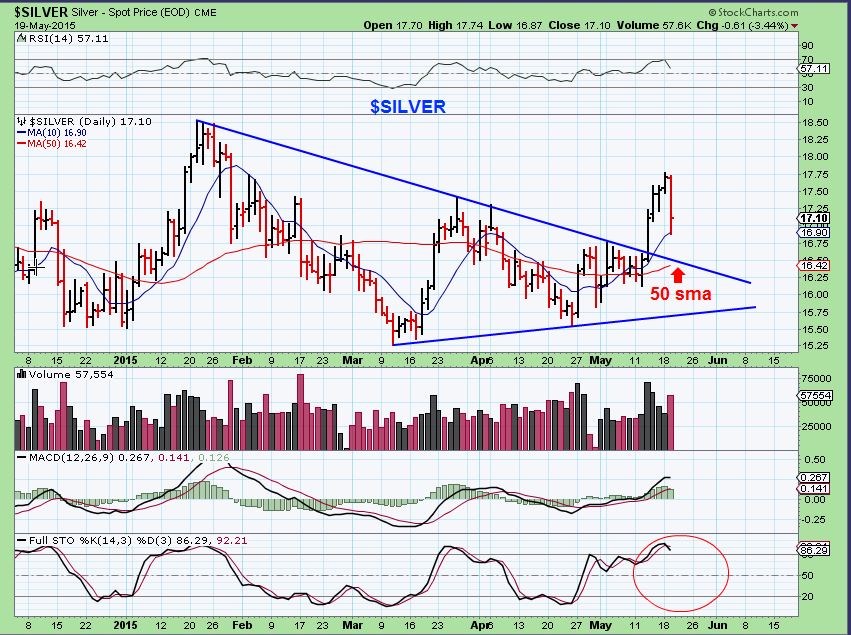
SILVER– we got a slam. It hit the 10sma and bounced, but is it done? I cannot say. If you look at May 1, it slammed for 1 day and downside was done, but you cant expect that, all you can do is honor stops. If I bought USLV or SLV for example, I would have bought at the 50sma when I was pointing out the triangle break out. Maybe I would have bought the triangle break out. That triangle may get tested near my stop : (
I have mentioned that the MINERS looked to be bullish and metals were semi – bullish. I also mentioned basing processes and trading ranges and Miners didnt seem to be “Selling off”, they have been in an up-trending channel, so I didnt want to get shaken out. IF this breaks down, I will need to sell, let me explain. I bought some silver stocks and they reversed too. Not every trade I take will work out, so I need to either lock in gains at uncertainty, or keep losses small to preserve funds for the next trade. I am watching silver closely, I still own silver stocks.
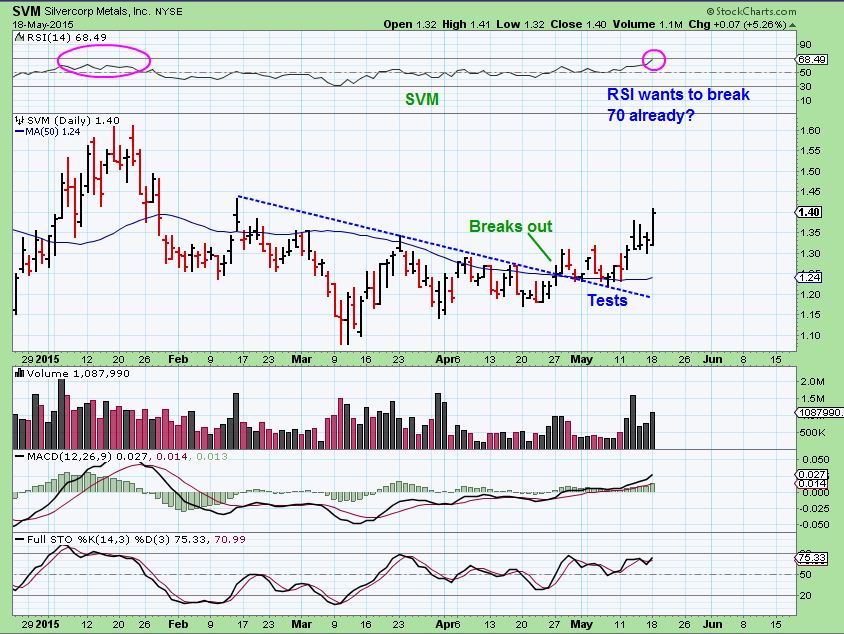
This was SVM for example. Looking great.
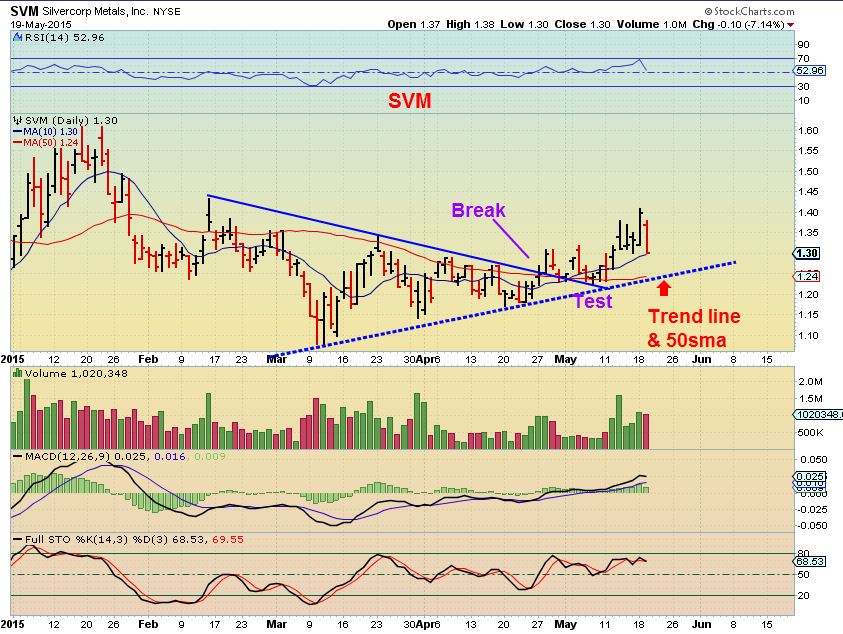
SVM Tuesday. The 50sma and the trendline is my exit and it will be a small loss.
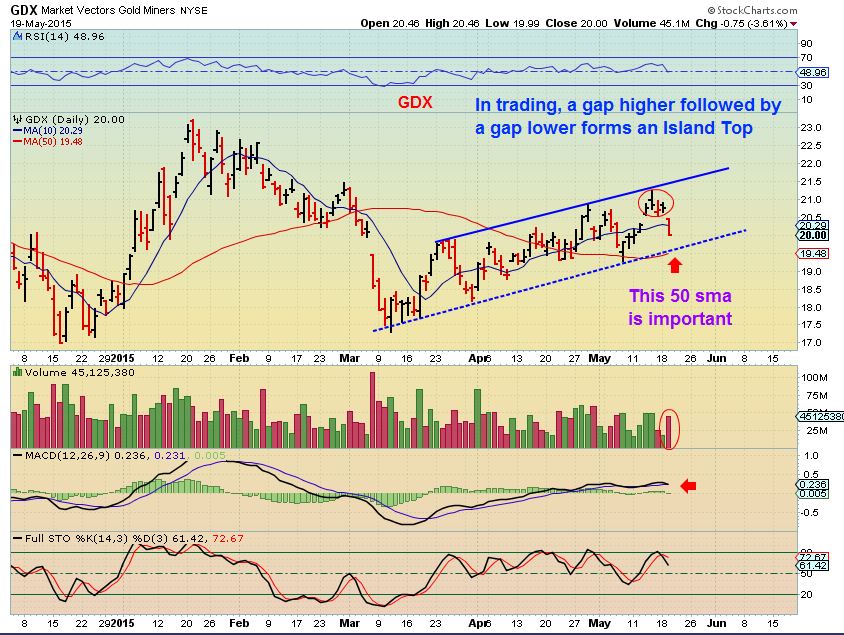
A look at GDX- THAT could be an ISLAND TOP. Will the 50sma hold? It is also the channel, so if not, we may be breaking down. Can we get an early clue??? I think so…
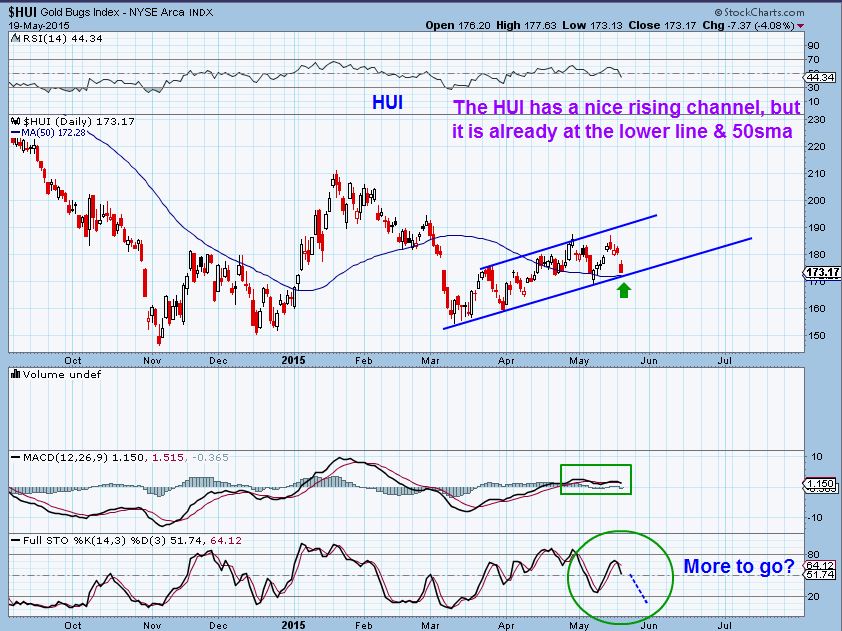
HUI- An early clue . It is already at a rather important mark, I am watching the HUI . If it breaks down, I can guess that the GDX / GDXJ will follow.
I am being asked , “What do you think now that the dollar is rising?”
Let me just say this for the Bigger picture – COMMODITIES like Copper, Gold, Silver, etc (Except Energy so far) seem to be in trading ranges and possibly bases, so maybe they should really be traded that way. I’m thinking that if you are trading the Metals for example, one should take profits when we have them and wait for pullbacks to re-enter, because that seems to be working for now. Remember when stocks like VALE and CLF were looking excellent? They have broken down and are likely basing now. MINERS themselves seem to be acting a bit different so far. Some are trading in their own individual way, so I look at them that way. Look at 3 month charts of TRQ, BAA, GSS, EGI, etc – they have acted bullishly short term. BVN & NEM look good as I have pointed out , and they may be a ‘ Buy The Dip’ if they act correctly.
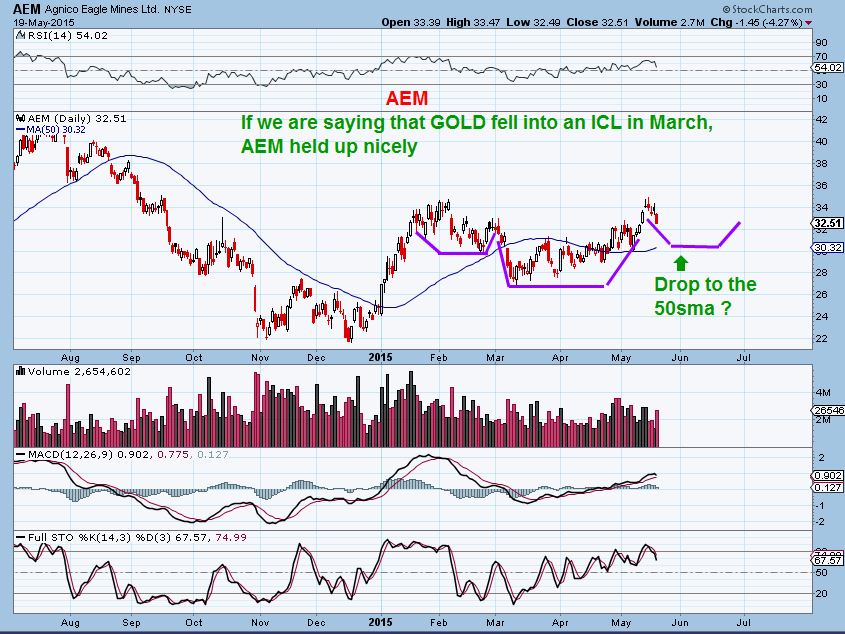
AEM has done rather well, and this is a possibility if it pulls back in a healthy manner, watch the 50sma.
In the Tech Sector , there are still nice set ups for nice trades , but outside of trading , there is boredom.
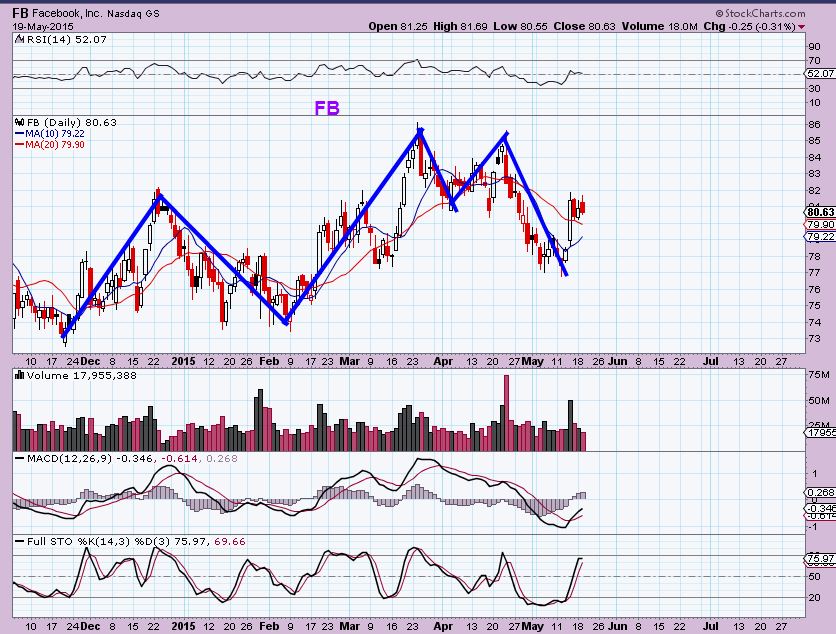
Look at 3 month charts of AAPL, GOOGL, FB, etc. A roller coaster ride sideways pretty much. Great gains some weeks, sell offs the next.
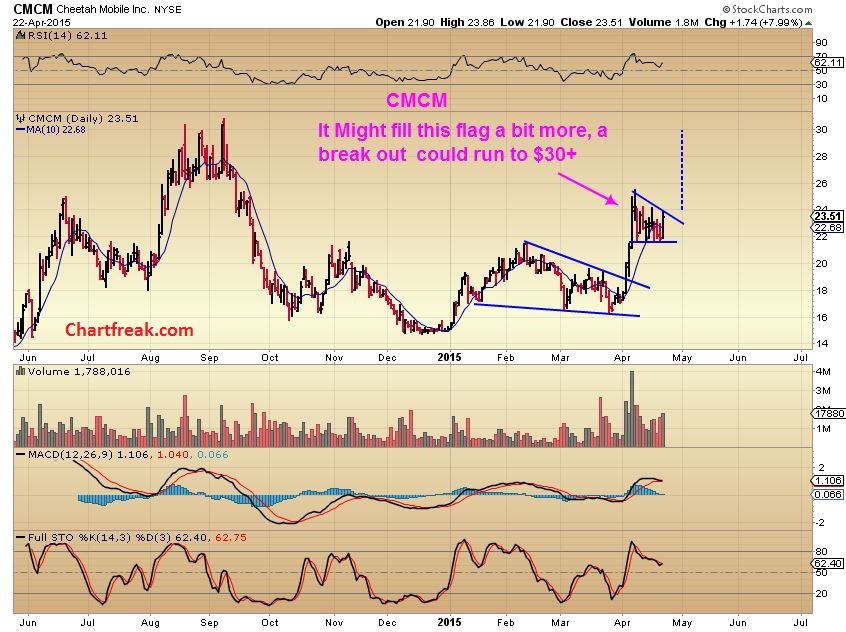
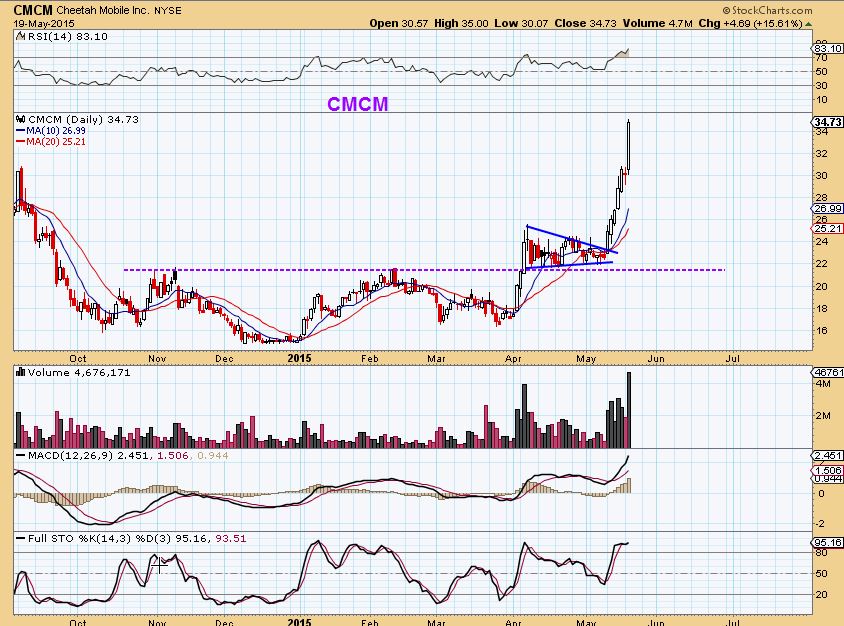
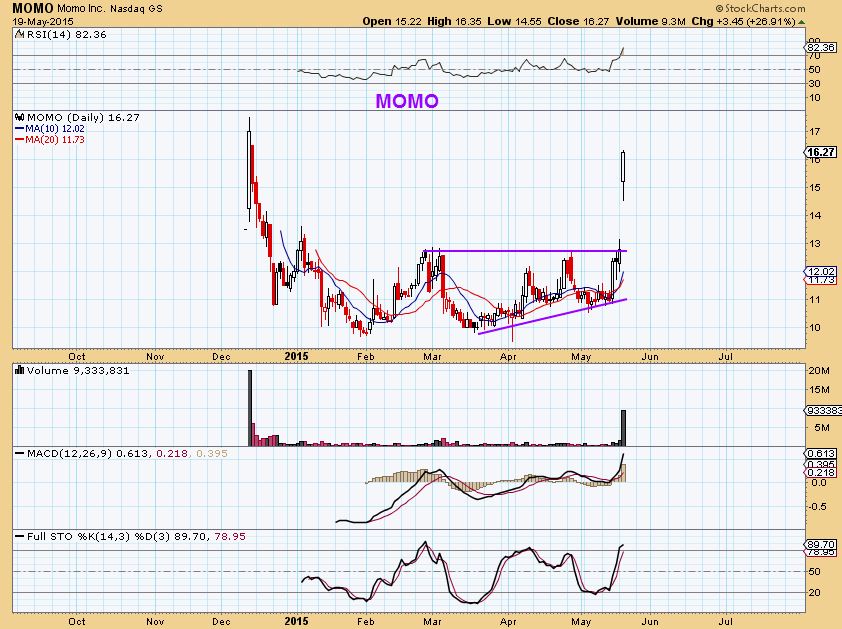
It is the stocks with certain bases and consolidation set ups that break out & run up nicely like CMCM that I like to look for
MOMO
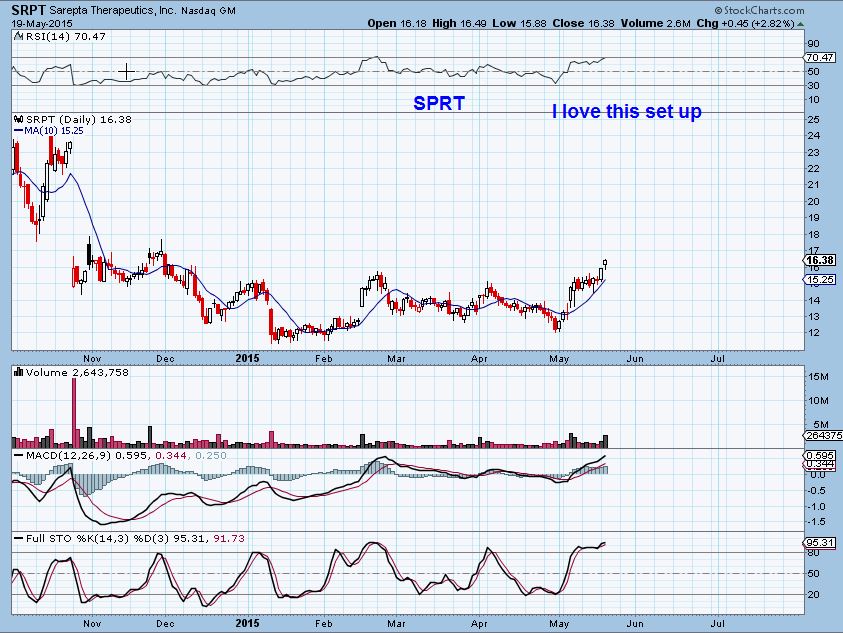
SRPT
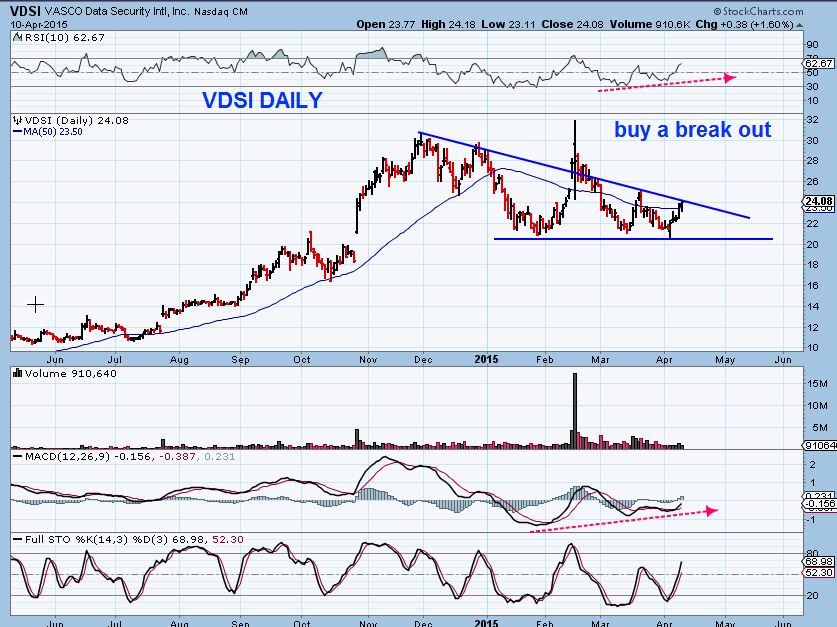
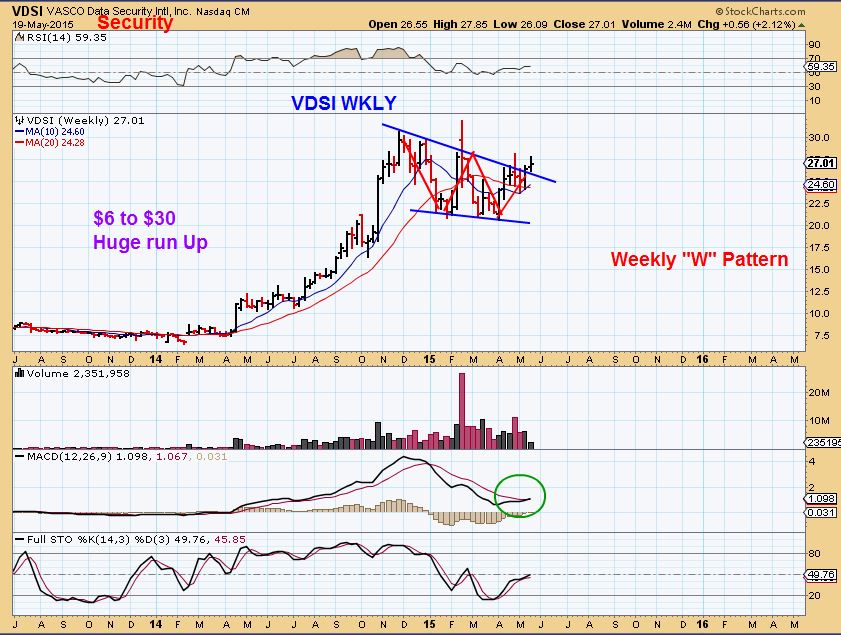
I pointed out VDSI in April at $24 – Data security – Still liking it
VDSI $27
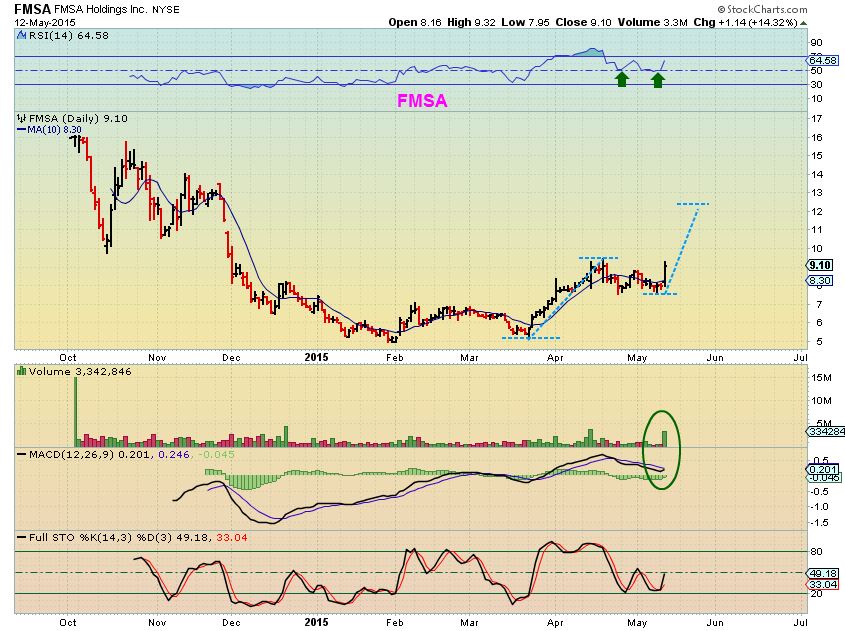
FMSA – hasnt broken out yet. Shown here May 12
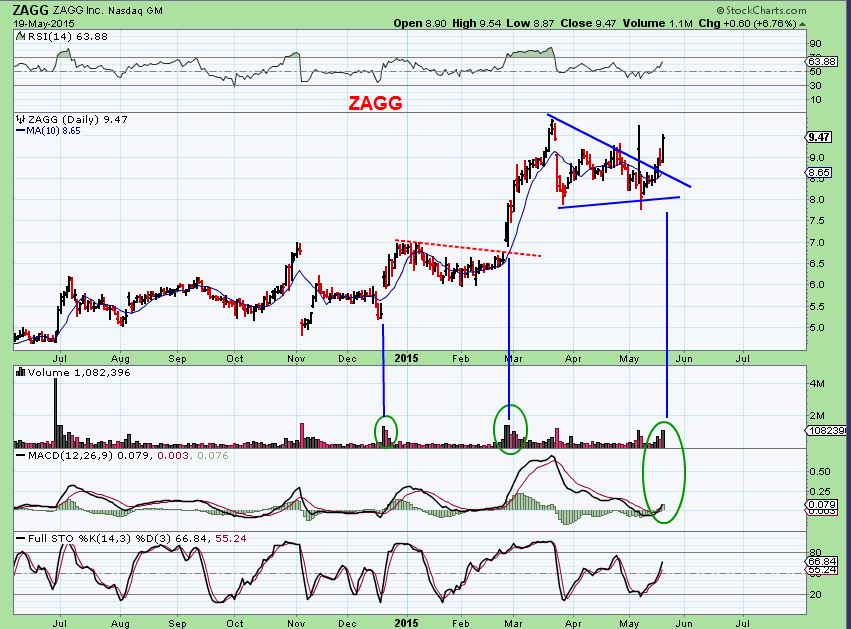
ZAGG for a quick trader on a break out higher
ZBB– still set up low risk too. I own PLUG & ZBB for trades .
So much has changed , but nothing has changed. Things look bullish as they rise, and bearish as they drop. I am trying to remain unemotional and just see how things play out. I am watching the dollar and commodities for further clues going forward with Commodities . The FOMC minutes from the end of April are released at 2 p.m. That can trigger reactions in any sector too. As always honor stops and dont worry if you take a small loss, it preserves funds for future set ups when the selling dies down.
Happy trading
~ALEX
Premarket action
AEO, PBY, CSC, SRPT ( WOW! Up 45%??) Chart was above .
Under Various Circumstances 
 Public Post – Energy on the Move
Scroll to top

“It is till it isn’t ” Gotta put that one on my desk. 🙂
To keep one from jumping in too early….”It isnt until it is” works too : )
The high volume in DUST is a bit concerning. These kind of volume spikes in the past have indicated intermediate tops.
If you see that those spikes are occurring regularly enough that you trust it , you could always grab some DUST or JDST or go short as a hedge or an outright trade.
I usually just sit on the sidelines. I find selling short difficult and rarely make money especially in the volatile mining sector.
I tend to agree, especially at the start of the move down, its often jumpy. In the past , when we were in the real steep bear mkt moves in a 3rd or 4th dcycle, you could do well short just waiting for that final slam into the dcl that always seemed to come out of nowhere. After day 20 you could buy JDST/ DUST and get a huge move down in the GDX into the DCL.
Would you buy DUST now, ALEX?
I’m not
DUST was a buy and hold for 2 years starting in October 2012
hmmm .. i have this for DUST.. :-/ IFFF 5 is extended – which it looks it to me — then it extends by 4 waves..then it can make the turn up for ABC.. orr it can extend again – 4more waves. hmm.. again i could be wayyy off on my counts… but just fyi..??? https://www.tradingview.com/x/DevRdzcG/
GREAT report btw… your analysis is impeccable… so thorough & broad … i learn something new every single day…cannot thank you enough for all you do. my apologies if I sound like a broken record ;o) but props to you for all your hard work and dedication. It is greatly appreciated….
signed,
Problem Child
Thanks Maria , in all honesty these markets are very volatile and monitoring all the sectors along with valid trades is tricky. Throw the $USD wild card into the mix and it gets really interesting.
I actually used to sleep at night when I only traded for myself 🙂
Your DUST chart ( with an A-B-C down) is consistent with your GDX chart the other day. I like that.
I hate it when I find that have a bullish view for GDX and a Bullish view for DUST, because it means something cant be correct, they both cant be right..
So you are in harmony with your own analysis : )
JINX!! i was JUST thinking the same EXACT thing.. ;o) he he he
JINX in different words
WUUUT…JINX AGAIN, you owe me a coke!
LOL…omg… 2funny
WHAT stop that.. get out of my head!!
also have this for HUI.. again – i could be off in my novice wave count ;o) https://www.tradingview.com/x/T2CWGYva/
Not too ambitious : )
lol.. yea.. thats my middle name… maria ambitious..
and gold in wave III…ready 4 blastoff.. just about to head into 3of3.. would be sooooo cool if this really is correct…
https://www.tradingview.com/x/uNl2yfcm/
Ok, based on prior conversations I know ur going to yell at me, but on your gold FEB sell off, isnt your wave 3 the smallest of the 1-2-3-4-5? And isnt that impossible ? ; – )
J/K (but isnt it? )
lol .. for which chart?
That GOLD one you just posted . Its the FEB sell off that I am reversing too, with minor 1-2-3-4-5
yes u r correct .. 3rd wave cannot b shortest.. but i cannot look now :-/ sorry.. will study it later ;o)
I’m kidding with you, bcuz we had that discussion before . I am by no means an E.W. technician
u think that’s ambitious.. take a look at my clne..u will really LOL ;o) https://www.tradingview.com/x/ltyDUSry/
ps. in case u didnt notice, im gunnin for the ‘poster of the day’ award… ha!! [kidding of course]
I can picture CLNE that way. I traded QTWW, BIOF ( no longer around I think) PEIX etc when they formed these patterns an they did rocket like that version of CLNE that you have,
sooooo … IFFF DUST does another zag down it would coincide with my nugt chart .. in which case C2 will be just straight down and is almost complete and will zag up.. get it??hhhmmm .. interesting.. just thinking out loud and trying to LEARN how to be a detective and make broad comparisons.. ..
https://www.tradingview.com/x/OPdCv09U/
DUST double bottom here. Could be a good run % move. See below
Thanks Alex, I’m still looking for more pullback in GDX. I see $19.60 in the cards, see below. My chart from 5-18-15 is still in play.
So far the miners have trended higher in that channel despite movement by Gold, and the 50sma is $19.53 currently, so I am watching that area , the trend line looks like it would be in the $19.70 area by the time price hit it, so both are above and below your $19.60. 🙂
$19.60 is a rough estimate. We are in the same mind set. You can see both of my lower trend lines, the harmonic pattern has it going to $19.51.
CENX will be a nice buy at $12.35, double bottom!
CENX getting there
Keep up the good work ALEX. Wish I took the BAA trade, took PLUG that worked out. CENX was a stop hit, buying back at $12.35
Just throwing an idea out there regarding the bases like I saw in BAA.
The BAA trade is solid on a wkly , and others with a similar wkly sign of strength can be EGI, GSS, and recently MGN.
EGI was a buy on the wkly pullback to 10WMA last week. Scary but it worked.
No guarantee how they will play out, but I also Bought the GSS trade original pop at .22 ( I usually accumulate these , so BAA was well accumulated, GSS took off after my first buy & I couldnt build my position , so its a small holding that I may add to if it holds up well. ) I kind of like GSS here on the 10sma, but a pullback in Miners would likely close that gap. The 10 Weekly moving Average is the normal add on .
MGN looks like a nice base dropping to the 10WMA.
REN (energy) wkly same principle.
Those are just ideas of “that special kind of trade”. Anything can go wrong in a sector sell off, so I remain cautious
I like REN, I wouldn’t touch the other two.
Excellent report Alex.
I really like the HUI chart, I will be utilizing that one !
Missed SRPT 🙁
Thx Ken,
I missed SRPT too, Same as MOMOM, but When I see those nice round bases with correct readings in MACD etc, and then I see then explode, it build confidence in the set up ( for future charts pre-pop).
I’m thinking We’ll catch a few in the future 🙂
Doing some more Harmonic Analysis on WTI crude (wkly chart). I discussed with a friend/expert on Harmonics. This is the pattern that is expected (below). Almost perfect numbers. How long this pull back lasts? Who knows, but the trend higher isn’t over. Pullback=buying opportunity, everything is on sale.
interesting …. some day I’d like to learn that… tx 4posting
Thanks for posting. Will be looking for confirmation of next up and back the truck up one more time!
Alex if you be so kind to take a look at:
AU…..which is on the 50 sma.
GFI….below the 50 sma but oversold
HMY….below the 50 sma also oversold
Yes, be right with you
Thanks Alex. Appreciate your response and view.
Yes I also REALLY like that 34 sma on the USD……we “could” hit that sma after 2 pm today, which is causing me to “Pause” on PM’s.
Yes, if there is any reaction, it could be after 2 p.m. . SO far I feel like we are back in limbo
UUP up on average to lightish volume (So far)
SOLARS getting ugly (TAN)
YGE, got hammered and rebounding
is it a good idea to pick up few UUP -Alex/Anyone? Hmmm and oil taking longggg to decide its direction;)
AIRLINES clocked too . check out LUV, AAL , DAL, HA, JBLU
Alex, check out DDD…beautiful shallow pullback on light volume.
Yeah, Popped up and landed on the 10sma -so far. little reversal on VJET too. ( just thinking 3D sector)
I see that… DDD has 35% of float short currently.
WTI short term (hourly chart below) are we in a bear flag or a new uptrend? I am leaning towards new uptrend! Gartley pattern in play lowest typical point is at 78.6% retrace, almost there, maybe we don’t go that deep?
THANKS A LOLT BILL.. FOR YOUR EXCELLENT WORK YOU DO FOR US !!!
Looks like bear flag just simply looking at your chart. But hope not. Small cap energy did not look all that promising today even with oil up and bullish inventory. But I’m still in the trade.
Sold 1/2 of my UUP calls…..casino money now. 🙂
Will Re Enter if we get a pull back.
Casino Money! Put in all on Red & let it ride
Refresh for chart (Click to enlarge)
.
Did anyone buy that tight base PBMD? 🙂
GDXJ, EXK bouncing off 10dma today. Look forward to updated analysis.
Juniors are interesting, they do seem to have buying here and there. NG (Nova Gold) dd the same and BTG & PPP looked quite good.
CDE solid performance today compared to GDX, etc and with silver neutral to down. Junior well out ahead of Srs and silver ahead of gold, which is a positive for risk appetite.