
Little Changes
Not a whole lot has changed since the weekend report, but we can review the little changes that took place and see if it changes anything in our big picture outlook.
.
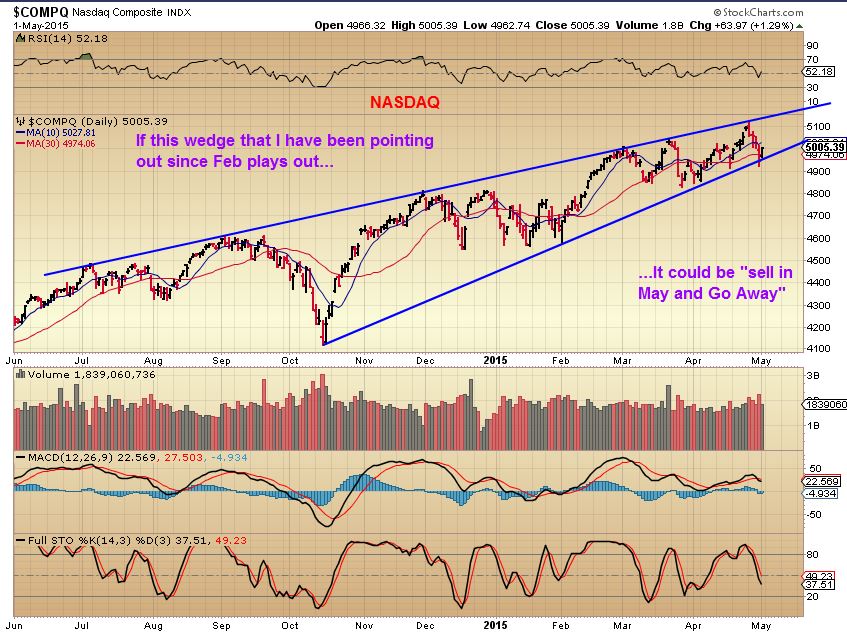
NASDAQ may 1- The Wedge pattern still had wiggle room
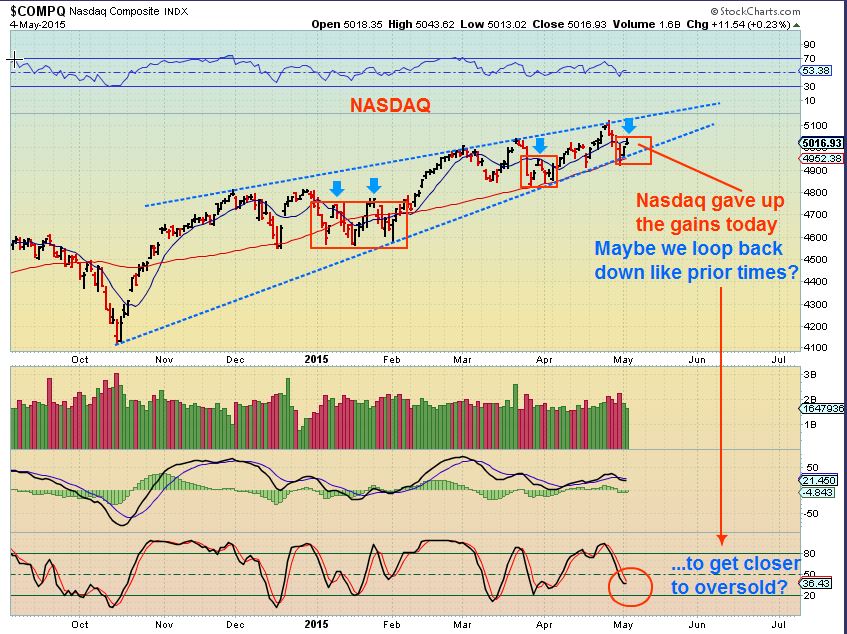
You can see on the next chart that on Monday there were minor changes…
NASDAQ gapped open and reversed lower. In the past this has caused minor bouncing. See the orange boxes. We may or may not bounce around, but there is still upside room in the wedge over 5100 too.
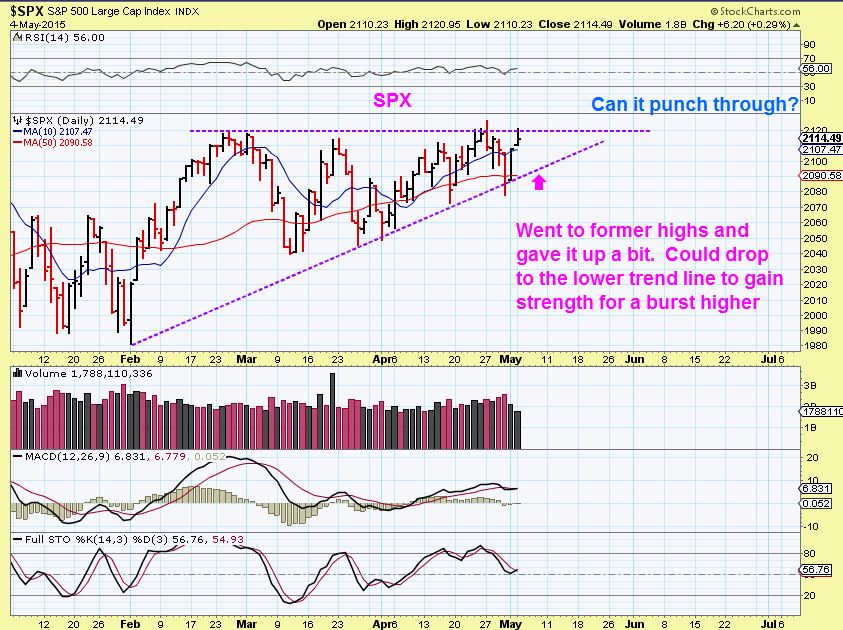
SPX – Looks like it wants to drop before trying to break out again
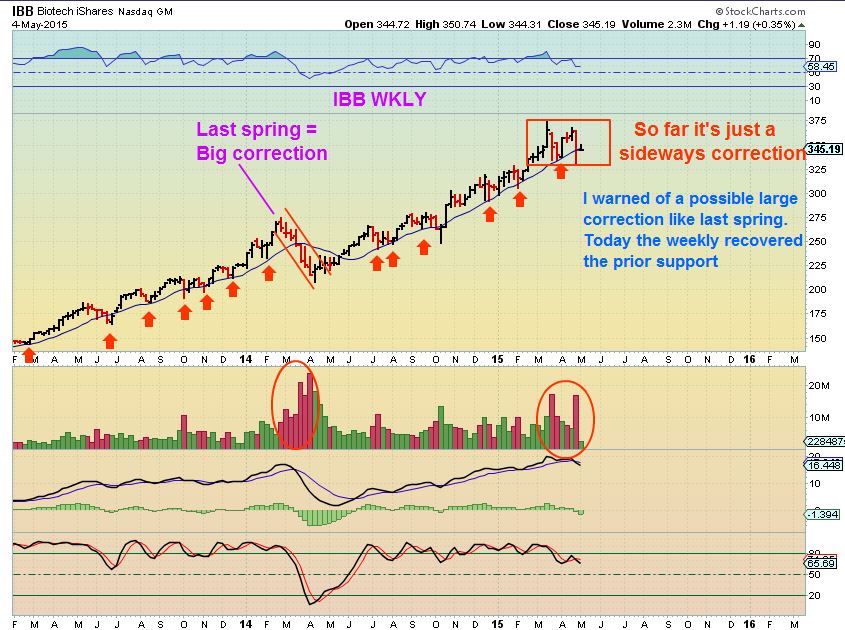
IBB – I stated that it could break down like last spring when I saw that heavy volume weeks ago, but it possibly just consolidated and recovered the blue line today already.
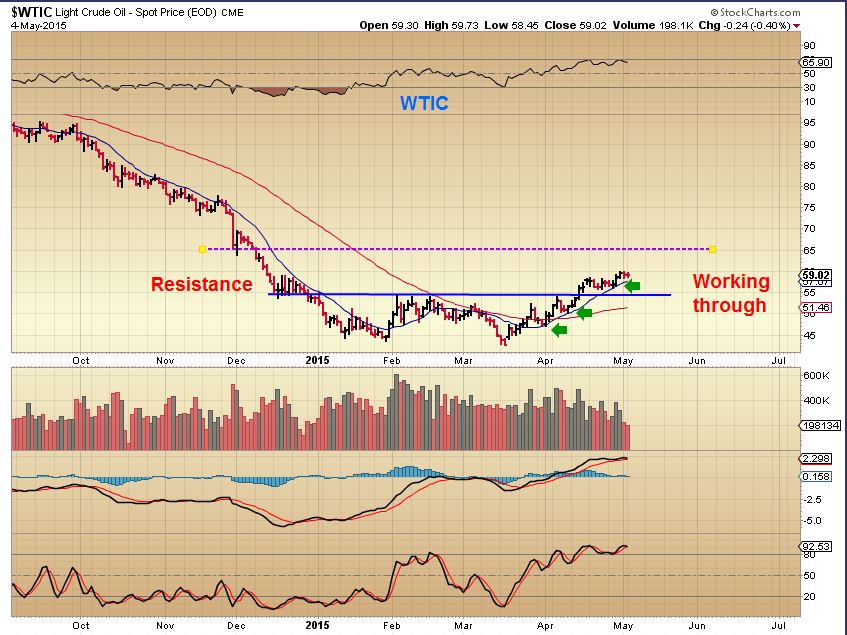
OIL – Still acting correctly and showing strength , not even pulling back yet as it pushes resistance.
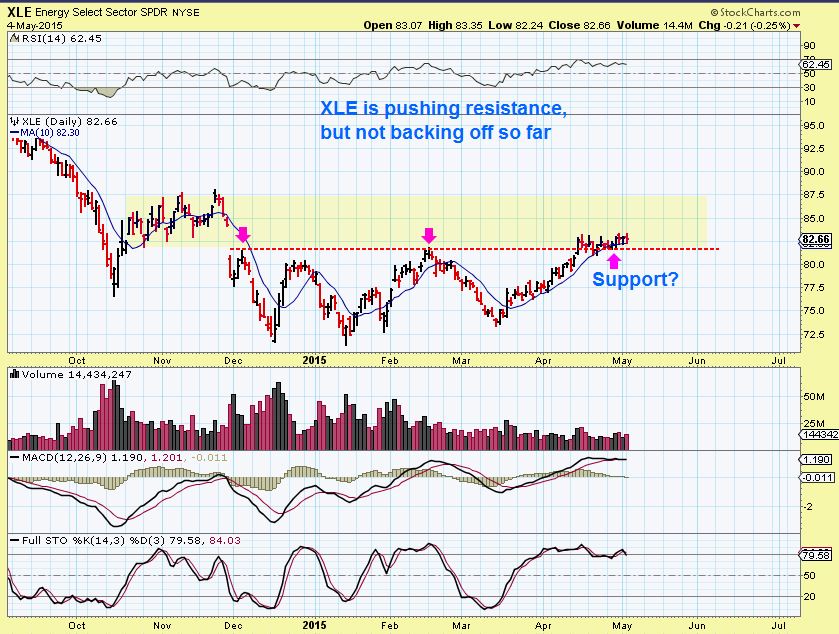
XLE this looks like a consolidation setting up to breaking higher again. XLE is up 50cents pre-market as I write, So energy stocks must look bullish?
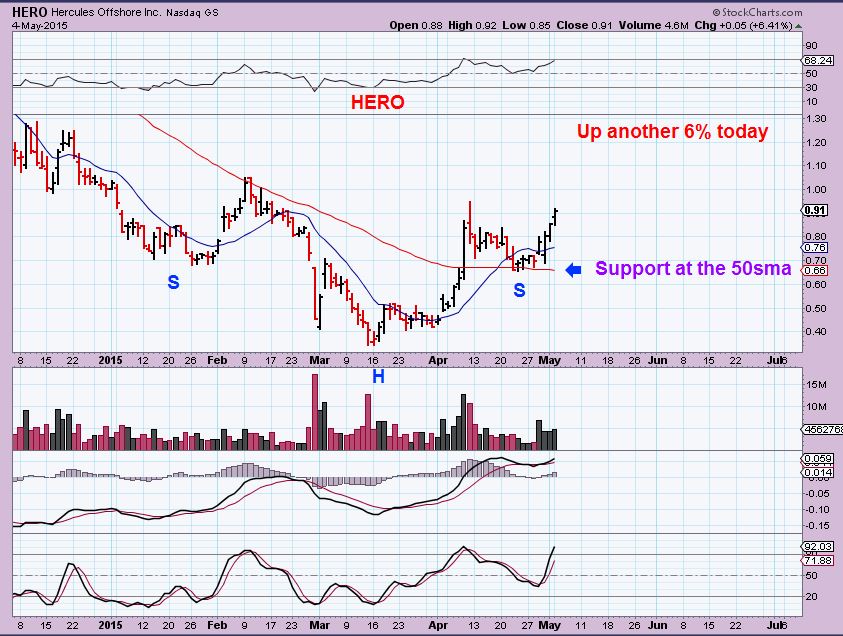
Many Energy stocks still look very good to me. I have mentioned HERO & REXX for example, and both look continue to move higher. Others like SDRL ,KEG, BAS, continue higher. It is a bullish sector, as expected.
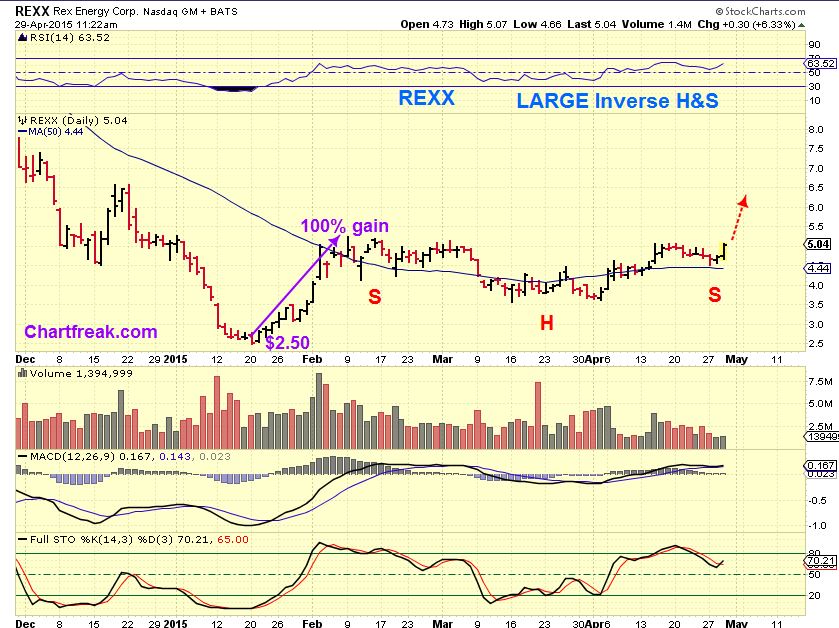
REXX – This was April 30 – Price is now higher than this chart (ready to break out?)
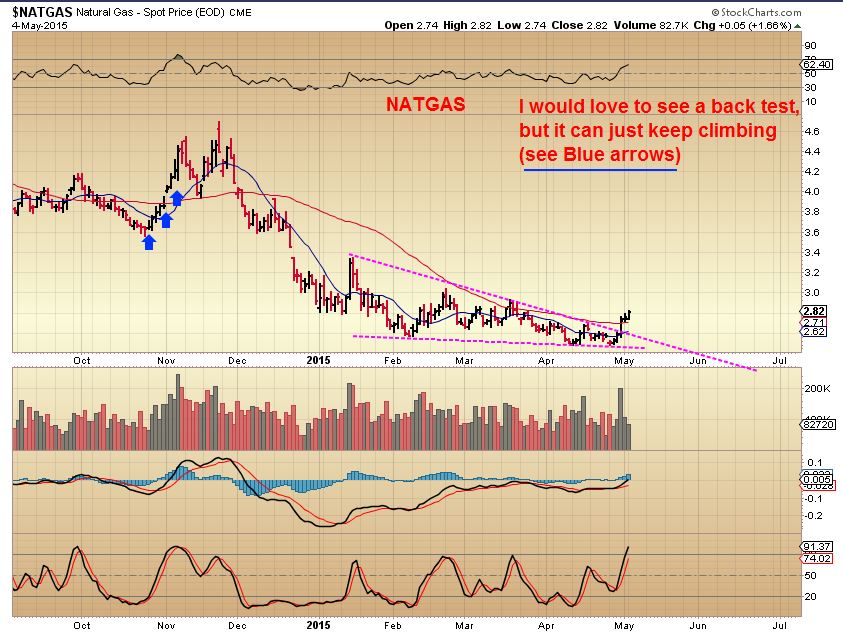
$NATGAS – Bullish
XLF (financials) actually looks good and JPM, BAC, MS, GS look bullish too.
The USD reversed from its sell off Friday and climbed today. GOLD/SILVER/MINERS ignored it.
.
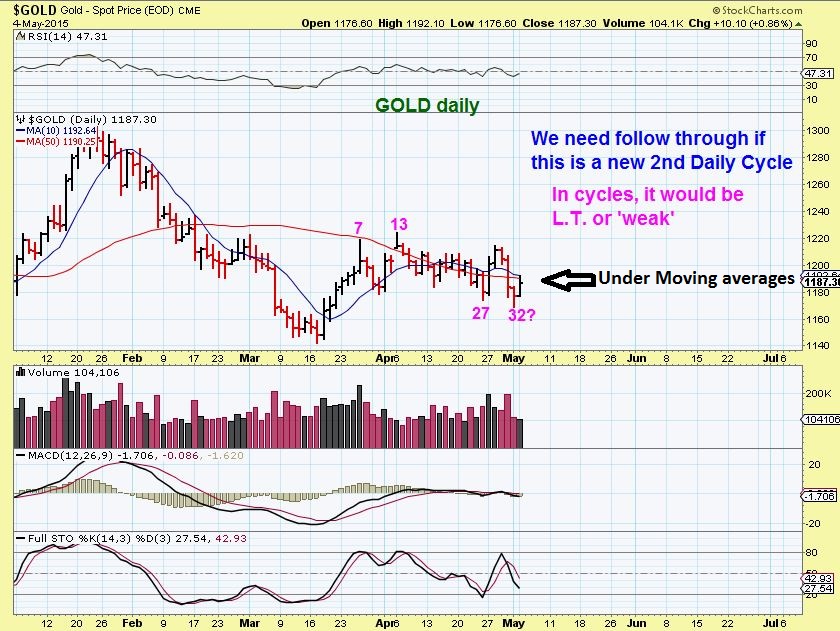
GOLD DAILY – Is that a daily cycle low? Being L.T. , it may top within 8 or so days, so lets just keep that in mind. I want Gold to at least move above its 10 & 50sma SOON.
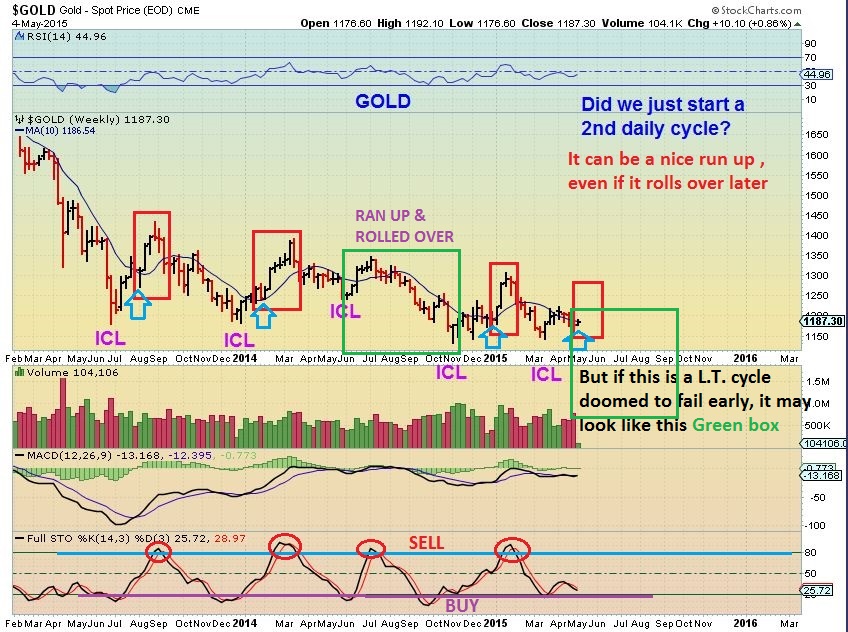
GOLD WKLY– Something to keep in mind. If this fails, it could roll over like MAY 2014 ICL (Green Box) . This is where I wonder if Miners can resist the selling like in 2001, as mentioned in our weekend report.
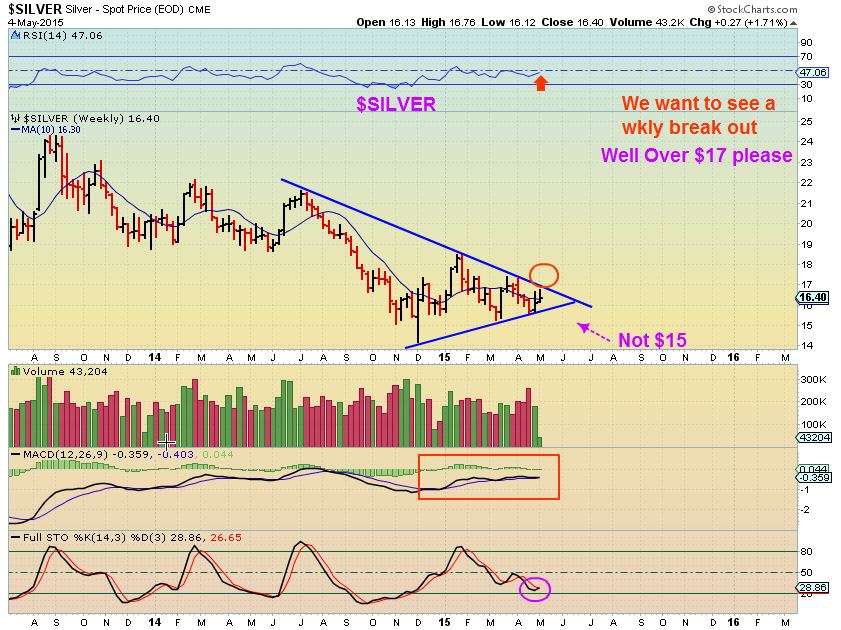
SILVER WKLY – I am watching for a break out or break down, Silver seems strong so far, not selling off with Gold. I want it over $17 SOON.
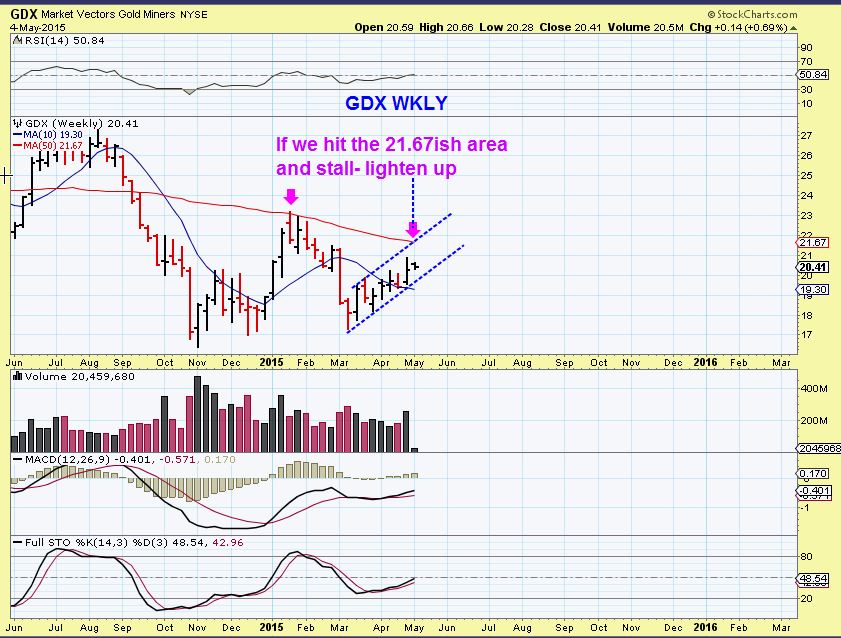
GDX WKLY– I am watching to see if GDX can reach the top of the channel and 50WMA. That might be an area to sell.
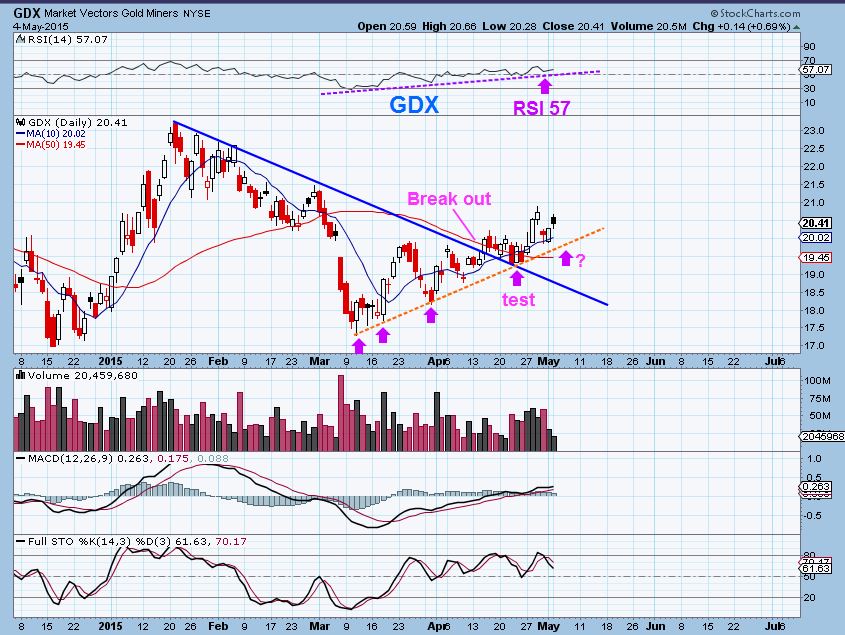
GDX DAILY – The Miners have a bullish set up (So far), I am still long. GDX remains $1 above the 50sma, RSI is over 50%. Lets see how this unfolds.
Like I said in prior reports, I see so many commodities looking like they are bottoming and being accumulated. This makes me wonder if the markets will reach their wedge tops and sell off for a bit, while money rotates to commodities.
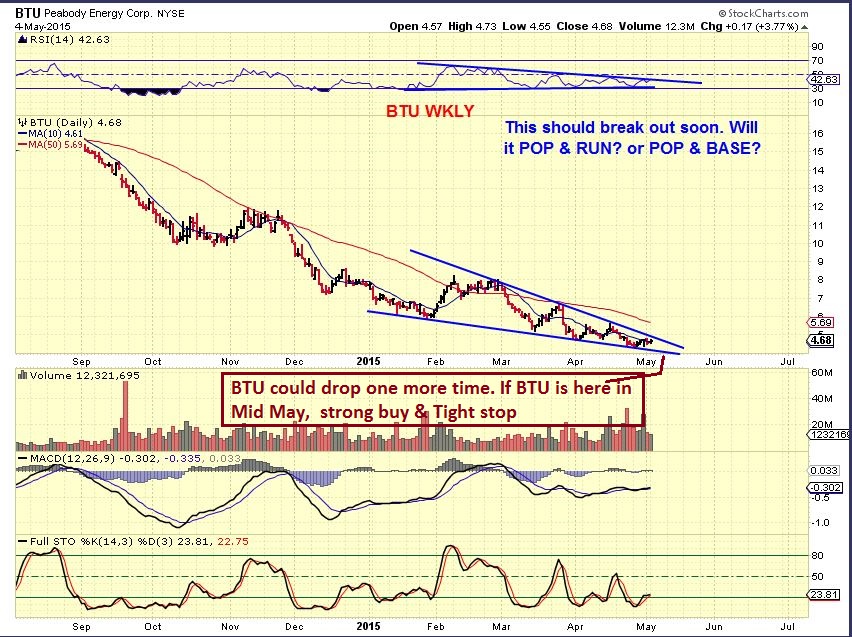
Recently I took another look at a few COAL stocks. The weekly set ups are getting bullish (believe it or not). The set up in
BTU – is very bullish. It can drop 1 more time, if it does, Its an easy buy with a tight-ish stop at the trend line.
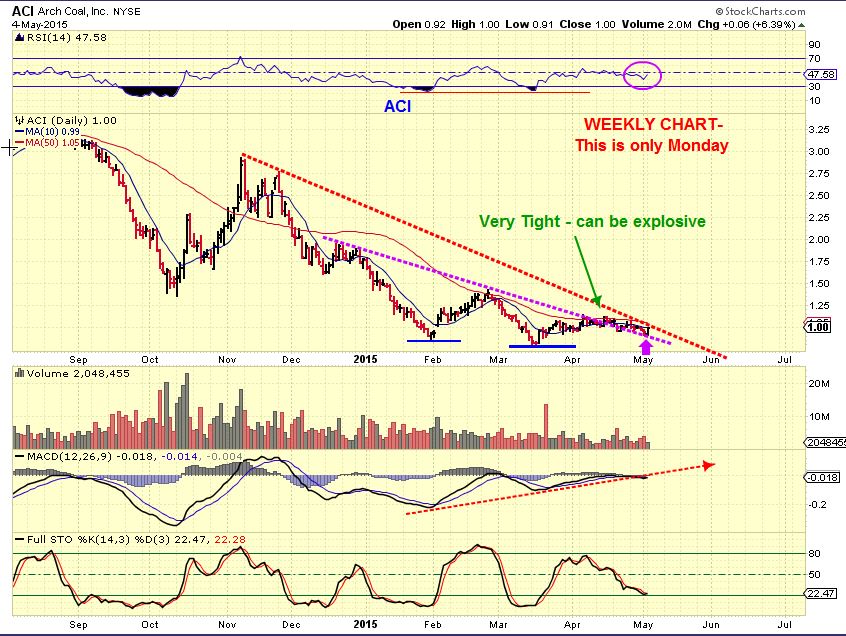
ACI WKLY- is also Bullishly setting up. ACI is $1.00. Look how easily it could run to $1.50 when it’s ready.
Lets look at some trade ideas. Sometimes at the beginning of a week, we see trade set ups that we can watch or enter that week. We have some traders here that like to quickly trade stocks or scalp possible runs higher. MOST of These are not BUY & HOLD for months. You could have done that with the energy stocks if you could handle the waves without getting sea sick. These are trades to watch daily / sell a pop / etc.
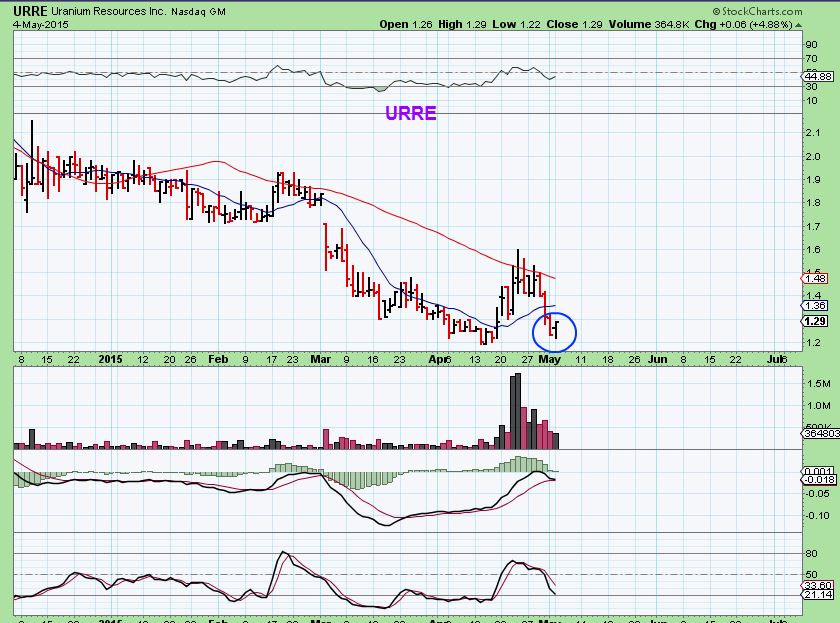
Did you miss the URANIUM run? They have pulled back and some are setting up.
URRE- seems close or ready with todays reversal. Double bottom and the MACD & RSI show divergence.
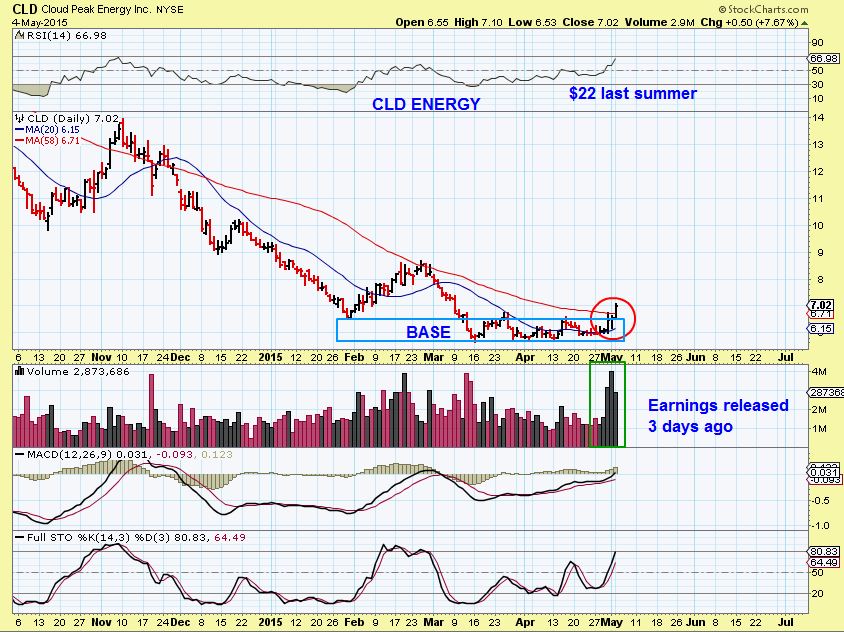
CLD ( ENERGY) – This stock was just basing out. Earnings came out and volume exploded the past 3 days. If I was going to play this I would likely take a partial position now (Partial in case it pulls back,then I would add again if the volume was light on the pullback). It should stay above the blue box now, maybe even the 50sma .
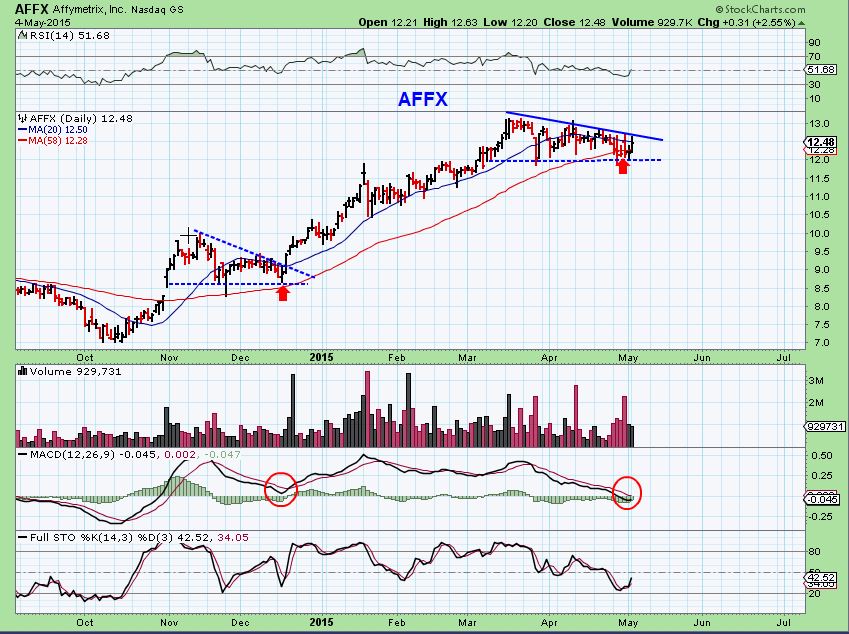
AFFX is consolidating and may POP higher soon
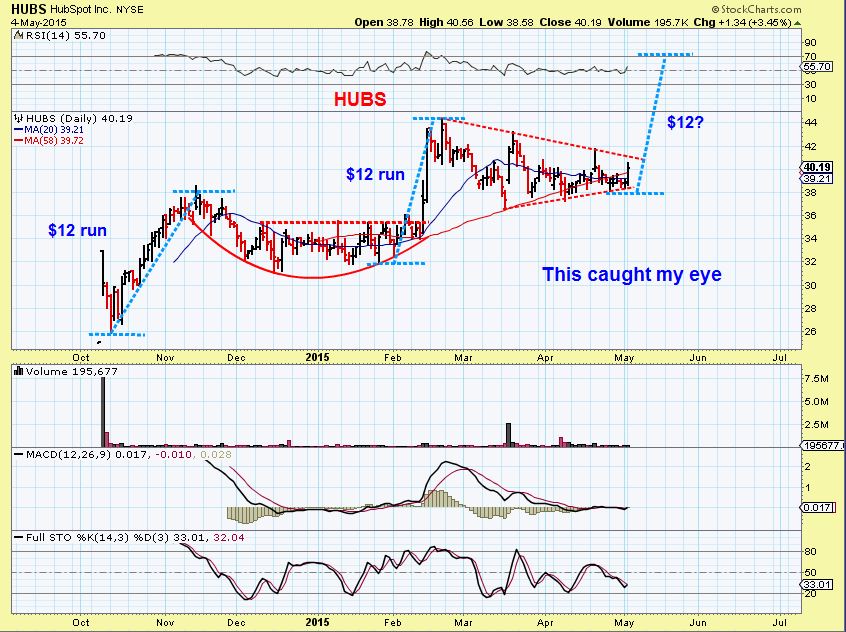
HUBS caught my eye. The consolidation is not only tightening, but it has $12 potential.
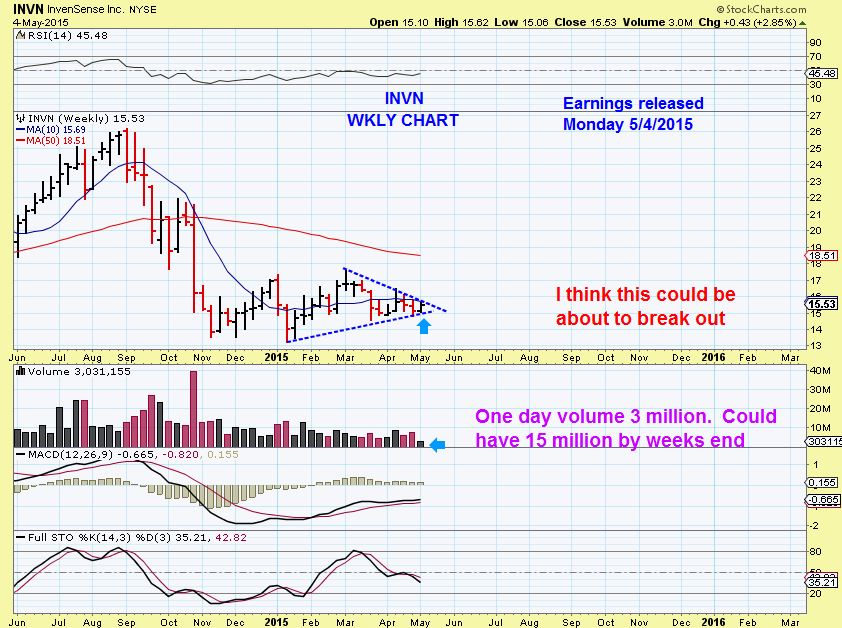
INVN WKLY- Earnings came out Monday
I also wanted to quickly mention some Miners again. I am pointing out that they are building what looks to be constructive bases. Others are already breaking out & running higher. Lets take a look.
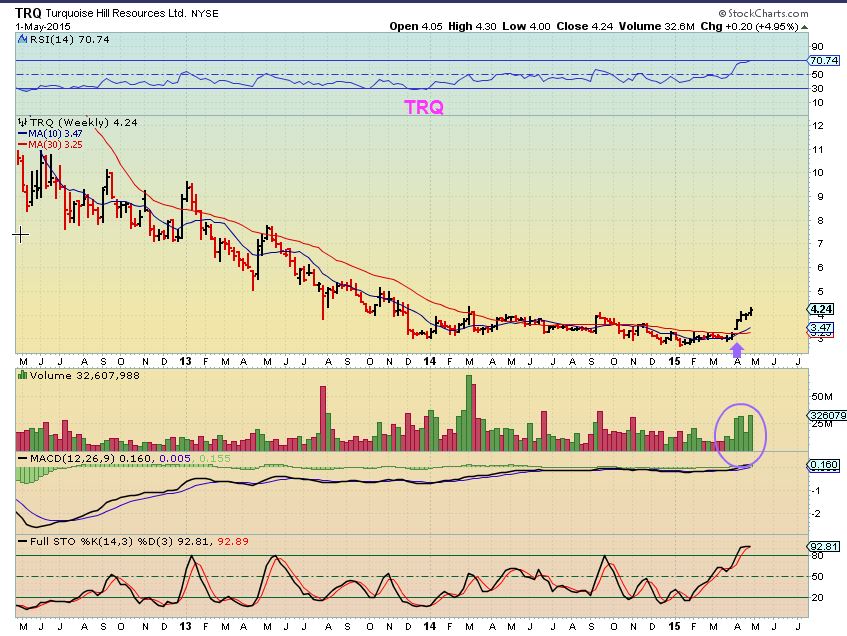
For the Big Picture- I have already mentioned that I love LONG BASES, they can really run when they get going. Heres an example
TRQ
As a reminder:
AUY – I pointed this long base out before
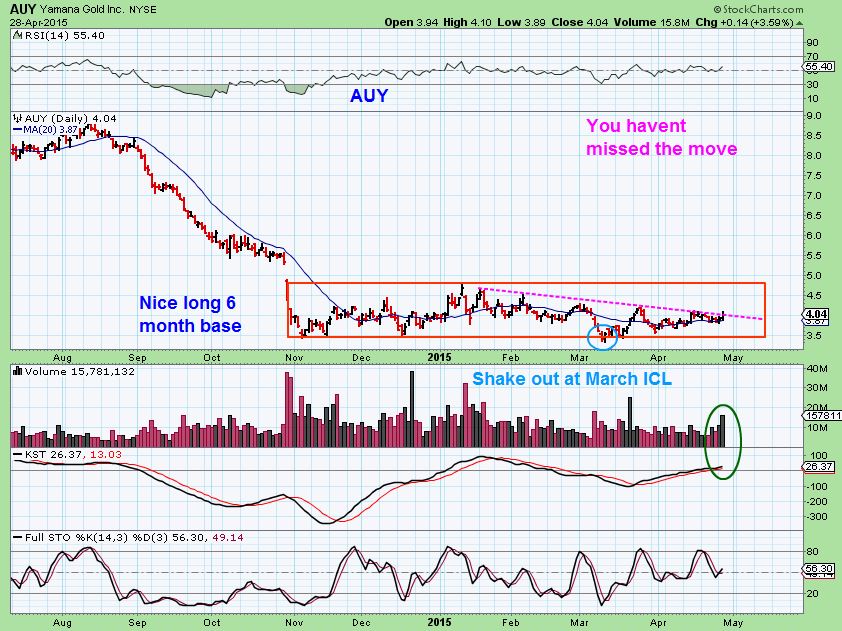
When these break higher, they have built up enough energy to just run & run, like some of our energy stock bases have. SO I think this is a beauty, especially for those that do not like to buy a stock that is under $10.
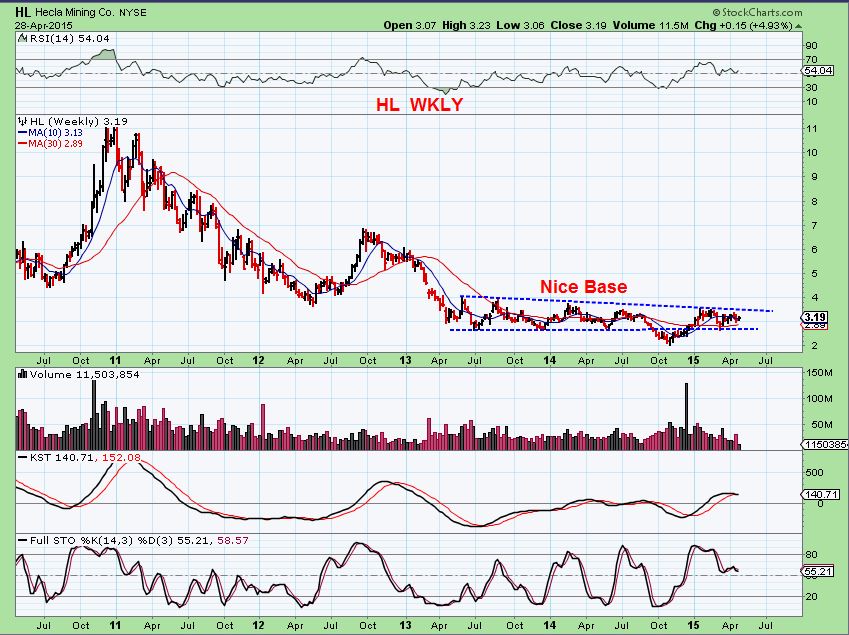
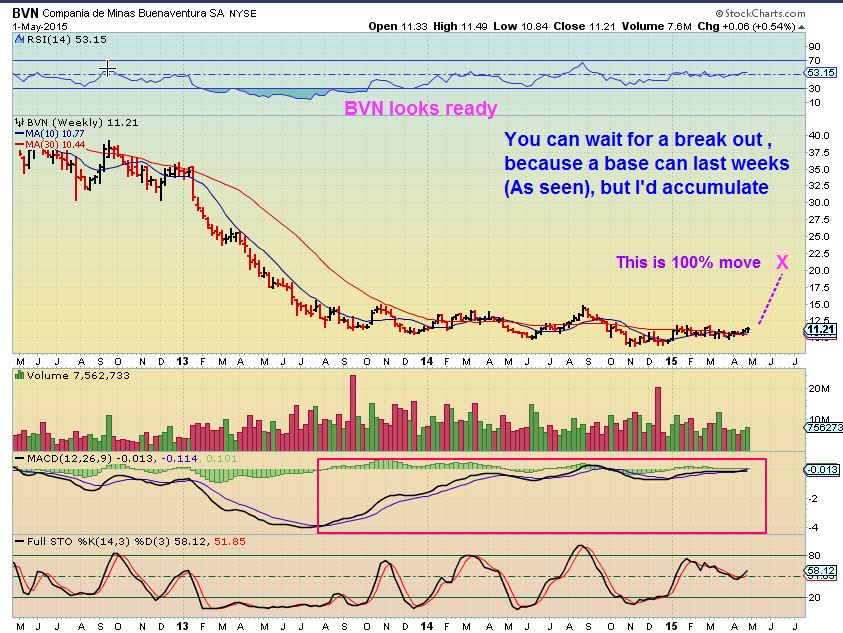
BVN WKLY – It has been in a tight range lately. Some may accumulate knowing that there will be ups & downs. Other can wait for a break out
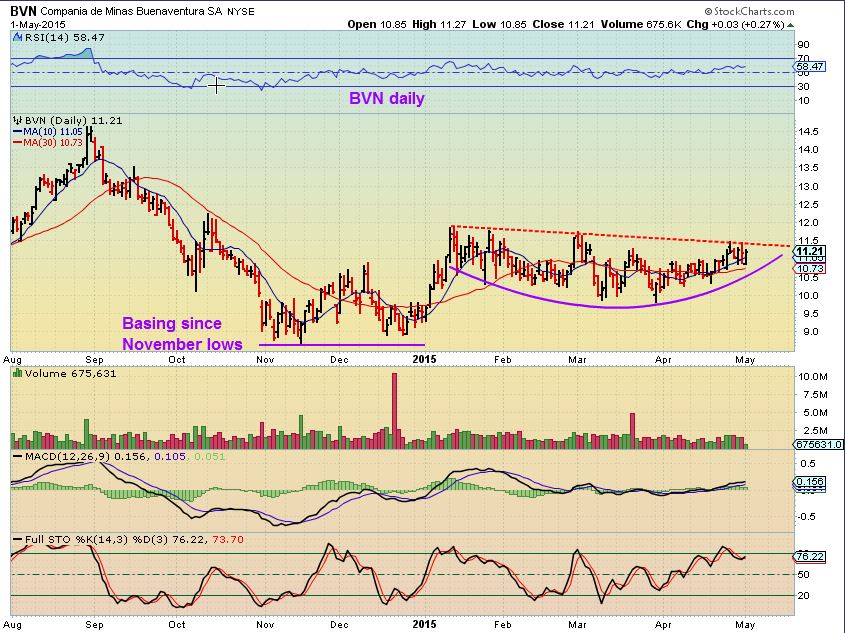
BVN Close up- it can break out now ( or above $12).
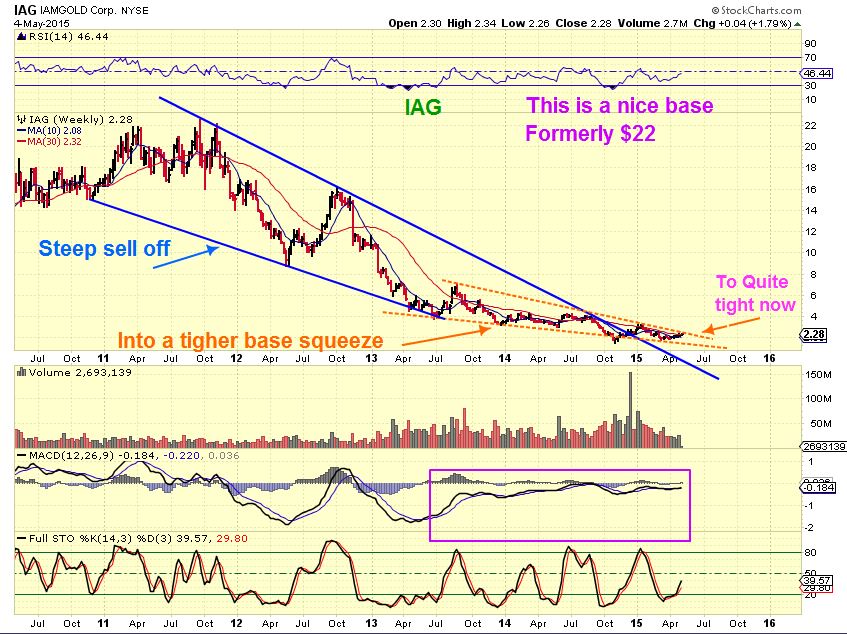
IAG is getting into a squeeze play too. Its on the Watch-list- I believe they release earnings after the bell TODAY
I am watching GOLD/SILVER/MINERS closely. I am still long from Last week, because the immediate set up is good (GDX just kept climbing with GOLD selling off. It moved above the 50sma, etc )
So those are some observations thoughts and ideas for Tuesday. I still see bullish set ups in the Energy sector, and Miners still have a bullish look to me ( but we all know that can change quickly, so Stay Frosty if you are in that sector long or short ). As time plays out that sector will become a little clearer, but I see constructive bases that have been building for months. Uranium stocks have finally pulled back , as have other commodities.
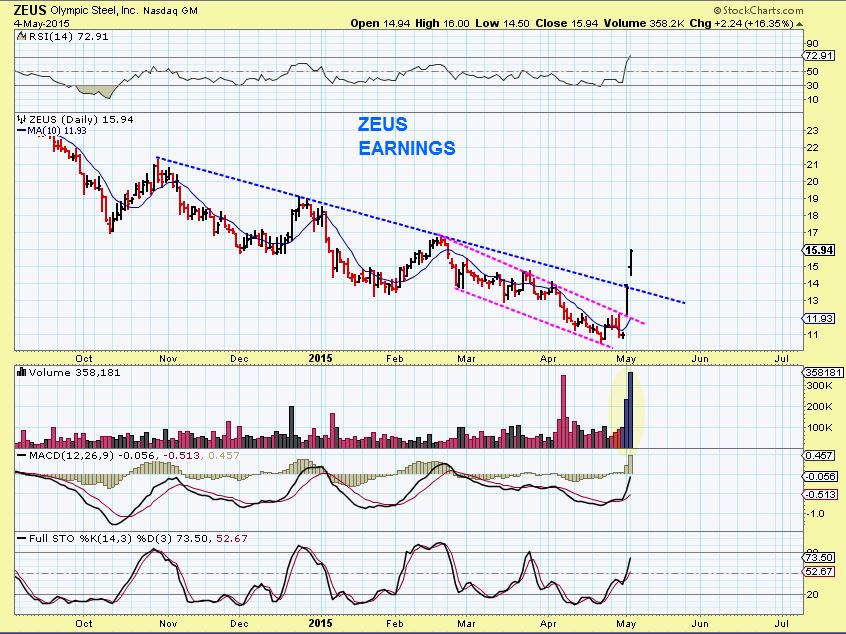
I mentioned STEEL stocks and AKS has been slowly rising on good earnings. X got hit a bit on bad earnings. Did you see ZEUS after earnings last week?
ZEUS– buy a gap fill , trend line test if we get one.

I forgot to add this chart to my report. refresh for chart of GLNG / NATGAS carrier. Bullish break out yesterday.
Too late! Thar she blows! 🙂
lol .. 2funny; HEY…… NO HAVING FUN WITHOUT ME!!!! ;o)
………………………………… It’s torture knowing the sandbox is there & not being able to play……….
What does that mean….busy at work & couldnt join in this morning?
sigh…. [nodding yes]
S missed by .01 but it’s rallied back from an initial sell off. I am long, BTW
REXX after the bell today for anybody holding that one (no position currently for me).
THX
Well that didn’t hold up. Still doesn’t look all that bad here on the daily chart if it can hold above today’s spike low of 4.91. I’m still in but that’s my line in the sand.
Alex, think it looks good diving into miners this morning with gold up over moving averages this AM? Usually like to wait for a pullback but if we are left translated, the pullback could be the end!
Energy continuing to run, have plenty of trades ready on pulback will just let KEG run higher for now.
Sprint out with earnings before bell, missed on top and bottom line but up 2% currently.
I rarely trade the 1st hr of the day (unless something is very oversold & gaps down in a sector that I am bullish on).. Too easy to get sucked into knee jerk reaction. so Its too early to tell, I like to watch the 1st hr and see if gaps fill and reverse? Keep dropping, etc
Oh yes, and if we are L.T. on the 1st daily cycle, the buy was really last week and the sell would be this week.
Ok, I got the L.T. part but I guess I always thought that 2nd daily cycle was the moneyball. If it rolls over here, that means 2-3 months of mostly (but not exactly) straight down?
Yes, The 2nd can really pop , but if it is really weak due to a first daily cycle being L.T. – then yes, weeks of downside chop is likely. The Miners that have nice bases may just drop to the bottom of those v=bases and be a buy opportunity.
I’m watching AMCC and hoping for a few days of consolidation/pull back; maybe let the 10 dma catch up and a really good buy pt.
Looks good here on the 2hr chart. At support
Hmmm, What to buy, what to buy? Choices……..
I know…I am searching and searching too. Some energy (REXX) pulling right back to gap fill. Watching that area.
Bought some NUGT. Looking for something else.
ANW might be ready. at the lower trend line.
Brazil’s launching again. EBR is up strongly after a little pull back. I’m long. SID is back to being a beast (I’ve been watching, empty handed). CZZ looks good today (no position). I’m long EWZ.
RSX too. I’m also long in non-trading acct. Stiff resistance in 21-22 area longer term. Interesting to see what it does there as short term it looks great.
Yes, I think it was Jonathan that has been bullish Brazil lately and I think he owns it.
I’m stopping out of NQ here. It had promise but I don’t like this break down, and 50 DMA is turning down.
So you may safely buy now. LOL
Well I guess not. Good decision after all.
Odd…CDTI announced that they will release earnings next week, and it took off up 40%. Did I miss something?
ALUMINUM stocks AA and CENX look good. Use a 50sma and you can see CENX hit it and seems to be coiling below to possibly break it soon
Yeah, I liked the look of CENX a week or two ago and missed that initial pop. Here’s a chart if anyone is interested…
Daily…
Longer term looks like a low risk entry…
I’ve been watching AMZG and it just launched 20%. I had almost taken a lottery ticket position but didn’t. Ah well, it wouldn’t have been much anyway as it was highly speculative (20 ct stock) but it’s sure fun to be in those when they pop.
In any case it’s one to keep an eye on as it’s got a lot of room to run if it stays up.
AMZG is a monster today. Up 32% right now on HUGE volume.
Coulda, woulda, shoulda 🙂
NBG is pulling back after hitting the 100 DMA, just as in Feb. Now may be a good entry point as it tests the 20 DMA; or wait ’till it gets back above the 50 DMA (which would presumably be sloping up at that point). Vol on pull back has been pretty low.
I’m taking a little stab at it here.
PACD looks great and of course I got stopped out of HERO & it hasnt looked back since : )
GDX looks to have sold down into a descending wedge , similar to yesterday only faster and tighter. They were gap fills. ( see click-able chart)
I expect the selling to stop for a bit , and I will monitor the following reaction. Back up to days highs? Sideways? bounce & double bottom? I am not expecting an explosive move higher, but I want to see how things look going forward , because if the 1st daily cycle was L.T., and then this is a L.T. Cycle, it should not go too much higher.
Stopped out of NUGT
I tried this morning. I think my position lasted about an hour. I gave it no room, you can’t with NUGT.
Last 2nd DCL was pretty awesome, this is certainly a pretty big disapointment.
Still in EXK and debating whether to just pull plug on it now or still allow 2nd order to fill if it falls back to support.
alex-at what price point are we looking a pull back to on NG? i am 35% up on my gains just wondering if i need to raise stops or just exit & renter-Thanks.
Do you mean a target for this pause / pullback today?
Actually , The move just started with 5 days up off the lows, so its too early for me to read it that way. It could be just pausing here? Could drop to the 50sma? It may just go higher tomorrow. Out of the lows, OIL went up for almost 7 days and then dropped to the 10sma.
Take a Look at a chart of oil, there is one in this report above. look at the green arrows in that chart . Out of the lows it actually went up for over a month, with little pauses along the way. It just keeps going higher, pause, sideways and higher, sideways, etc. .Natgas could do the same, but I dont know.
Lock in some gains? trailing stop? Ride it in case it goes higher? I cant tell you what is best, I dont know your position (leveraged or not? etc) . I think NATGAS goes higher over time, but could definitely pause along the way the same as OIL did.
I hope that helped a little.
its UGAZ -if it was any stocks like chk i wouldint worry about pullbacks..but etf wipes out most gains in 1 pull back:) i have both for a swing actually..
Well again, looking at the OIL chart in this report, we can get pullbacks like that in NATGAS too , and the first one dropped to the 10sma in 3 days.
UWTI (leveraged oil) at that time went from $2.84 to $2.17 on that pullback,but today it was 2 cents below $4.
The choice is yours, 3xETFs can rock you in both directions. I trade them if I’m not familiar with how they can move.
It’s all about position size, and risk tolerance, of course.
FWIW my personal opinion is that Natural Gas has made its lows. I am adding to my UGAZ position on any decent down move.
Oh how I’d like to see NATGAS backtest the pivot at about 2.70; also the 50 DMA there. That’s what I’m hoping/waiting for here.
Of course it could consolidate right here below 2.82ish and rocket through the resistance zone from there to about 3.00. Quite possible, so I’m debating taking a nibble here as I haven’t yet pulled the trigger at all (since being knocked out on the fake out low).
And it could pull back to the pivot at about 2.60 (currently the 20 dma) without causing terrible technical damage; although staying above the 50 DMA is much better, of course.
FWIW:
SAND is on its 50 DMA.
Warning: Earnings announced after close today.
Bonds getting pretty ugly here. I’m not sure what the best way is to analyze them; chart rates (i.e. $TNX or $TYX) or chart prices (i.e. $USB, $UST, or even TLT). I presume it’s rates, but haven’t studied that at all. Any opinions here? Alex?
I track Bonds via TLT……but buy IIM for tax reasons. (municipal bonds)
I just started building a position actually. 🙂
Now at 200MA and testing March. Could be good level to buy, with stops just below
im thinkin nadl is gettn ready to launch pdq.. what do u think coach? https://www.tradingview.com/x/rb2Oj8nC/
NADL REN and SFY kind of have that look, but I dont like the bearish engulfing candle on XLE / OIH has a topping candle, and GDX has a bearish engulfing if they close this way. SO I am kind of watching at this point, in case we get a pullback.
Then again, it doesnt seem to be affecting EOX, KEG, REN, HERO , PACD and a few others too much..
Nice chart
ok tx. will ck out when i hav a nano second ;o)
SFY reports earnings on Thurs. Debating on whether or not I hold thru that…
Always a tough choice for me too.
I usually base it on whether I have any profit. If I do & it gaps down, I may be able to still get out break even, but if I am close to where I got in, it may gap lower than where my stop was and I take a cut, so I might sell in that situation. .
I own REXX, and I love the look of the inverse H&S, but dont like the look today when it reversed. Thats a big bearish looking candle, so I just decided to sell half and see if I can get back in lower ( or maybe I wont want to). My stop was below the 50sma anyways.
Thx Alex…I’m above water, but only a few percent. Might step out and let the dust settle from earnings/possible energy pullback
Good day gone bad!