
EARNINGS!
Between the Earnings Reports last week and the FED this week , the markets have begun looking quite interesting in many ways. Lets take a look…
April 22 – I pointed out a consolidation that could break to new ‘closing’ highs in the NASDAQ.
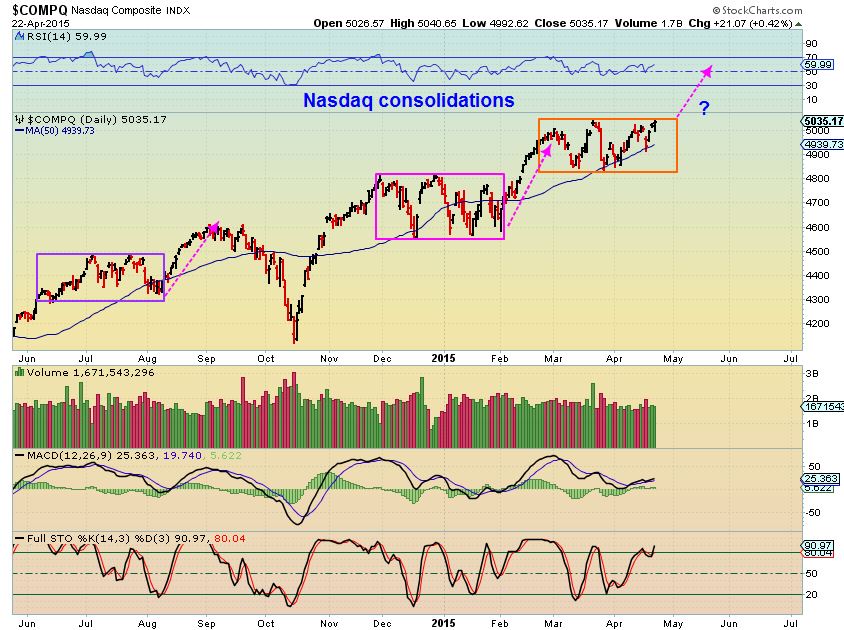
Would it Break or Fail during earnings ?
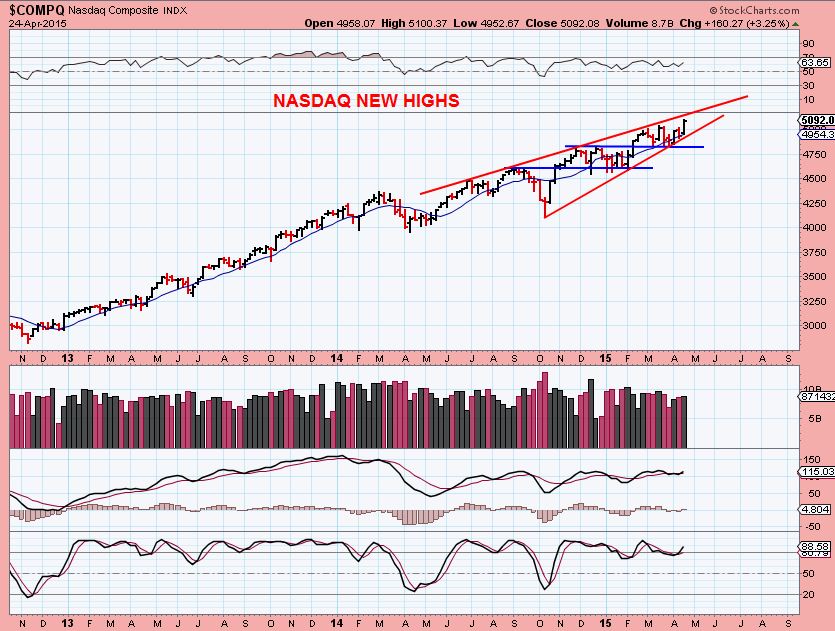
NASDAQ wkly- closed at new all time closing highs. There is a wedge that I have been watching, but there are still so many bullish stock charts that you want to lean to the long side and just stay prepared in case the wedge slows things down. I’ll show you how this wedge can be negated using the SPX ( rather rare) . lets look closer…
SPX WKLY– notice that it also has a wedge
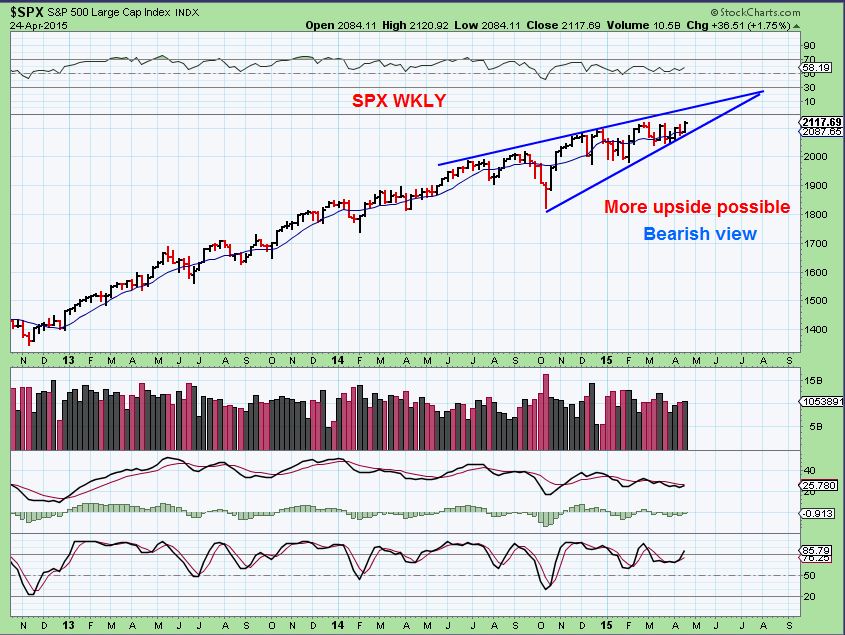
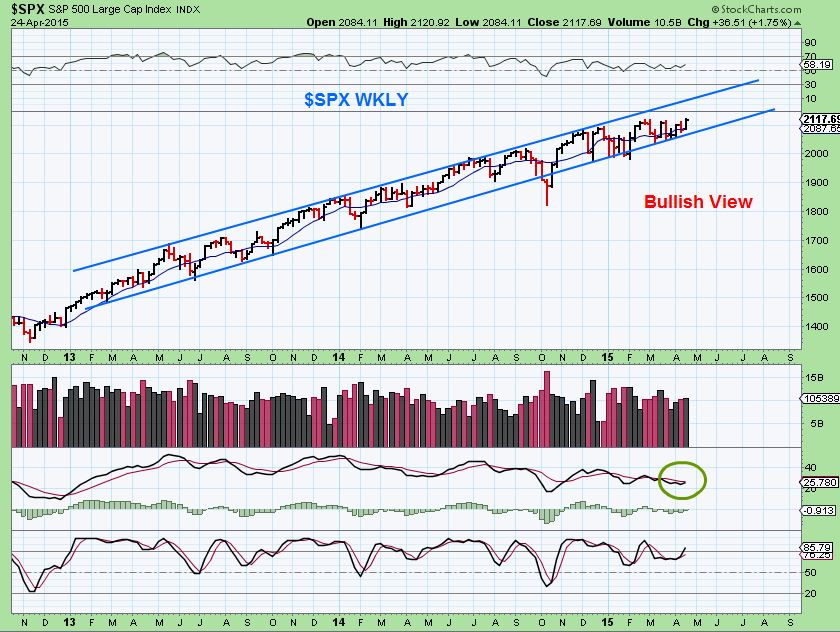
SPX – a steady surge higher , and this is how the wedge could be negated
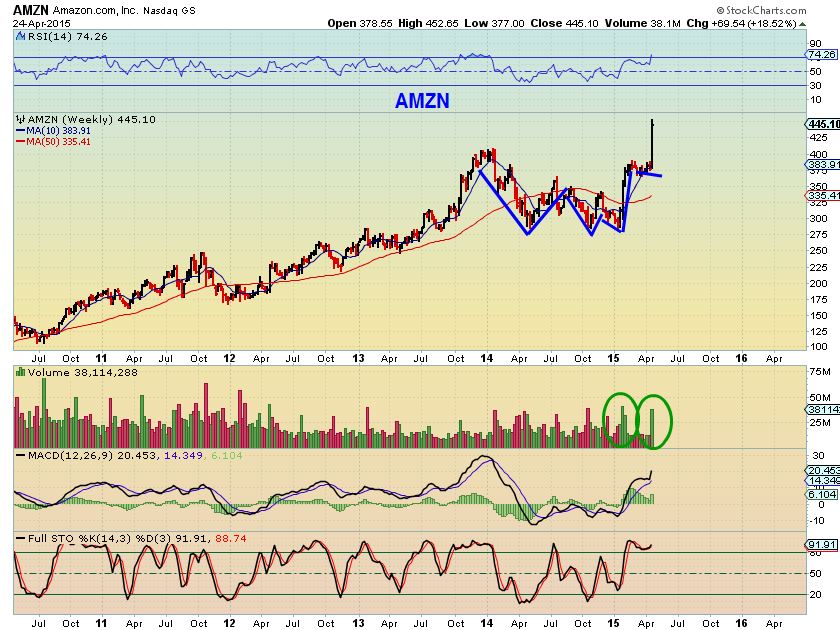
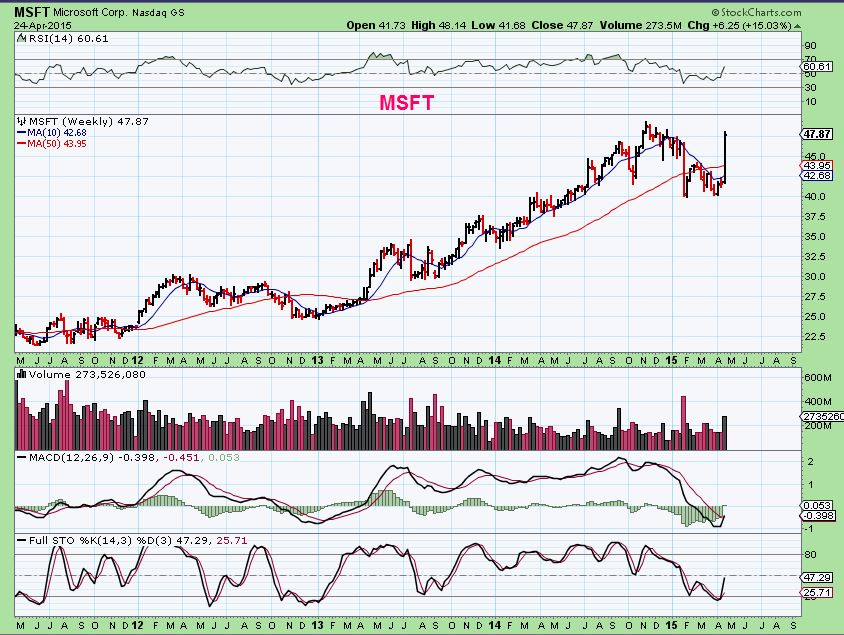
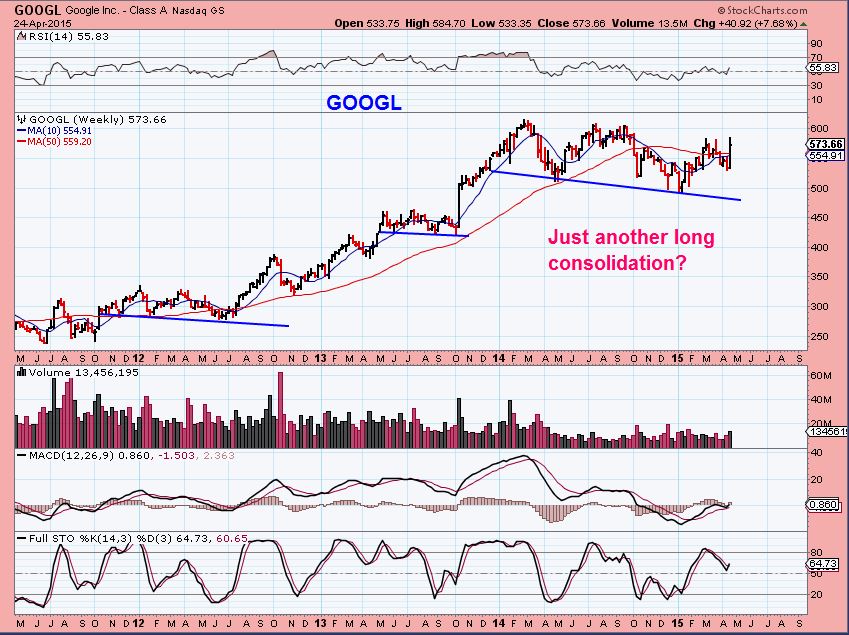
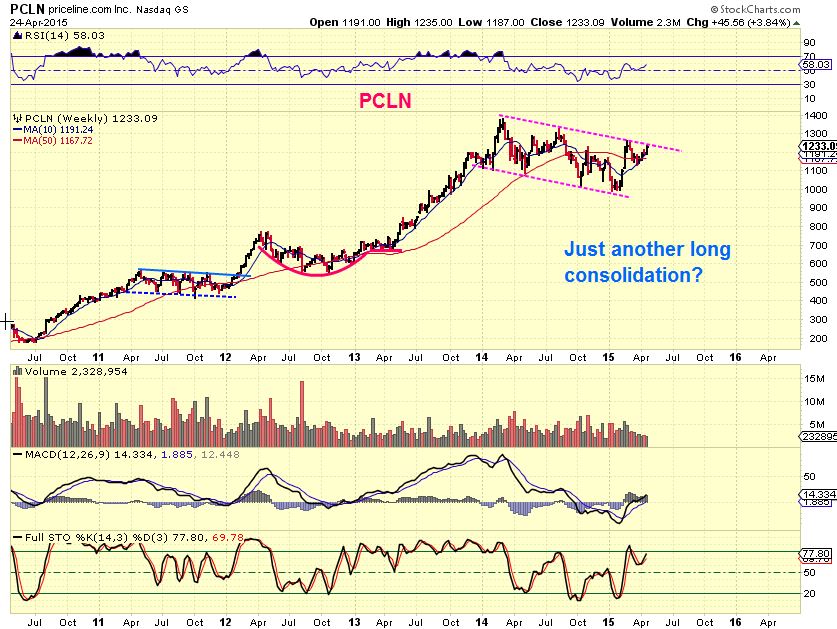
If you were here at CHARTFREAK back in JAN-Feb, I reported that the markets could be toppy, because I saw many leaders breaking down. I charted AMZN, PCLN, GOOGL, NFLX, and MSFT as breaking their 50sma and breaking below supporting uptrend lines. SO this was a warning sign, but I want to show you what happened in the quarter after earnings reports came out and so on…
NOTICE- Those companies WERE breaking down, but this is why we dont grudgingly stick to any bias. They are now recovering, the break down became a normal correction. GOOGL & PCLN have 1 yr consolidations and could be a longer term BUY & HOLD if things play out.
If things just continue as is, the markets could be heading for a parabolic or “blow off top” type move. We definitely need more time to see how this wedge plays out, but there are MANY bullish set ups out there. I also pointed out the recent break DOWN in housing stocks last week. Is this a warning of a toppy market, or will they just consolidate as other stocks (plus commodities) just carry the markets ever higher? SO MUCH to watch here!
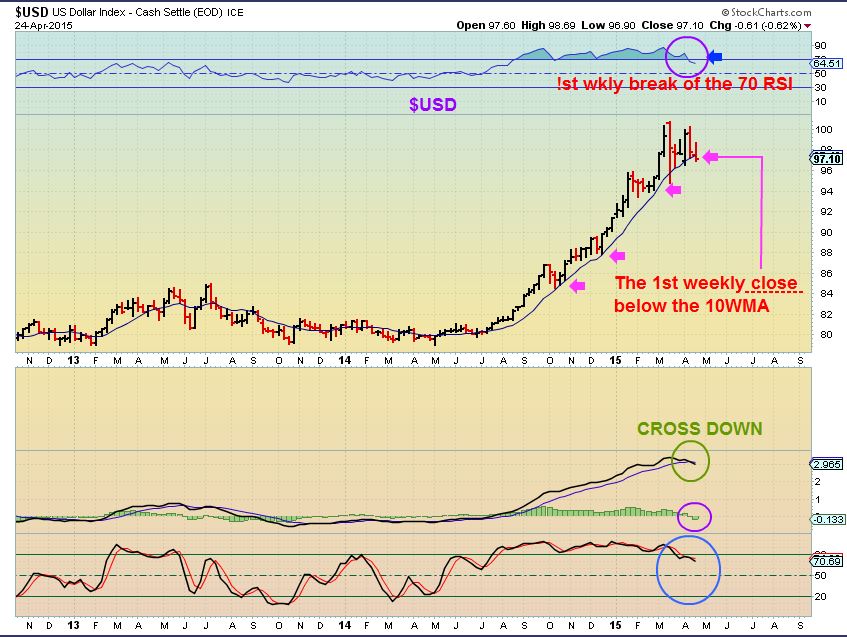
That said, The markets ran up with the $USD running up , and commodities crashed. Now the DOLLAR looks toppy , and for the first time in a LONG time, it has broken a couple of technical bullish indicators on it’s weekly chart. Some are shown below.
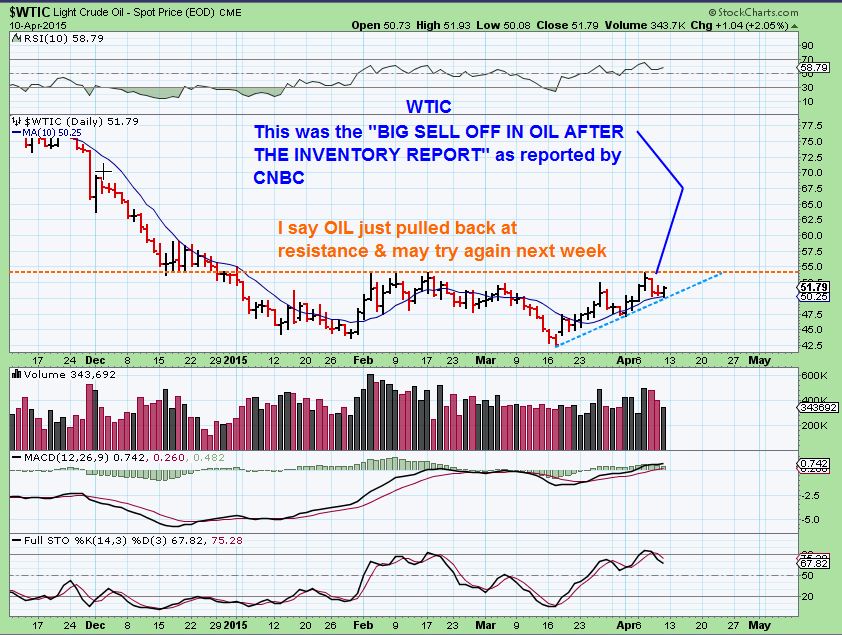
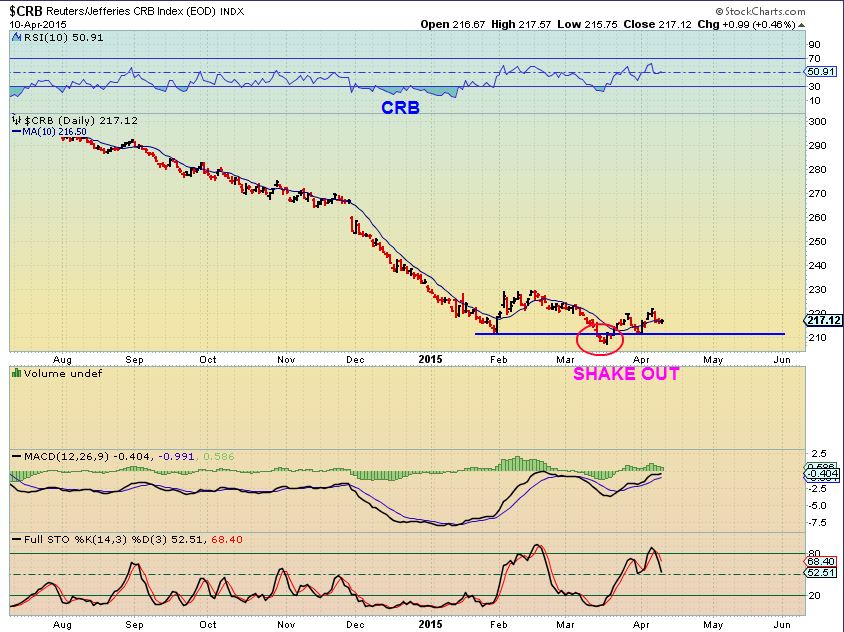
So the question has to be, “If the Markets ran up with the dollar and commodities crashed, will commodities now recover as the dollar dips?” So far this has started to occur in the $CRB, DAG, $WTIC, $SUGAR, SOLARS, etc. Many have double bottoms, shown below. This could have implications for GOLD/SILVER/MINERS too.
$ WTIC & CRB APRIL – double bottoms
We have seen many ENERGY stocks recovering, and I’ve pointed out the set ups or run ups occurring in Rare Earth, Uraniums, stocks like VALE, CLF, etc., so I am watching for Metal / Miners to put in lows soon too.
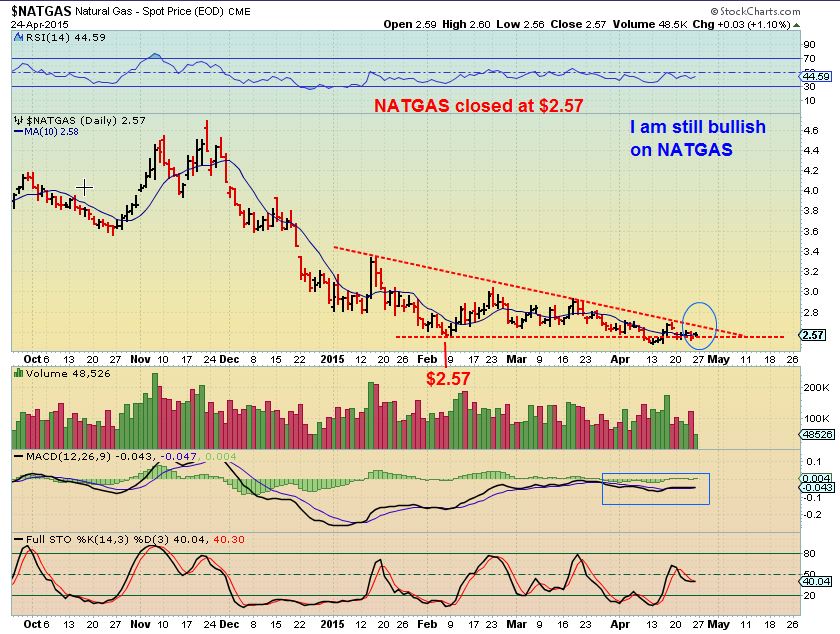
$NATGAS- I have been expecting to see a possible double bottom form. It still looks bullishly set up for a double bottom to me, but I need to see a break out above this triangle upper trend line to confirm , before I begin trading it.
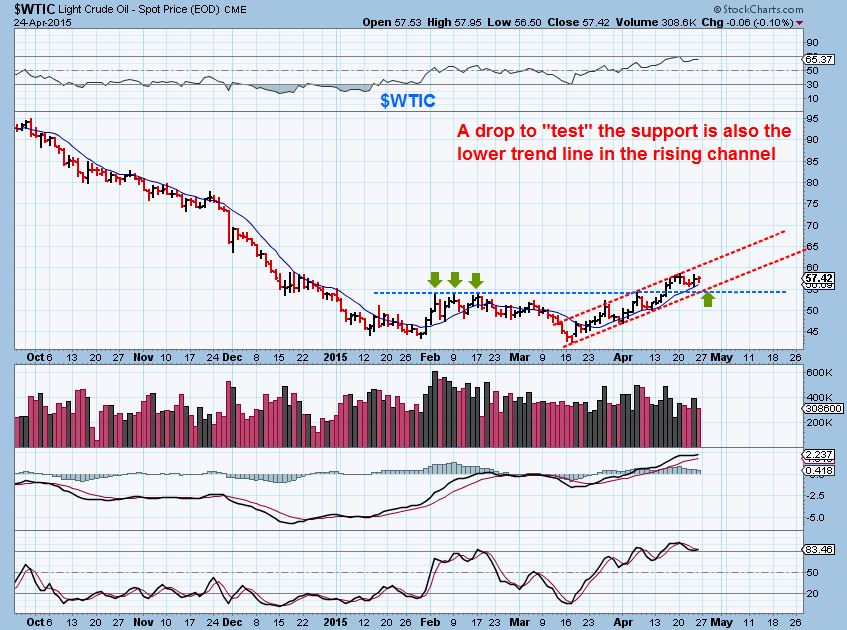
$WTIC – Acting as expected. It could drop & be just fine.
GOLD/SILVER/MINERS
The way I am looking at GOLD, it is getting late in cycle timing and I think it is a bullish set up. This is especially so if you look at how MINERS are holding up with Silver almost at recent lows. Bullish for Miners. One of my Cycle analysts is counting it very different and has a bearish break down possible in the works, so I am ‘Cautiously Bullish”.
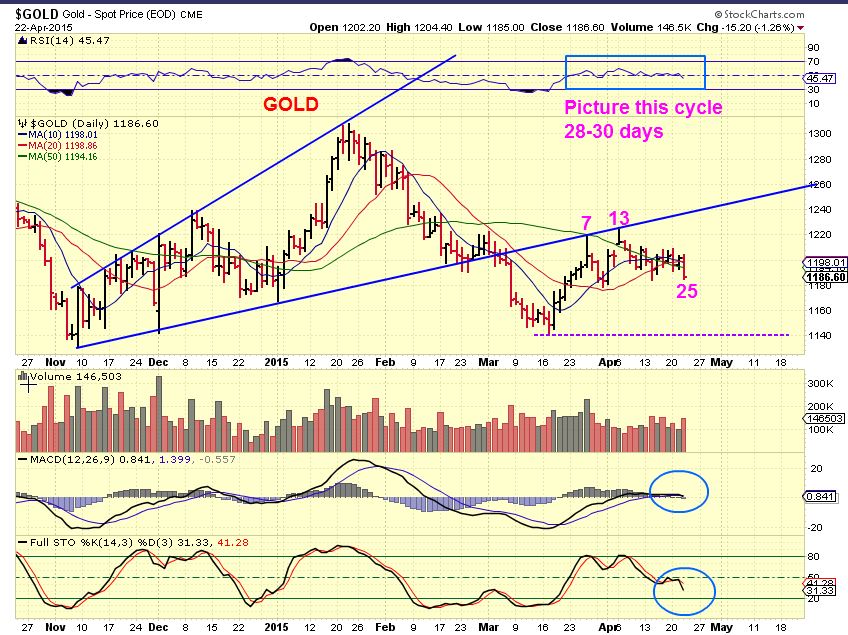
This is my GOLD 4-22-2015 chart. I placed us on day 25 – Some Cycle guys have said that there was a DCL on the APRIL 14 dip (day 19). That causes a cautious outlook, because we would be on daily cycle #2 . I never stopped counting us as still being in the first daily cycle, which would have Friday as day 27. Look at the ‘movement’ in the Nov-Dec first daily cycle. I wouldn’t have counted the drop Dec 1 as a dcl either.
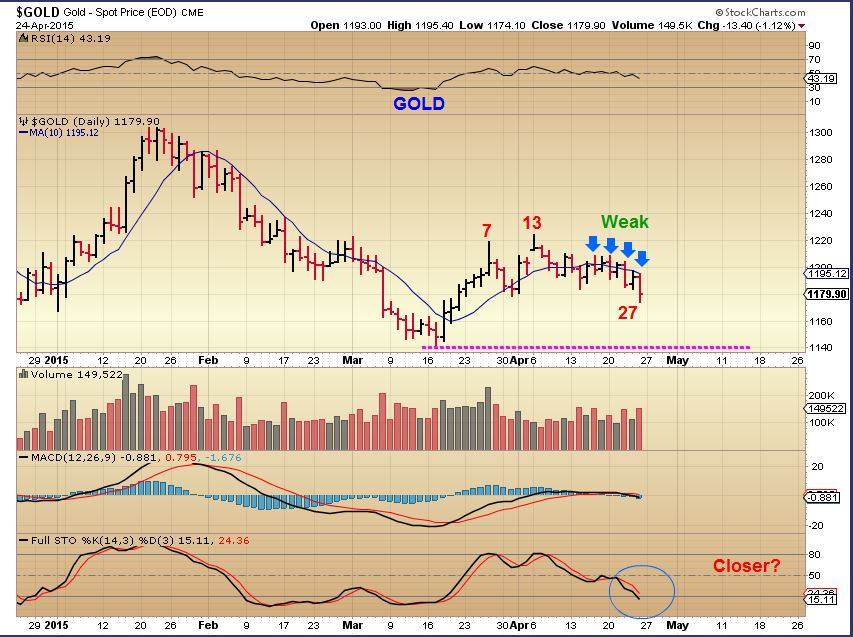
Gold now – IF you counted Day 19 as a daily cycle low, we just broke below it Friday, and that would be a bearish break down on a 2nd daily cycle. Right now I see Miners in a bullish set up and thus think that GOLD is likely on day 28 today. That is in the timing for a reversal higher. I dont want to see the magenta line broken.
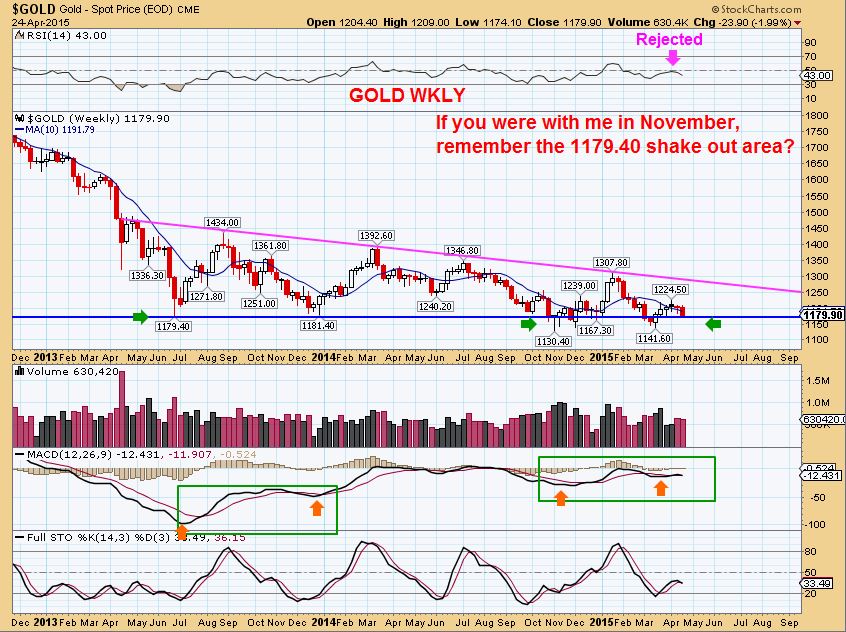
GOLD WKLY- using Technical Analysis ( T/A), it is a Long Base at this point.
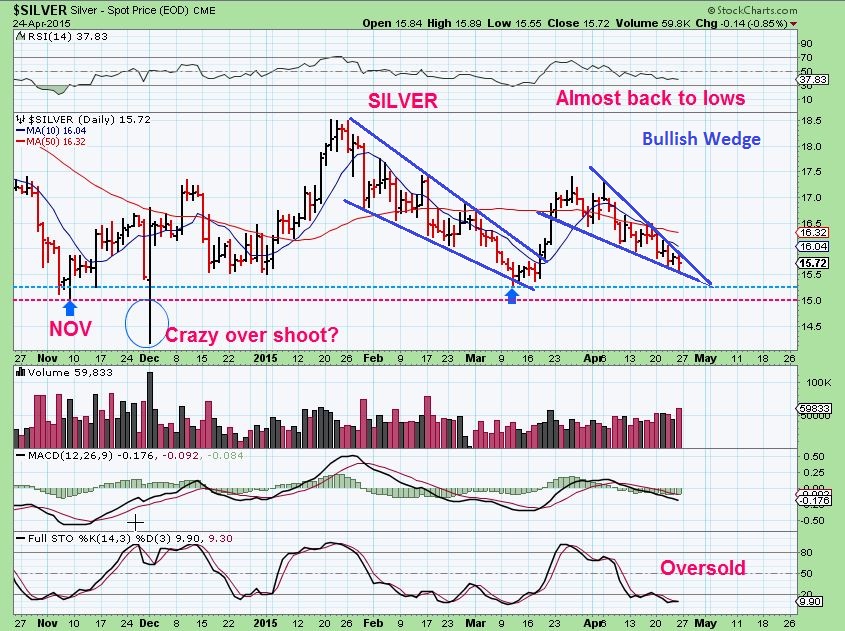
SILVER _ has sold off almost to recent lows. I have seen traders in other blogs trying to jump the gun and buy SLV. Using T/A , it is almost time if this wedge breaks out higher. We should break out higher soon, it is an oversold Bullish descending wedge.
So This is my personal thinking :
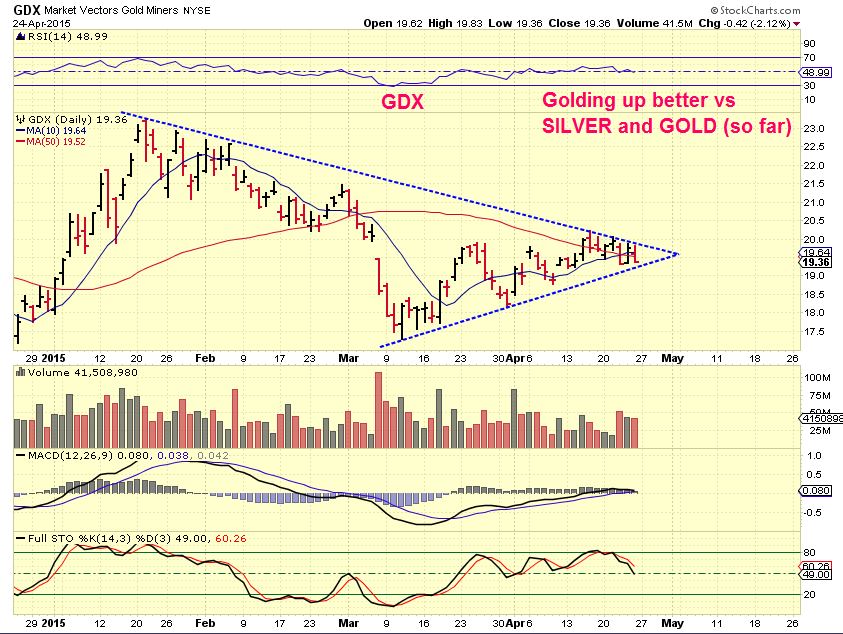
With GOLD & SILVER Selling off, Miners have not – Thats Bullish for Miners. I think Some (selectively) are at a buy point for those in front of a screen that want to accumulate positions. If the metals start breaking down to new lows, you would have to watch them closely. I see the CRB, OIL, DAG, Solars , ( URANIUM STOCKS, RARE EARTH STOCKS are rocketing ) etc. bullishly breaking higher. These are all acting bullishly, so that adds weight to my thinking that Miners will move bullishly soon, too. I like the set up on many miners too, so I am going to watch them closely.
GDX– please excuse the typo on the chart. “Holding ” up better…
SO basically, We are seeing many commodities bottoming and breaking higher. I would expect that NATGAS and the Metals /Miners would follow soon . NATGAS can march to the beat of its own drum, but it did do a 5 wave move down and so I would think that the move down is about complete. I expect Metals to start climbing too, I am just waiting for signs there. Looking at UUU, URZ, URRE, UEC – Those may become Buy Set Ups as they pull back. Look at how the Rare Earth stocks surged like Uranium stocks have ( MCP, REE, AVL) , and then notice how they pulled back. You may see something similar in Uranium stocks, that can help you find a good entry .
As for the Equity markets? This is a FED WEEK. Tuesday & Wednesdy the Fed is active, so be prepared for that. So far the Markets look Bullish as the have been breaking to new highs. I ‘ve been showing that in The big picture there are wedges that I am watching, Housing stocks got slammed last week, so there are cationary notes, but at the same time many other stocks like MSFT , NFLX, AMZN, etc surged higher from consolations.
I see so many good trading set ups that ‘traders’ can do well in this environment. I’ve mentioned VALE, CLF, X, SOL, AKS, S, NQ, , Energy stocks, Solars, and many more. Some of these exploded, others still look good, they just take more time. I hope this report helps you in your analysis, there are a lot of opportunities now & in the near future the way things are lining up. Fed Week, we may see an end to the sideways chop in GOLD/SILVER/ MINERS. YAY !
Have a great day.
~Alex
P.S. Just a note: In Thursday & then Fridays report entitled “WATCH LISTS AND SET UPS” I gave a list of “interesting stocks” and mentioned that some were good set ups, others go on a watch list to buy the pullback etc. SO they weren’t all automatically ‘BUYS’. For experienced traders here they were set ups to check out going forward.
I will re-post that below by copy/paste …
I think all of the things mentioned in prior reports remain bullish. SOLAR stocks are trending higher (SOL TSL,JKS, JASO, etc ) , STEEL stocks look very good (AKS- X-STLD) . I like VALE, CLF, . S (Sprint looks like it finally wants to break out )along with NQ . Uraniums are on fire along with Rare Earth.
If you have time and like to just run through charts, please look these up. I have been interested in these as a trader. Some are set ups, others are set ups mentioned here now breaking out (Those go on a watch list to buy a pullback). I wish I had time to draw up all the charts for you, I have been a little under the weather since yesterday.
.
SZYM, VALE,CLF, UUUU, SXC, EJ, S, LEJU, AMZN, ANY, STLD, X, AKS, PANW, TSL, SOL, FIVN, ( Remeber SSNI? I bought & got stopped out immediately, it is now at recent highs  JMEI, UNXL, ARWR, SXC, LPI , ANW, GNE.


FWIW I have gold either on day 28 or day 1 if this turns out to be the cycle bottom.
Check out this chart. What are the odds the nasdaq pushes through that 15 year resistance zone for a sustained move on it’s first try?
I believe today may be the start of the next leg up in Miners.
For the NASDAQ – Odds are more like 50/50 that NASDAQ could push through and continue higher. It doesn’t have to, but it doesn’t have what people perceive to be strong 15 yr resistance. It is more of a “perception” of resistance, In my opinion.
Picture it this way- The resistance at highs in a stock is former top buyers dying to unload at break even .
What are the chances that 15 yrs ago people who bought the one time top of the Nasdaq are holding waiting to sell? It’s more a matter of ” Did the Nasdaq get overbought here on a weekly on the way to former highs? Or has it consolidated enough on the move higher to be able to continue to move higher into May?”
Definitely a percieved resistance, similar to $50 in silver. Obviously there were no silver buyers from 1980 that were still waiting to sell but silver did fail to beak through that major resistance level.
I’ve heard a lot of pros talking 15 year resisitance on NAZ, but the idea that someone was invested simply in the underlying index that whole time and now wants to get out at breakeven plus 15 years is silly.
Yeah, I’m no cycle expert but it seems a real stretch to call Apr 14 a cycle bottom. Barely a bounce there. Things lookin good this morning!
Except for NatGas of course. Ugly.
It’s starting to seem like natural gas has no bottom.
Go NBG…
I was looking at Greek stocks and there is actually one called Greek Organisation of Football Prognostics (GOFPY).
FCX is another one to watch with CLF, VALE
Taking off nicely after textbook bounce off 20/50
Add JOY to that list as well; in the same sector. Up big today and one to watch as/if commodities do indeed really get up and go.
Alex, I still own a little REXX. Any thoughts? It looks headed back down to its 50 day SMA. Thanks for any thoughts you may have.
It just ran up $1.20 , so it is consolidating. Cant tell if it’ll tag support at the 50sma and 20sma ( they are below & together) or just go sideways. Normal movement, but as you probably know, these acn go sideways for short or longer periods of time.
6 month chart, Inverse H&S?.
SCHN is a steel stock to watch for consolidation and/or backtest of the 20/50
Stopped out of NADL. That one didn’t work out. My stop on GDP is getting close.
Nice timing Carl! I looked at it when you wrote that and it wasnt down much. Now its down quite a bit.
Yeah, I’m stopped out as well. DNR too, on Fri. SD getting close.
Stopped out of WRES & SD now too.
Stopped out of SFY today. Stop have KEG and UWTI but not a lot of room. Also stopped out of FEYE, but I had a tight stop intended choke it out of NAZ reversed. I did end up post. on both positions though.
Add me to the list of being stopped out on NADL.
AVL moving today on very heavy volume:))
Yeah, I liked that set up, but havent caught any of the rare earth move : (
You’re not alone. Ah well, you can’t get them all.
REE hasn’t joined the move yet. Wonder if it’s a laggard (buy) or a loser (ignore)?
It just had a bought share offering on Friday that has held it back a bit. I like it.
Yeah it seems to holding up well here; bouncing from the 20/50/200 confluence and staying above so far. Interesting
BAA is a miner (penny stock warning!) setting up nicely.
SID (Brazil steel co.) has been on my watchlist. And it’s blasting off (without me), but one to watch if Brazil stocks consolidate/pull back on this surge off a bottom.
I still own EBR and a bit of EWZ here and I like the way EWZ is holding up while ST overbought; so far at least. Running into resistance at 38 so it’ll be interesting to see how it handles that. May go to the 200 DMA before any serious pull back but that’s quite speculative right now.
I’ve had a couple miners on my watch list…waiting to buy at the next DCL….big move today….should I wait for a pullback, or buy now
I dont know why, but I didnt get any of these comments until just now . I usually dont have to refresh unless there is a chart attached. Sorry.
You still think tomorro at the open is good?
These 2 charts look a little closer to what I expected a week ago . Wedge pattern in NASDAQ ( so looking at TZA 3x Bear ) and a DCL in Miners (Sil shown)
REFRESH THIS FOR YOUR BUY SIGNAL ( I’m kind of kidding, kind of not : )
.
Names have been changed to protect the innocent
Bueno, need more like this. FUEL!
This type of stuff is GOLD! (pun intended)
lol
If we do have the “all clear” for miners, I like look of EXK (amongst others). Question: should I wait til it closes above the 50 day?
I tweeted this earlier
I think anyone could buy the wedge break or the 50sma break & Close. Just know your stop either way,
Hi Alex….. where on your web can I find this? (tweeted)
Its on Twitter. If you dont have a Twitter account, they automatically post at the top of this page too . Scroll up to the top and look in the right hand column. Its right across from the first chart. Click on it (but you dont get an alert, unless you sign up on Twitter for one).
If you are on Twitter, I’m at @chart_freak
.
.https://twitter.com/chart_freak/status/592765393363738625/photo/1
Yep Alex…. I found it.
Thanks.
Oh shoot!…you did. Sorry about that. 😉
Sorry? It shows we’re on the same page….Its a good thing! : )
It is!…I’m actually quite proud of myself haha!
[me signing&making dancing circles with my hands] .. go eric …. gooo eric, it’s ur birthday, hava cupcake … ;o)
LOL- Someone had a good day!
Haha! “thank you, thank you…” *me waving and blowing kisses to the crowd*
:o)
That huge explosion you heard earlier today? That was the bio-tech bubble bursting. Party is over!