
Watch Lists and Set Ups
First, I apologize that this wont be out before the market open, I think I had food poisoning last night and it was a rough ride. I am looking at the markets and stock set ups that have been discussed and wanted to just review a few things to watch for going forward. We’ll start with our market recap ..
SPX futures are down as I write, but there is still upside possibility short term, if this breaks out.
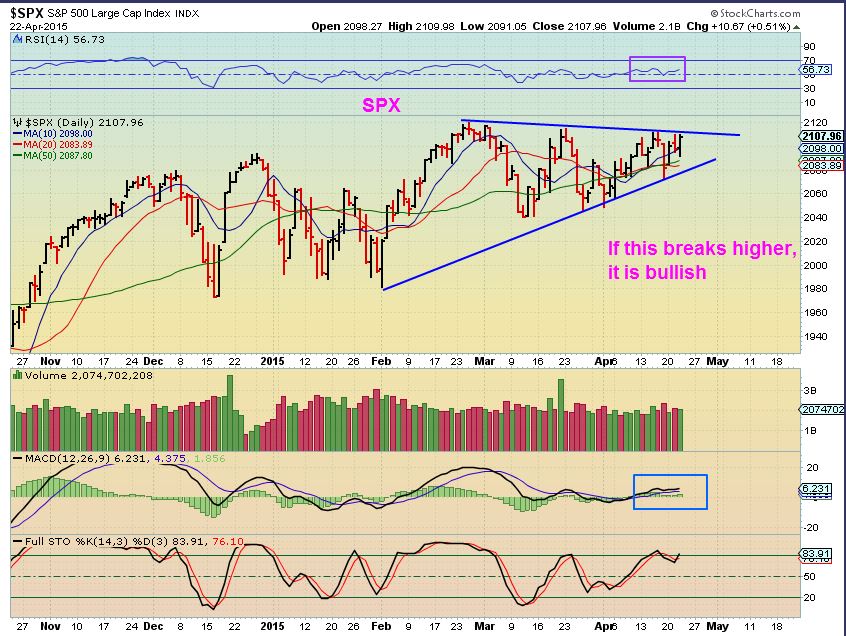
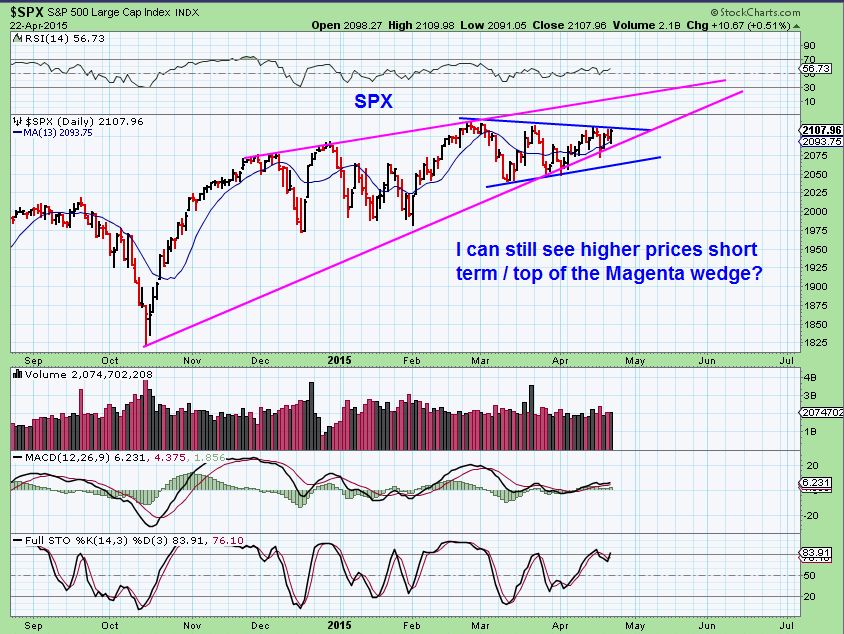
That being said, there is still this reminder…
The Bearish Rising WEDGE is still in the bigger picture , so upside may also be limited.
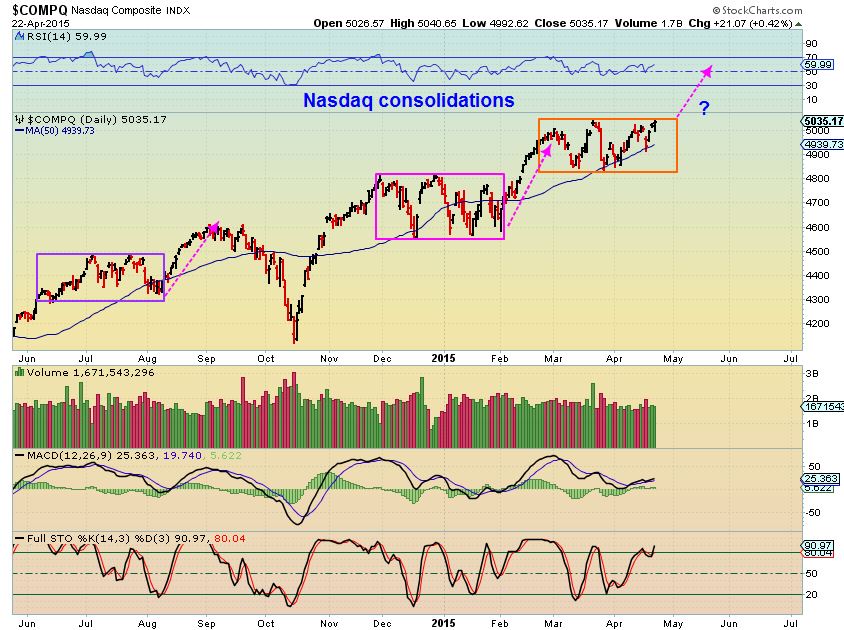
NASDAQ – notice the consolidation boxes, then a run higher. Please notice that after each run higher, it rolled over. That is why I am watching that wedge as a top (shown in prior reports).
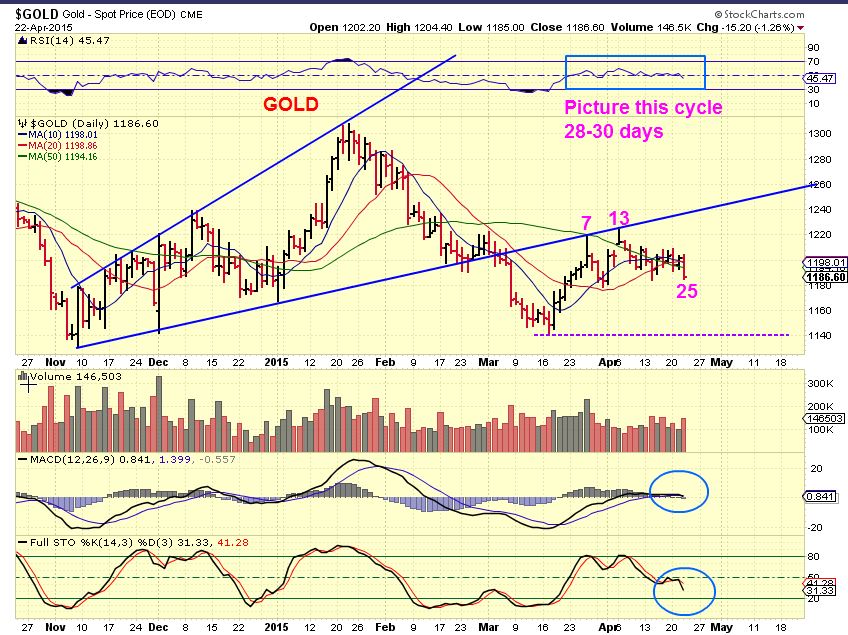
I posted this chart on APRIL 10 for GOLD. It cautioned that we might just be doing a back test of the yellow line and then a rounded top / drop. The drop would bring us to a good buying opportunity.
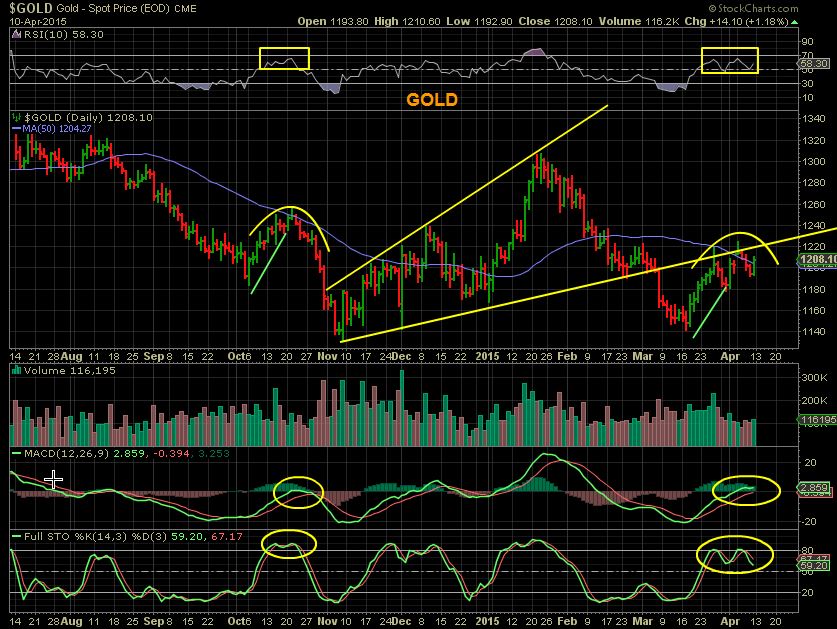
GOLD April 22 – we have gone sideways and may be starting the drop into a Daily Cycle low. If gold is on Day 25 , the cycle length can be anywhere from now to 30+ days. I want to see the purple dotted line hold to show that March was the ICL.
APRIL 9 – I pictured GDX popping up to tag the 50sma, then drop. I drew this & cautioned not to buy GDX unless it closes above $20
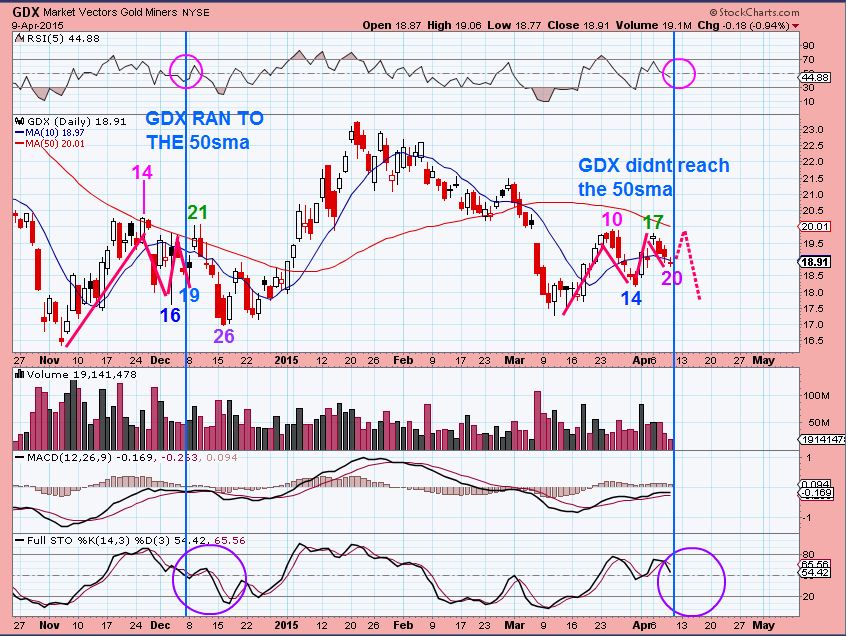
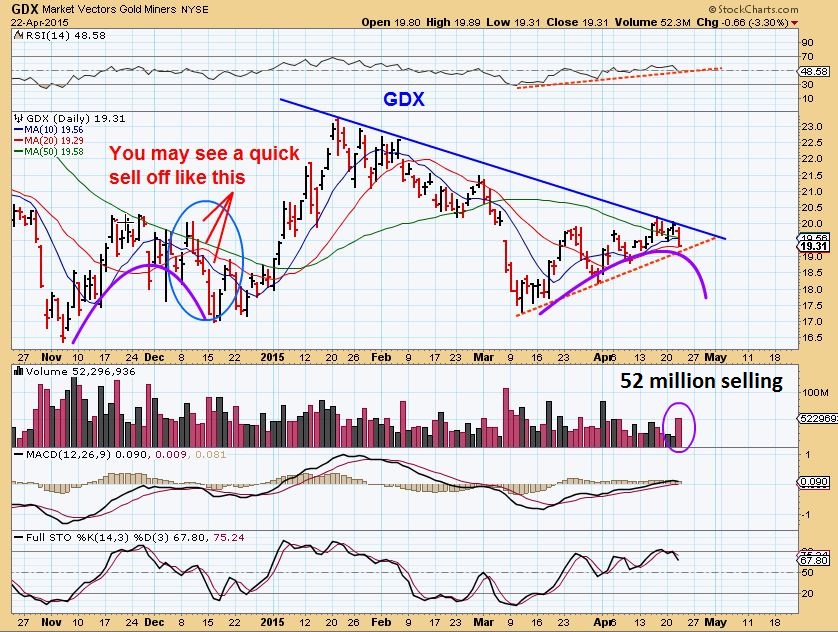
So far, GDX has done that. Tagged the 50sma near $20 & dropped. It could drop further, so I am not buying the dip until we get a reversal.
OIL & NATGAS are the same as yesterdays report. I expected a back test from OIL , and our energy stocks are consolidating recent gains / basing out / etc.
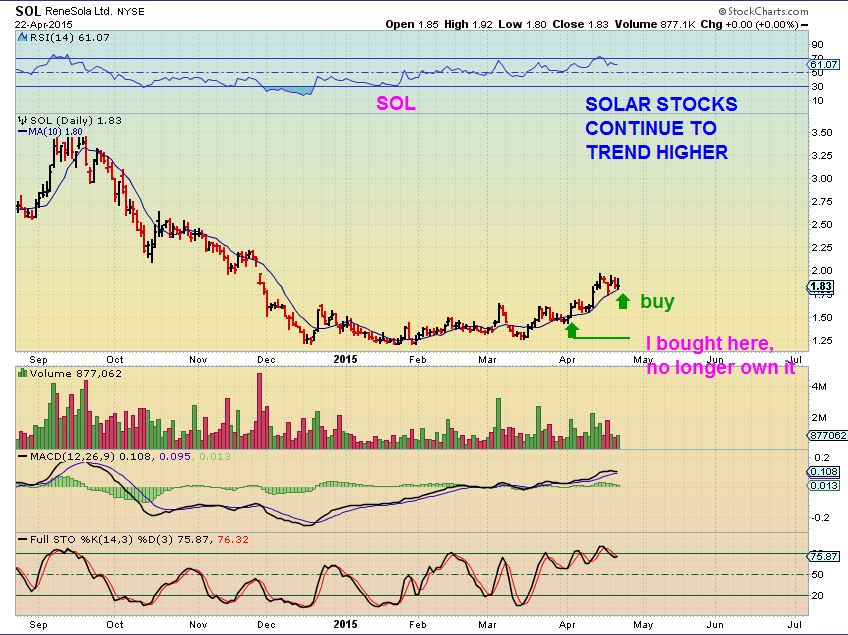
I have liked SOLAR stocks since January and have mentioned from time to time that I am trading them and that they are actually in an uptrend. I don’t hear people talking about them, but if you look up SCTY, TSL, JKS, CSIQ, JASO, etc – these are very bullish up-trends. They can be BUY & HOLD candidates for those that like to invest and leave their $$ parked somewhere. 2 examples below:
SOL for example- I have traded this, but it is starting an up-trend I.M.O.
TSL – Runs up, consolidates, runs up..currently consolidating. See the chart for other tickers to look at.
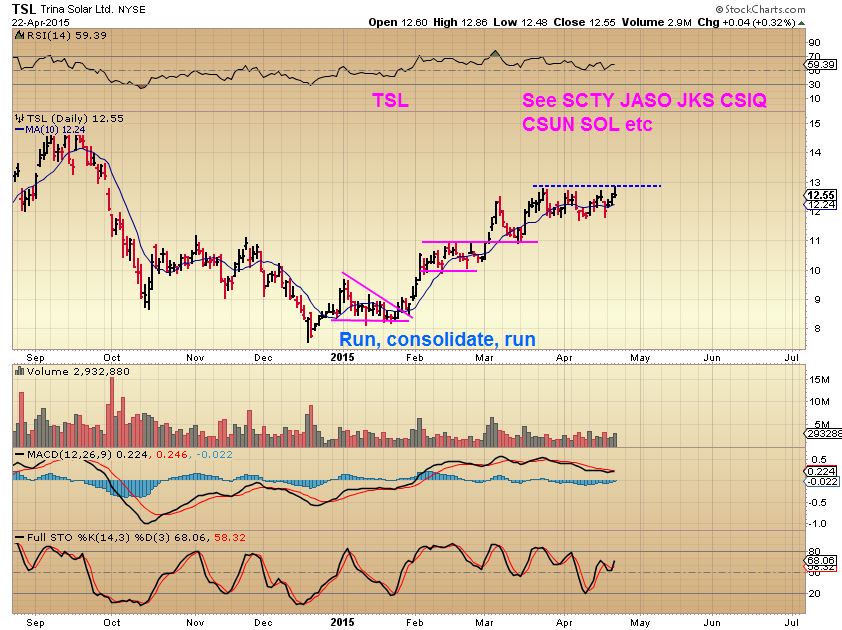
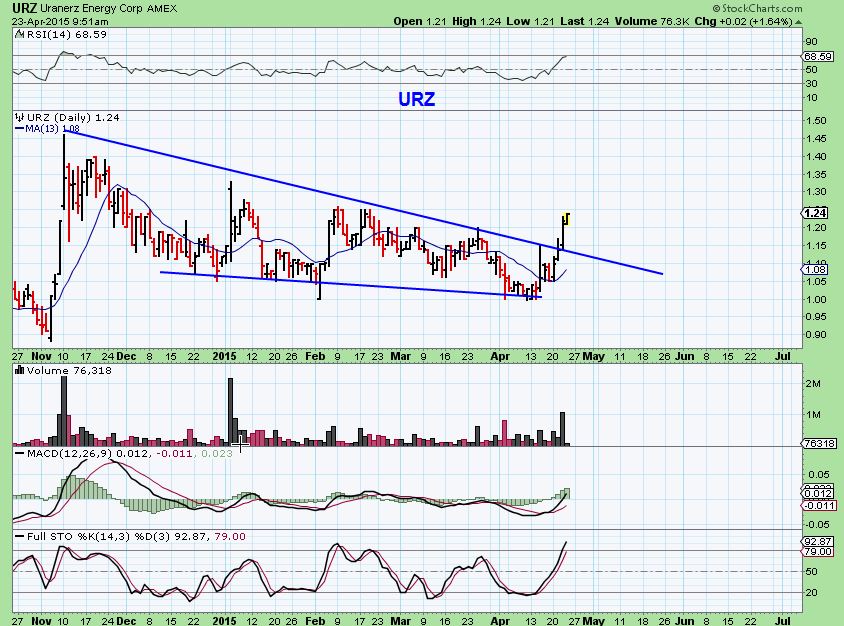
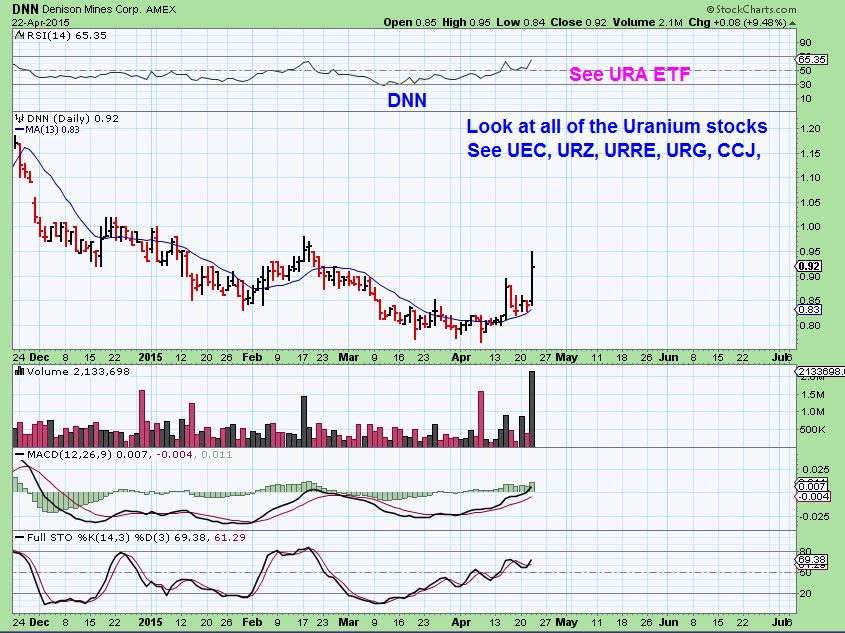
Scroll back up & notice how SOL formed a ‘base’ first . Many times the base process is difficult to endure as a trader. I believe we are seeing Bases form in many commodities , including our energy stocks. These can lead to great gains when they break higher. Back in Feb I was pointing out the action in Uranium stocks . They were forming bases and Popping up, and dropping back.
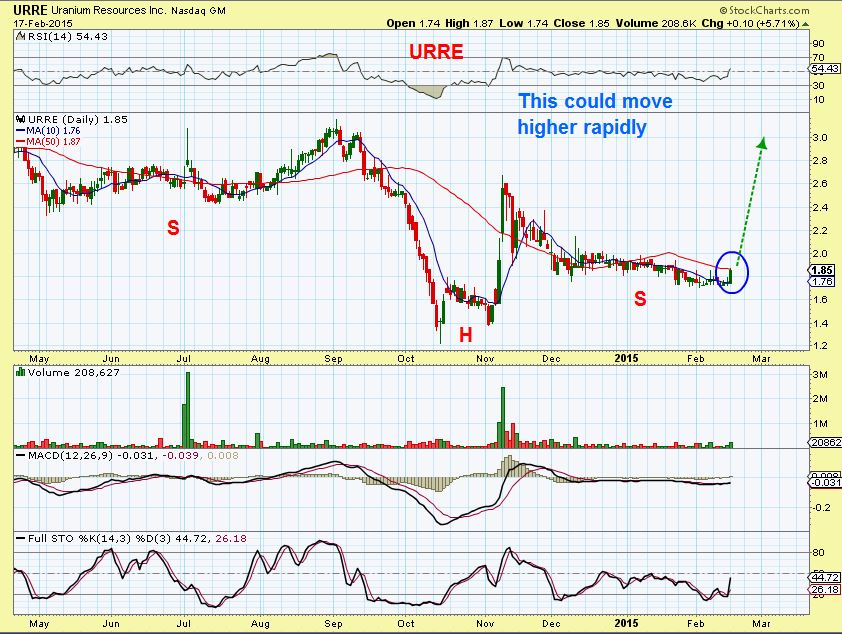
Yesterday in the comments section, Ken pointed out URA ( Uranium ETF) , so I began looking at URZ , URRE, UEC, URRE, DNN and they all were taking off higher. They may be breaking out of their bases and you want to watch (Watchlist?) and see if they start trending higher too, like the solars have.
My charts from Feb / March showing those bases were as follows
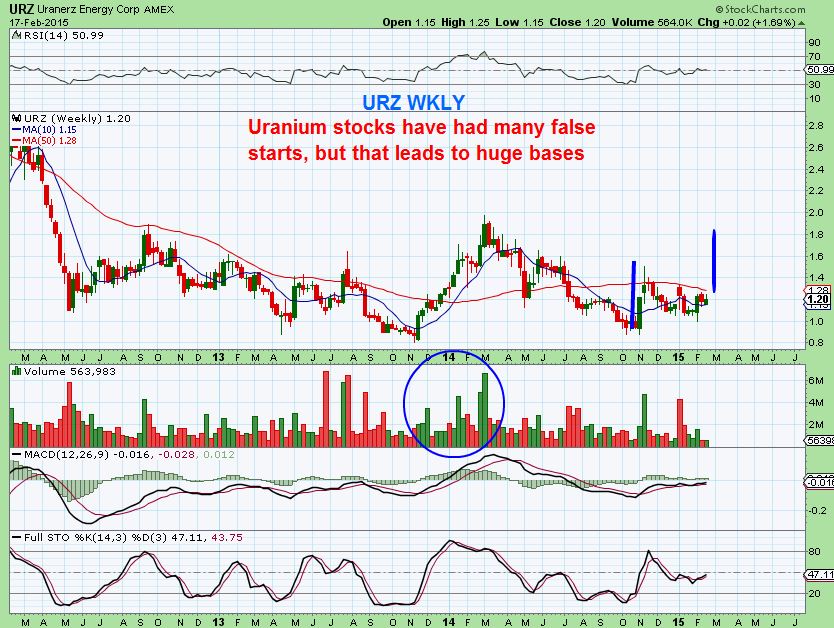
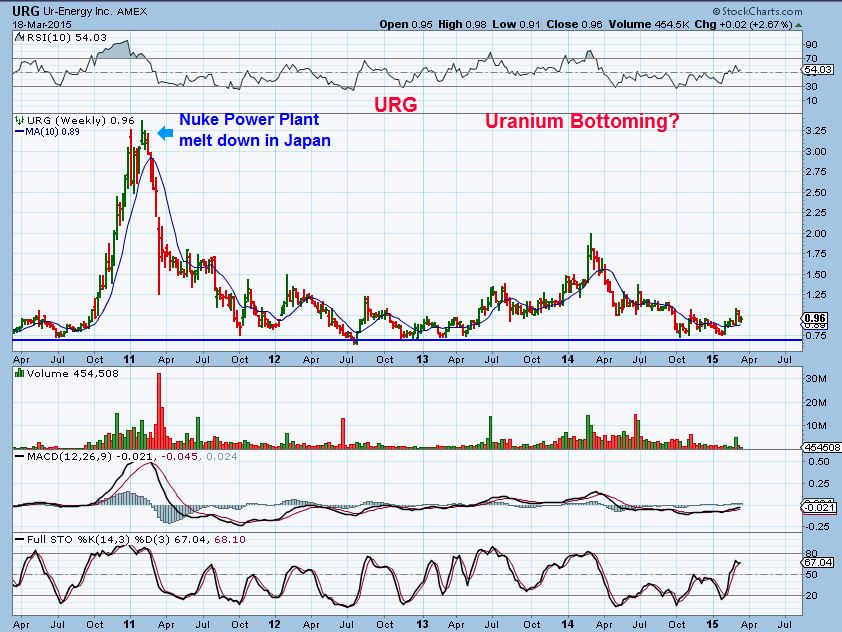
This is URZ & DNN now, you can check URRE, UEC, URG, etc to see how they are all suddenly moving higher. This may be the start of a new trend, so we’ll keep an eye on it, and it lso present possible good trades on the next pullback.
I am going to release this report now just to get it out there (Its almost 10 a.m.). I am then going to add just a couple more charts of interest, but you will not get an email alert when I do , so please check back in a while to see those additional charts. Thanks again for your patience, I am still a bit feverish and chilly and may not be in on the comments section much today. Have a great day !
~ALEX
Interesting charts
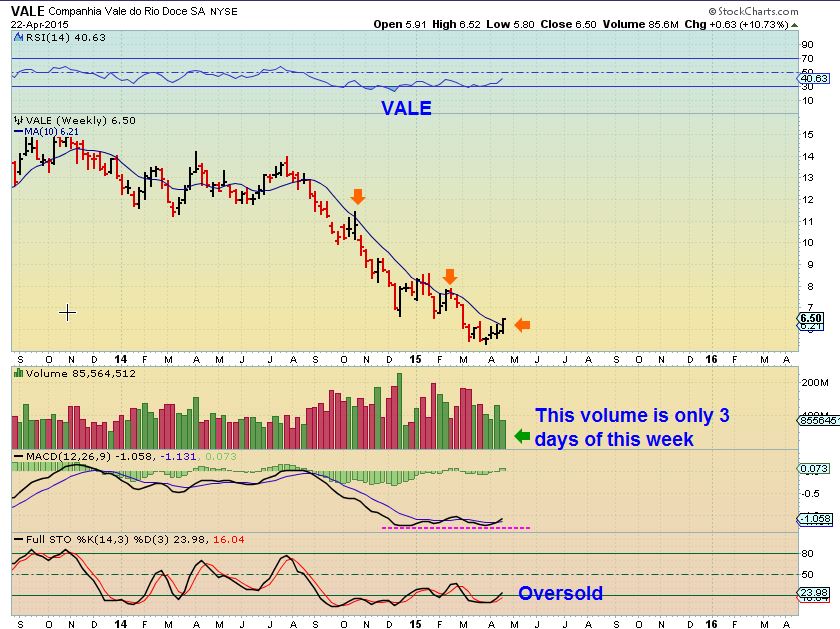
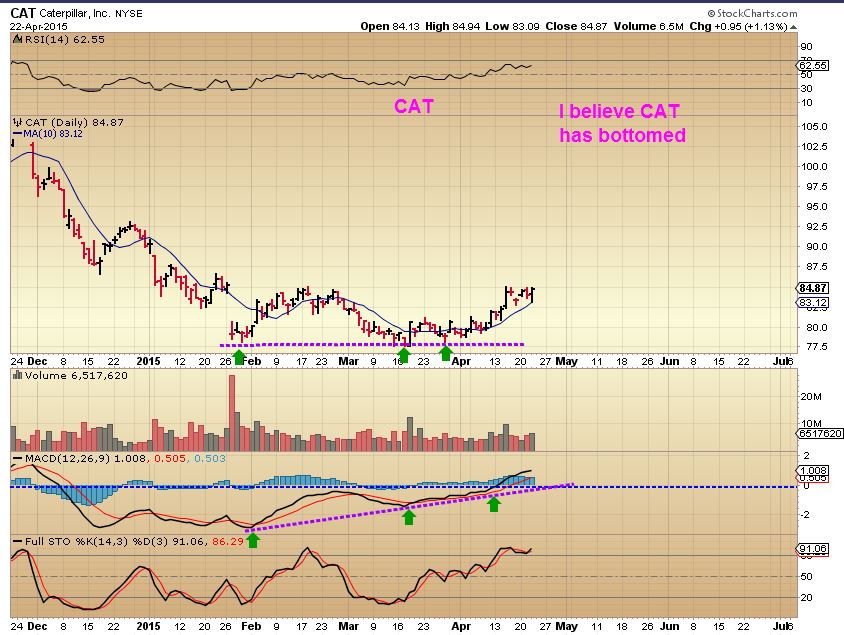
I have been watching CLF, VALE, CAT, and a few other stocks that would indicate to me that possibly a low in Metals/ Mining could be approaching. I have seen POPs in VALE in the past, but the weekly now indicates that VALE and CAT may have bottomed. I expect them to do well from this point. This is what I am seeing …
VALE has repeatedly popped in the past, but along with this break out …
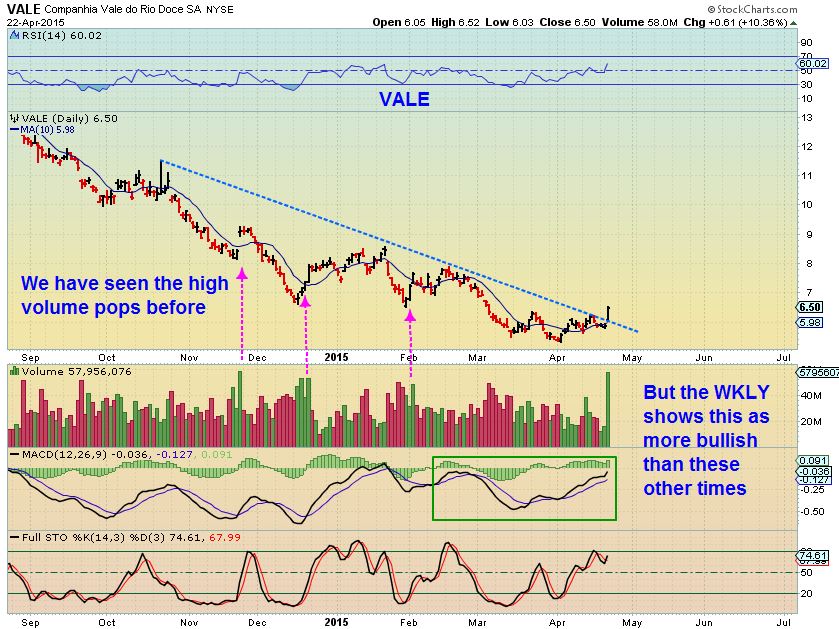
We have the WKLY VALE chart – possible close above the 10wma this week.
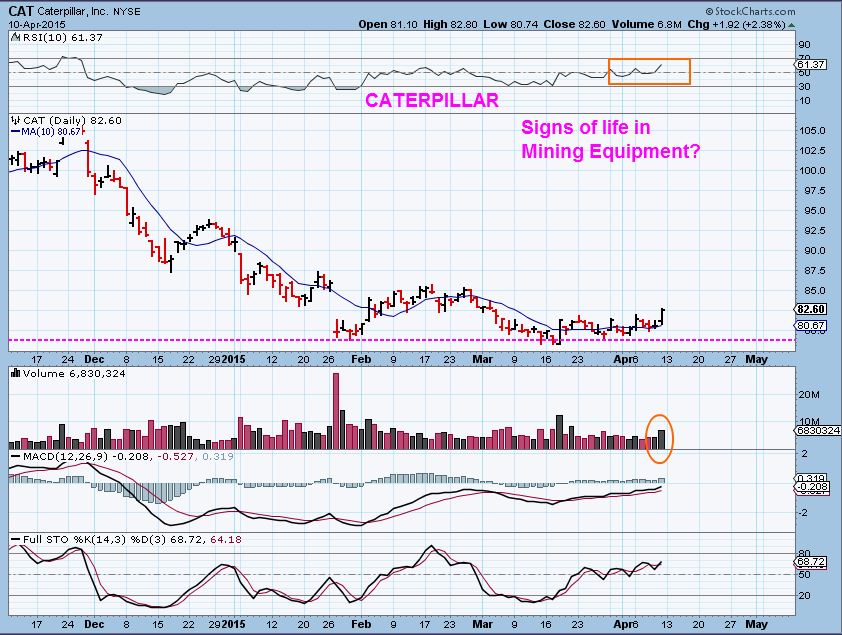
I posted this chart of CAT on April 10, it has moved higher since then. Watch for it to start trending higher too.
CAT NOW- And it just gapped open higher this a.m.
This next part is somewhat of a reminder, maybe even a lesson about stock movement. Often I will recommend buying a ‘Base’ or a break out from a base. When I do , I then say that I expect this to move much higher over time. Some people misunderstand that to mean that we are going straight up to a certain price target, but that is not what I expect. I have bought MINERS coming out of the 2008 bases and made 500%…but it may have taken a year or two. WHY?
Stocks often run up, then consolidate (And that can take many weeks) . Then they break out and run up again, then they can consolidate for weeks. We are experiencing this in ENERGY now , so I wanted to show you how this works in a couple of stocks that I recommended a while back . This basically shows that there are times of boredom & times of excitement. Eventually , if the trending higher remains in tact, rewarding.
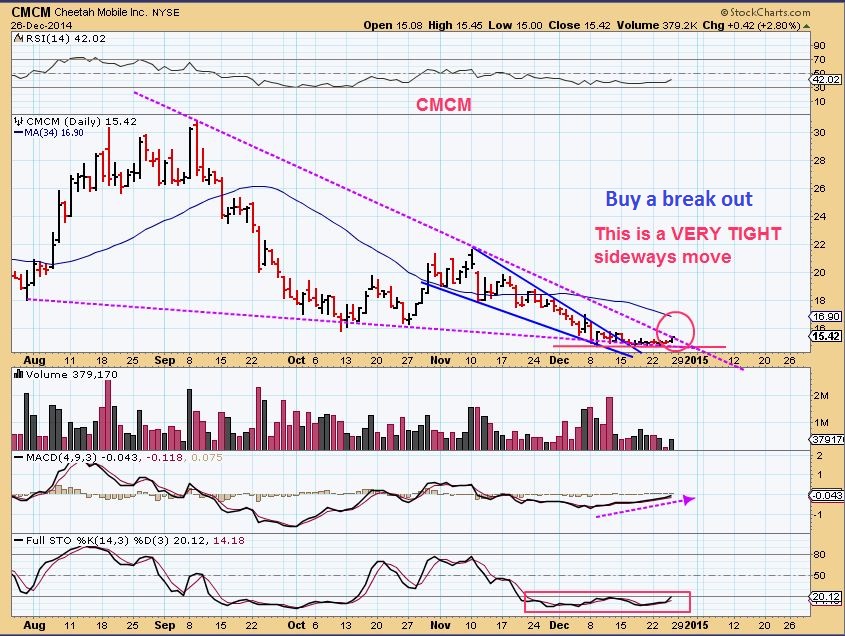
CMCM– Dec 26 – I LOVED this very tight base about to break out (Price $15.50), we could Double I said, reaching $30.
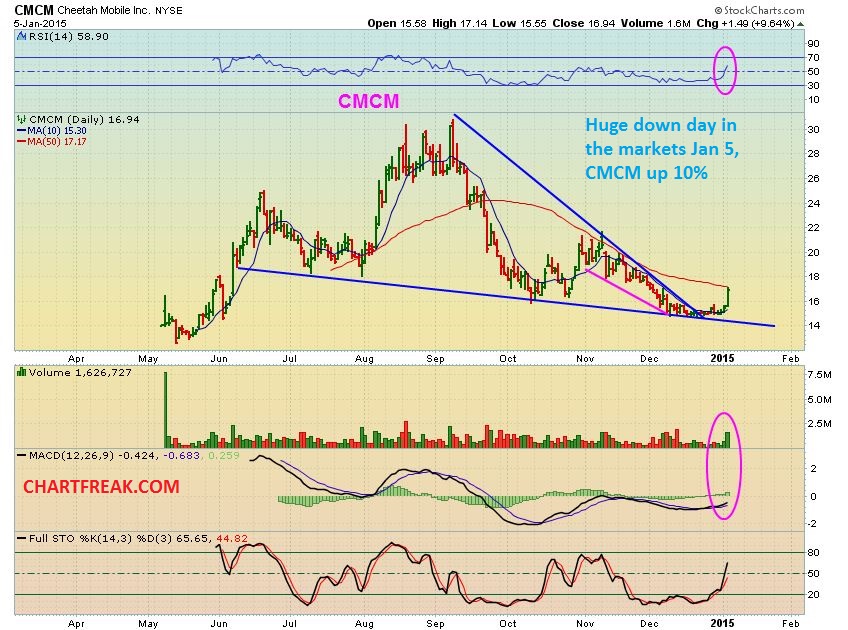
CMCM JAN 5 . Breaking out and now near $17- so now do we get a straight shot up to $30? No, there should be periods of consolidations .
CMCM – Now . Please notice the huge period of consolidation after running up to $20, back down to $16! Then straight up to $25. Now bull-flagging between $21.75 & $24. The break out from here could take it to….$30.
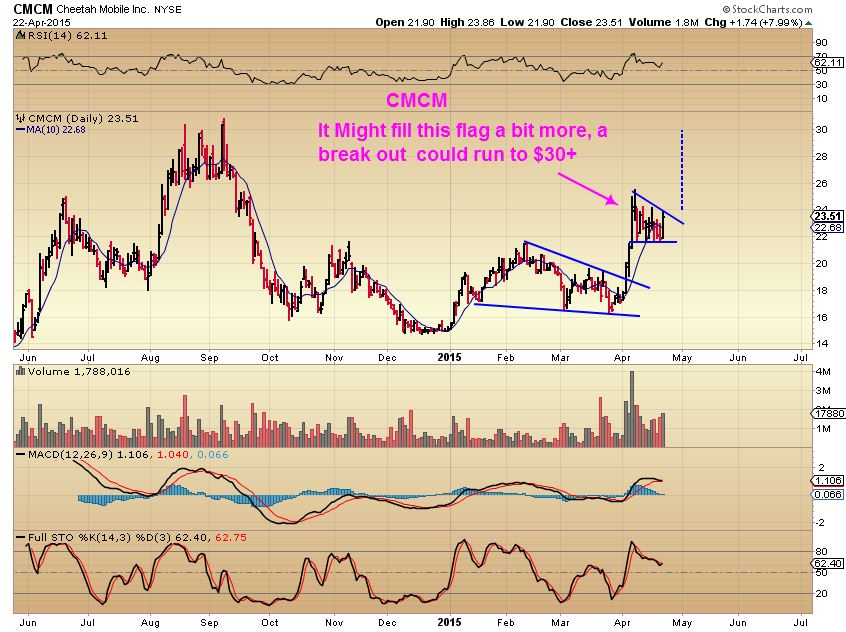
The point is that from Dec to maybe May, the price will double from $15 to $30, but there are times of consolidation that can be very hard to ride, certainly hard to trade. We may experience that in ENERGY as OIL tries to recover from its recent sell off. Also that is possibly what we have been seeing with GOLD/MINERS in their sideways activity .
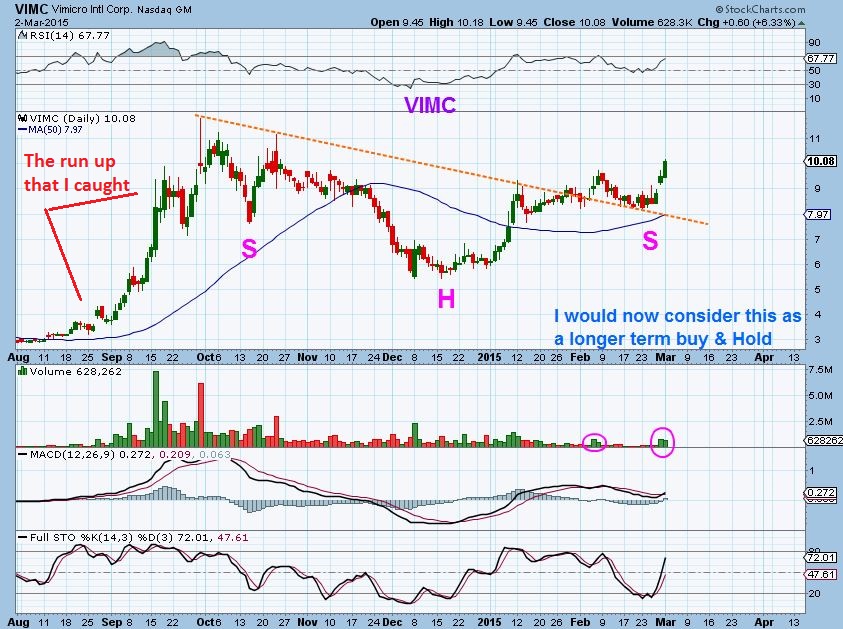
I also traded a stock & did so real time on this website last summer called VIMC. It was breathtaking as it ran from $3 to $12. It then started a HUGE consolidation . HUGE ! Forming an inverse H&S that I pointed out here . The buy was actually $9 ish
In early March I was trying to show how these periods of consolidation can lead to big moves. I considered this a BUY & HOLD.
VIMC now. Boom!
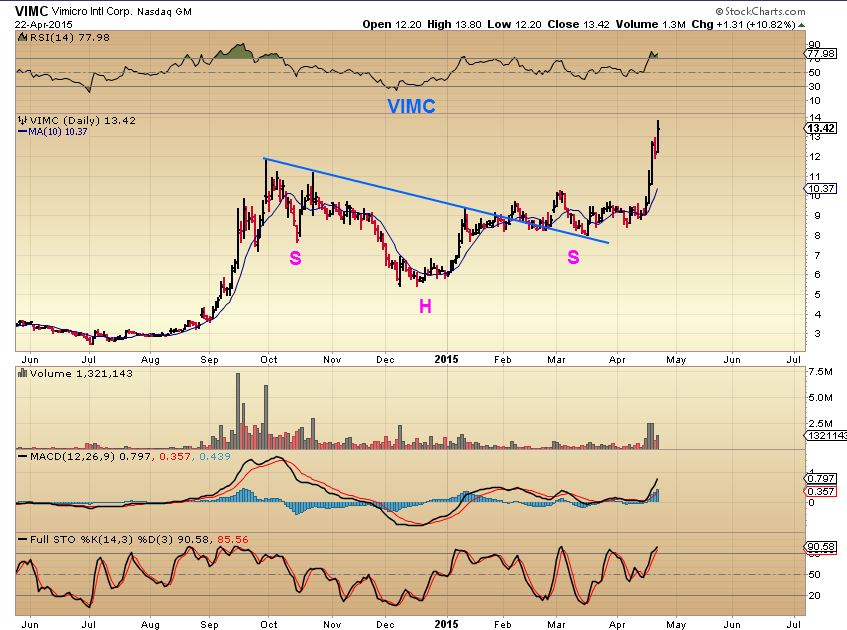
So my point is that it is not easy being patient while working through a consolidation ( or building a base) . Often there is no idea how long it will last , but the longer the base or consolidation, often the longer the move will be upward. Look at that right shoulder on VIMC above. There was even a false break out in early March, then it sold off from $10 to $8. Some try to just buy the break out, but often you get those type moves. If you can catch the main run however, it is quite rewarding.
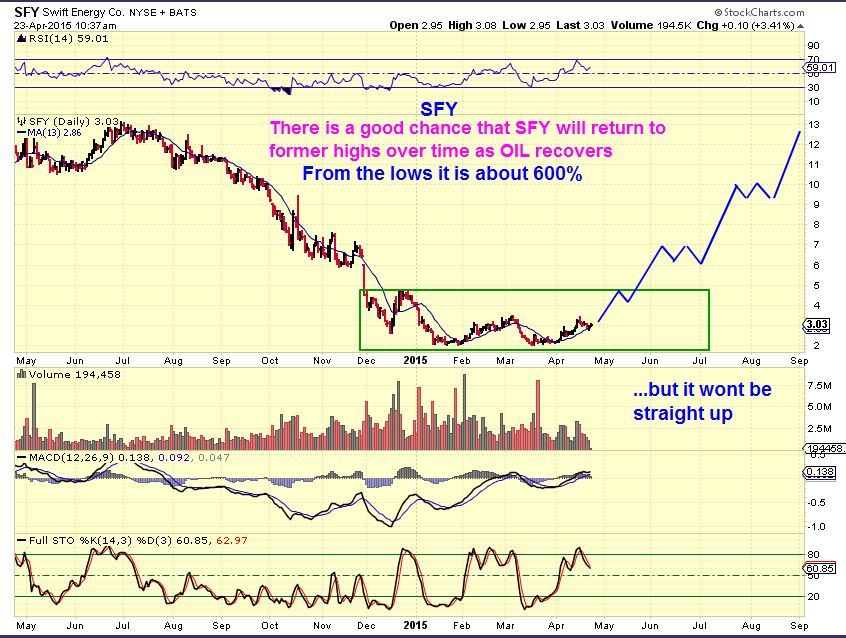
Currently we are seeing large bases forming in Uranium stocks, many Solar stocks had them, Energy stocks are basing and so on. Traders are making good gains short term, and longer term , large %-Gains would be achieved if OIL recovers and some of these return to former highs.
SFY- just a reminder that the moves higher will not be straight up


Sorry to hear you’re feeling bad, Alex. Not fun.
BIOS may be one to watch. Nice bull flag forming right under big resistance level and just above the 50 DMA (all after a huge capitulation plunge and reversal). Good vol patterns, etc.
Thx – yeah, still feeling it
Anyone looking for something a bit different in the Brazil space to play could look at CZZ.
I like the way OIL looks. I think we go back to $57.50 or so, just based on Harmonic patterns (below).
Some of the energy stocks look awful to me, see EXXI, CLNE (below), and WRES. Others like RES and ANW look good?
You think CLNE looks awful?
This has been my best stock. Up another 5% today. Plus their fundamentals are stong and the clean energy industry is a good place to be in.
Like I said, it was premarket. Everything is changed now with the strong turn. Id say the H&S pattern is broken now.
Everyday I’m more sad I sold. 🙁 Glad it’s working for everyone though. Hasn’t given much opportunity for ‘re-entry either!
I wouldn’t be sad. Look at some of the others in that industry. I’m sure there will be some opportunities coming up!
Thanks, Carl, will do. An still in energy space just not CLNE right now (KEG, SFY, WTIC).
Look at my second chart. This was premarket. Looks like a clear H&S pattern.
Time frame is important. Even if that H&S did confirm (i.e. break the neckline) and fulfill its target you’re talking about a pullback to, what, about 6.30 or the 20 dma. Fully within a healthy pullback. So if you’re daytrading it, yeah, maybe (on an actual break of the neckline).
That’s my take.
My thought was similar to Onlookers….”Timeframe”. When I heard that CLNE looked awful, then I looked at the daily chart…I thought it must have been a mistake. its up almost 100% off lows and was still at the recent highs, thats why I said “you think it looks awful”. I thought it looked beautiful, but he was discussing a different time-frame
Big stop run in Nat gas on the inventory report. Crucial junction here, needs to get some traction here above 2.54 or it doesn’t look good for staying above the hoped-for fake out low.
Finally getting some upside follow through on the ‘S’ & ‘ASTI’ set ups
URRE back down after its morning pop. Good entry here soon Alex?
Hope you’re feeling better. They say 90% of what people think is a stomach flu is really food poisoning.
Thx Carl
URRE is a tough call, because of the way these move. If you look at URZ on April 15..it rocketed up & back intraday and now its much higher, but I cant say that URRE will or wont do that. These sure are moving nicely though.
Look at UEC , URZ, and DNN on a 3 month chart …they just keep going higher so far
I got stopped out of GDP yesterday, so I added to SFY . Both of these & others really look like they want to move higher .
I got shaken out of EXXI yesterday; they got my stop by 5 bloody cents! LOL
Me too Tony and I still can’t figure out how my stop was hit. That’s one vote for mental rather than actual stops.
I’ve learned that lesson the hard way more than a few times! Mental stops are harder for me though because I always talk myself out of them!
Yeah, I don’t know about this mental stop thing. You either have a stop or you don’t. I mean seriously, what does a “mental” stop really mean? How does that really work? Are you going to watch it in real time and somehow know if it’s a “real” sell off?
I’m all ears, but I don’t get it.
Yeah I actually agree. Just pissed off they stole EXXI from me. Bastards. I added to my winners with the money. SOL and PEIX. PEIX looks headed to around 15 to start.
Exactly…the only reason I do it (with some stocks) is so I don’t get taken out on a stop run but it’s easier to break your rules if you don’t have a concrete stop set.
Same for me if I am in front of the screen, I can use a mental stop if volume is really really light and it looks like a stop run. GDP was under the 50sma and that ws my mental stop rule : ( I hate that too
Yeah, I’m really liking the look of SFY over the 3-6 month time frame. Thanks for the chart, Alex…hope you feel better…
Thx Eric
Check out the beautiful move on a 6 month chart of ticker ‘VOC’ energy
FCX looks real good too. Nice bounce off the 20/50 dma today
Nasty high vol reversal in CAT. Maybe it can pull it out from here but that’s not pretty.
I saw that too…when it opened I thought it would run.
Do you guys remember when I bought & recommended SSNI – it then did the same thing. Crashed then turned higher eventually. Now it is above those prior highs
I had a chart here ( the wkend report?) of UNXL. SAME THING and that got ugly fast! I am thinking that is going to recover too. Strange.
HIGHLY speculative energy play – AMZG Lottery ticket at this point
There goes ANW
Looks good. Broke 3 month consolidation.
Gold’s just not gonna make it easy to spot the DCL, is it? (Or I should say: harder than usual)
I tell you what, I watch it closely, but I absolutely cannot figure gold out right now. Afraid that by the time we figure out what it is doing, the move will be over!
If thats the case, it wasn’t much of a move & we likely saved money rather than constantly being stopped out, right ? : )
Good afternoon,
I added EXXI and DQ this morning to my oil portfolio. My stops on all my oil stocks purchased yesterday and today will be sold contingent on the price of USO below yesterdays low which is 19.26. Risk ratio very good imo. Looking for a break above USO 20.22 or $WTIC 58.63 to confirm the 5th and final wave of Major 1…..there is a chance we could double top in that area also.
Watching KEG, WRES, NOG, OAS.
SD is a dog ! 🙂
You could also place the stops below each stocks low of yesterday. Alex may perfer that vs based on the commodity itself ?? Not sure though.
SPX broke the trend line…. fyi
UUP ( US Dollar ) just broke the 50 DMA…..fyi
LPI looks ready to break out higher, and I do like the break on ANW
X ( US Steel ) is performing well 🙂
Not to mention URA ( Uranium ) 🙂
Got into AKS yesterday. Good day for that too. Bought near 10DMA.
I saw that post yesterday , I was going to congrats you : )
No congratulations until I sell it please! :))
LOL- I hear ya
On my list of Miners I noticed that MVG was halted this morning pending an announcement. The it re-opened and BOOM, up off those lows.
Ever since I received my new Avitar from Alex my Clarity has increased dramatically ! 🙂
SZYM may be starting next let up today.
Yes, I think you may be right.
I added 2 days ago on the 10sma and thought maybe I was early when I saw it yesterday. Today I put up a 13 sma ,maybe that’ll be the new support : )
I sure hope so:))
pm discussion for me here: this back and forth is driving me crazy, can we get a directional move and stop the banter?
Its coming soon, the positive is if you pull up a chart of GOLD & SILVER and look at how they sold down, then look at GDX. It did not really drop. I’m thinking that Miners are being accumulated more. ( It might even be safe to start a small core, but I dont want to recommend that out loud, because if they start to drop and I’m asked what it means….its hard to explain that it is probably just a normal DCL after you say its ok to buy )
Very strange, I swear I saw CONRAD post a comment here and when I went to read it it disappeared. Did anyone else see that , or is this fever started to cause hallucinations?
CONRAD?
Yep. Commented on UNXL. Still there on my screen
Thats strange, I clicked it and it went away on mine. I’ll try to refresh.
I have been in and out of UNXL for most of 2 years – made money a couple of times before their trials and tribulations. But I sold recently at a loss after reading this http://www.smarteranalyst.com/2015/04/10/unipixel-inc-this-steamroller-is-about-to-squash-investors/
THX (Its still not there on my screen, even after refreshing).
I got stopped out of MHR and bought back in this morning. When I got back in this afternoon I checked Google Finance and they are showing it as having an increase of over 10,000%. Thought I’d finally won the jackpot …. BUT they have a feed error
LOL- Imagine if you got stopped out yesterday and then saw that…and it was real!
Alex,
Would you email me at your convenience please.
Ken
Can you email me first? I’d have to scroll through a boat load of emails to find your email address.
The option is under the support tab. then you click on ‘Contact me’. It gives you the option of emailing support or Alex – Support doesnt go to me, the other one does.
Thx
alex-do you think IBM might fill that gap above 170 or might pullback a bit to 164 range before the push.i had them at 158 few weeks ago..plan was long..
I think the break out on IBM may be all she wrote for that base. The move looks convincing, and the first initial break out was 3 days ago, then it dropped and now it may be on its way. that
Disappointing close, was hoping this would be the breakout for the next leg. But positive is positive, so I’ll take it. KEG a bit of a laggard here. Nice day for Sprint, my (rare) patience paid off for once!
Alex, I think each of your posts should start with the words “PATIENCE”. Sold S at breakeven after being bored. 2 days later …9% move :-((. Where can I buy me some of that patience stuff???
Deshy I hear ya and I know that feeling : (
The worst part will be if it just takes off and keeps going. It has happened to me in a huge way in the past ( DGLY) and recently in a small way in SOL . I traded it and made 2 small profits, but at times you look back for another entry & you realize that just holding up. It wont pull back, so it would have been best to just hold on.
PATIENCE is harder for a ‘trader’ than an ‘investor’