
STRONGLY BULLISH CHARTS
I dont want to spend a lot of time discussing the SPX, DOW JONES, NASDAQ, ETC when you can just look back at the weekend report and see that not much has changed in the bigger picture. Instead I want to run through a bunch of bullish looking charts. Oddly, it seemed that in almost every sector that I went through on Monday, Bullish set ups were there. Lets view about 30 charts from various sectors and discuss a few of them.
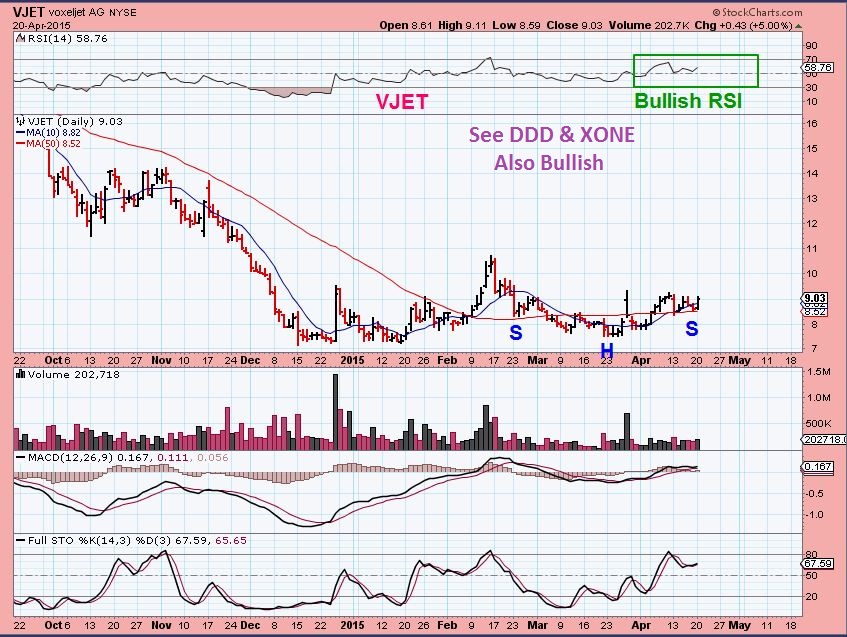
VJET- 3 D Stocks have bullish set ups. For traders , this is a low risk entry above the 50sma.
Next…
Obviously, I am NOT saying that you must buy everyone of these. I do have ‘traders’ here as readers that just want chart set ups to view and decide for themselves what looks interesting ( or what to put on a check list). This list is for the faster traders here, or even those familiar with looking at a chart and maybe entering for a longer term hold.
Sticking with the TECH SECTOR-
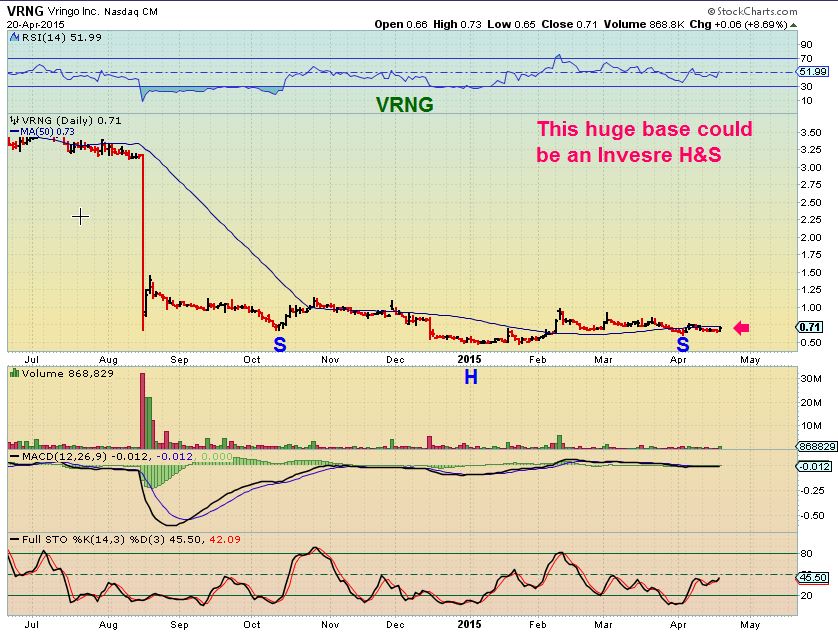
A close up 3 month chart of VRNG looks like it wants to break out higher above its 50sma. The long term chart below is also quite bullish.
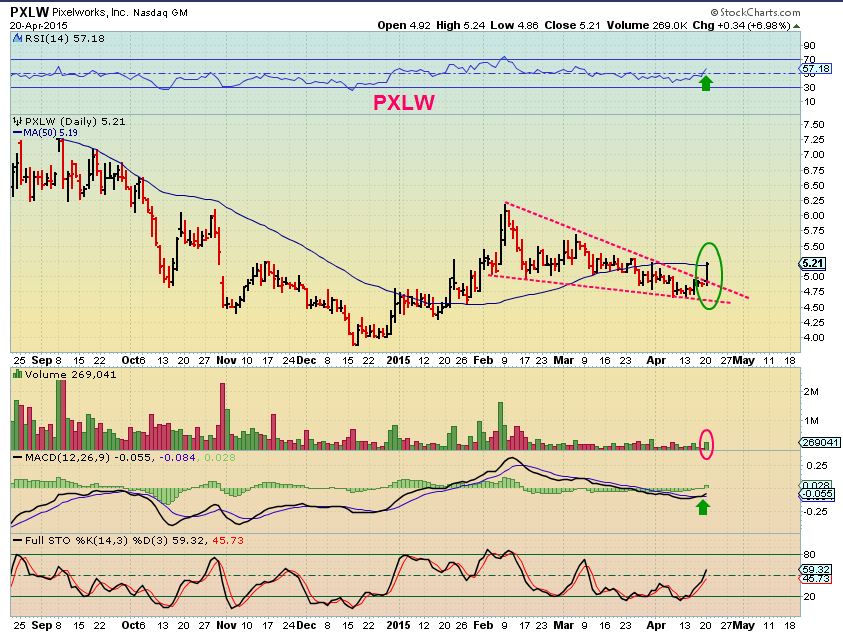
PXLW – Break out
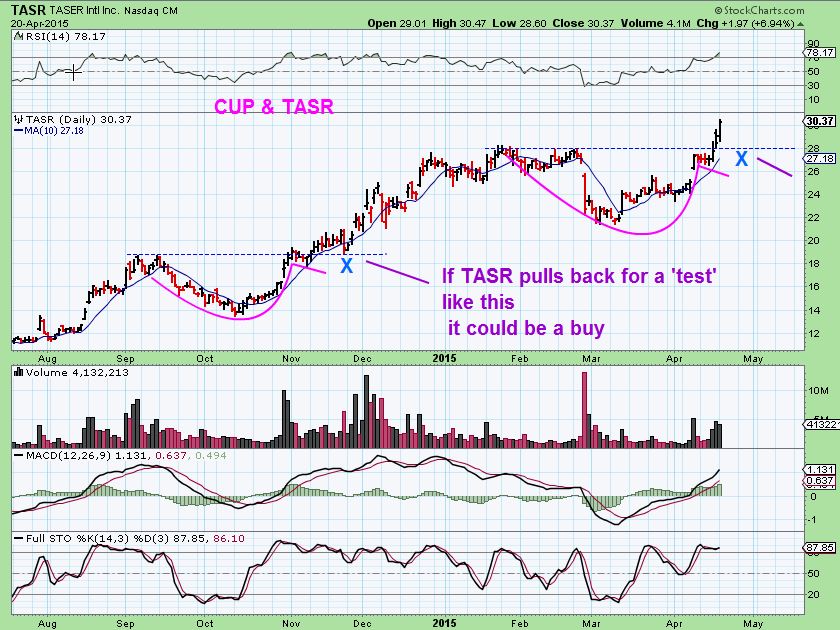
TASR- Run, consolidate, run, consolidate, run, etc
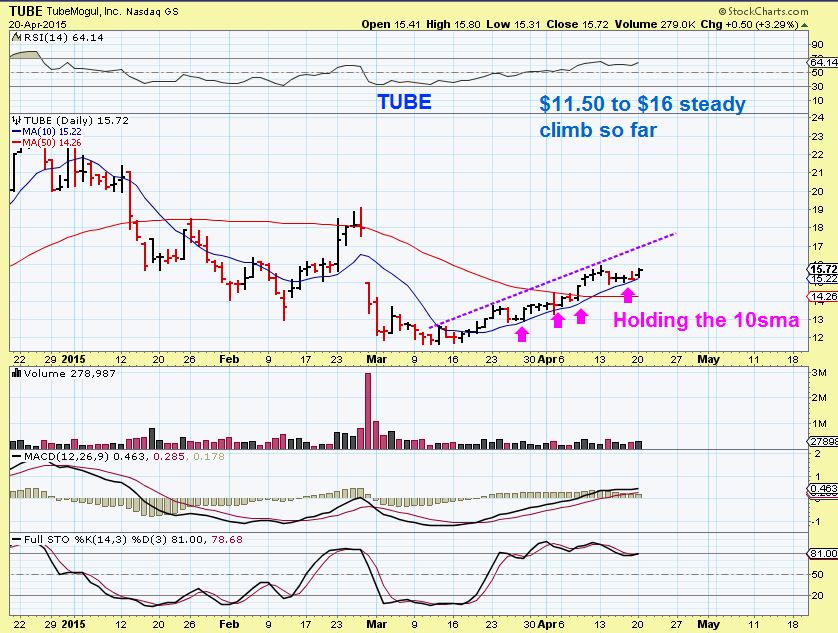
TUBE
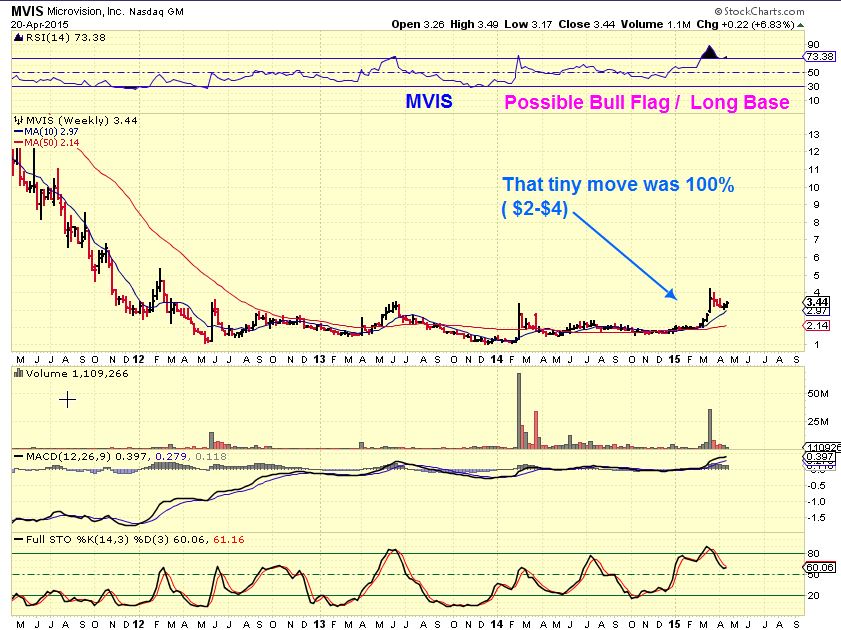
MVIS (WKLY)
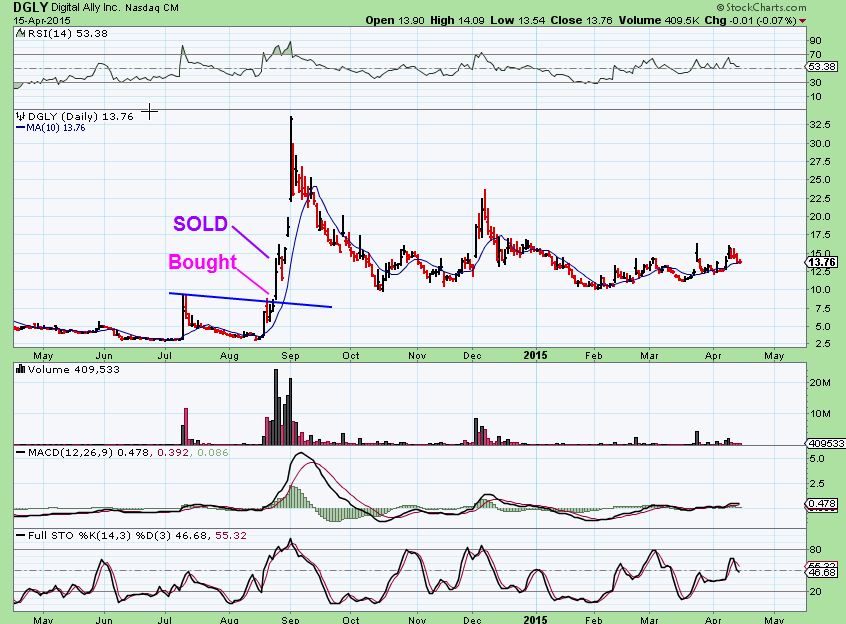
DGLY – chart is last week, but price is still in this area. Watch for a break out.
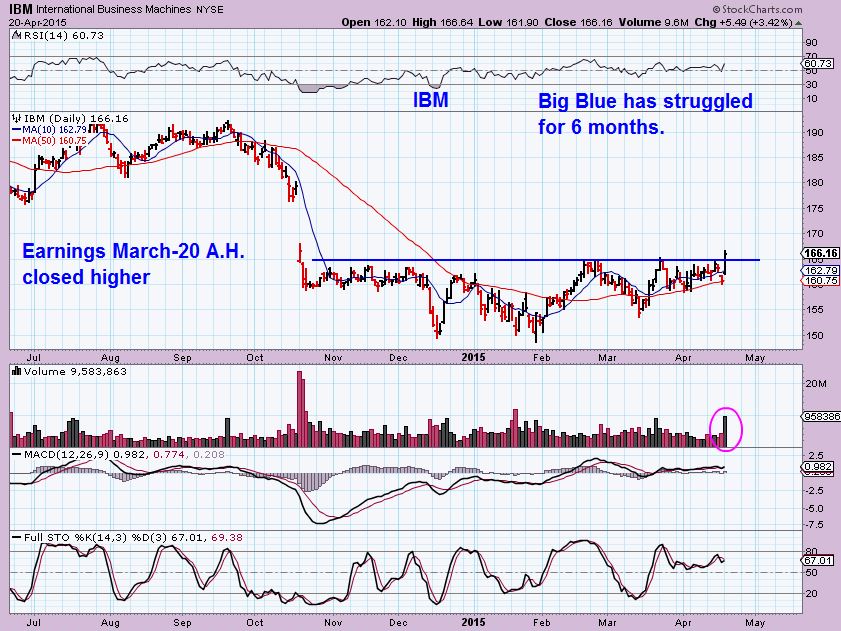
IBM- Earnings were yesterday, closed higher in after hrs
I also like and have mentioned in the past UA (needs a pullback now) NKE, FEYE, NQ, S, and quite a few others.
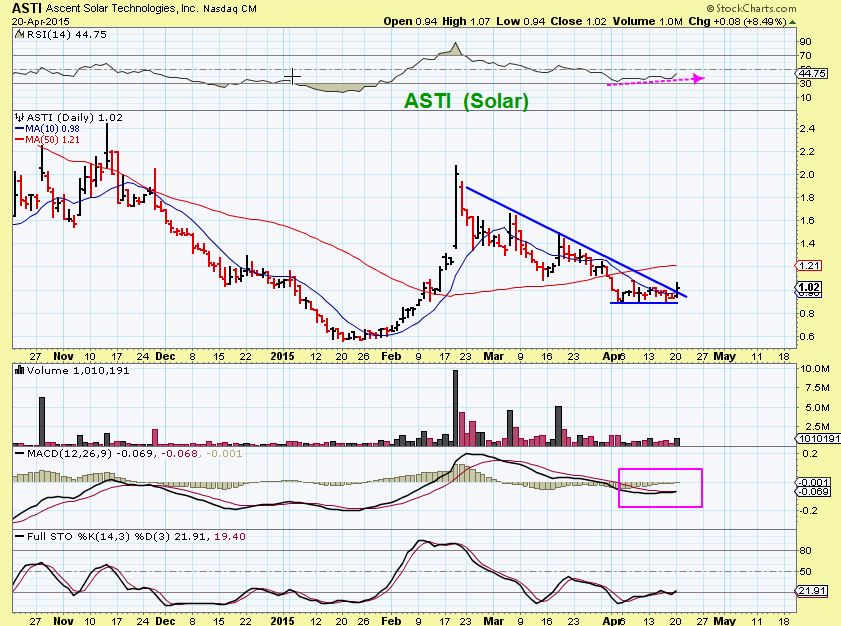
SOLARS ARE MOVING
ASTI – ( I have discussed SOL, TSL, JKS, CSIQ, CSUN…check out HQCL)
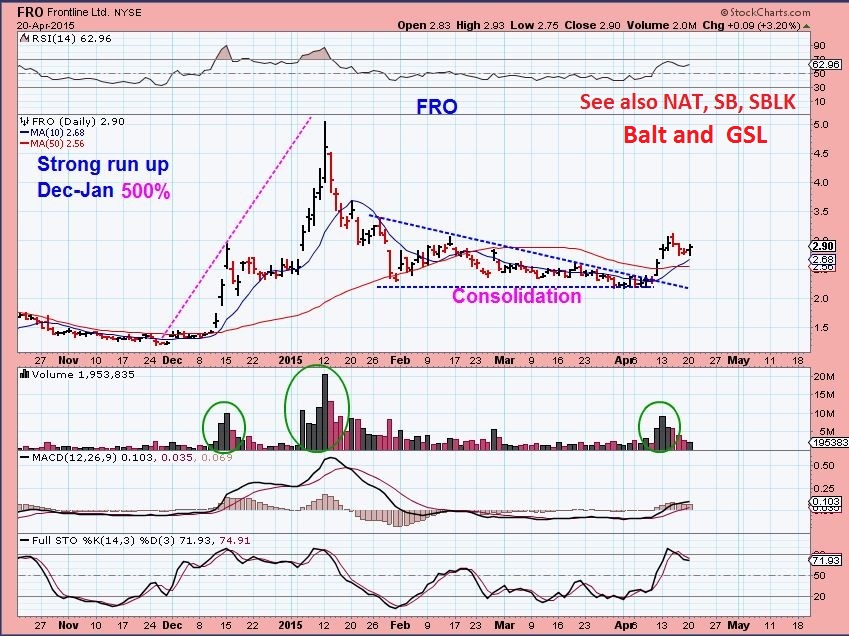
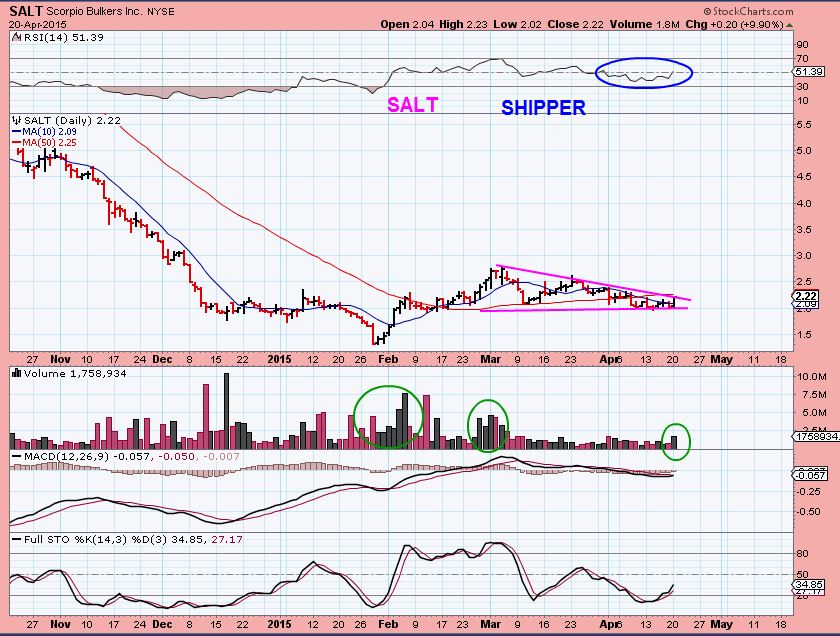
SHIPPERS , some are really doing well. They may be getting paid for storing excess OIL until prices rise and it can then be sold for higher prices. They would be making money as storage units this way.
FRO / SALT/ And read the chart for more names.
OIL – Nothing changed, break out. Could get a back test.
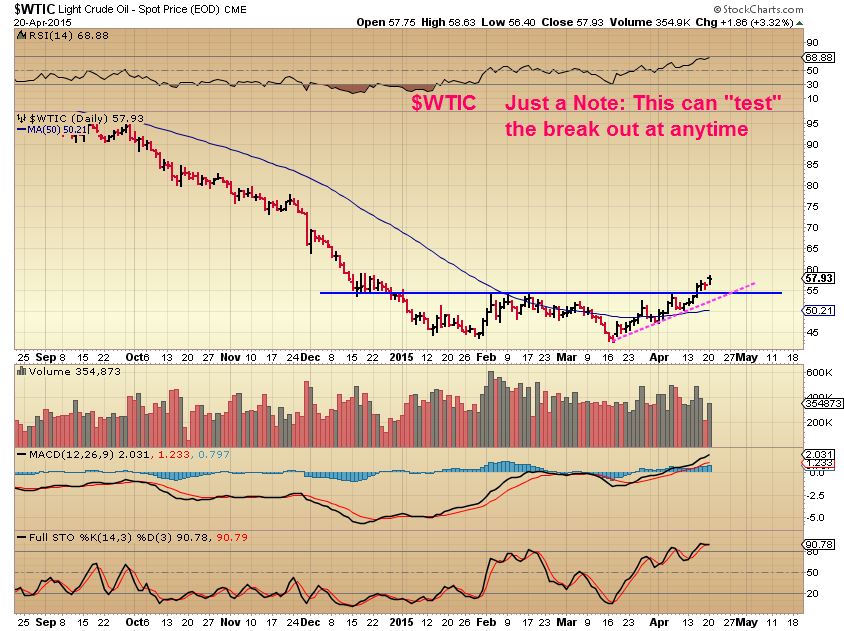
NATGAS pulled back today , but it hasnt changed my view. Some NATGAS stocks have begun their run higher and are still acting correctly.
CHK is a Nat Gas play acting well.
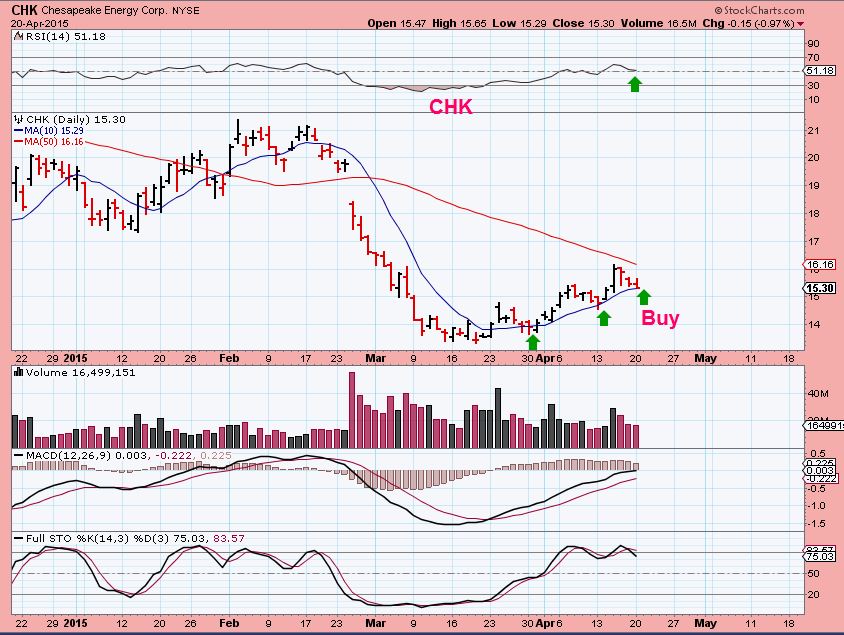
I like almost all of the Energy Stocks at this point. If OIL recovers, I think many of these could be great %-Gainers (see wkend report) . I will show just a few, but there are MANY.
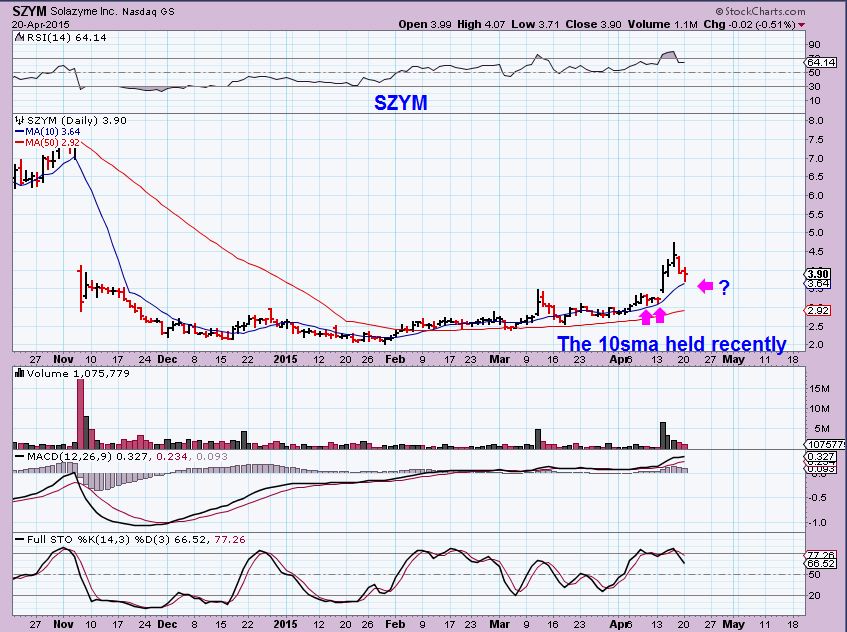
SZYM _ breaking out of the base
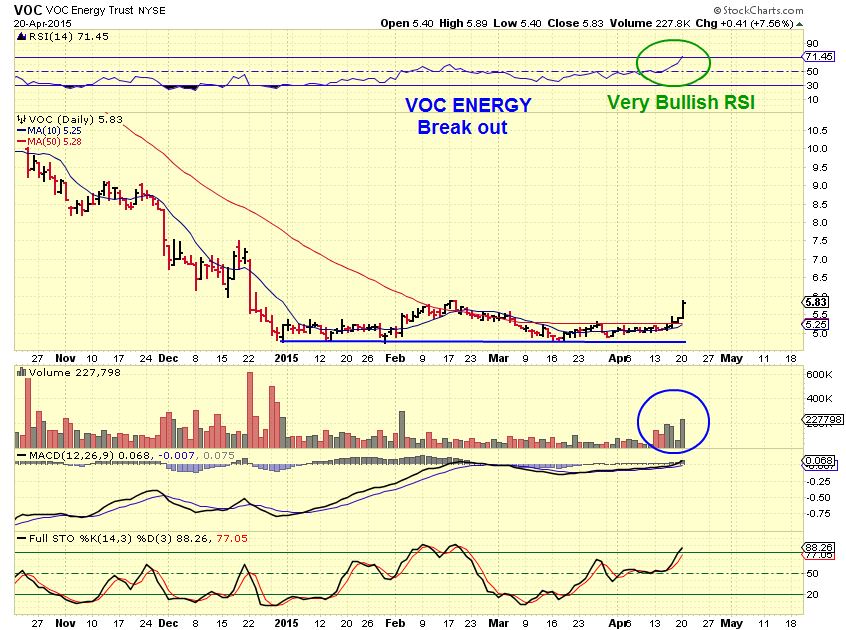
VOC – breaking out too
These are last weeks charts, still in this area, still good set ups, just consolidating.
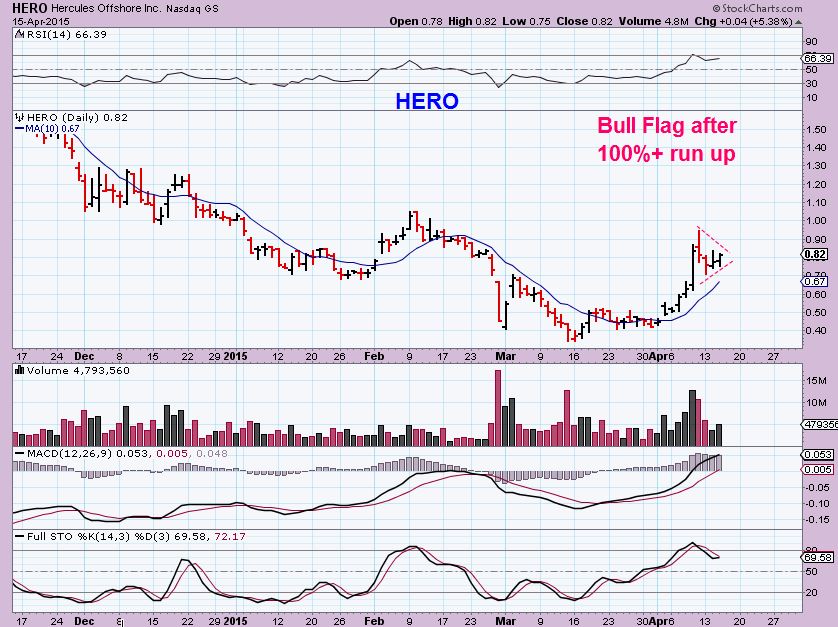
HERO- I added to this Monday
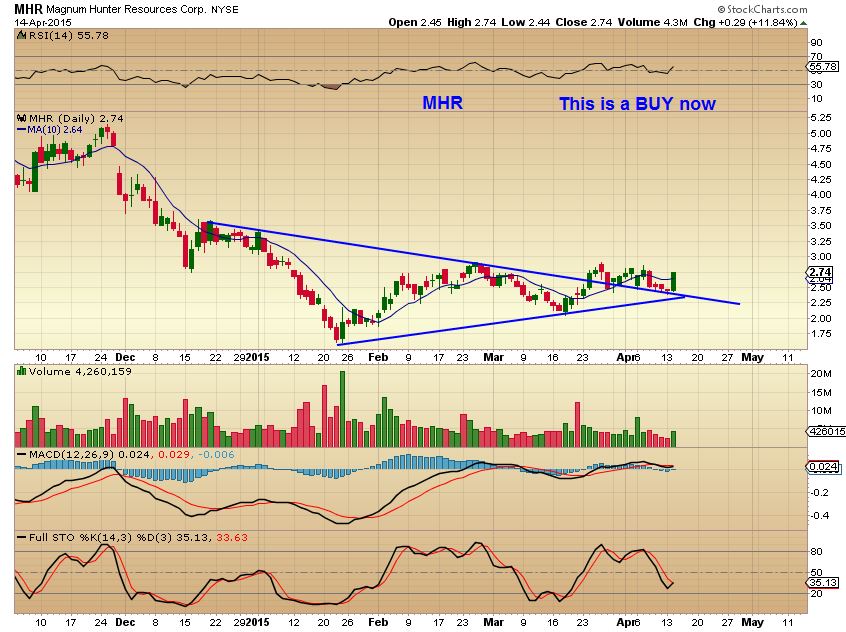
MHR – still in this price range
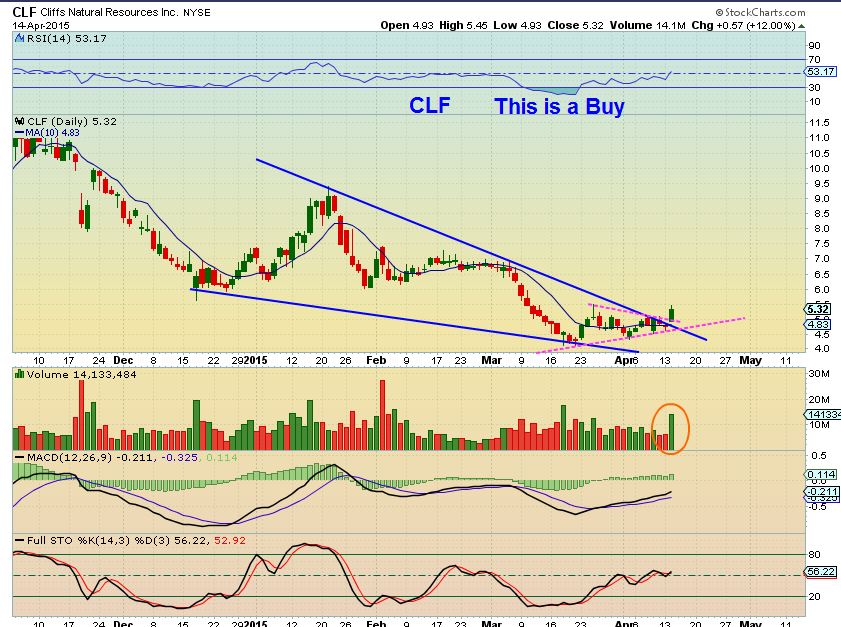
Clf -is still in this price range
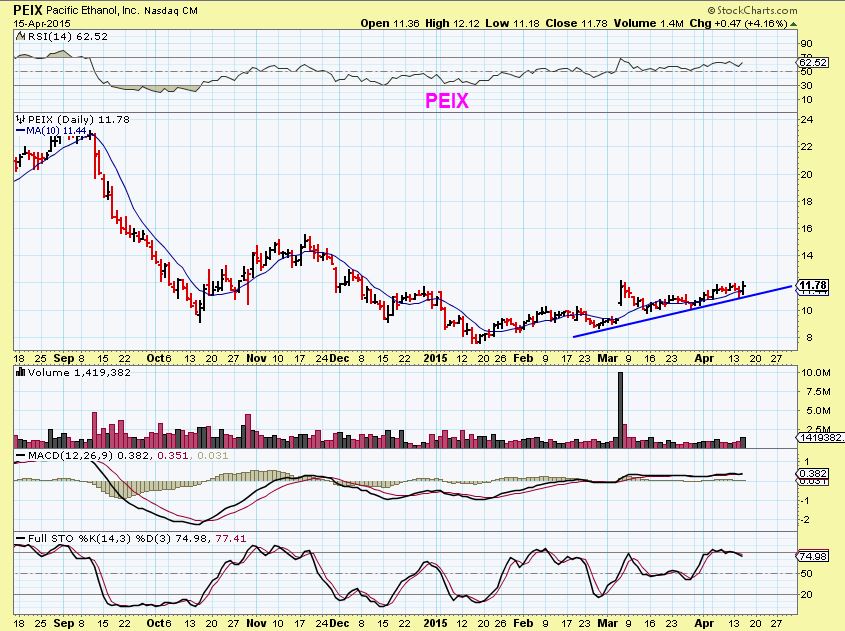
PEIX is 50 cents higher, still following this course
GOLD/SILVER/MINERS
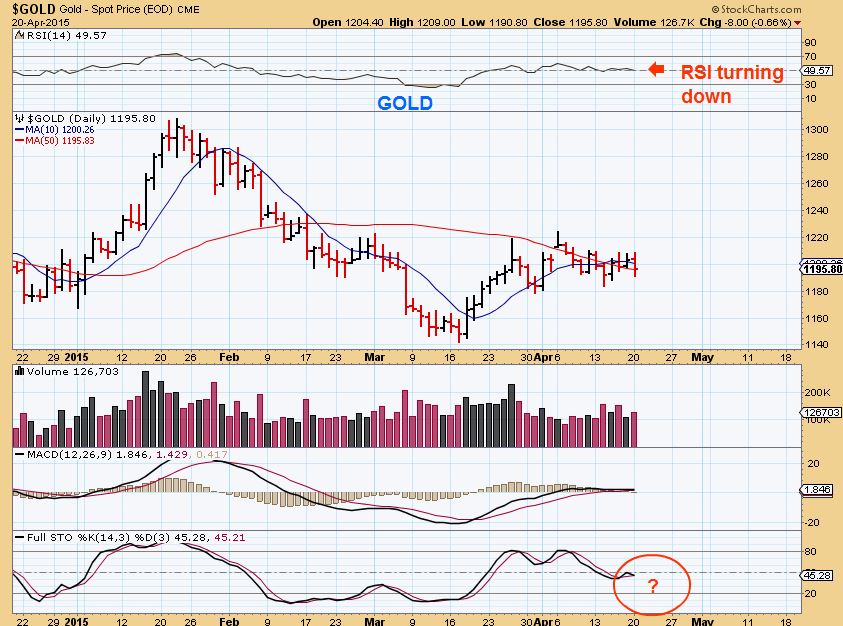
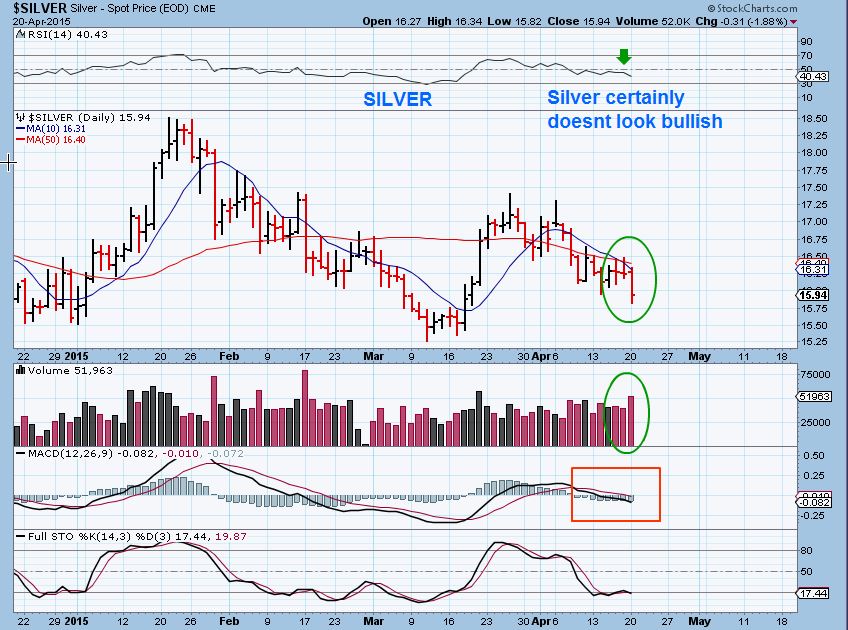
In Yesterdays report I said that I didnt like that GOLD closed up $6, and silver & GDX closed down. I like to see Miners lead.
MONDAY Gold & SILVER closed down, Miners closed Green. That can be bullish, but the gold silver charts need to improve quickly. I am watching this area.
.
GOLD – If miners are leading, look for a move back over the 50sma.
SILVER- Kind of ugly, may improve today
GDX- Rather bullish looking.
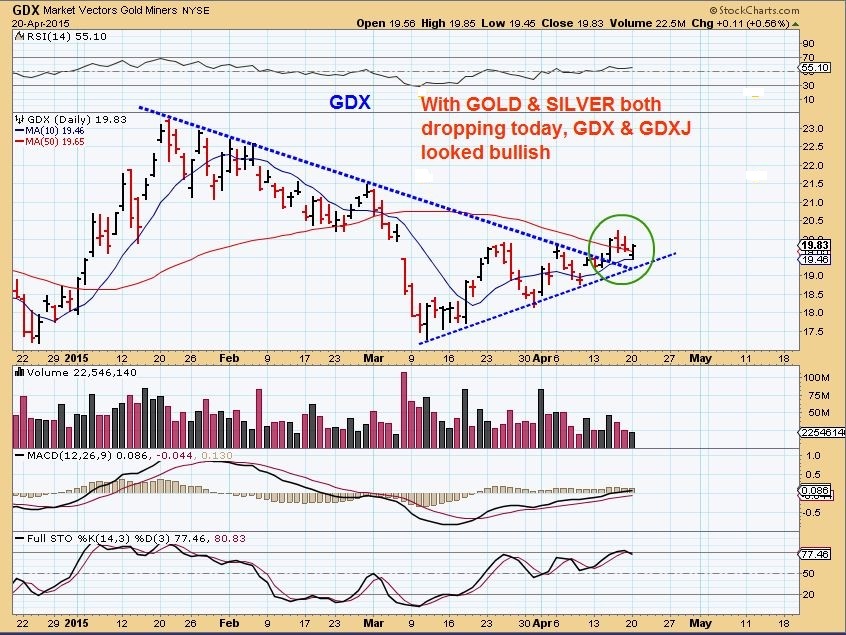
SO I love many of the chart set ups in various sectors. I also like that GOLD & SILVER were down & somewhat Ugly while MINERS went GREEN. If The Metals move higher, Miners could really start moving. The “Timing” is right in cycle work. There is also another theory that I am entertaining, but it’s way too early to identify. In the 2000-2001 lows, Miners bottomed WAY before Gold/Silver. I’ll discuss this more if we get into a time when it may matter.
This list of set ups was just to throw some trade ideas out there for the traders here to be able to watch or trade. I own mostly Energy and could be adding Miners at low risk entries soon ( GDX / GDXJ are right above the 50sma). This could be the next good trade. Enjoy your Tuesday.
~ALEX
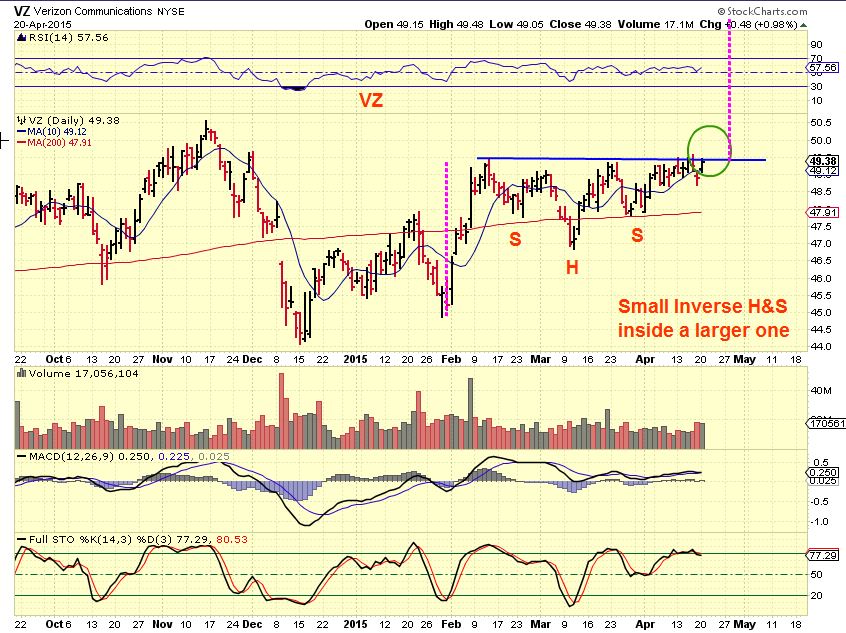
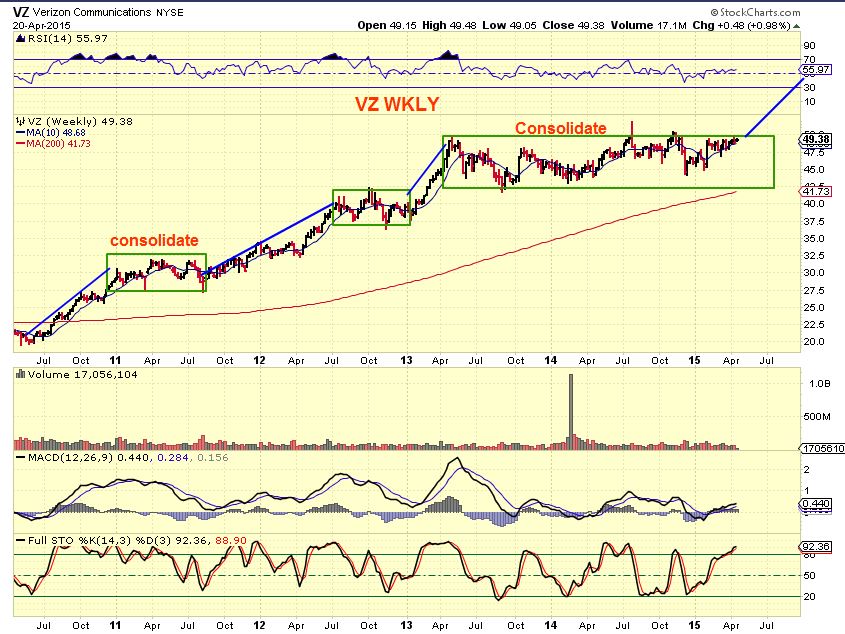
VZ reported good earnings. It is not up much pre-market , looks great for a possible break out higher. Look at this on a 5 yr weekly, and it may be a long term hold for investors.
VZ 5 YR WKLY– Long consolidation before a run up. Is it ready now? A drop from here would be a buy at support too, for longer term buy & hold investors.
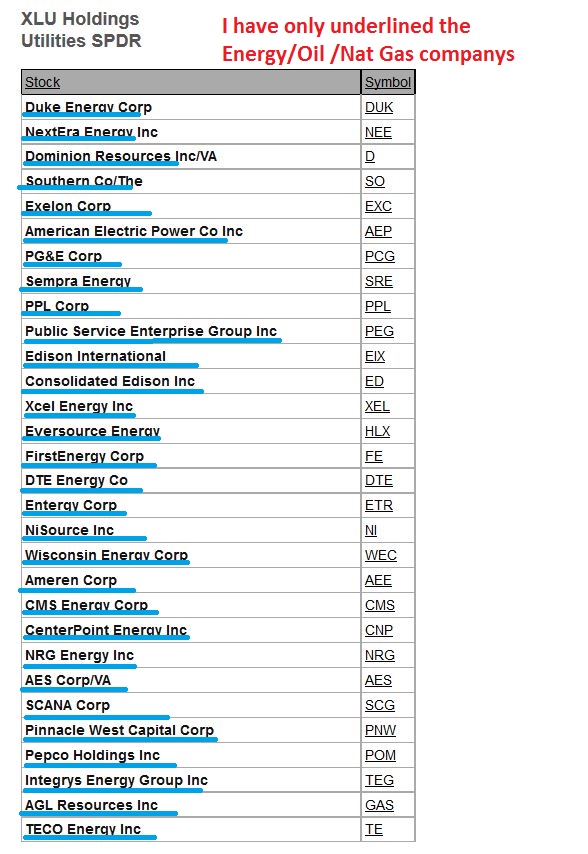
There was a discussion in the comments about XLU and do I think it looked good. I said yes, it looks like a good set up , I loooked at it this weekend. Then there was further discussion about seasonality & risk. Maybe a look inside of the XLU will identify why I think it may begin to do very well. I will only underline in BLUE the energy stocks or energy holding companies (And I have mentioned that I think Energy will do well going forward).
These are the XLU Holdings


great variety…. tx CF 🙂
Ur welcome MARIA – so many nice set ups its kind of crazy.
AGREE!! :o) LifeIsGood
Thanks for going in-depth on my XLU question Alex. Your thoughts on the seasonality of its holdings was insightful.
Hey CS
I was actually quite surprised this wkend to see the XLU list above was all Energy companies and Energy holding companies. It does have a good seasonality in Spring if you go back & look at it, but Cason mentioned concerns or risk (which I haven’t looked in to. I am Bullish on Energy recovery at this point).
Not quite sure I understand. They’re power companies, they make energy from oil/gas; they don’t find/sell oil/gas.
Now I don’t know how rising oil/gas prices actually affect them (haven’t studied it), but intuitively I’d think it hurts them; but that could be wrongly simplistic.
They probably do a lot of hedging, so maybe it doesn’t matter much. More to do with interest rates and general economic activity, I suppose.
Yes, Maybe due to hedging. It is odd, but in the past OIL & the XLU have risen together longer term . (Oil went $75 to $110 & XLU kept rising too)
This summer, that was definitely the initial reaction, when OIL prices dropped AUG to Dec , XLU had a stronger run higher. Now Oil has been rising off its lows since MArch 16, and XLU is stable & rising too, and Now the XLU has a really bullish looking chart, but so does OIL (And I expect NATGAS to turn bullish too).
It will be interesting to see how they all play out going forward, but Energy looks bullish to me in many areas (Even Uranium & Solar)
Looking at the long term charts the correlation seems weak. But there may be some extra oomph there short term. Depends on how they’re hedged, I suppose.
Yes, XLU is a rather tame mover, I think that contributes to weak correlation. XLU ‘s best move recently is $40 to $49 , but it took 5 yrs of uptrend to go from $20;s to $40’s ( Double)
I’m used to GDX , does that in months : )
Yeah, utes are not the normal playground of speculators, for sure.
Just a Note: On my VZ chart above, I drew 1 form of price projection, but the inverse H&S price projection is about half that length. Normally you would take a measure from the Head to the blue line and add to the break out on the blue line up.
Every morning we are greeted to news about trouble in the middle east. All this unrest should spell continued higher prices for oil/energy.
GDX could be a pop and drop. Suck in all the longs on the breakout. I’m waiting on the miners. For now.
Only thing miners are doing is putting people to sleep. Zzz…
Coal’s looking crappy again. I got stopped out of ACI. Others look bad again too, like ANR.
HHHMM, Didnt notice that, ACI & ANR suddenly dropping (BTU too, but looks like a possible wedge may form )
Failure at the 50 dma, yet again. Coal is one to watch still but it has some proving to do before it looks real good.
Both had bad news yesterday and today. Stopped out of both.
Sorry that happened Tony. I still have a little KOL and BTU and I’m hoping I don’t get stopped out. Lately it seems like the coal sector is like the gold miner sector, never getting any traction.
Just part of the game. Unrealistic to think all trades will work out.
No, stopping out was good here. C’est la vie
Looks ugly now.
Agree. I’m selling my small BTU holding, will keep KOL long-term for industry sector exposure and it’s a small position. I’m starting to believe that coal won’t do much anything this year unless inflation expectations unexpectedly rise and cause a general stampede into all commodities.
REN & GURE ….great runs, but that cant end well : )
REN?
yeah, well it could keep rising, but when I look at it, its up almost 200% since April 1. I can just picture someone buying it now and it pulls back 50%
Something like ZBB ( not bad if you buy it low, just if someone chased and bought near the highs. You get cut in half.
Me too, I drew this when it was at $1.00 – Waiting for a pullback that never came. : (
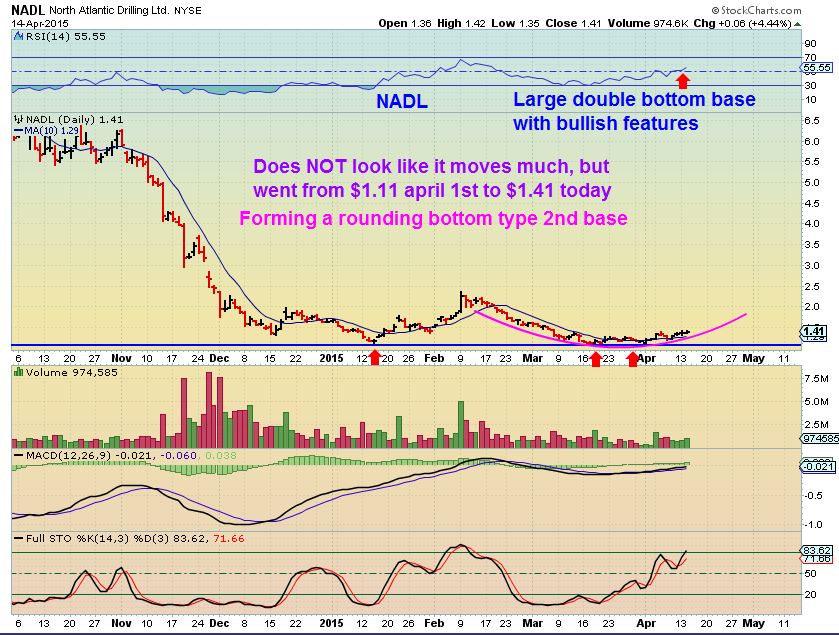
NADL looks very similar, prior to the POP!
yes, I bought NADL and HERO in similar flag type patterns (hopefully 🙂
MPO looks similar. I got in yesterday after the successful retest (so far) of the 10 DMA.
Yes, MPO looks good. these little flag plays look good (Could drop to the 50sma, but look pretty good either way really).
ZBB is very attractive if it pulls back a bit more (on low vol) and retests the 200 dma at about .80 (by then) which is also prior resistance. Keeping an eye on it.
CBAK too
I liked FCELs volume yesterday…keeping an eye on that too
Ooh yeah. That was a tricky one; if you didn’t either buy before it got to the 50 DMA at Mar low or buy after the surge thru the 200 DMA without much consolidation there, it just kept running away. No good low risk entry on that one.
I was actually watching CBAK in that Feb run up & pullback (Cup), but it had NO VOLUME back then.
It started moving higher on 32,000 and 50,000 and I dont buy stocks with vol that light. Then it started picking up , but it was too late.
Yep, another tricky part of that, for sure. You had to just be a bit reckless and “hope” to win there, it seems.
Yeah, I’ve been watching REN as it relentlessly runs away, without me. Still like it on a good pull back. Great volume on this surge.
Not too crazy about the $NG action here. Needs to retake that 2.60 pivot (which has failed so far this A.M.) and close there to make me feel better (sorry, maybe that’s a bit obvious). Otherwise it’s looking like a failure at the 20 DMA. I still have a little UGAZ position barely in the green; holding while we’re above the 2.475 low.
F.W.I.W. – For the bigger stocks, I think EA, PANW look good.
My purchase of NADL yesterday has not turned out as expected, but I am holding for now. : )
Yeah, so far doesn’t look too bad on a 60 min chart; consolidation. Hopefully just sideways to the 10 dma in this range.
Just got into NADL today at 1.54…where do you guys have your stops on that one? Just curious…
I’m gonna give it some room down to about 1.35 or the 20 dma, which is also a seemingly important pivot pt (thereabout).
Yep was thinking the same…thanks!
50DMA is at 1.49. 10DMA at 1.47. 10 day will cross 50 day soon. That’s good. Hopefully will hold around those levels. If it breaks through both I’ll likely be out.
Yep, there’s a tighter stop approach that is valid as well. All depends on your risk tolerance, time frame, position size, etc.
It also depends on HOW it gets there; vol, time, etc. So stop setting is best approached somewhat dynamically (regularly reassessing) but then adhered to in a disciplined manner.
Hi Eric- It also (for me) depends on entry. I bought my first order in the $1.20’s and second order yesterday $1.60’s. I too am looking at the 10sma and 50sma both at $1.47 ish area and how price might approach that area (light or heavy volume). I would likely stop out near break even for both trades added together. ( $1.42)
Thanks alot for your input! Much appreciated
Bought it as well yesterday after it dropped off from its high.
Hi Alex,
Just my 2 cents worth:
I am seeing Oil (USO) in a bull flag here for wave 4, if it breaks resistance that run should be a wave 5 final top for a Major 1 top. Then an A B C down for a Major wave 2 down.
I will be playing that final wave 5 up. 🙂
Thx Ken,
What time frame? Daily?
I was thinking a wave 4 drift lower would be a ‘test’ of the recent break out from the base @ $54ish, then another run higher. Pretty much the same thing as you – I think .
I am using the USO daily in conjunction with the 2 hour. USO seems a cleaner chart in my eyes vs. $WTIC.
USO Wave 4 could drop to the 9 DMA, USO 19.17, which is also close to the support line. If we drop Below support then …….
Gotcha, I see it – thx
Also – I believe Maria’s question is directed to you, not me. She uses E.W.
me too. what wave do u see GDX & SLV in …
Hi Maria,
I really like our fearless leader’s Mon. morning GDX chart. GDX close above 20 I will be a buyer. 🙂
GDX also beginning a wave 4 bull flag from the ICL on Mar. 9 ???
lol.. is that a question? Thanks… would you mind looking at my chart&providing candid feedback? i worked on silver last night & i believe that is in wave 4 right now-finishing the last leg up before heading down for V. Thanks very much :o)
I assume (attached chart) I don’t see what you’re seeing?
Hi Bill,
Yes, very similar. Especially the bull flag.
I have the top of wave c of 3 last Thur. at USO 20.22.
Currently in a Wave d down now as a possible bull flag.
If we break the bull flag and break the resistance line that will be wave e of 3.
Then a A B C correction down for wave 4.
Then a final 5 wave for the top of Major 1 up.
Isnt the way you have this labeled showing that wave 3 is the smallest wave here? I dont think that is acceptable, so I believe it would be that wave 3 is the entire move that you have labeled 2-5 , and we are in wave 4 now .
Please feel free to correct me if I am wrong.
I’m not a wave guy at all. Just guessing, try to get a handle on the post
I’m not a great E.Wave guy either : ) I was thinking we have another wave up ( in wave 4 down now to test the break out, one leg higher, then consolidate in a-b-c type move?)
So you see it like attached? Is wave 5 as long as wave 3? Lets hope so
Small cap energy seem to have affirmed your theory before oil sold off this afternoon. I wish I had been nimble enough last week to peel off. After the upcoming wave 5 up (not too far away I hope), will definitely be trimming some.
DNR seems like a good entry here (above about 8.40 and/or 20/50 DMA); I have a position 8.28 basis.
Miners trying to move higher with GOLD? SILVER down again
Tough day for some energy stocks. EXXI and RIG don’t look good. BAS and SFY holding at trend lines. EXXI at 78.6% retrace of the last move up, thats a big correction compared to the last two. RIG fast approaching 78.6%
EXXI and GDP right at their 50DMA.Maybe a quick drop below them tomorrow and then a recovery?
Its always so hard. You don’t want to get stopped out so you need a generous stop. Then what takes you two weeks t make is shot in two days. Arghhh…..
I feel you! Wasn’t sure if I was getting ready to sell at the bottom or preventing further losses. But yeah, wish I had played last week different now.
Alex…. when you have a moment, please comment on Sprint
Hi Chris,
I’d like to help, I’m sorry but I have no idea what you are asking. It would help to know what you want to know, like are you in it ? Are you looking to buy? Etc
So as a guess –
I wouldnt buy unless it gets back over the 50sma.
If you own it, I would sell if it closes under the 20sma or starts to sell off from here. It icurrently dropped to the 20sma , bounced off of it and it heading back towards the 50sma.
Hope that helped a little.
Looks like $54-55 area in oil will get tested sooner rather than later. Another surge lower. CLF straight down to support? after morning pop.
Alex, thanks for another great report. Rough day for me, hopefully we are all on point with oil pullback and then surge higher theory. Even though NAZ and friends are still moving higher, noticed today that large cap Biotech (IBB) outperformed while many small caps were unceremoniously destroyed. Point being that divergences continue to present themselves at times, and specific stock charts are very bullish, but you can no longer just throw darts and know that everything is definitely going up.
I hear ya, I had some pullbacks too in NADL, GDP, SFY today , but its fairly impossible to play these fast movers & sell exactly at the tops. Same with Miners.
Check out LGCY & ERF. I owned both, if I sold them last week , that would have bummed me out. LGCY hit its high today . They move at different rhythms at times. ( I think we’ll get another leg higher soon).
Yep. SFY in particular was tough for me today, dropped below where I was comfortable %-wise on giving up profits, but was still above mvg avg support. Had to debate potential selling at lows but guaranteeing some profit Or staying prepped for 2nd leg
I chose the 2nd (but not before plenty of internal debate).
Alex and/or Bill,
Please tutor me on how to upload one of my Stockcharts charts to Disqus. I have run out of patience.
Thanks…grrr
I use the Windows Snipping tool to capture a screenshot of Trading view. I save it as a jpg and then use the little icon bottom left to upload it.