Yesterday it seemed like anything China was the place to be. Many Chinese stocks started to really POP, but does that mean we should jump on board and be buyers at this point? Lets look at a few charts …
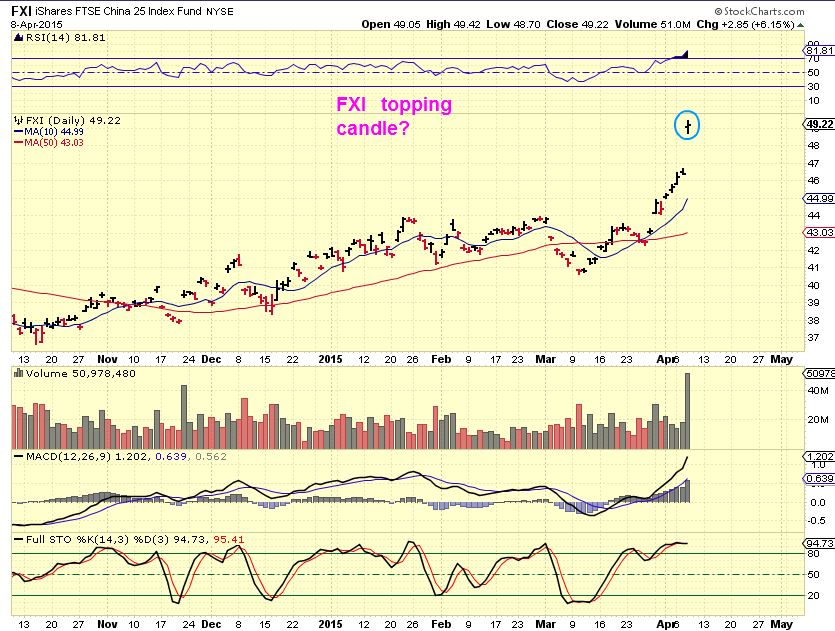
FXI- I am looking for a reversal or another gap higher (3 gap play?)
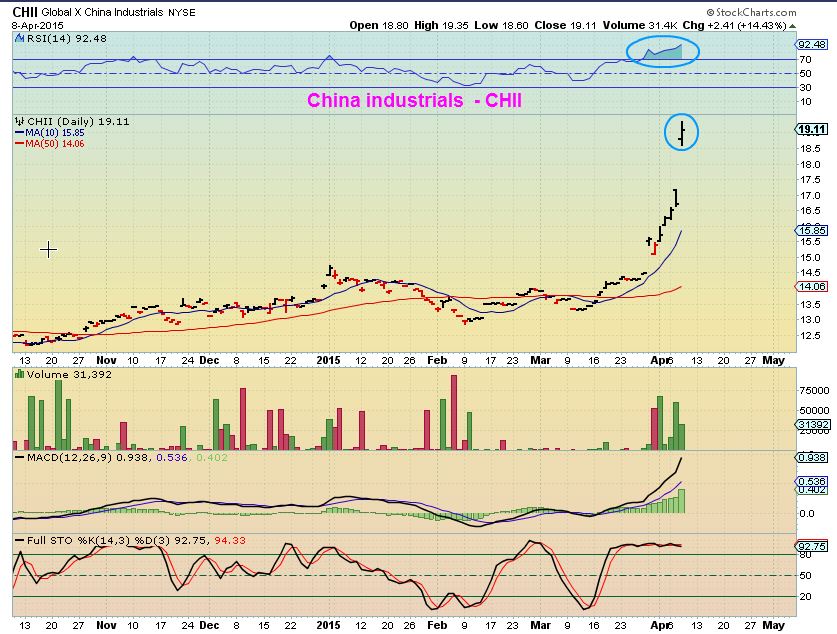
Other Chinese ETFs look similar, this is CHII –
FXI, CHII, HAO etc etc
Huge Gaps higher like this with that volume are usually exhaustion gaps, so if you ‘short the markets’ – these may be great candidates as they return to normal levels. If they gap higher today , and again tomorrow? That is called a “3 Gap Play” and it is extremely low risk to go short on the 3rd gap higher.
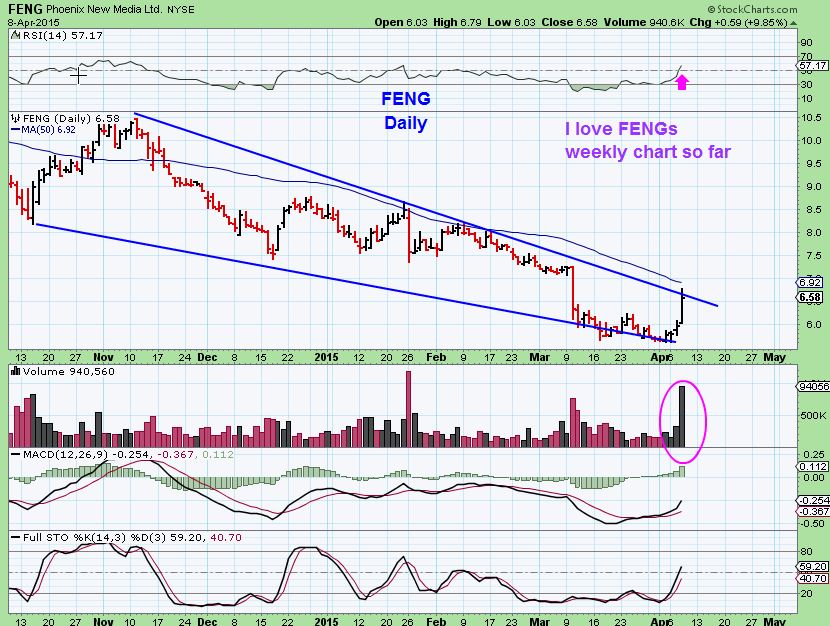
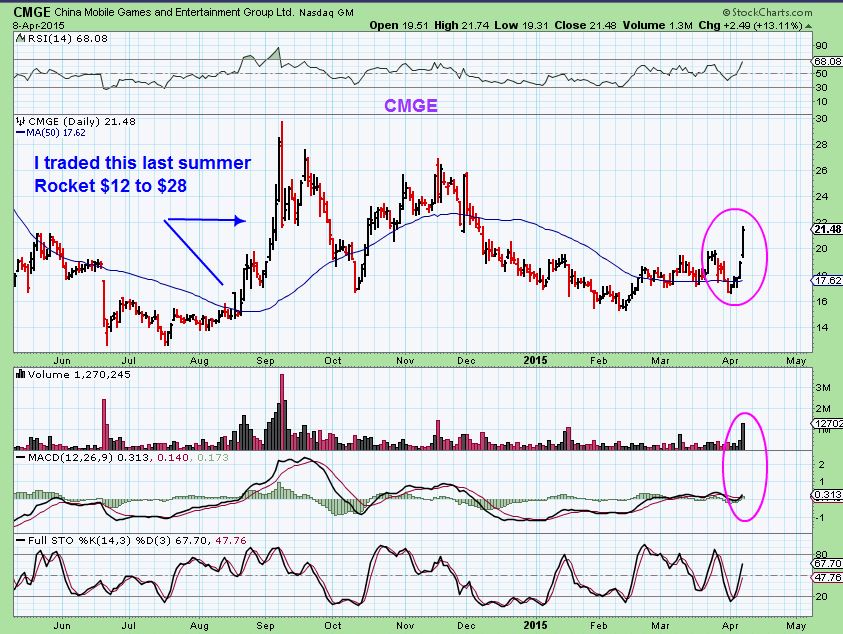
I mentioned in the comments section yesterday MANY Chinese stocks Popped huge. Some held gains , others gave them up ( See charts for YY, SINA, QIHU, CHNR, CHLN, YZC, YOKE, YY , FENG , Etc) Some of these stocks actually look like great set ups, but the overheated look of the above ETFs have me very cautious. Take FENG and CMGE for example:
FENG– this is the daily . Strong volume
CMGE
I mention this for 2 reasons. Some of the Chinese stocks do not look overbought, they are rising out of lows ( see YY, YOKU, QIHU, BIDU, etc) .
1. MAYBE this extra push gives the Chinese ETF’s the next Gap higher and last Gap higher, to set up the 3 gap play?
2. Some of these may still be trade-able this week for my faster – short term traders, or put on a watch list for a Buy the pullback in the future.
When I see stocks run like this, I like to watch the pullback ( 50% or so?) and see if a set up for a long position develops.
SPX, NASDAQ, DJIA ,ETC have been up one day & down the next. Still seeing many nice ‘TRADES’ & ‘SET UPS’ for traders in this volatility.
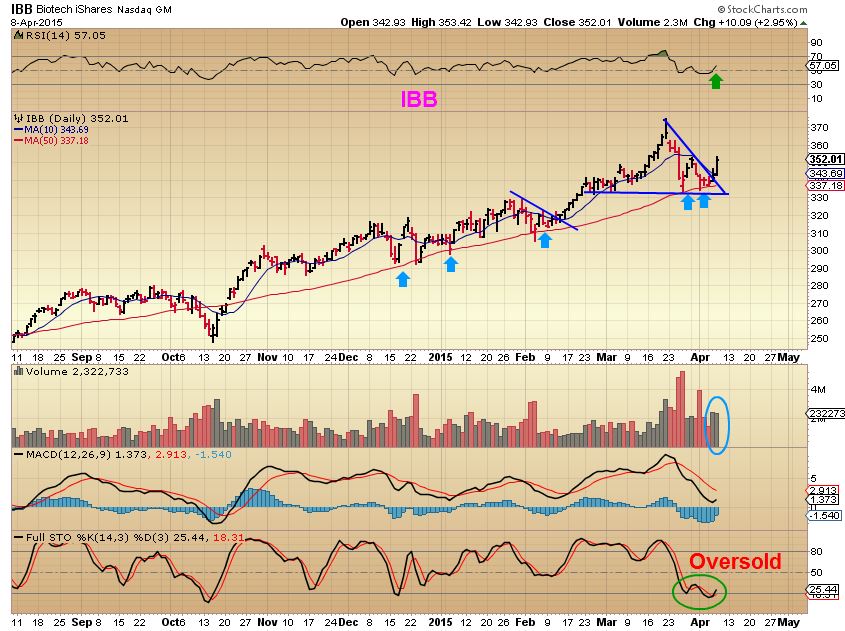
IBB also is interesting. It has sold off from overbought and is looks to possibly be setting up long. Note the 50sma & Stochastic.
Do you have a favorite BIOTECH that you trade? You may want ot check on it. Here are a few interesting ideas, and a small LESSON.
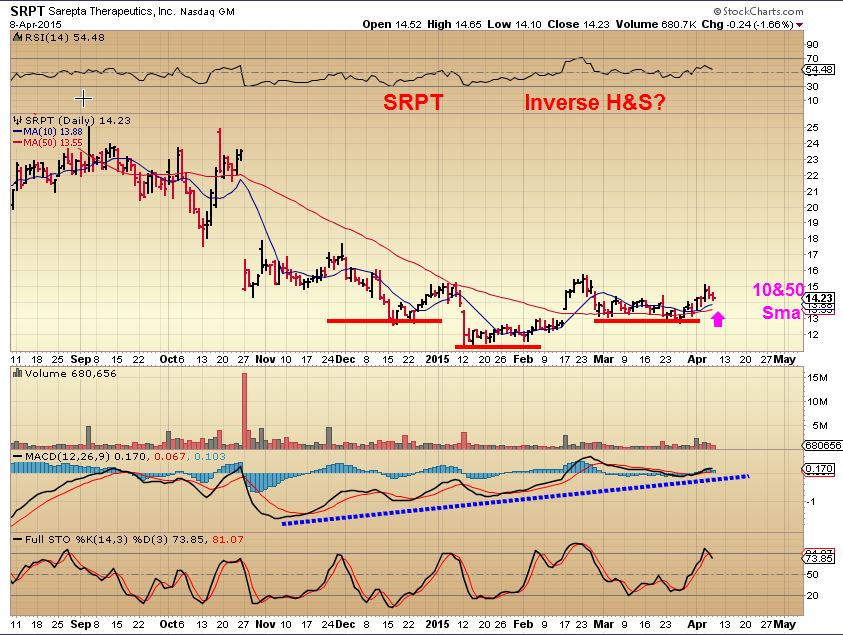
SRPT- I like the set up longer term, but this “Might” still drop to the 50sma. THAT could be a nice buy/ or a break higher.
HERE IS A LESSON: Not everyone needs to hear this, but there are some who will take a buy recommendation and get very frustrated when it drops in price. Please understand that when I recommend a buy , they are often still within bases – One needs to take profit if they are happy with smaller gains, or be patient and let the process take its course if the set up is not “broken”. Many of the stocks in these “Bases” of Energy for ex have doubled off of the lows. The NEXT buy (2nd) becomes around the 50sma . The 3rd buy can be break outs from the bases.
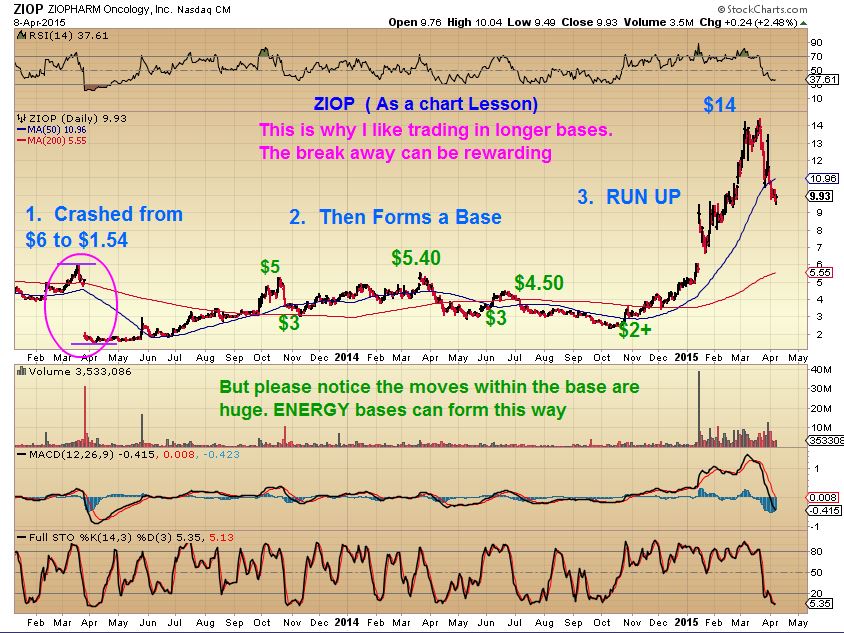
Back to BIOTECH/PHARMA sector stocks for an example . Lets look at a great base & then the RUN HIGHER in ZIOP OCCOLOGY. Since the moves within the “BASE” are large , you can trade the waves, or buy low ( like we did in ENERGY & we also did and will again in MINERS) and wait for larger gains.
ZIOP- Note: Inside this base- these “Swings ” are not 10 cent swings. They were $2 swings, like ‘cycles’ . Its part of the process.
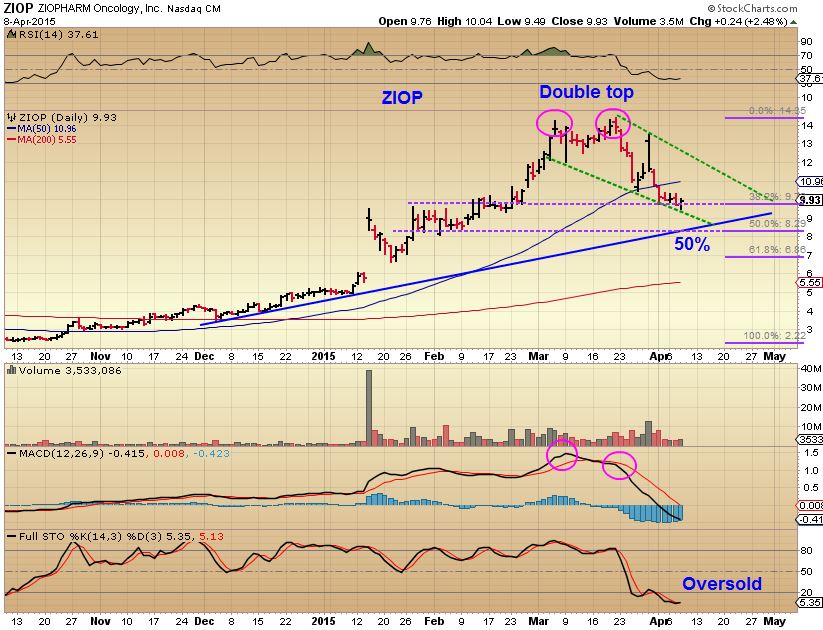
ZIOP -then had that great run up into a double top recently. It “MIGHT” be setting up for another run , now that it has pulled back & is oversold. Its at the 38% retrace & reversed yesterday (And IBB is oversold) . The 50% is on the trendline. so it might go there?
A trade can be taken, but I would watch this: It broke below the 50sma, if it tags that 50sma with light volume, a H&S may be forming. Sell.
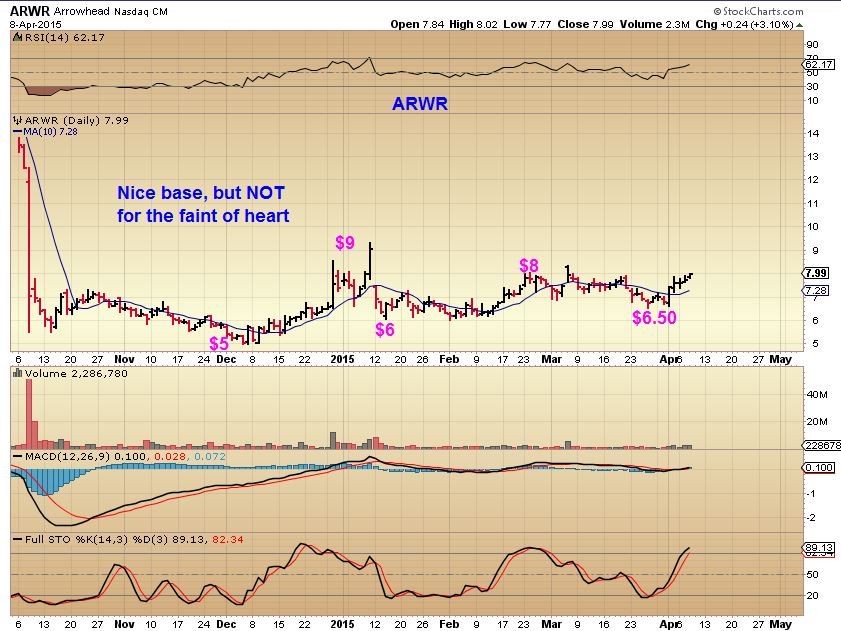
SAME LESSON with ARWR
I have been watching this. Crashed down, almost doubled off the lows , now forming Higher lows. It re-gained the 10WMA , so You could buy & hold if you have a longer time frame (Stop below the 10WMA at this point ).
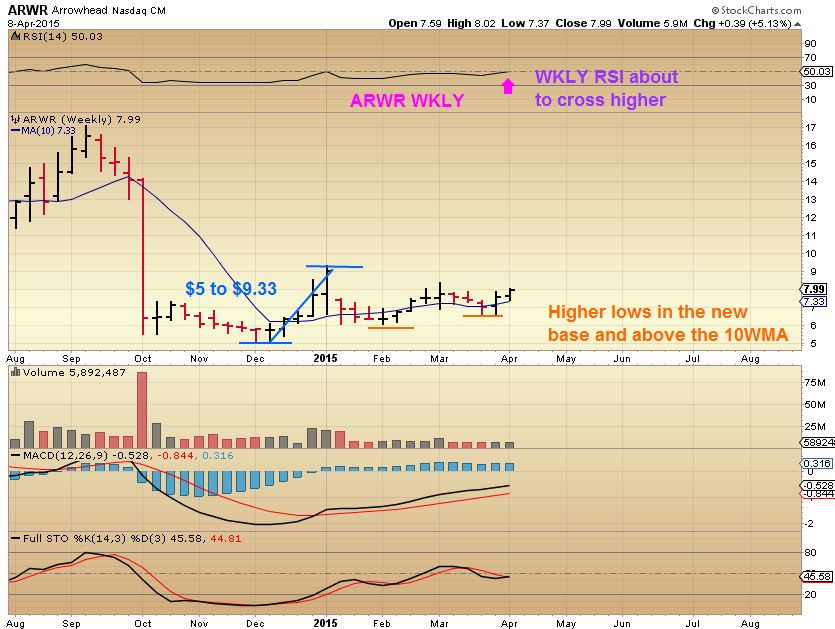
The LESSON? As BULLISH as I see ARWR, it is not an easy ride within the Base. $5 to $9 to $6 to $8 to $6.50. But if this breaks out & recovers like ZIOP? It goes to $17 again. If you bought the first lows @$5? If you bought the 50sma recovery at both of those higher lows ($6 & $6.50) or if you wait & buy the break out above $8-9…its still big gains in the long run. The Bigger Picture. The daily wiggles will make you emotional if you cant see this or….take some profits when they come along and re-enter later. THERE IS ALWAYS ANOTHER TRADE : )
WHY THE LESSON?
Some here are traders , apparently just trying to scalp gains without ever any draw down. It is important to know who you are as a trader / Investor. If you just want to hold ‘some gains’…. You need to do the old saying “Sell the Rips, Buy the Dips”. “Sell the Pops, Buy the Drops”. If your stock Pops 10%…Sell it if you are just looking to make gains. Then move on with your cash & Find another trade : )
Others understand that if we buy at a low risk buy point, we make gains, give some back , but should be fine unless the set ups are “broken”. Others even do nothing. They have a longer BUY & HOLD outlook, yet also do some selling & reentry. Its all good. For those investors that can be patient…. I think that based on what I saw & lived through in 2008 2009…OIL and MINERS made me great %-Gains at a time when I didnt invest a ton of money. It was very rewarding buying OIL & MINERS within ther bases amidst a lot of “Fear” in 2008.
ENERGY STOCKS are currently in Bases and Miners / Metals are too. When these break out higher , it will be quite rewarding, and I think they will.
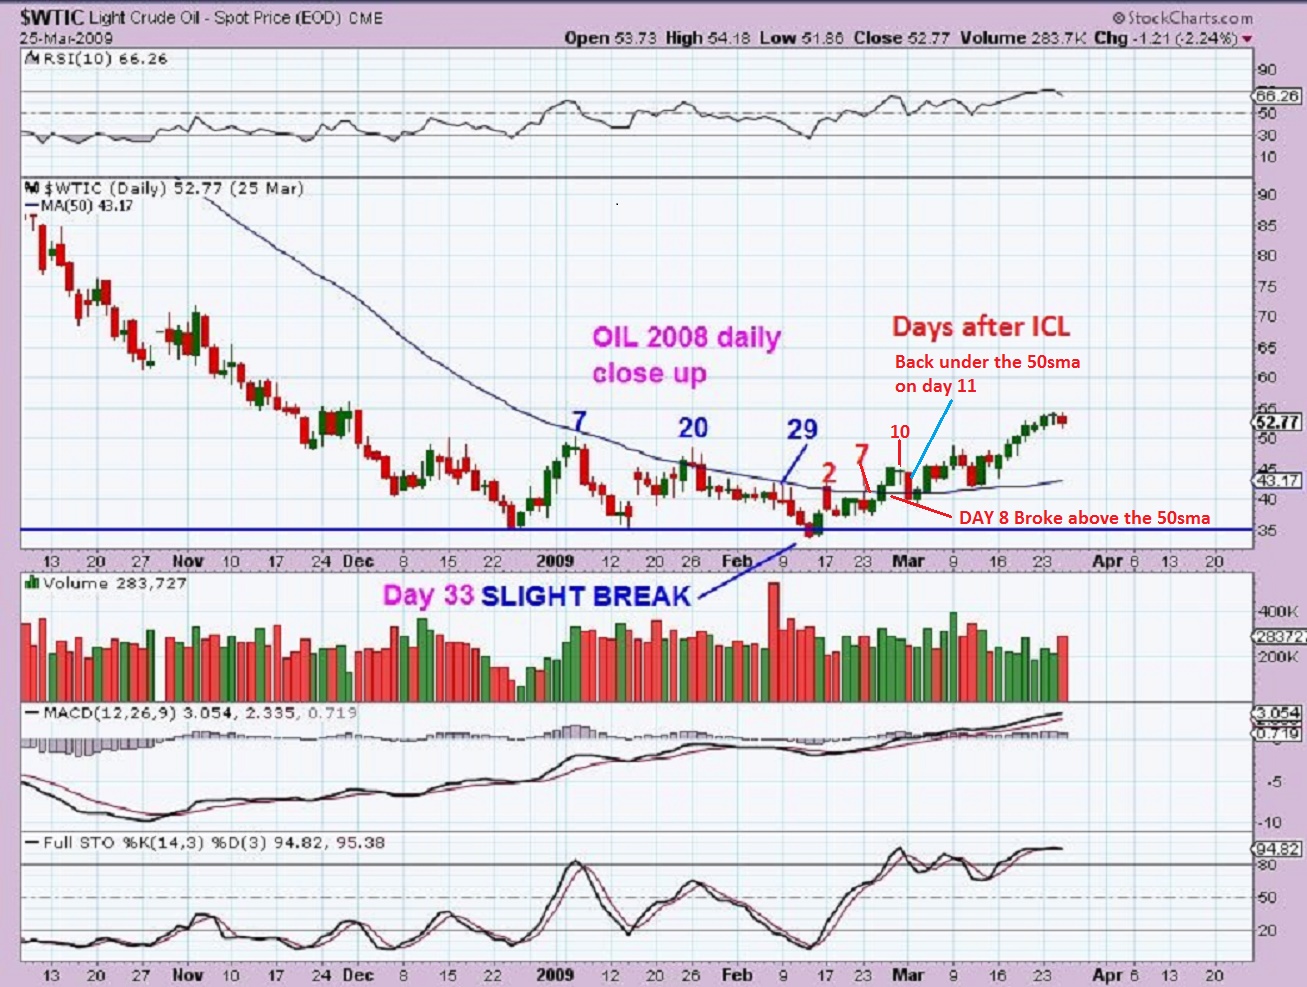
AGAIN I show OIL 2008 . Do you see how hard this was to ride? We see a 6 month base. All the fear, but Oil went from $35 to over $100, and some energy stocks were up 200 to 3500%. You will see …
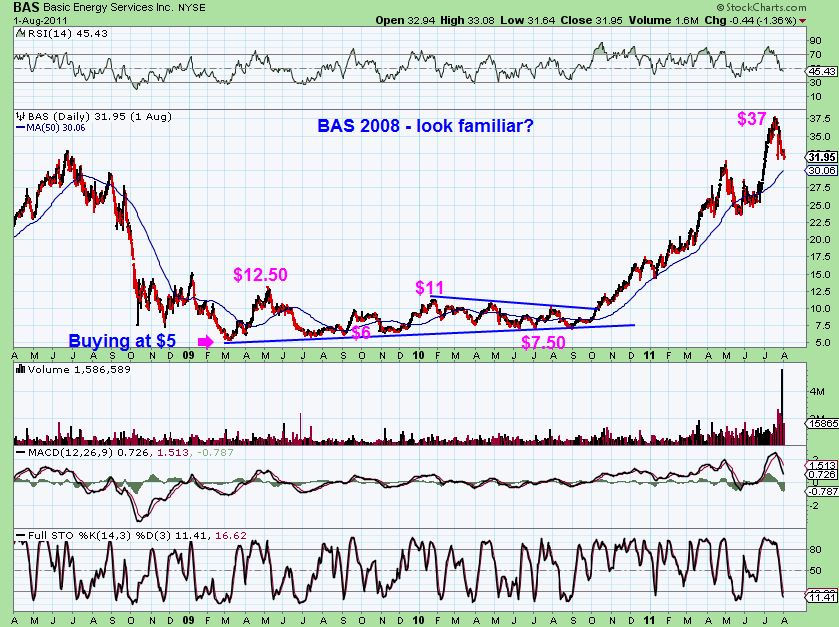
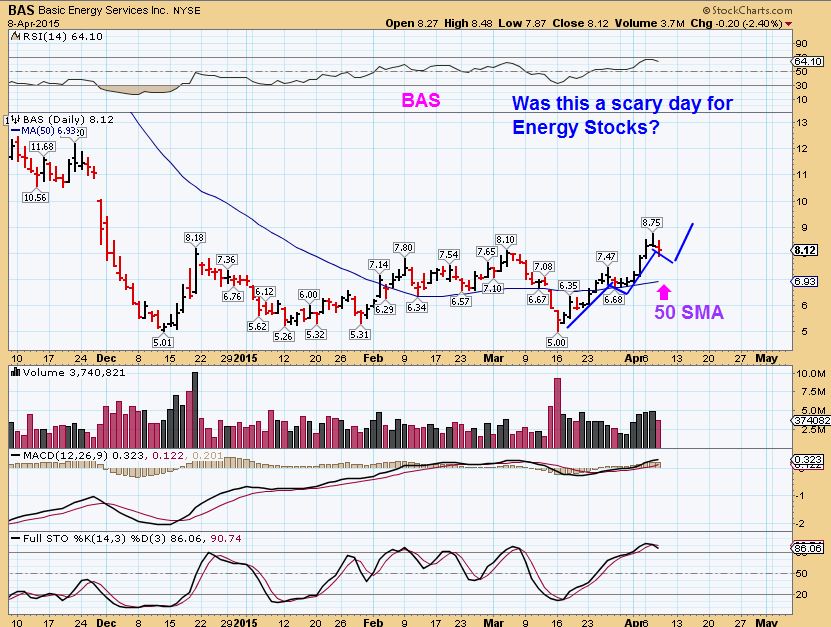
BAS– Now look at the very Trade-able Base in 2008 crash. yes, it was a long base and took a lot of time, but it was trade able and VERY PROFITABLE when it finally broke. Up 700% from 2009 lows
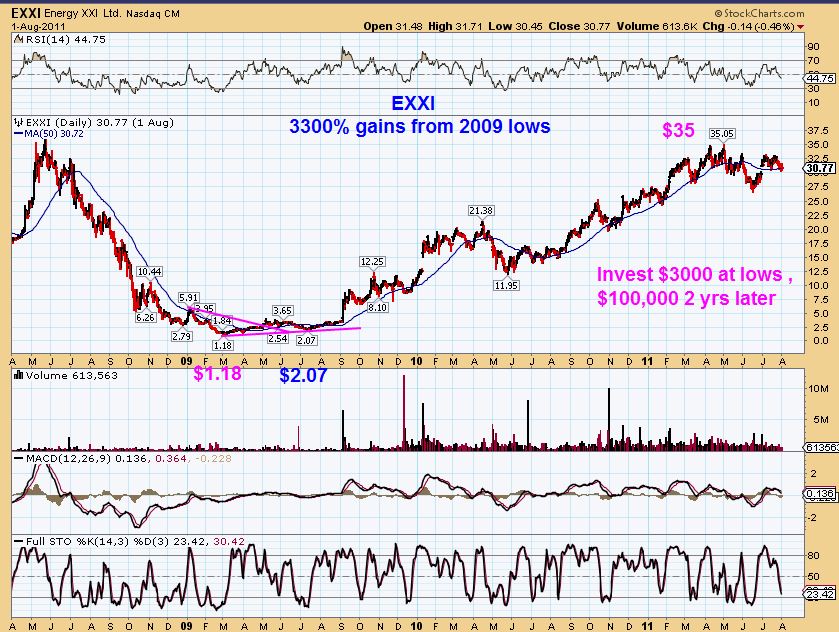
EXXI 2008 lows. 6 Month base with higher highs. EASY to buy & hold if you didnt mind a day when it went down 30 cents : )
HUGE GAINS later. Imagine if you put $5000 on the lows and went away for 2 yrs.
So anyway, I just want all to see the Big Picture as well as out daily / weekly trade set ups. We are a mix of traders and investors with various goals and ideas of how things should be. There are also various ways to get there for each of us. I both trade, scalp, invest …Sell the Rips and Buy the Dips…and hold on for longer periods of time. For ex: I have been in SZYM for over 4 weeks . I hold some BAS & EXXI from buying The Absolute lows in Jan and I dont count that anymore… I sold 1/2 of the original position and trade that portion. Etc Etc I invest in certain miners for 8 weeks at ICL’s, and I trade others like JNUG NUGT only holding for a day, 2? 3? 5? Its all about my immediate goals vs the big picture. I hope this has helped at least someone here . It even helps me to review the 2008 lows. I lived through that crash in Miners and Energy , etc and learned some great lessons.
I will release this for the sake of time (pre-mkt). It is not my complete report, so I will add to this post. Please refresh or check back later. You will only get 1 email alert per post, and I cant change that, but I am planning on adding more . Thanks!
~ALEX
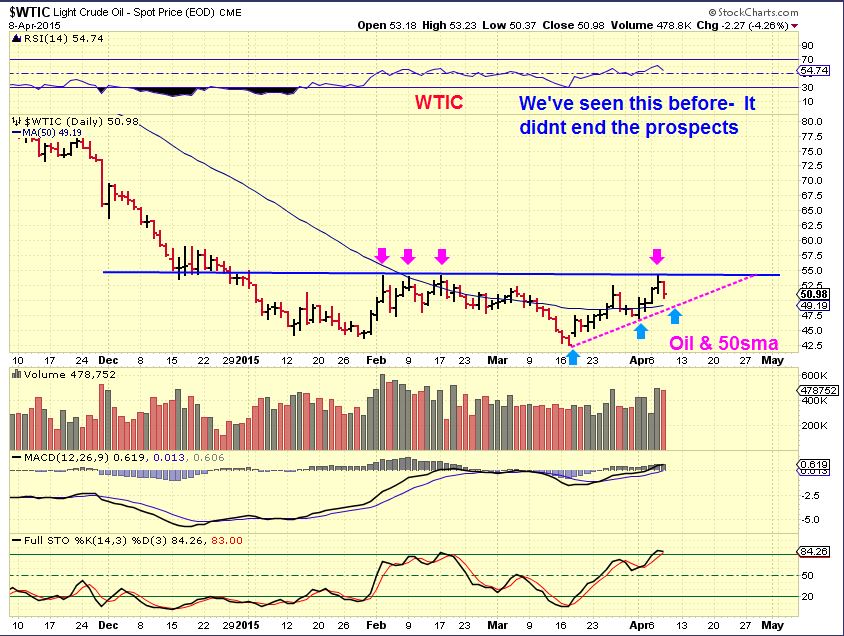
Lets continue with OIL. Yes it dropped yesterday , we’ve seen this before , its part of the Base. I think OIL wants to break out , but at this resistance area it struggles (So far). Still above the 50sma and a rising trend line. I ignore the “inventory is so big , Oil is going to drop to $30” Chatter. I have heard that EVERY week for this entire base. It’s still a healthy base at this point.
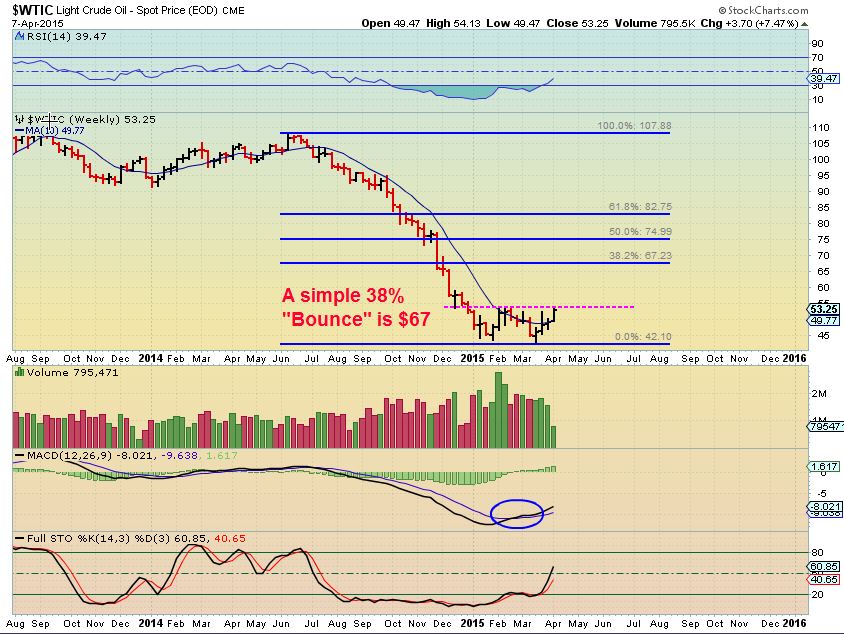
Again- the WKLY chart looks to be a double bottom , MACD cross, and could simply “bounce” a lot higher.
ENERGY STOCKS still ‘Basing” . BAS, EXXI, GDP , ERF, etc still above the 50sma . If you sold and locked in Gains- That is great, some of these are near their highs. You may get another buying opportunity on a pullback . If you are still holding , above the 50sma, that is too.
F.W.I.W.- I held REXX, SFY, & LGCY below the 50sma , because I got them lower ( I sold REXX) .
BAS – above 50sma
I have many thoughts on GOLD/MINERS. Yesterdays report covers a lot of it, and not much has changed. So far Gold / Miners havent dropped fast like they can, they have held up fairly well. I am still watching many things and expect that the next BUY for Miners will be really good.
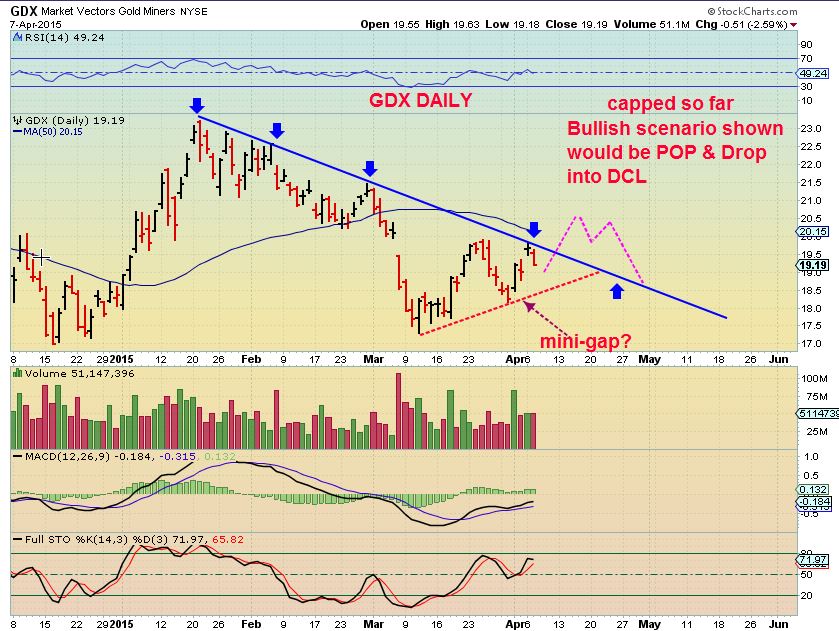
REPEAT yesterdays chart with new commentary
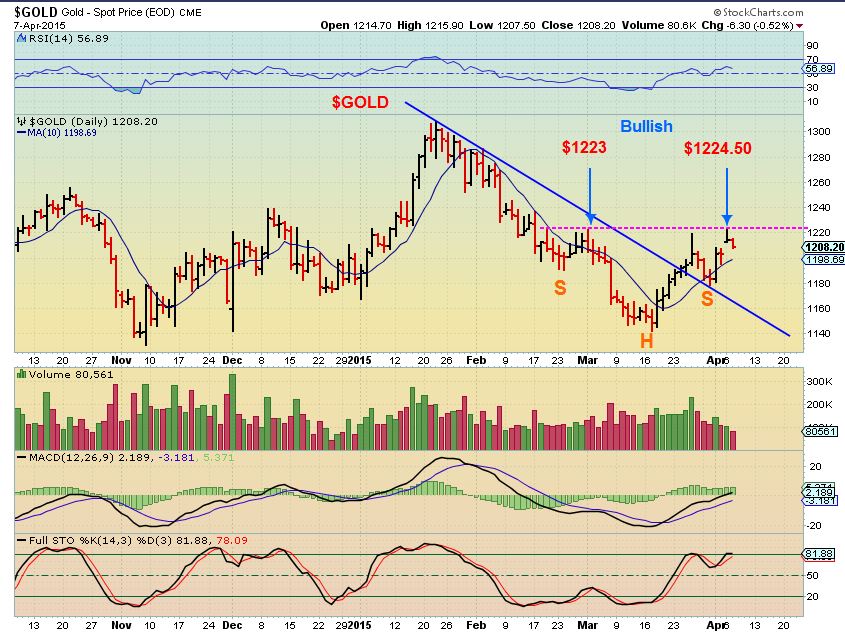
GOLD – dropped & filled that gap, that put it below $1207- the 50sma. It is also now below the 10sma.
1. It MIGHT be starting to drop into it’s next DCL (Daily Cycle Low) . I would LOVE to see it drop to that trendline & make a higher low, to scare the sentiment back to negative. Shorts would enter & cover later.
2. It MIGHT also break higher, but I think that would be a false break out & then drop to the DCL.
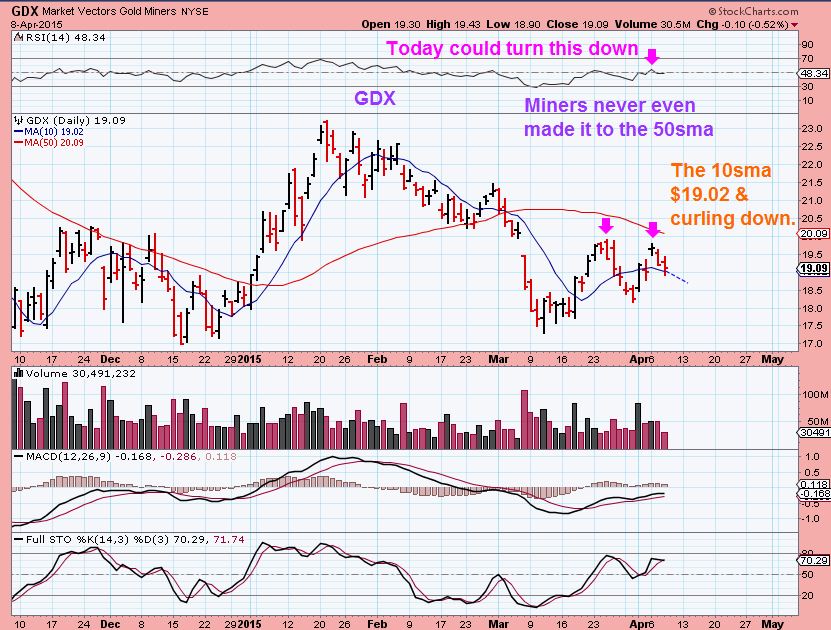
MINERS – Sold off a little . Will it break down into a DCL. It is getting late in cycle timing.
Yesterday I drew this …possible break higher & drop to trendline for a DCL
SO I still see a buy opportunity coming in Miners. I am trying to be patient. I look at individual miners for clue- I see internal weakness, not real strength in the recent moves.
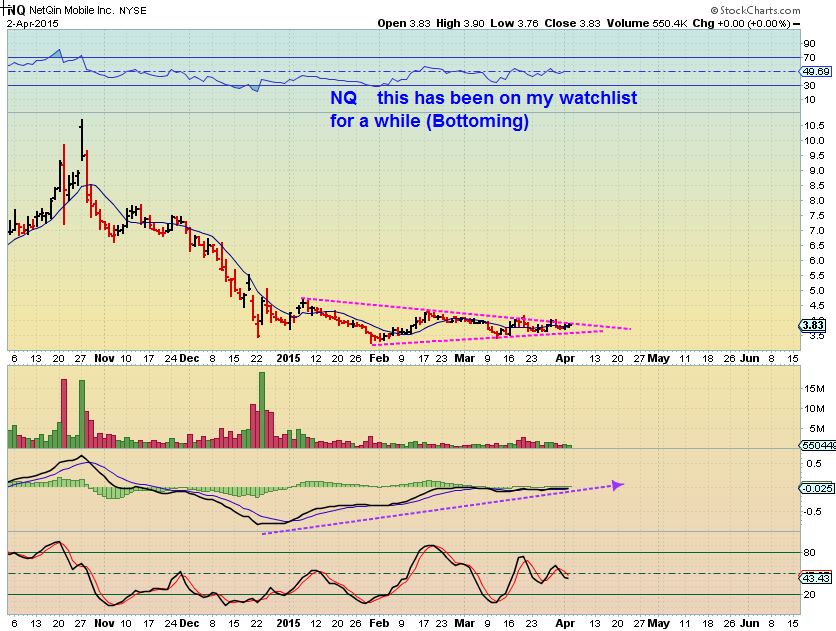
TRADERS: From the weekend report, I still like these set ups
NQ..possibly breaking
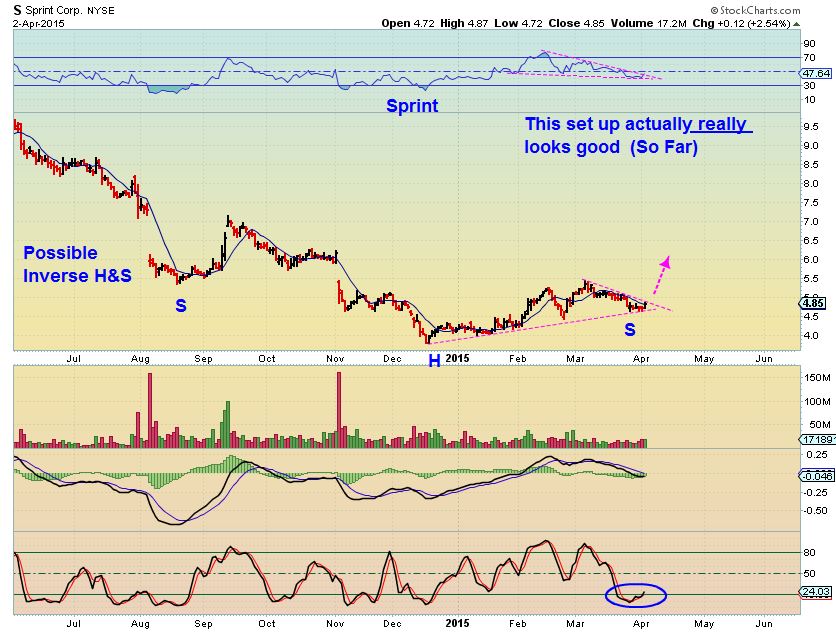
S- broke this triangle and is back testing right now.
I had a chart for HYH, cant find it…I like that set up , along with XNET, STV, CUBA, MIFI, SNSS, VIMC,CMGE, LEJU, JMEI,
Some are setting up now with light pullbacks, others are breaking higher . BEST WISHES!
More Of The Same 
 So Many Set Ups
Scroll to top

Thx Alex. Definitely helps to know that holding during these times is difficult even for the guys/gals who do this full-time. 🙂
G-Morning Deshy
For sure! Looking back at Bases and seeing how they go sideways and then break out is the easy part. Living through them , there is always Uncertainty. The “NEWS” will scare one out of position a LOT (especially Gold/Miners). It is NOT easy, but can be very rewarding when they play out.
Alex, WTI forming H&S? What do you think? See my chart below……
Anything is possible, but I dont think the MACD supports a weak right shoulder (yet)
The Energy stocks arent seeing it either (yet) SFY, ERF, EXXI, BAS, etc
The report has been updated…please hit refresh and read the addition below my name- Thanks for your patience.
Alex, any thoughts on 3D printing stocks. These seem to be shaping up well, though some still a bit early in basing process. DDD, SSYS, ARCW, VJET, XONE
yes, they look interesting.
So many areas look really good, lots of stocks really popping.
Another report slam down in NG..jeez..
I know , huh?
I havent been covering NATGAS , except to remind that we havent seen the double bottom “Shake out’ type lows like we gig in OIL, CRB , and GOLD WKLY.
I still expect that it could happen and todays lows DO break the $2.57 lows of FEB…so NOW I might start thinking long (And yes, I’d still be nervous as next Thursdays report comes out : )
Another fabulous report, Alex, particularly the lessons. This information is worth a mint to beginners.
Thanks You Simonsays – And nice to hear from you again – I remember you from way back 😉
I was hoping those type of reviews would help someone other than me. I do those mental exercises all the time – to try to keep me alert to future possibilities Good & Bad
I am beginning to like the energy sector. More invested in GDP, rexx, exk and picking up some bas now. I am getting convinced to hold on to them. Short the miners via jdst and dust. I think we are going lower there. It is almost like a pop and drop on the news and usually everything gets retraced
Hey Marinho
I am weary on the short the Miners, only short term. Todays volume selling is VERY light. That doesnt mean it cant pick up at any time, I’ve seen that too, but I look at the moves of GDX Nov – Dec 2014 and it just kept Popping & dropping , and Popping and Dropping until the end. Drove us all crazy.
I also like the charts of these Energy stocks . They really are (SO FAR) healthy looking base action. Bases can last for who knows how long , but when they break upside , the gains can be exceptional.
Actually GDP just popped nicely as I was writing ; )
I really like the set up on DQ as an energy stock, but it moves like a 3x ETF in both directions. I really like the pattern on a 6 month chart though. Good volume today too.
DQ has good volume but is way above the 50sma. Could go either way from here. ANW just below the 50sma? Did you see MCP?
I LOVE the weekly chart of HERO
DQ ER on April-10th just a heads up 🙂
Always Good to know….Thx ASH!
I bought back SFY, BAS, EXXI Yesterday afternoon. Looking good. Looks like REXX and EXXI getting support at the 50sma. Still have some cash. Alex, what looks good right now?
Its a tough call because they are mostly in the point of consolidation. I like KEG s consolidation, but is it ready to pop or just keep going sideways? I like NOG pushing recent highs, but it can also pullback.
Tough call till they act
GURE looks very ” interesting” . SD? KEG?
EDIT: volume is too light on GURE…sorry, didnt notice that before
What do you think of RES? I had it twice and twice got stopped out. Man missed that one.
Its great, but I think that one could pullback soon.
looking on just a 1 month, it seems to be fulfilling a very extended A-B-C
Or
6 month – Doing a 1-2-3-4-5 and the 4 was only 1 day? Heading to fill that GAP from November.
Anyway- looks great but I think it might pullback
MARINHO
I just want to throw this out there and you can do what you want with it.
I am looking at the DOLLAR up about a dollar – and GOLD rather ignoring it . Worse than that, I see GDX down on 6 million at lunch time. That is very rare. It often has 20 million at lunch and 4o million by the end of the day.
Dollar up BIG, GDX ignoring it , and I see some green Miners ( see SSRI, GORO, AUY, NG etc …reversals to green).
Please Keep a tight stop on the short positions.
Also noticed actual metals are underperforming miners past few days. Silver getting crushed recently but most miners didn’t care too much. Maybe they have priced in the bad news at this point? Lends credence to theory that GLD could just bleed down to 1155 trendline for DCL vs. epic drop like we are used to.
Anyone that usually uses options on GDX, etc needs to be wary – bulls and bears both bleeding out in current action until directionality is decided or DCL/ICL is put in. Leveraged ETF bleeding also.
This was a great heads up, Alex. Gave me confidence. Thanks!!
Pull up a 3 month chart with a 50sma of AKS, X, STLD – nice setting up
Fridays is a ‘rest’ day, although it looks like.
All have a good weekend, I go to sleep. It’s soooo quiet ???