I was not so surprised to see the Energy sector doing so well yesterday. We’ve been expecting that next break higher for a while. I will say that I was surprised to see how quickly the markets shook off that jobs report , however. I mentioned in my weekend report that there were many nice stock set ups, so it was puzzling that the markets looked ready to break down. Well, just like that hypnotic dance forward in a conga line, the buy the dips crowd didnt want to skip a beat…
NAZ from my wkend report. I thought a gap down could break this wedge
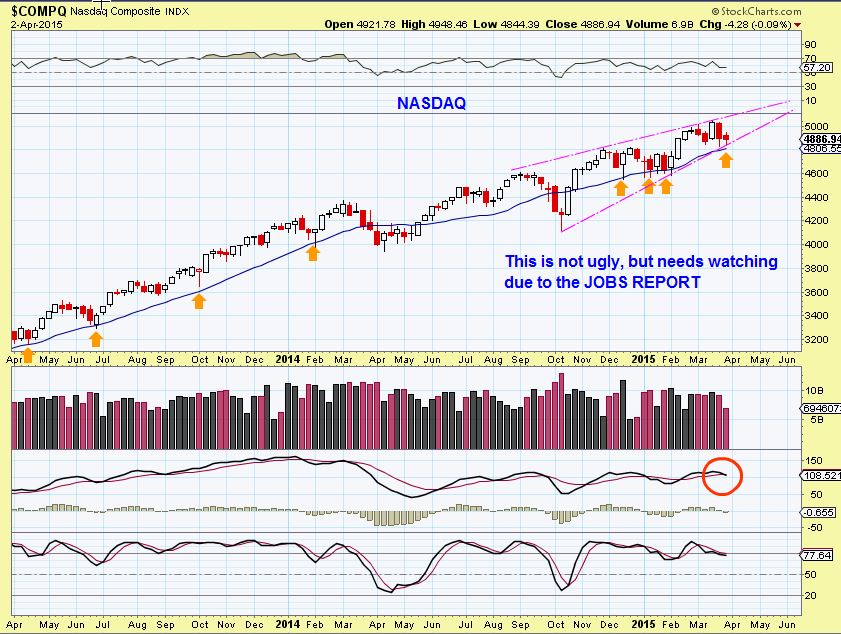
Yesterday we saw a gap down and then the reversal higher, but I still want to point out this important point …
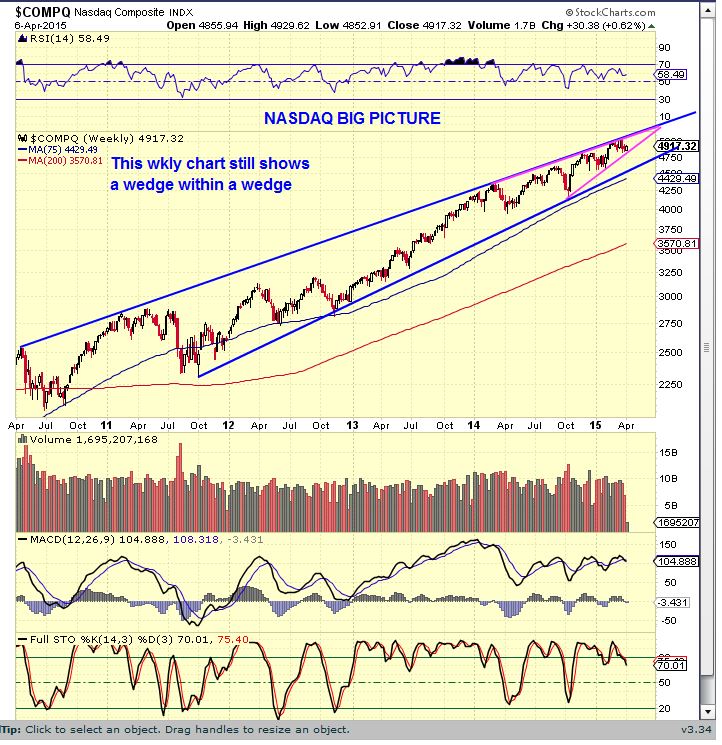
NASDAQ WKLY – we are still quite close to the upper limits. The markets can just keep riding along the upper line, but the Magenta Wedge looks only 1 or 2 weeks from topping.
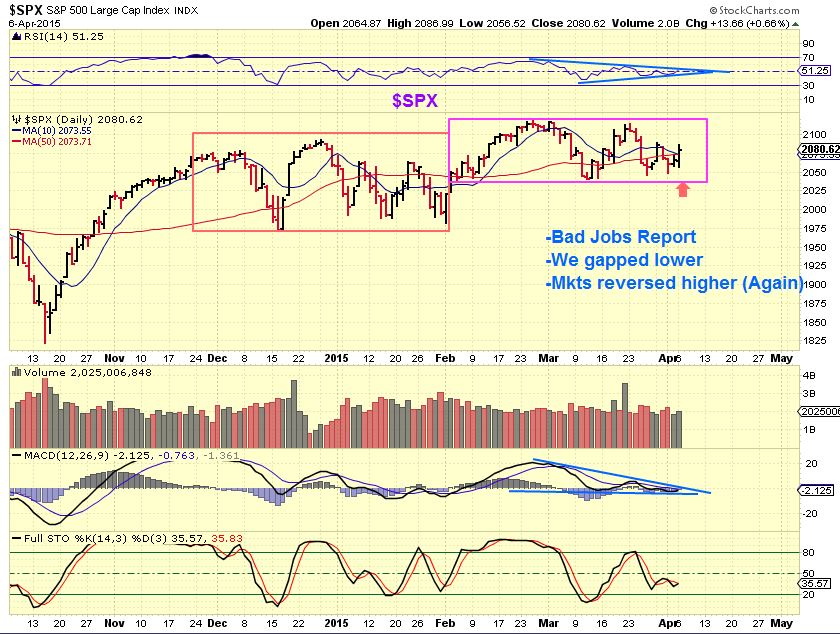
SPX– The Wedge is still there, but instead of just continually pointing that out , I also want to point out that 3 plus months into 2015 the SPX was break even Monday morning. This 4 month consolidation “Could” burst higher and run, changing this into a channel, but it is less likely with the internal weakness seen.
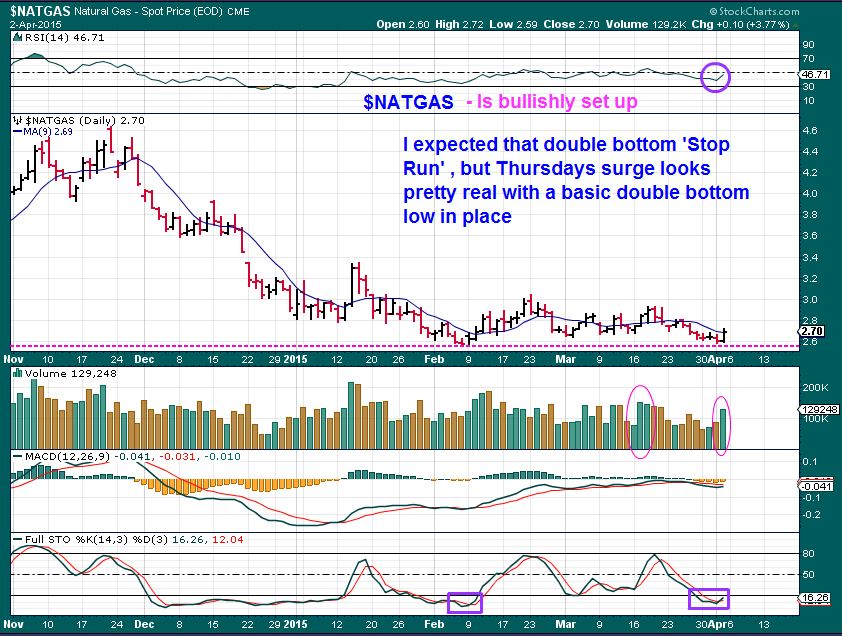
Nothing changed with NATGAS (this is the wkend report chart = double bottom).
It dropped a little on light volume yesterday. I was saying that NATGAS could still do that double bottom ( shown complete here) run up and then maybe even drop to new lows, or it might even just drop to new lows and recover “Shake out” Now like OIL did and the CRB did. With that uncertainty, I personally haven’t taken a trade , though this looks bullish. Some NATGAS Stocks look good. ( see CHK, UPL, XCO)
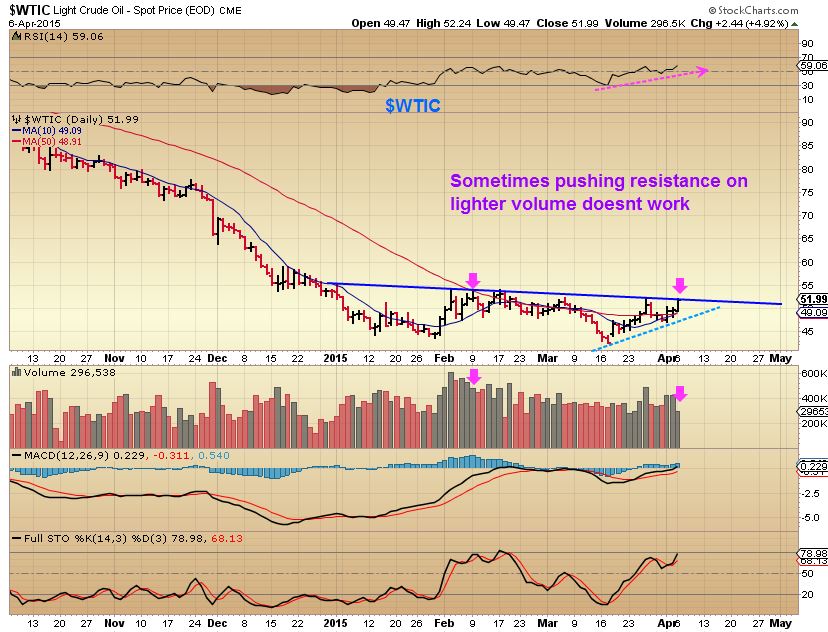
OIL – The Energy stocks really came to life yesterday and OIL was really just back where it was 6 days ago. Maybe the stocks are signaling an OIL break out soon.
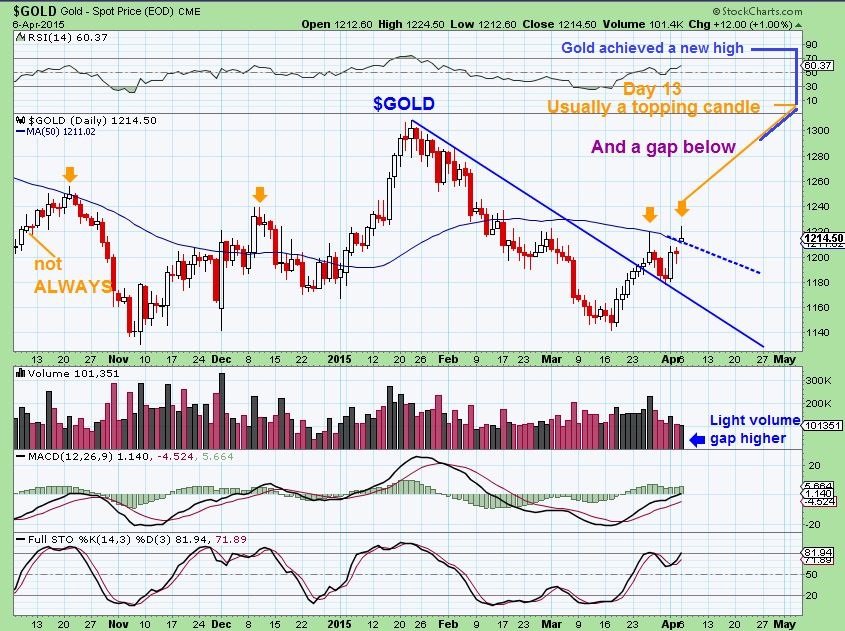
GOLD
There are still a couple of valid scenarios with Gold. Honestly, many Miners are looking really bullish and Gold made a new (day 13) recent high. This does NOT look like a 3rd or 4th daily cycle, breaking higher this late in a daily cycle. It could actually form as “Right Translated’ daily cycle, and this is Bullish, pointing toward higher highs on the next run up. ( Buy the dip type lows ahead)
2 possibilities ( There are more )
1. GOLD just rolls down the 50sma and fills the gap & then pops 1 more time, guaranteeing a Right Translated daily cycle, before dropping into a daily cycle low (BUY)
2. Gold could just start selling down from here into a daily cycle low.
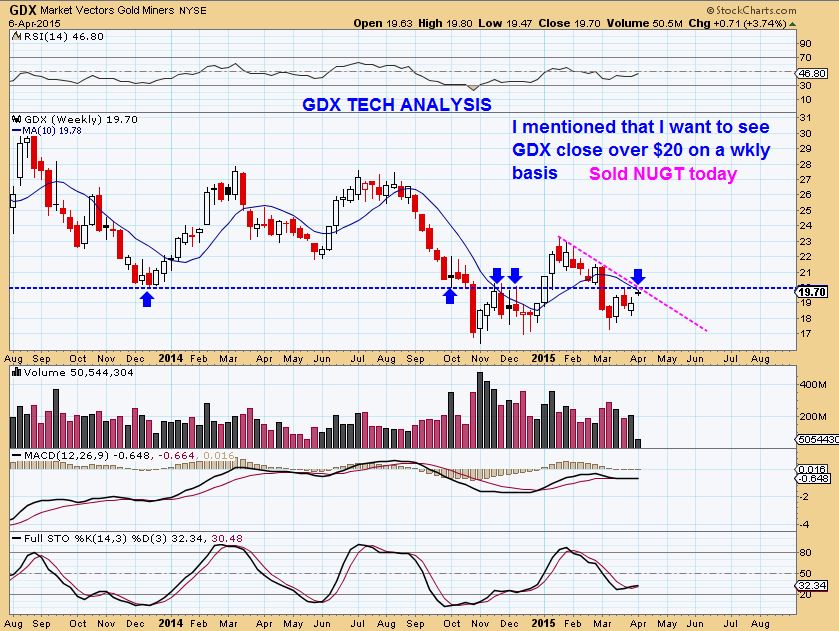
GDX- I have mentioned that GDX above $20 would be bullish, but my target was resistance, so I sold my NUGT trade yesterday. 2 GDX charts
GDX WKLY- This is one reason that I took & sold NUGT as a short term trade. Target near $20
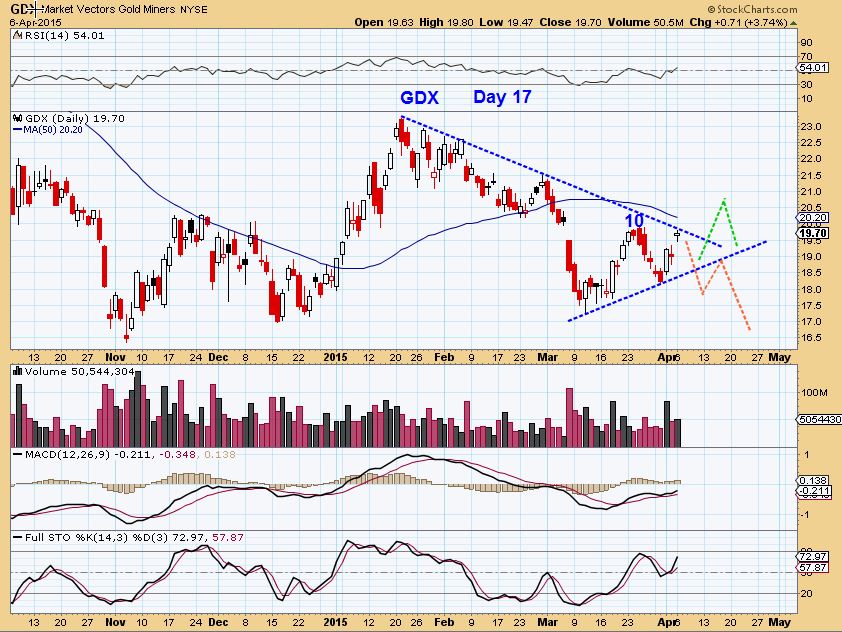
GDX DAILY – Target resistance near $20 & a gap below …now I wait and see. GDX seemed a tad weaker than GOLD. It hasnt made new highs (yet) and hasnt tagged the 50sma on the last run up or this time (so far). 2 possible scenarios
1. Break out and then drop to “test” the trend-line for a Daily Cycle low (DCL) green lines?
2. Just start dropping into a DCL from here?
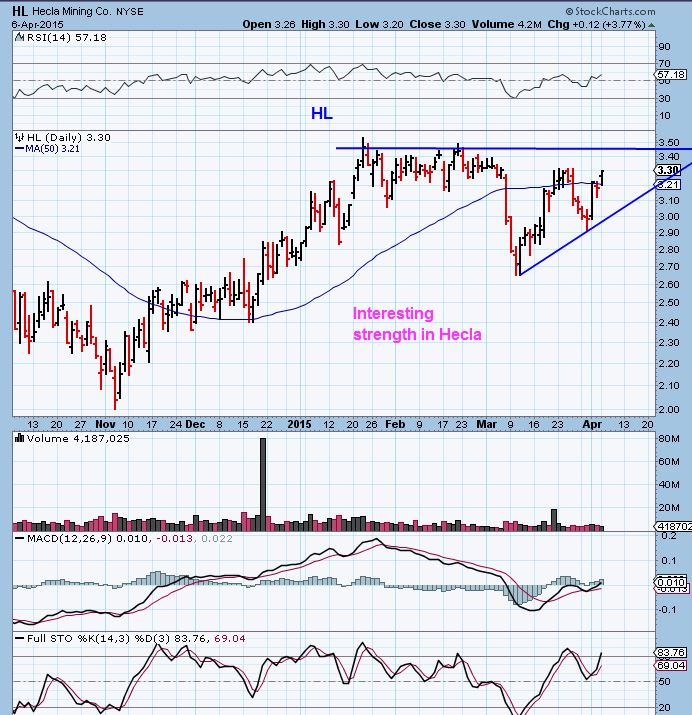
SO we will still need time to watch how things play out , but there are some really Bullish set ups within the Metals/Miners markets. Please see EGI, VGZ, BAA, XRA, MDW, ABX, NG, and if you look at HL on a 5 month chart? HL is near Highs.
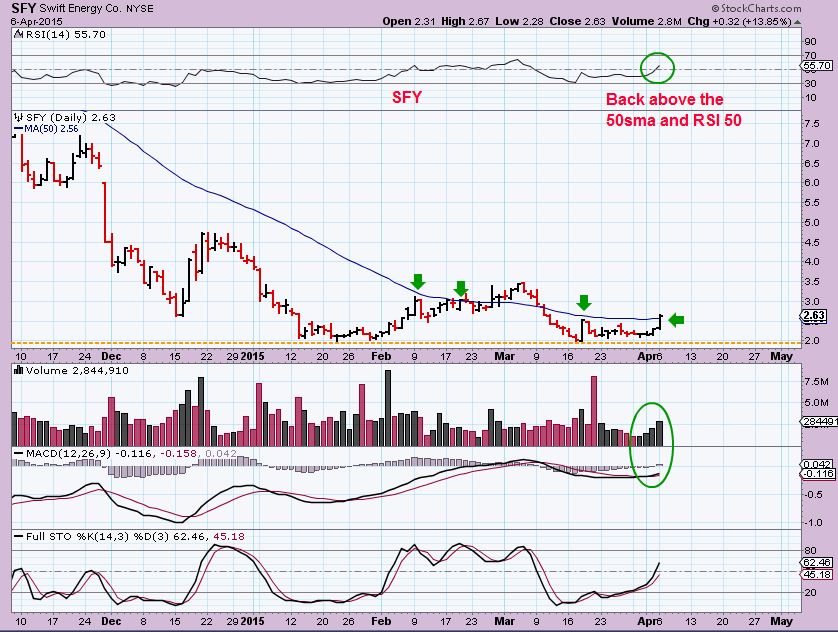
As mentioned, the ENERGY STOCKS all started to perk up yesterday. I’m just going to post a few charts to show what happened in case you work full-time and didnt have a chance to review the sector. Even stocks right at the lows ( SFY, NADL, etc ) moved nicely.
SFY – I actually bought this early yesterday, I know some others here bought it last week too. Double Bottom breaking back above the 50sma . Needs follow through.
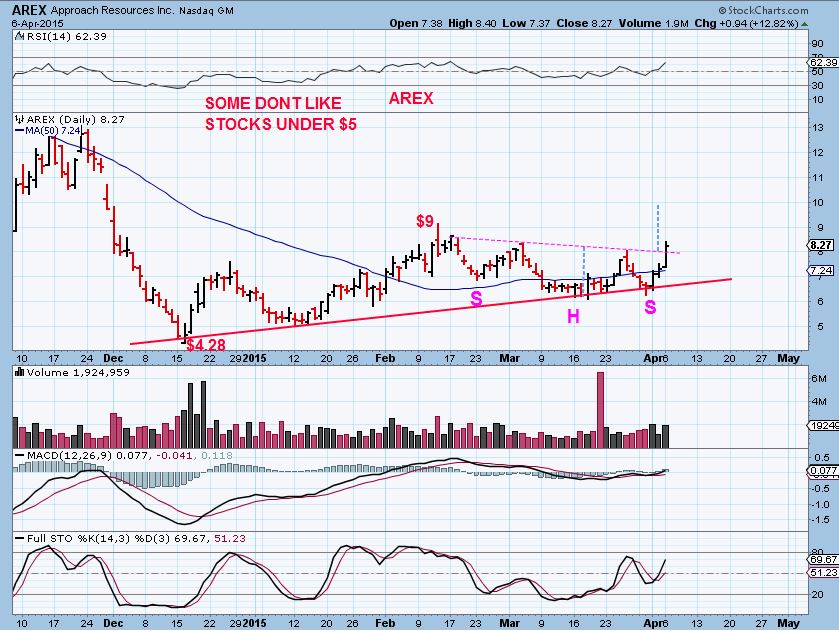
AREX- Higher lows for months. This looks to be an Inverse H&S break out – target near $10
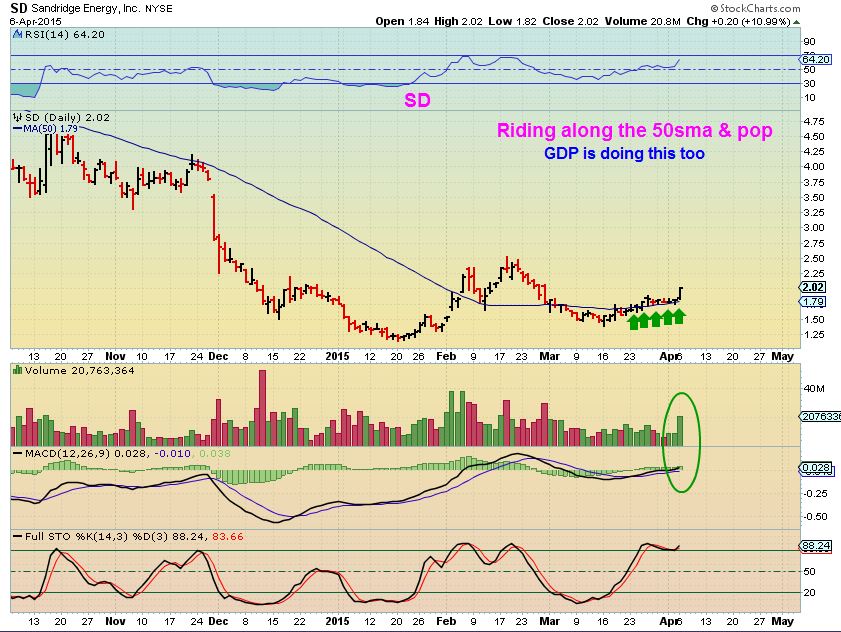
I like the slow steady set ups on GDP & SD. Less sellers, more accumulation type action.
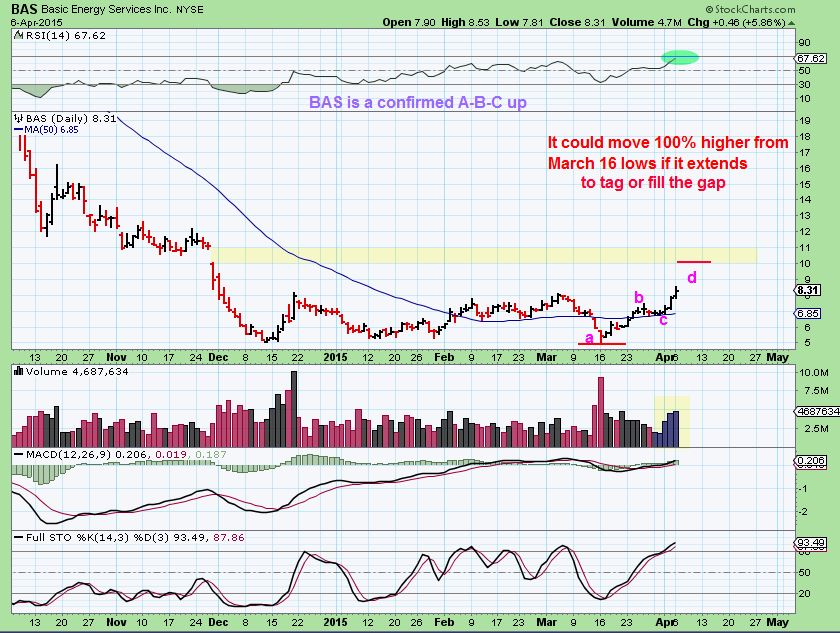
BAS– I mentioned to a reader (in the comments section) that owned BAS last week that it was in a confirmed A-B-C up. I personally wouldnt sell any until it hits the $9 area. It is moving along well, nice volume too.
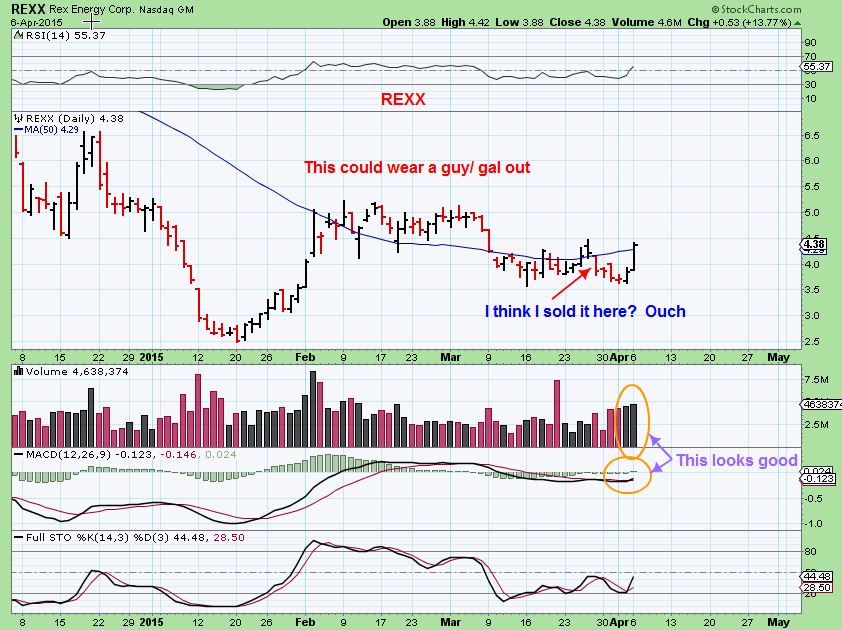
Yes, I admit it. The sideways consolidation action (below the 50sma) got the best of me. I sold my REXX a while back and it is now higher than where I sold it : ) It is suddenly recovering nicely , again above the 50 sma .
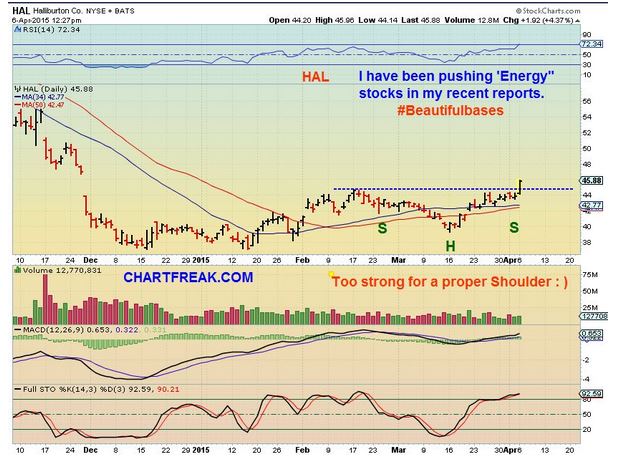
HAL – I tweeted this yesterday
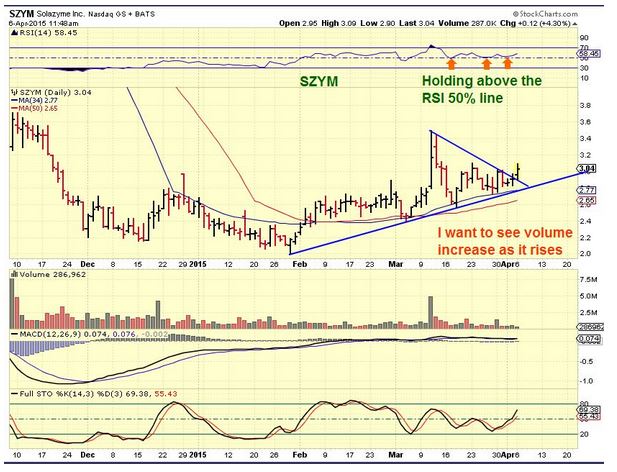
SZYM- I have been holding this for over a month. Its acting correctly, just not one of those huge %-Gainer (yet)
SO MANY MORE ENERGY STOCKS look like this, I just dont have time to chart everything. EXXI , GURE, WTI, CRK, CHK, HK, etc. etc. If they start pulling back for a day or two, I may add to positions if the volume is light.
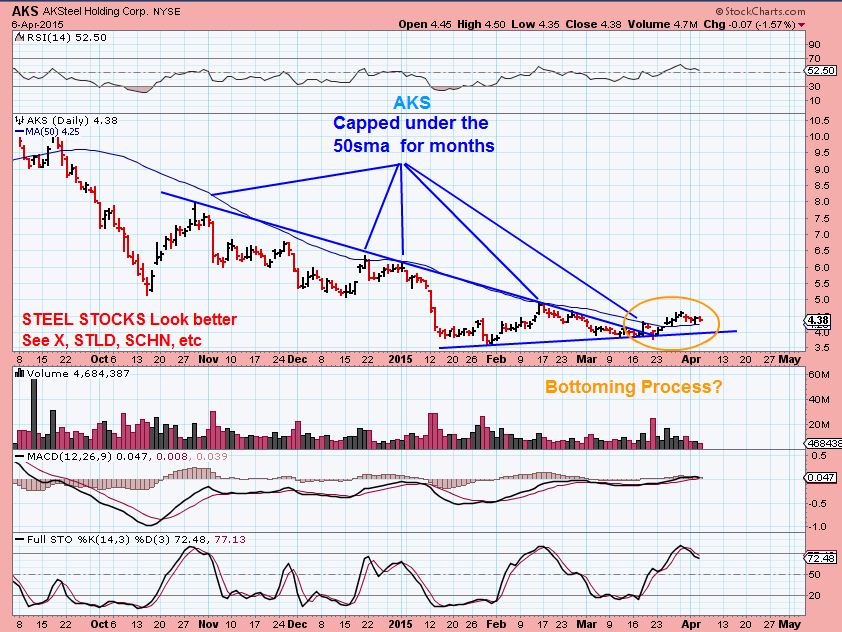
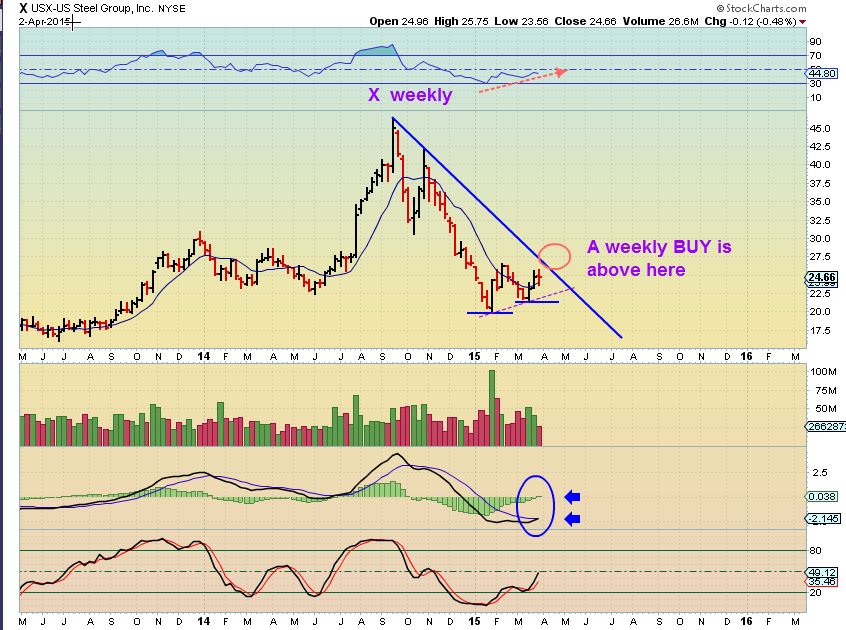
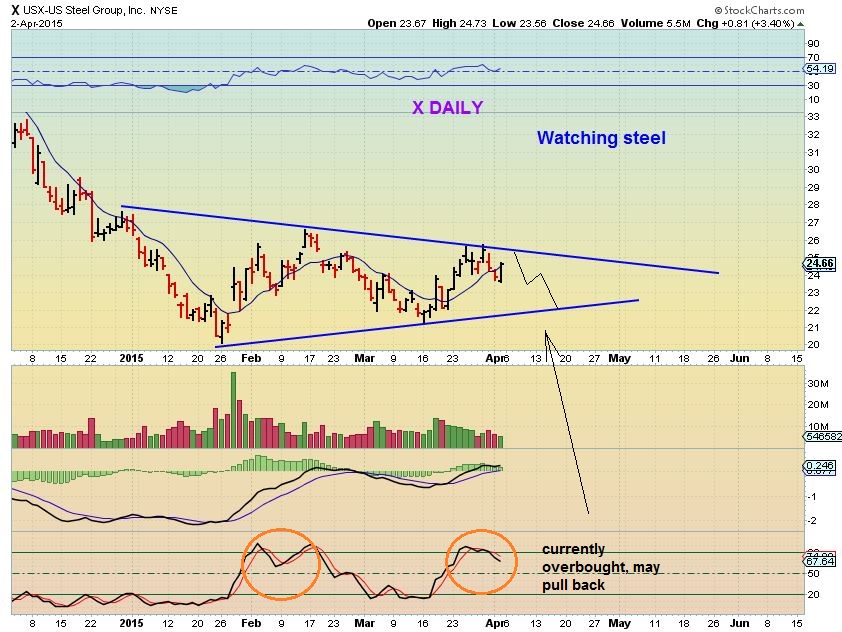
I also pointed out STEEL stocks setting up , so here is
AKS for example. Other Steel set ups are listed on the chart.
X- wkly
X daily – a pullback first?
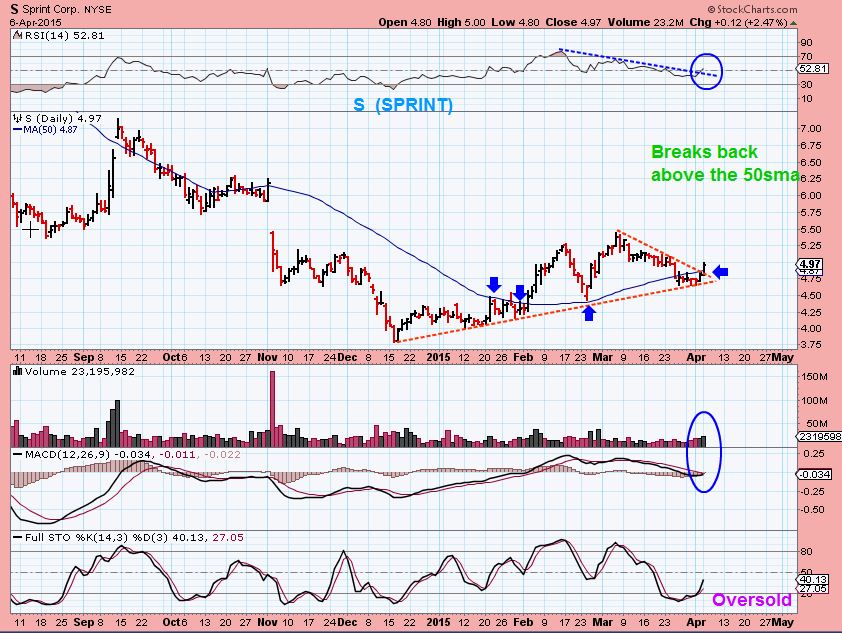
I liked SPRINT & posted this set up
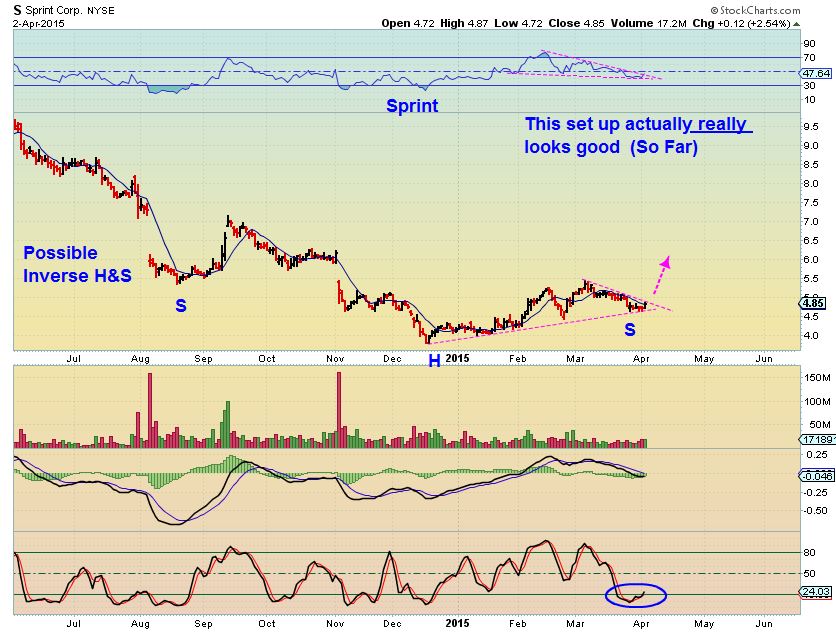
S – It broke out yesterday. It is still a buy (I’d put my stop below the orange line near $4.75)
SO again I am really liking the ENERGY Sector as a whole. NATGAS stocks include XCO, CHK, UPL, PQ, EVEP , etc. GOLD & MINERS are Bullish looking, at this point I am waiting to see how this daily cycle continues and want to be ready to buy the next daily cycle low. Have a great day !
~ALEX
JOBS REPORT AND MORE 
 More Of The Same
Scroll to top

Alex,
FWIW a couple of Fed presidents were out yesterday making noise about longer than anticipated before a rate hike. This earnings season is probably going to be tough and it looks like the Fed is trying to moderate the “eventual” move down into the next ICL by pushing back rate hikes or at least threatening to do so.
Yes, I heard the same discussions, pushing back rate hikes from possible June to the fall.
I remember when we used to trade GOLD in the earlier stages of the bull and the rate hikes would be surprise breaking news. BOOM, Rate hike by announced by Greenspan at 10:30 A.M. Mid Trading session..
I believe the LULL in Energy stocks (many Red) is about over. It may be a buying opportunity pause
What is/are your favorite screening techniques when looking for set ups?
I have a hard time answering that.
I dont use screening techniques , really. I was taught by an old school technician, he taught me to glance at charts and see things as they are. Some things are obvious and for the subtle things I have developed my own indicators to help me see things. Sorry if thats vague, its kind of Tough to explain.
Like when someone says they “read the tape’. I’m not so sure that anyone reads the tape anymore.
OK. Where do you start in terms of finding charts to look through? You know, the needle in a haystack problem.
Start with a sector – GOLD- or -ENERGY – or – TECH
Then break that down to components search, its ” individual Miners/ ETFs” ENEGRY has “OIL & GAS” BIO-FUEL” CLEAN ENERGY STOCKS” or NATGAS stocks , tech could be “Media, FB, YHOO, TWTR, – could be semi conductors etc.
I look at the charts and choose the best, look at fundamentals unless I’m just trading, then I look at when earnings is released, etc
Thanks
CLNE, PEIX, and SZYM …the slowly but steady clean energy , are moving to prior ‘high volume spike highs’ on a 3 month chart . They look good , but may form a handle before (or after ) breaking out .
SZYM looking good again today on heavy volume. It’s right in the area of its earnings pop. If it can close over $3.20 today it would be a good sign.
I sure hope it does. Looks encouraging so far!
Looking even better now :))
SZYM is acting correctly …and I hope it continues when you put in on a 6 month chart : )
Back at $3.20. Will be an interesting close.
Hi Alex, any stop loss to be set on OIL trades ? i day trade the ETFS
i mean take profits if oil is to hit 53-54 range before the next 57..something like that ,just to lock in gains
I always say that before you buy, You should know your stop loss. What can you afford to risk. What would emotionally hurt you to take a hit?
You base that stop on ( hopefully ) a low risk entry, it is slightly below, you can move that to break even when price goes higher.
To lock in profits you can raise your stops.
I often mention placing stops below the dominant moving average ( 50 sma) or is there a trend line to put it under? , etc .
yes, always use stops and honor them if they take you out of a trade ( Like my REXX took me out & now REXX keeps trucking higher) ..move on. “There is always another trade” ; )
Oh…what ETF are you talking about if you want a target, but they often stretch further than the targets if they have consolidated for a while or got very oversold.
Hey Alex,
First post here for me :). You talk about GDX a lot as your play on gold. Do you ever play GDXJ as well?
Seems like there is a bit more upside in that one if gold starts to really move. Or am I not seeing that correctly?
Thx…Eric
Hey Eric, thanks for Posting . I definitely trade the Juniors , and I trade them more than the big boys in GDX.
To tell you the truth , when I am looking at GDX, as a shorter term trader, I am trading NUGT off of it. I also trade JNUG using GDXJ, but I try to NEVER recommend them here. We have such a variety of traders / investors here that I know the fast traders are aware of JNUG, JDST, NUGT ,DUST, GLL, USLV, etc – But i cannot put newer traders or people not in front of a screen into a 3x without losing sleep : ) They move so fast, and you can get stopped out daily.
So actually, I trade Miners like EGO, IAG, AG, HL, NG, BTG, SVLC, SSRI, PAAS , etc etc in BUY & HOLD or uptrending times.
I use GOLD & GDX to get a feel for where we are cycle -wise. GDXJ overshoots to the downside often. For example, GDXJ broke to new lows in DEC , breaking the NOV lows. GDX DIDNT. So GDX followed Gold closer than GDXJ. I use GDX for analysis of the overall Miners sector, but I do use GDXJ when looking to buy at cycle lows.
Hope that helped.
Yep, understood! I’m definitely not ready for a 3x so I get your thinking there and appreciate it…maybe someday. Thanks again
You’re better off not trading 3X ETF if not in front of a screen all day .
Some of the juniors are better than the 3x ETFs. They have rocket fuel on the upside and often pullback in a normal manner when the run higher is in place. 3X ETFs have decay and you see it on the long term charts. Sideways moves and you lose money .
There are 3x and there are 3x. Most 3x ETFs are casino vultures. A few are real without significant decay etc such as 3 x TLT: TMF.
Yesterday C.S. asked me about COAL STOCKS. I looked and said that I thought only ACI looked good so far, but they may be setting up.
Today ACI popped nicely today and now ANR is setting up the same way . WLT may be too. BTU looks like an oversold bounce so far
Wow, CMCM.
Wish I had some.
Wish I had some……….
I had posted CMCM in the weekend report as a mobile play , but I pointed to Spring and NQ as possible buys .
I think its Chinese stocks rising out of bases too. See also WBAI , JD , CMGE , YNDX, YOKU, etc
Alex, I love the pictures that you start the blog with? Nice touch. I assume everyone is dancing in the streets the last two days. I agree with your price target on BAS. I see $9.01 as the AB=CD pattern completion. I have WRES at $1.08, CLNE at $6.09 (see chart), RIG at $16.90 and EXXI at $4.92 as sell prices. Or at least, a place to tighten stops and expect a pull back. Nobody wants to give up their profits. SFY looking strong.
Thanks Bill. I also like to look at reverse symmetry on stock that are recovering after a long decline. In CLNE’s case there is some congestion between about $6.30 and $7.30 or so. I wouldn’t be surprised to see it spike to around that area and the bounce around for a month or two within that congestion zone. Good news is that if it gets past that congestion there should be a quick 2-3$ up move.
That Picture is Maria…she will confirm or deny that soon : )
By the way, Thx Bill…I actually spend a good amt of time looking for the right picture. After all, a picture is worth 1000 words 🙂
Lol…. every single day..Guilty as charged… :o)
How long will this run up in energy last? Who knows? I think we got $57.08 in the headlights? See the chart below.
My weekend report I had a chart for OIL target $57.12, but keep in mind that that is to be assumed as the 1st target, they can extend, especially if we get short covering.
Nice, I am learning something…………Lets hope for a blow off top!
Alex and Bill,
I am looking for a 5 wave up from the ICL on 3/17 for a major 1. Currently in wave 3 with 4 down soon ( maybe dropping to 18.30sh or the 50 dma on USO ) then the final 5th wave equal in length to the 1st wave.
Comments or concerns ?
Disclaimer: Long sept. USO Calls and a “basket” of Alex’s oil stocks.
I can see that or something close playing out .
Sometimes the wave 5 can be a double top (truncated) , so I wouldnt hang around in a leveraged position too long. Again my target is OIL $57…if we hit that on wave 3 and pullback, we may go to $60 or maybe double top, but I’d be careful near a top in leverage because they take your gains back a little faster 🙂 Best wishes.
Thanks Alex. Very good advise.
I agree with Alex that oil should get to around $57. That works out to about $19.50 on USO. In order to have a 5 wave that equals 1 and ends at $19.50 wave 4 would have to go down too far. I don’t see it happening. BUT, that’s because I am looking at an AB=CD pattern for oil (see my chart above). Sometimes CD stretches farther than AB. In which case your 5 wave may stretch higher than $19.50 without the deep draw down in wave 4. See the attached chart. 🙂
Thanks Bill.
You could be right……I would expect wave 4 down to be between 38% to 50% Fib retracement which would put USO back at 50 dma again.
Alex, GWPH? What do you think?
When I see volume fading as price rises, I wait ( or lock in profit if I am in it). I feel that demand is drying up and that chart looks like it could drop to the 50sma is buying dries up.
So its a nice chart, personally I would watch list it until I see more buying interest.
AKS is starting to look like it wants to break out soon. ANR also, and BTU popped since I wrote my comments below
Anybody make anything of oil stocks giving it up while crude stayed strong into the close? Just following market pullback or front running the API stock release? Last few weeks the gov’t data has contrasted pretty sharply with API data. Probably should have taken some money off the table to lower risk, but too late now! Charts are looking good so many of these could keep powering through. May be a good chance to add others.
That was concerning me? Not sure what to make of it, profit taking maybe? Big runs in some of the stocks.
Hey Bill, thats what I was thinking…some nice runs, some profit taking.
Royal Dutch Shell execs agree with Chart Freak. #BG Buy oil shares at NEAR the bottom of the cycle.
Fwiw:
I sold my BP Calls this morning. BP one of the stronger oil performers today.
Not a good day for commodities. Oil down a bunch. Oil stocks doing fairly well in spite of that. Steel and coal stocks giving it up. Guess when everyone was happy yesterday afternoon it was a short term high. Solars and clean fuel saving me today.
Quite the oil move in the wrong direction. What are your thoughts Alex?