Fridays Jobs Report said a lot, and how the various markets react should be quite interesting. The markets were closed Friday , so what will Monday bring? Check this out…
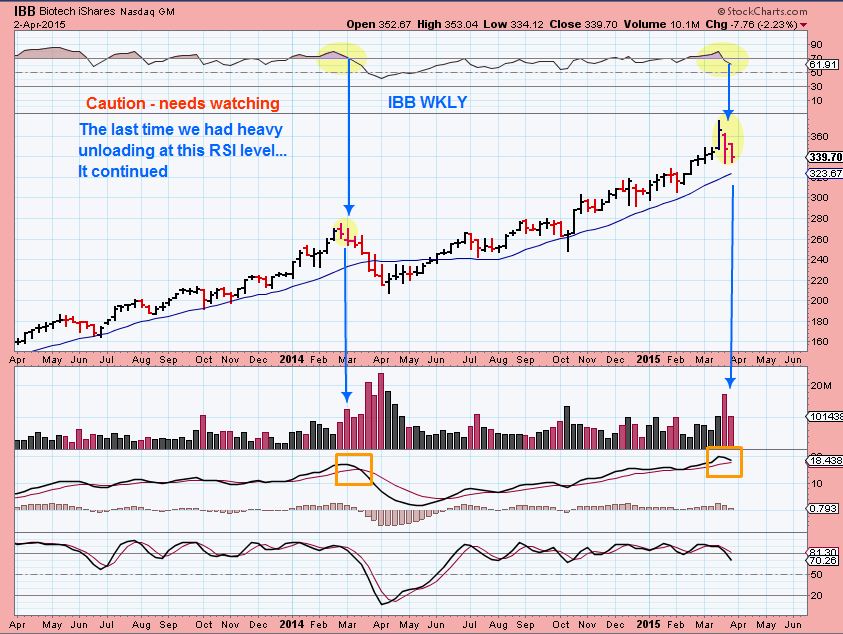
I’ll start with the IBB WEEKLY chart. This isnt overly Bearish at this point, its still above the weekly moving average, but needs monitoring.It was last Spring that Biotechs sold off deeply.
Now lets look at the SPX & the NASDAQ, but first let me explain the possible implicaitons of the negative jobs report that came out Friday …
Fridays jobs report was the weakest since Dec 2013. 126,000 was the number. It was less than 1/2 of February’s, some were expecting closer to 280,000! It really raises concerns about the strength of the economy. Now here is the interesting part about that – These markets are Devious.
1. Does a bad report mean we crash Monday , because it was so weak and causes a panic sell?
2. Or does it imply that the FED will hold off on raising rates (expected in June), so now the markets will view it as bullish & rally with expectations of the FED holding off?
Either scenario comes at a timely moment on the charts.
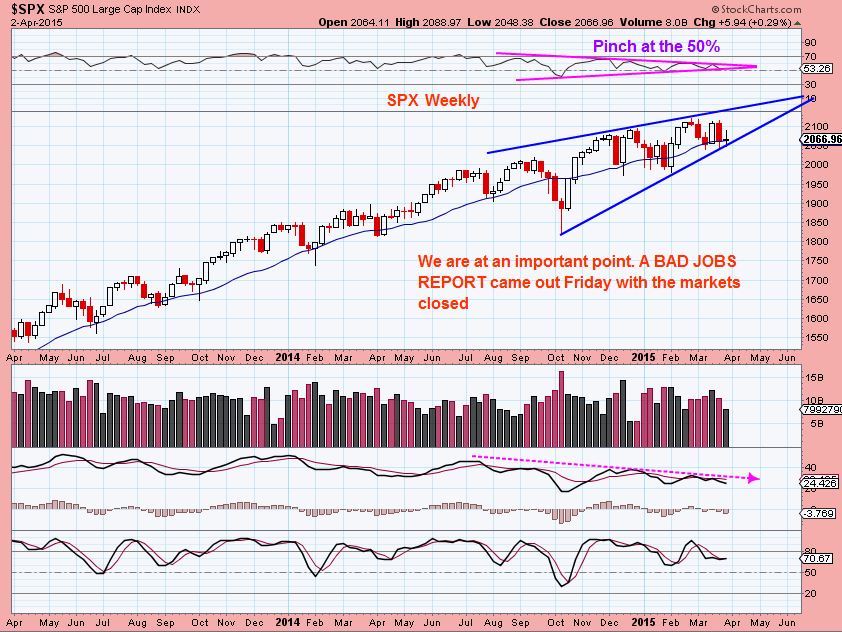
SPX WKLY– The WEDGE. Crash down or break higher?
NASDAQ WEEKLY – This wedge seems close to complete & the wkly MACD wants to cross down? HMMM.
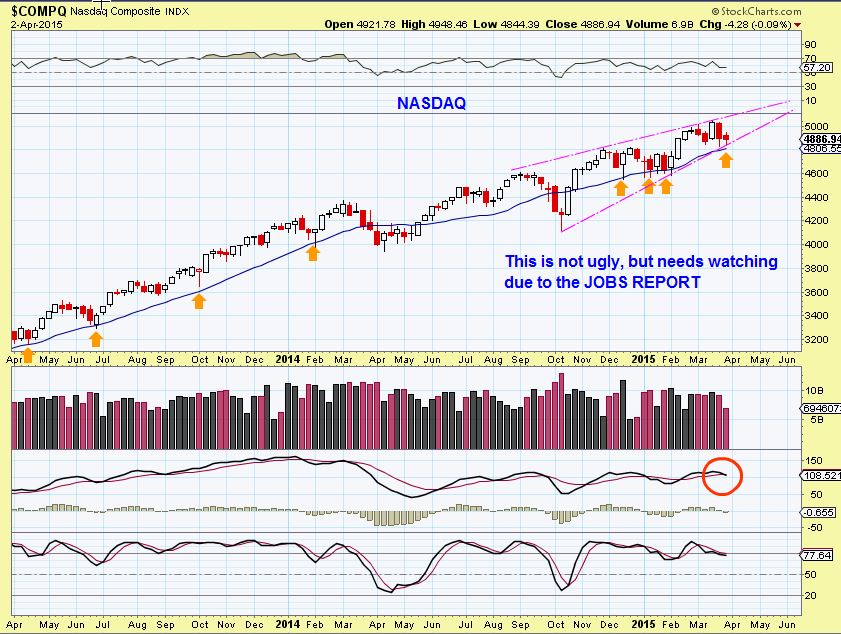
SO if MONDAY starts with a deep gap down, we might have our sell-off from the wedge that I have been watching materializing on the bad Jobs Report. A Burst higher ( thinking that the Fed wont raise rates) “Could” keep the bull going. More on this later.
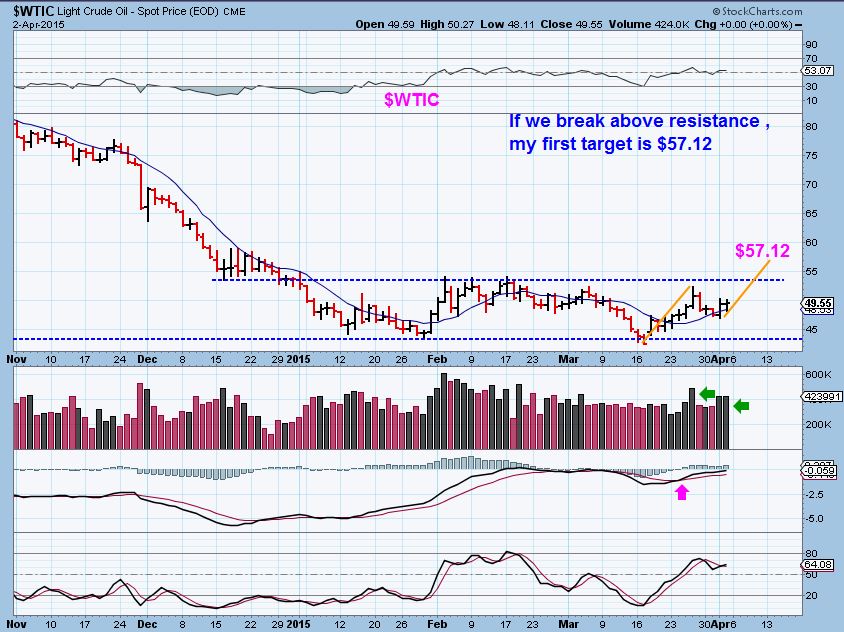
$WTIC- I am ignoring the IRAN DEAL news and I continue to like the set up in OIL. The double bottom shake out shook out longs and caught people flipping “Short”. The IRAN deal may have people heavily short too, and they may have to cover if this moves higher.
$NATGAS– I also like NATGAS for a rally here. Nice pop Friday.
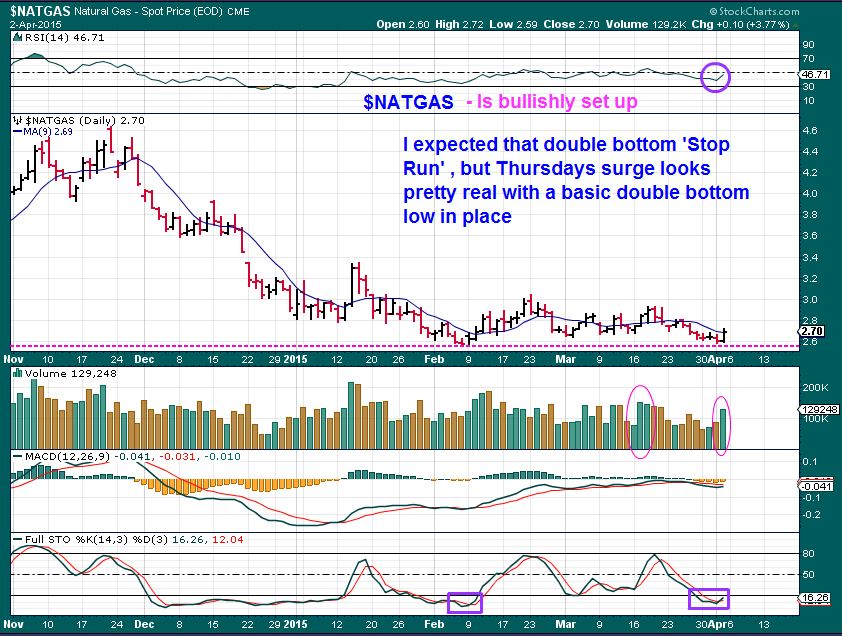
LESSON & A WORD OF CAUTION GOING FORWARD IN NATGAS.
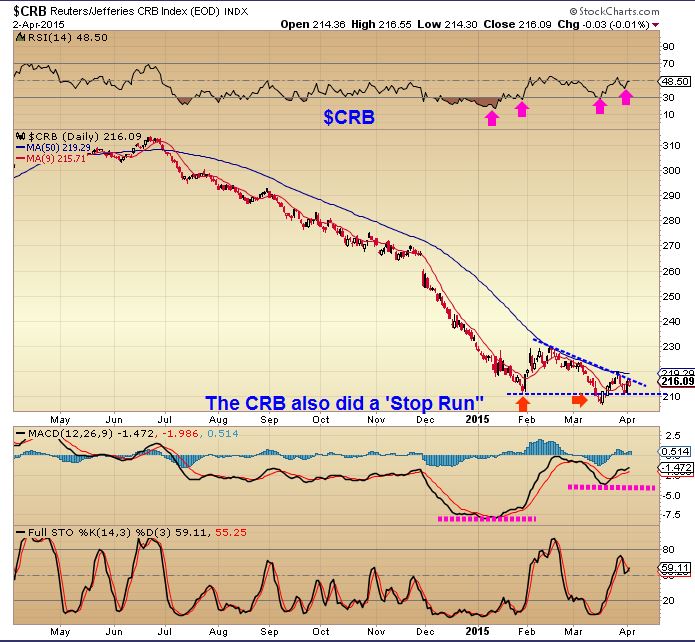
You may recall that I called for a double bottom BREAK DOWN & RECOVERY in both GOLD in November , and recently OIL, and that recovery becomes a “Shake out”. OIL had it March 16. Notice : The CRB just did a double bottom shake out . I dont get emotional and try to blame everyone for this. These are very common, It’s how the BIG MONEY can enter a position. They have million of $$ to invest, so they sell something off and when the lows are broken, those that went long get stopped out ( Big Money buys their positions). Then many scream emotionally that ‘we have a break down, go short!’ While the herd goes short , Big Money does the opposite raising prices. Now those “SHORTS” have to cover & Big Money continues buying. The price recovers , those “SHORTS” cover, and often The original “LONGS” that got stopped out start to re-buy …and a rally can occur.
My point??
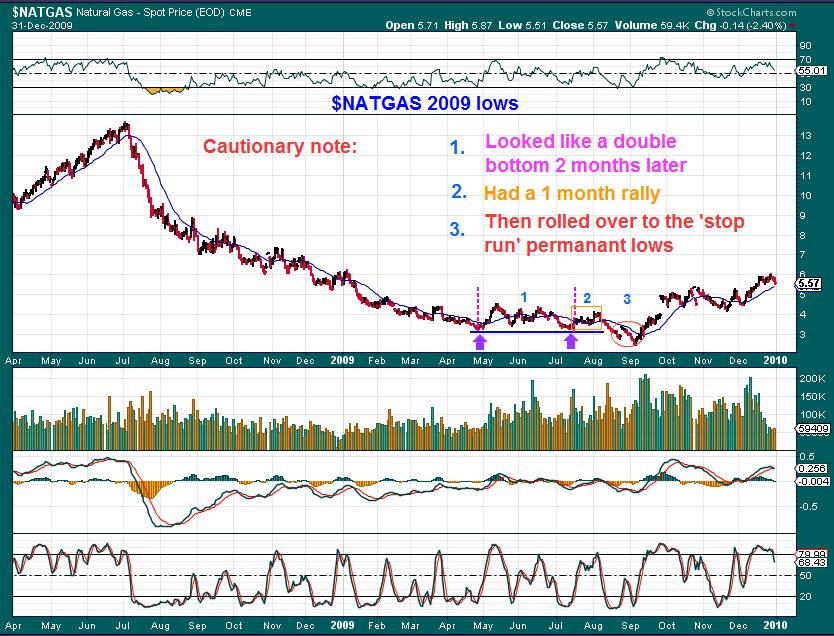
We did NOT get a Shake out in NATGAS (YET). Notice NATGAS 2009 lows. VERY SIMILAR TO NOW. 1. Double bottom over 2 months ( we just did that) 2. then it rallied next & 3. then a shake out. Then that HUGE VOLUME in Sept as Big Money takes positions. I just wanted to keep all here alert to that possibility if we rally a bit . My current NATGAS chart ( Posted above )doesnt have that shake out & huge volume. The Big Money may want in.
GOLD & MINERS still looking Bullish & Bearish in various ways. Will the JOBS report move Gold? If the markets tank on that Jobs report, Gold could rally. If the Markets rally , thinking FED stall on rate hike, GOLD could drop to the ICL. Or was that the ICL in March? THAT has been the dilemma. Lets not blame the Big Money and Banksters if they want to put some big funds to work, We know how they ‘enter’ Big positions , Stay calm, stay centered and lets just watch how this plays out and hopefully join them when the time is right. To The Charts …
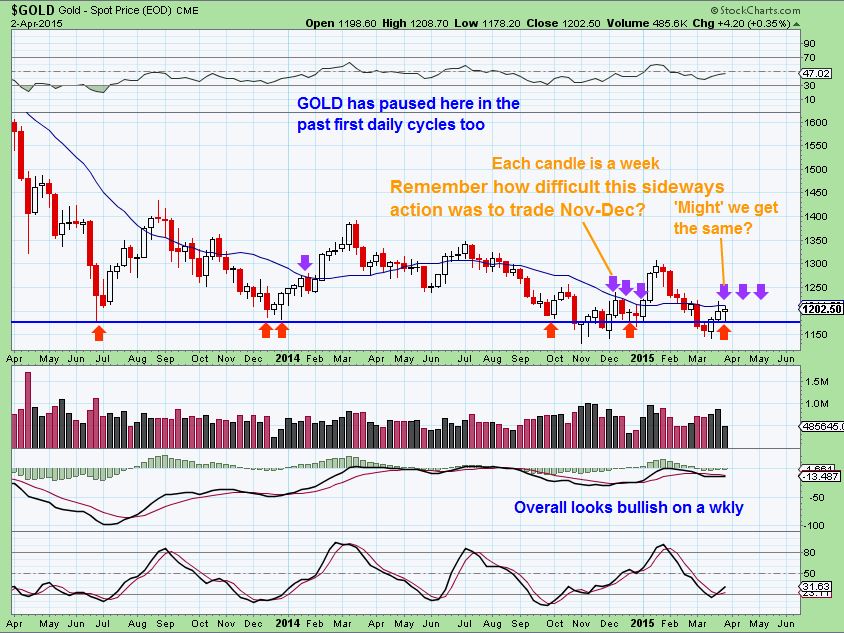
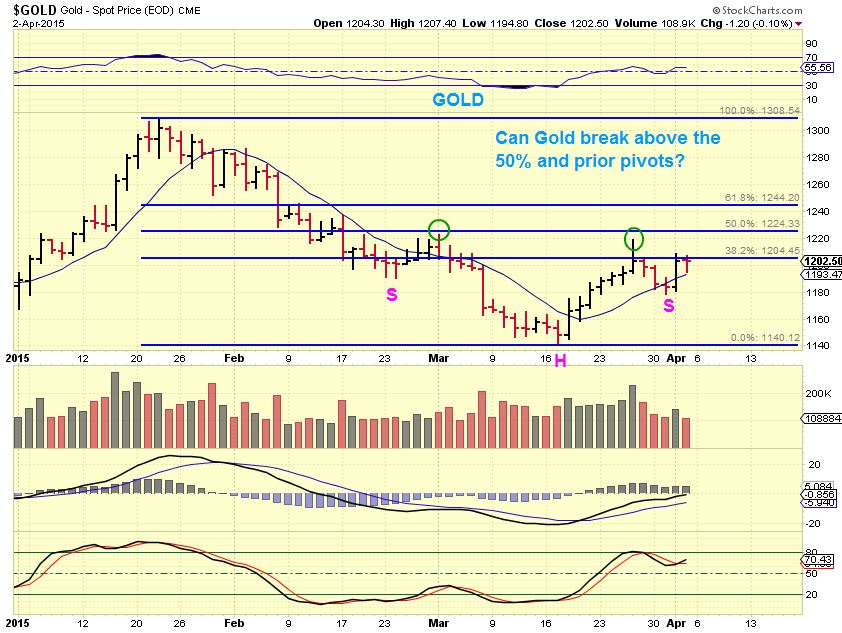
GOLD WEEKLY – This recovered from the recent sell off below June 2013 lows and testing Dec 2014 lows. It looks bullish but please notice that it has struggled sideways for weeks in Nov & Dec! Yes, each Candle is actually a week. We had many weeks of sideways action Nov – Dec. Frustrating for “traders”. A BURST HIGHER would be very bullish, but sideways / down will be tough trading.
GOLD DAILY – possible inverse H&S. Watch prior pivots for a possible break out higher .
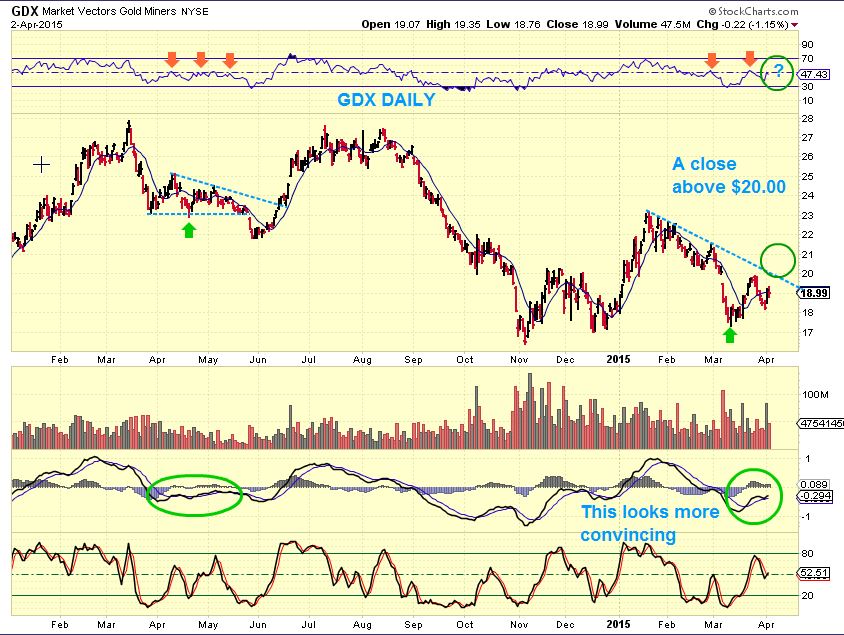
GDX DAILY- this chart hasn’t proven to be any more than a bounce so far. Was that a daily cycle low about to roll over at the blue line? Or an ICL in March ready to break above $20? It may reveal its direction next week. A close above $20 is bullish.
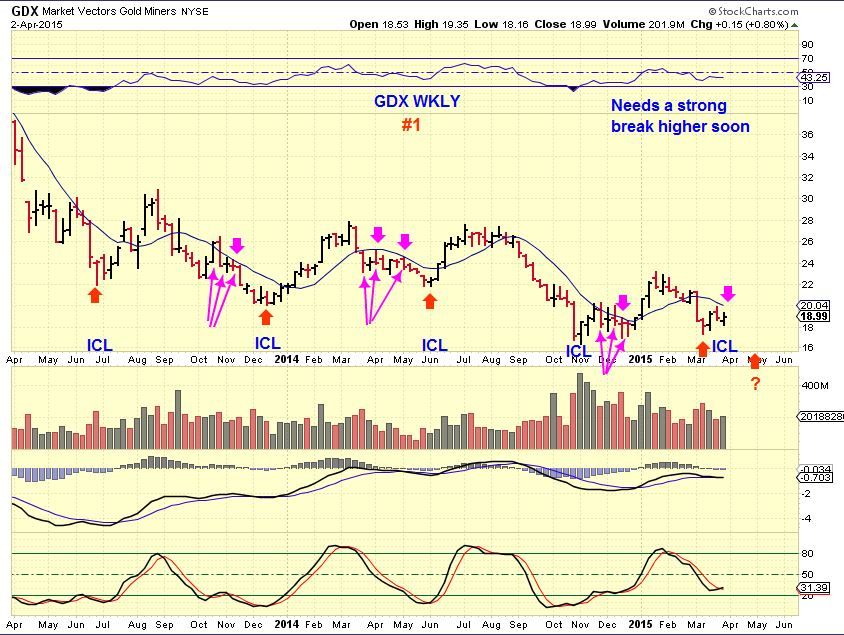
I have 2 GDX WEEKLY charts – Another leg down or rally higher? My “GUT” says that we saw a Daily Cycle Low in March and another drop to new lows. There IS reason to believe we bottomed however , and those March lows are it.
GDX WKLY #1- Purple arrows simply represent areas where the GDX rallied convincingly, but unable to break out higher, it rolled over to the “Real Meaningful Trade-able Low” (ICL) weeks later. We are there now. Again, a wkly close above $20 is bullish. We didn’t get as oversold on the stochastics as prior ICL’s… 1 more dip?
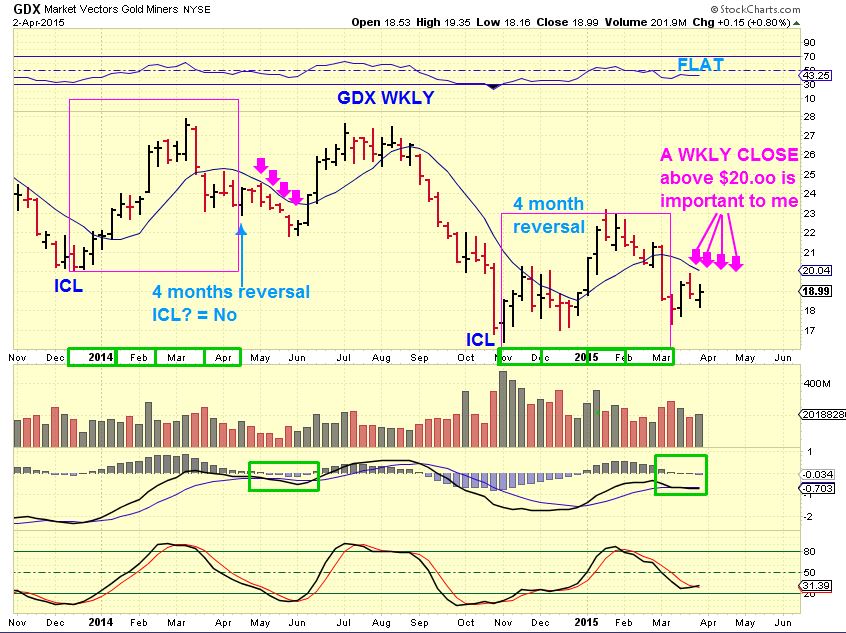
GDX WKLY #2 – I am pointing out that GDX had a reversal after 4 months from an ICL ( Blue arrow) Early last spring , and it looked real, but rolled over. Did we just see it again, tag $20 & roll over? Time will tell from here.
So Thursday night I wanted to see if there were BULLISH charts for Miners or BULLISH charts for Equities to be found, and I found many of both. The last time I mentioned that bullish chart for SSNI, the markets dropped and it went with it, so at this point it is best to see what MONDAY has to offer ( We may get a sneak peak in GOLD/SILVER, since they start trading on Sunday night U.S. time).
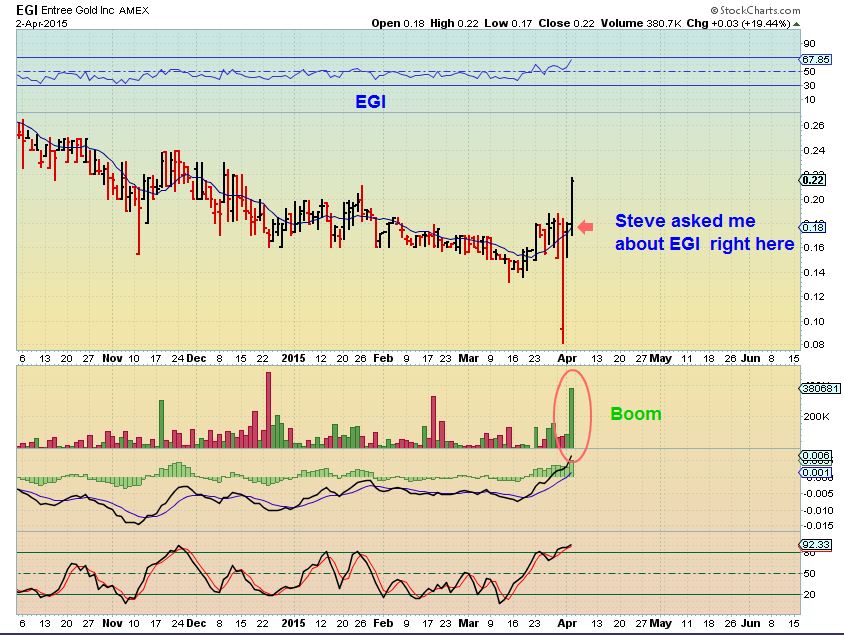
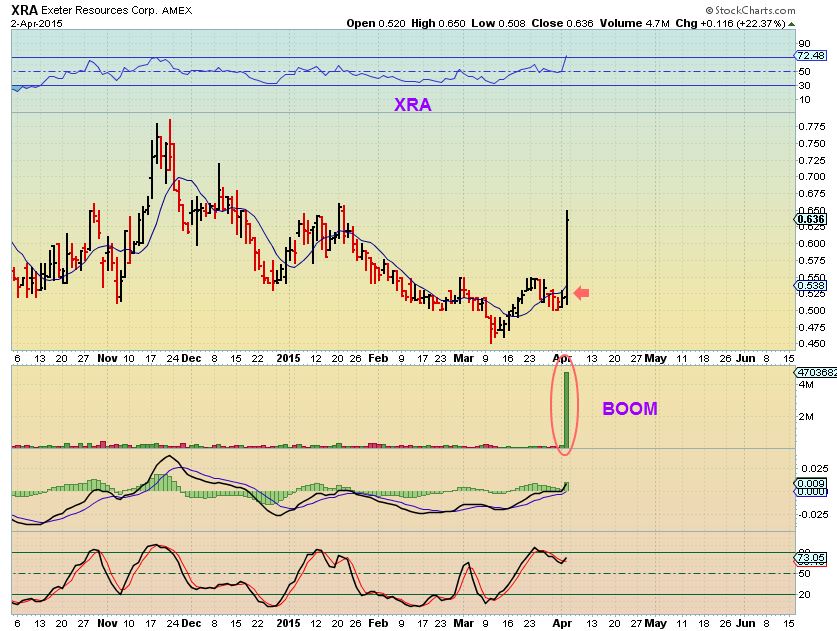
By the way, THIS obviously has me watching things in Miners very closely! Any who saw my comments with STEVE Thursday and didnt check EGI later that day , should see what happened. WOW STEVE! Then I saw XRA! Boom. So now I look at MUX & TRX , etc and wonder, will they POP too? Still I am waiting for confirmation in Miners, but that is impressive.
~ALEX
SPARE CHARTS
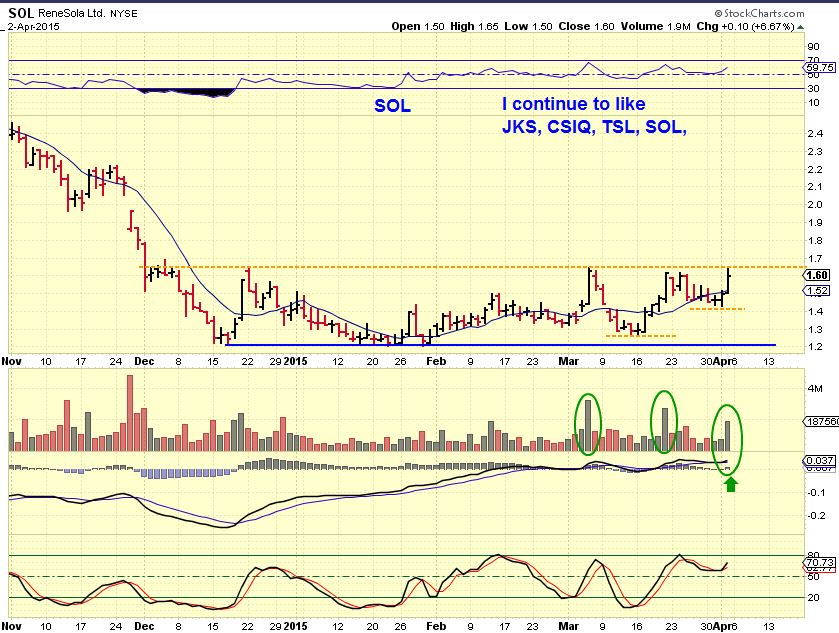
I have mentioned recently that I like the looks of SOLARS, STEEL setting up/ Aluminum stocks possibly bottoming, ENERGY, MINERS?? etc. Below I am just going to just post some Basic charts of set ups I liked, some that have Popped and still look bullish. We’ll just have to see how things play out Monday & next week with the JOBS REPORT release. Have a great rest of your wkend and Monday trading!
SOL
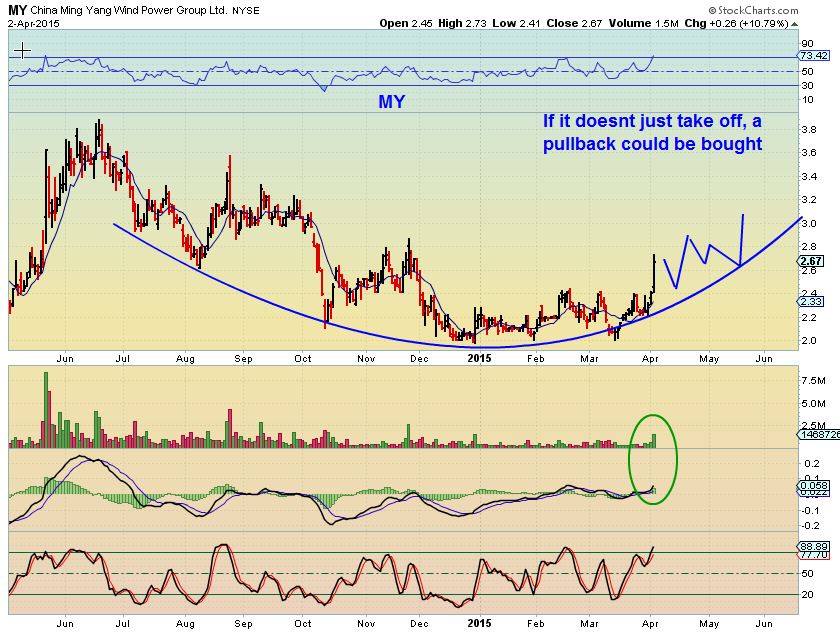
MY
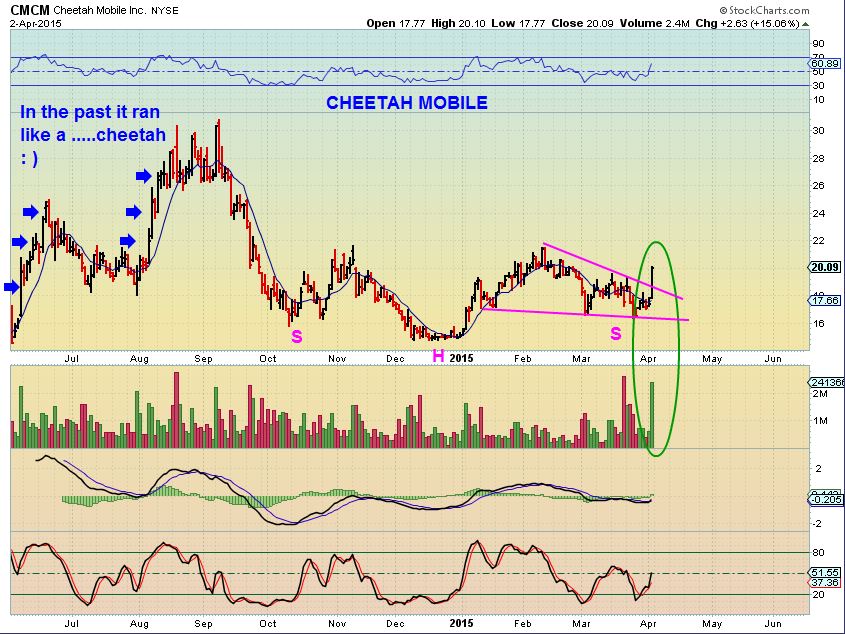
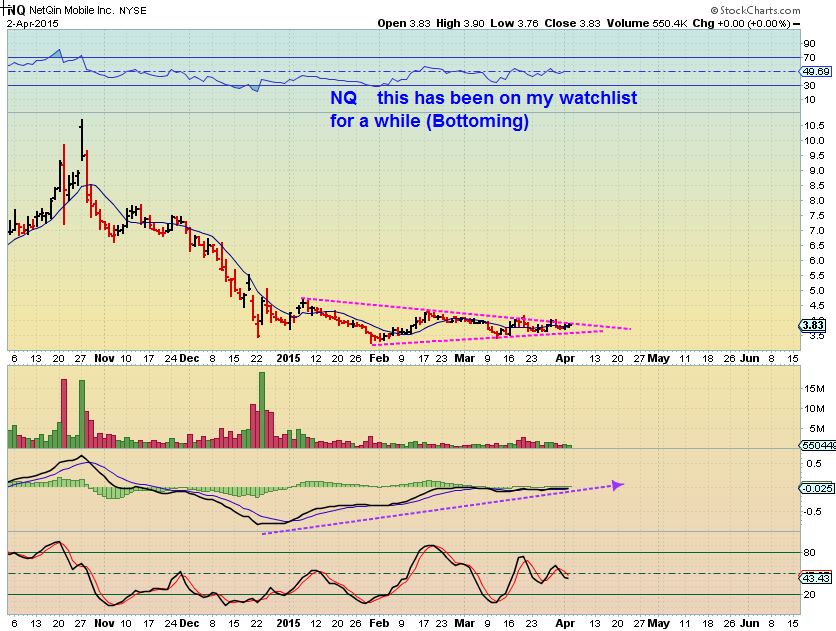
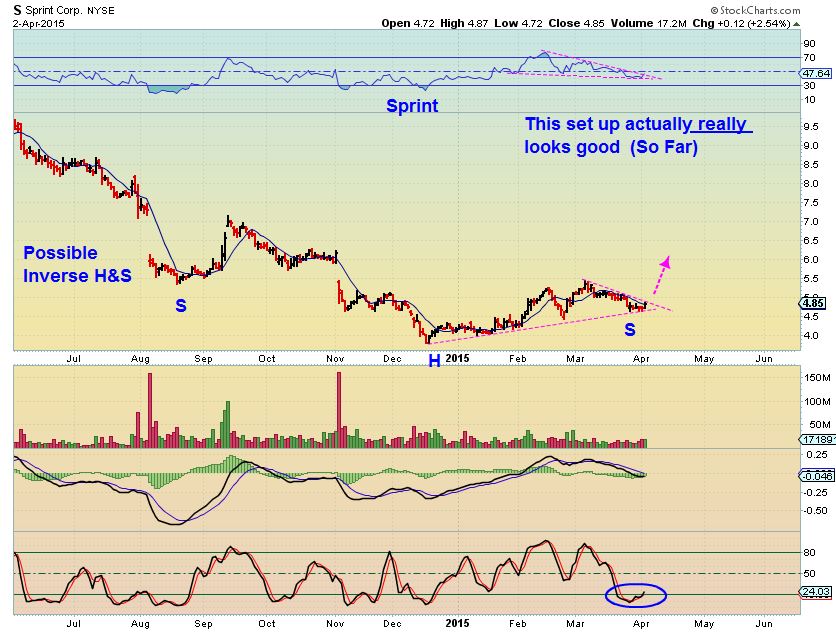
3 MOBILE STOCKS I was watching ( 1 breaking out, 2 ready?)
CMCM
NQ
S (Sprint)
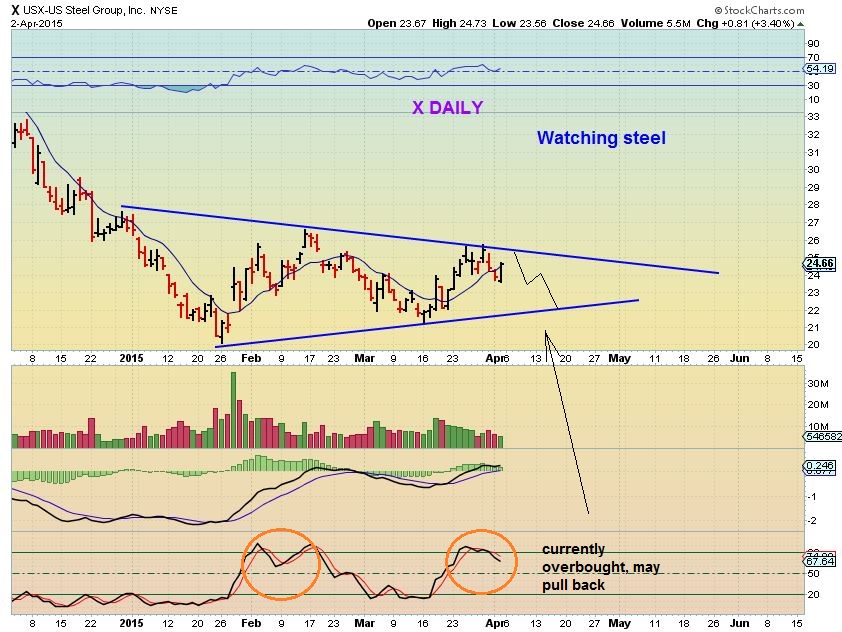
X DAILY & WEEKLY for the watch-list ( I Like AKS, STLD, SCHN steel stocks set ups right now too. Look at SCHN)
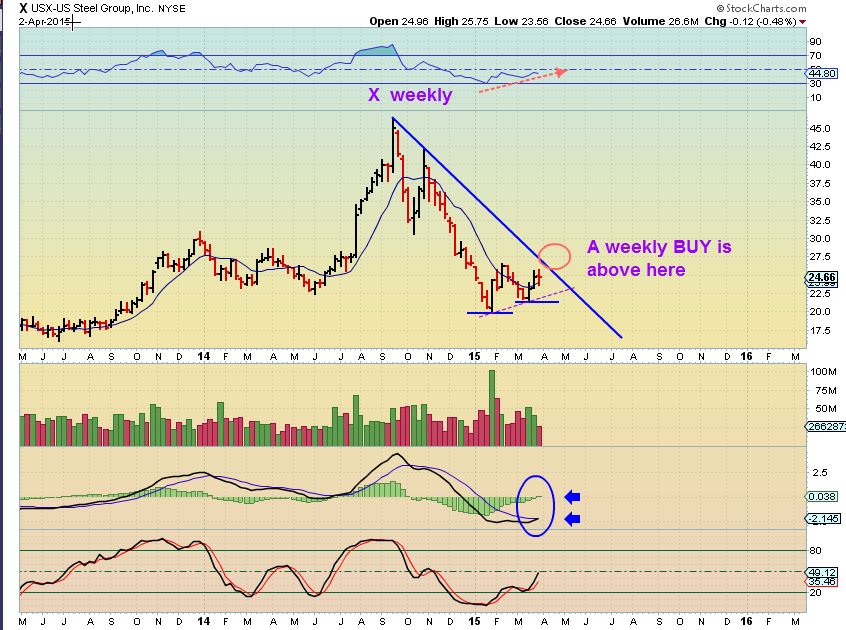
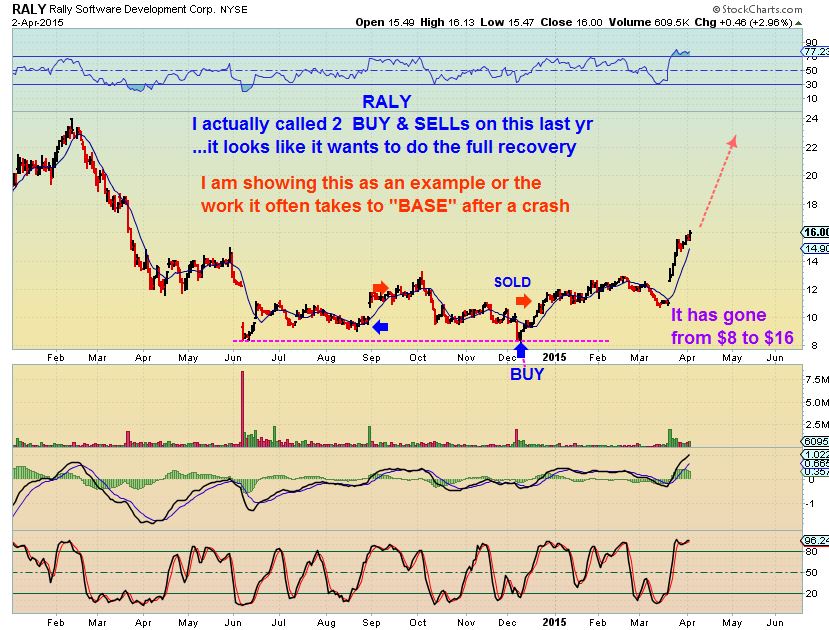
My style currently with MINERS / ENERGY / SOLARS / My EBOLA stocks last fall , ETC often trades within BASES. This chart shows how long & how much work a base can be, but also the reward .
RALY
Please look these up on 6 month charts
GNE, GRH, BRZU, SSN , PACD, BAS (Confirmed A-B-C up to $9+) etc etc etc . There are SO MANY SET UPS.
I think next week could be great for traders, but first we need to see how the investors & traders handle that JObs report.
Checking the Charts 
 Shocked
Scroll to top

Wow..its psychological warfare ..isnt it? Never a dull moment that’s for sure. Thanks so much for the provocative report..definitely did not expect a report this holiday wknd.
….so much to think about and study….woohooo..:-)
cheers
Ur welcome Maria, and yeah…there is a lot going on. Having Friday off helped me to get this out earlier so we can all think ahead.
I can see so many bullish charts out here in Commodities and Equities. Some posted above , but too many to mention really. After the opening hour Monday…we’ll likely have a better idea of what wants to run higher.
Have a great weekend
Thanks Alex for the “balanced” analysis. The “if this then that” approach is absolutely essential in this market environment.
Keep up the great research, it’s helping me be more profitable in my trading results.
Very kind of you , thanks Stu!
Well, we know a bit from the (brief) futures trading on Friday. Stocks took a dive, SPX down 20+, and the dollar did too (so maybe gold gets a boost; no trading there on Fri). Now the question is, will this stick?
Exactly Troy (Can I call you Troy) ….Will this stick or just a head fake. Thats why I think I mentioned in the report that maybe after the 1st hour we would know better. Sometimes thats all it takes for the knee jerk reaction to run its course.
Sitting right on the bottom of that wedge is not a good place to be if we drop & close down there on heavy bvolume.
I’m thinking crude oil long looks pretty good here, unless maybe it really gaps higher too much to chase at the open. Anybody else thinking the same?
Wanted a quick trade in NUGT or JNUG also, but up nearly 10% +/- this morning, so don’t see good entry yet. Maybe best play is wait for GDX $20 and play breakout or rollover?
At this point….the ETF’s likely could be bought at the daily cycle low for lower risk of drawdown, but some of these Miners just moving off their lows look like they may want to run further ( See VGZ , TRX, MUX, EGI,PPP, NG , PZG etc etc etc )
The problem is some have gapped BIG, I am watching others that have not moved so much yet.
Thanks, Alex, will look for tomorrow’s report for more clues. Smaller range on NUGT, most money was mad at the gap up. So I chased UWTI instead, awesome move on crude this morning. Sustained energy towards target in your report would be awesome!
Energy looks great here. SFY and RIG breaking our strong, EXXI wants to go to $5 on AB=CD. CVI had a nice pullback 61.8% and should take off. Made for selling NUGT on Thursday, what a pop.
Hey Bill, Many Energy & Miners today looking nice
I need to address GOLDS move in the next report.
Bill, thanks for sharing, learning a lot from some of your posts. Holding EXXI strong, stop just below upward curving 50 day. $5 would be awesome. Let us know if you start pulling some off the table. I already went one round trip with this one!
So is this a breakout I am seeing with SZYM? Thinking of adding to my position.
Tough to tell. That stock seems to do quick up and down moves. Just dropped a quick 9 cents. I think if it recovers it’s high for the day we might have something. Volume is strong.
I believe it is a break out from a 1 month triangle and it should test the former high at $3.50 (as a minimum) if volume continues to increase . If it breaks out strongly above there… it could surge.
Thanks. I hope we have a real breakout here. Been practicing some patience on this one – hardest thing for me to do 🙂
I hear you : )
I have owned this for over a month now too ( $2.40 -$2.60 area). I love that base,because they can get explosive so I have been holding , but I TOTALLY agree…I almost dumped it a few times just to take profit and go elsewhere.
I just keep looking at this base ( refresh for original chart) and thinking that it could pay off nicely. IF we remain in this trading range, I would maybe ‘trade’ it sell highs, but lows, but it was bouncing off of the 50sma, it is now NOT breaking below the 34 sma. That shows a bit of strength.
PEIX looking good as well. If it can get past the high from its earning pop could run to next resistance around 15$.
I was just looking at how much the 4 month charts for PEIX & CLNE look like TWINS.
SZYM somewhat close too. All look bullishly aligned
Yeah I was starting to get frustrated with CLNE this morning. Put a stop in then it popped higher. Looking good again now.
CLNE was having trouble at resistance near upper BB. It may continue up, but I went ahead and sold today, had sold profits, wanted to keep for sire.
Alex, looks like the coal stocks are perking up as well. Any thoughts on KOL, ACI, BTU or others in this sector?
Not sure, they really dont look exactly ready yet. They seem to be possibly bottoming & setting up, but The only one I like is the set up on ACI.
KOL only has 22,000 in volume, I wouldnt trade that.