
Checking the Charts
Friday the stock market is closed , but I have a lot to say after yesterday, so lets check the charts and see whats happening at the end of our trading week…
.
In this chart Yesterday, I had pointed out that the NASDAQ had a gap to fill and support at the wedge, would it hold?
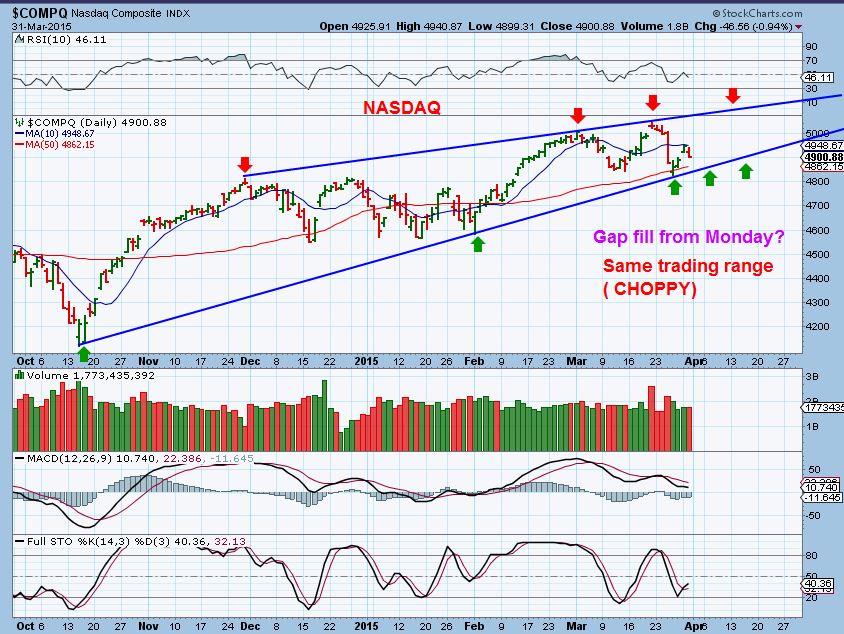
This is the chart from the close Wednesday…
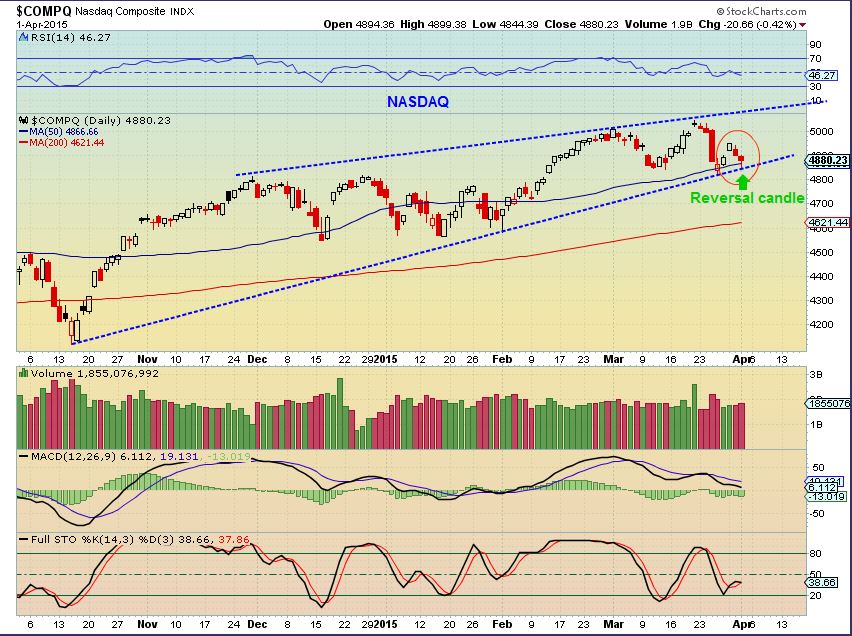
NASDAQ- That was actually bounced off of the lower line. Easy “Long” entry for nimble traders that have been using TQQQ & SQQQ at the highs and lows of the wedge. With futures down as I write, those nimble traders may get a second chance, but wait for a reversal again. The wedge is nearing the Apex, that MACD looks weak. USE STOPS & HONOR THEM PLEASE.
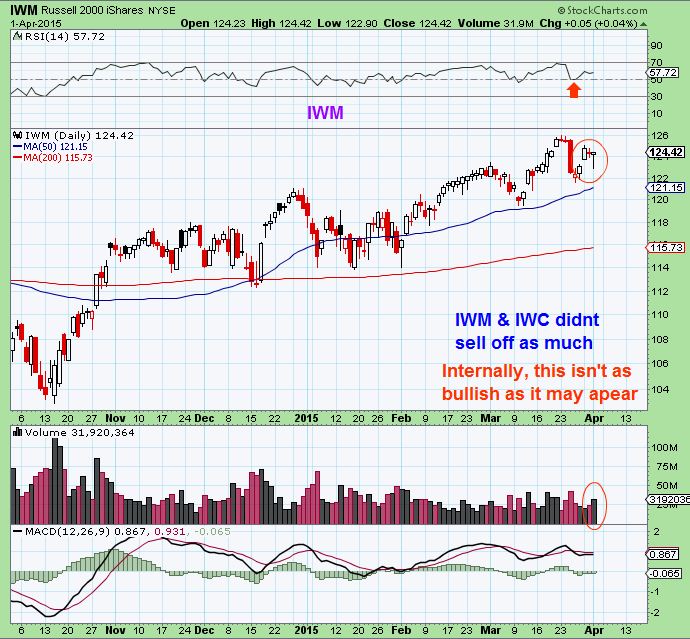
IWM- the small caps and micro caps held up better, A nice gap fill and reversal as expected, but I am now starting to see internal cracks in the small caps too. I will monitor that going forward.
Wednesday I pointed out this bullish pattern in OIL, with cautionary note if it breaks down. It broke out higher.
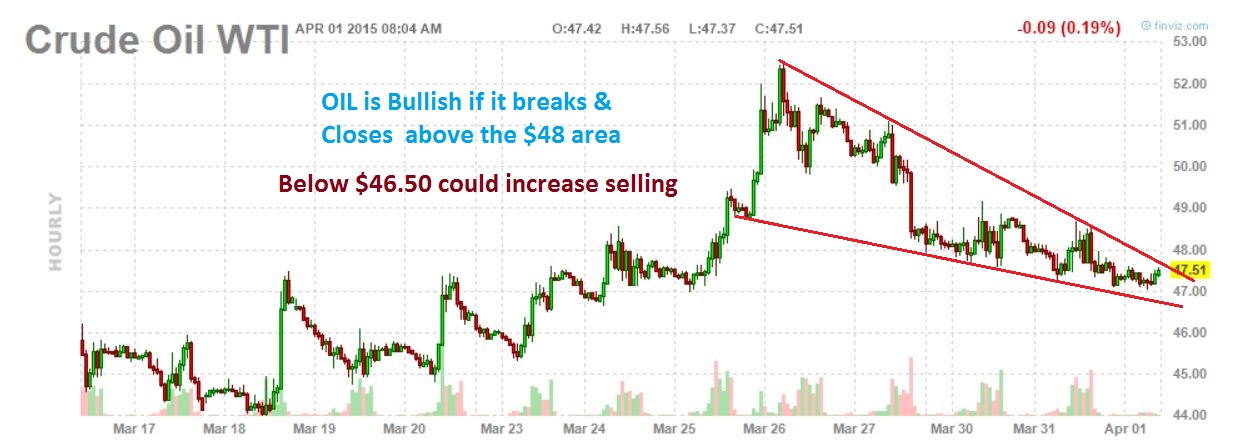
WTIC DAILY – Nice volume on the past couple of up days. Trading range & ‘Base”.
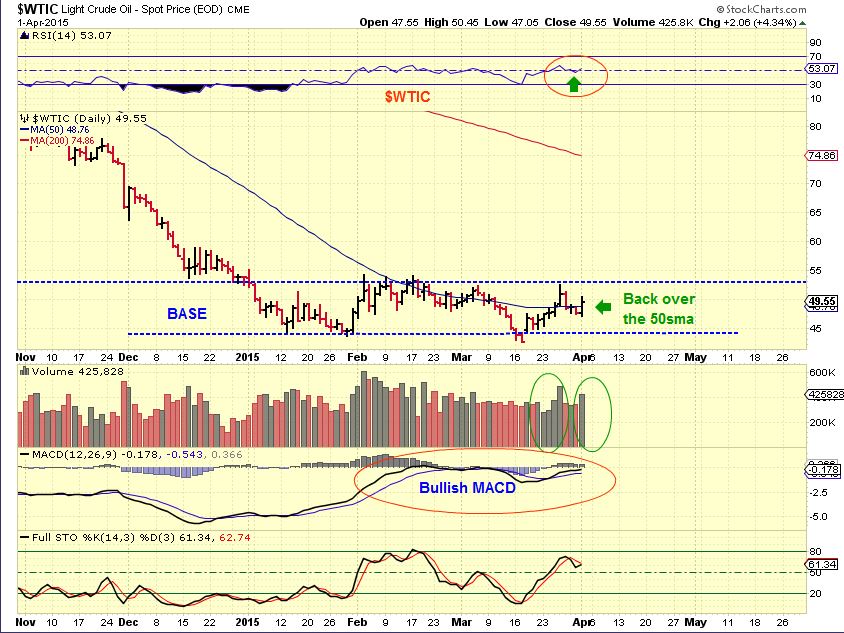
Some energy stocks are doing very well, other aren’t even rising on days when OIL shoots up 4+% like today ! I decided for myself as a trader in front of the screen to trade leveraged ETF’s for oil (Still holding BAS, EXXI , SZYM. Sold REXX as it lingers below the 50sma and traded UWTI).
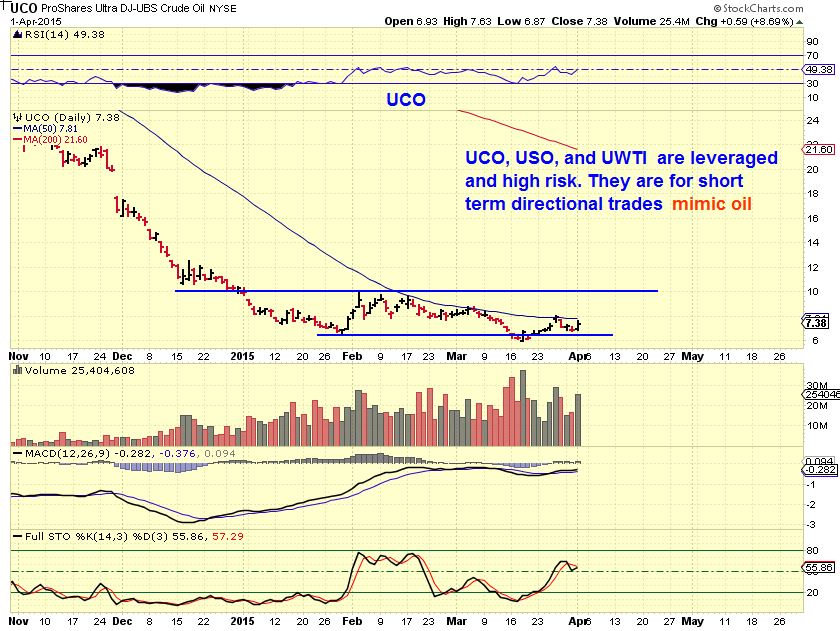
Leveraged ETFs are for short term trades , they decay in sideways markets. I am NOT recommending them to everyone here , the same way I dont like to recommend NUGT, JUNG, DUST, JDST. I know some here are experienced traders , so I will mention this for those who feel that they can manage their own entry and exit.
For ex: This is UCO – UCO & USO ( and UWTI ) Move similar to OIL itself. The charts look the same and so you would trade them the same. I trade them within this “Base” range for now.
The big story Wednesday was GOLD / SILVER / AND MINERS
What are they doing? Today looked really bullish in many ways.
Lets review-
Cycle-wise , that whole sell off in Feb-March and trying to count daily cycles had most cycle specialists struggling ( and disagreeing) when it came to figuring out where we were. I dont consider myself a cycle specialist, but I do know how they work and I do use them. I was definitely struggling with cycle count too).
SO using Cycles , I have been very cautious of where we could be.
Using just ‘Technical Analysis’, things got bullish again– You may recall that I got a special BUY signal on GDX RSI (2) . I bought NUGT & held for 3 days. Since I expected a roll over into an ICL after GOLD tags the 50sma ,I didnt hold my long positions.
-Below was some of our bullish looking technical analysis –
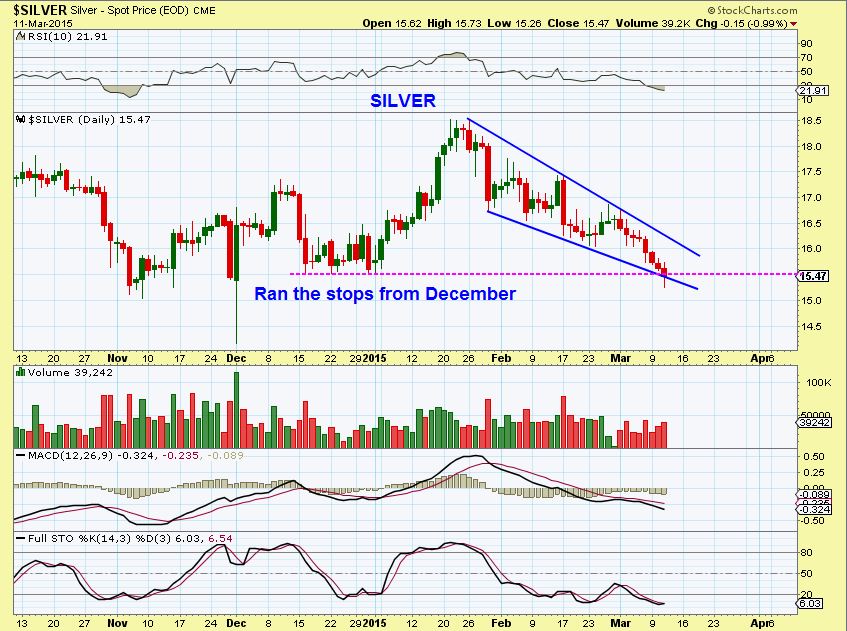
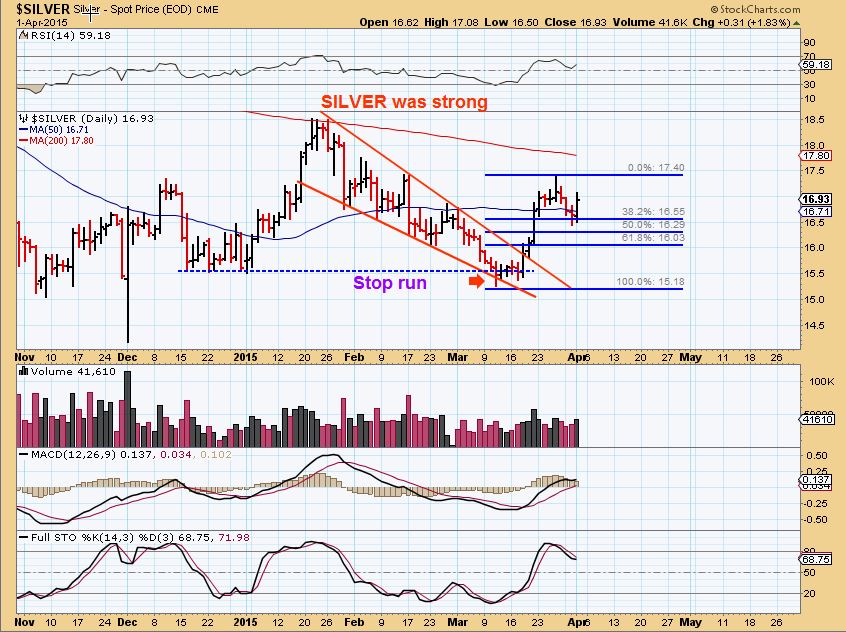
SILVER- On March 11 – I pointed out a “Stop run”. That is a ‘buy’ in TECH ANALYSIS, because it presents a low risk entry. That ended up being THE LOWS so far …
SILVER has been very strong since then, pulling back on 38%.
I posted this bullish GOLD chart March 31. That is a break out & back test. I usually BUY those.
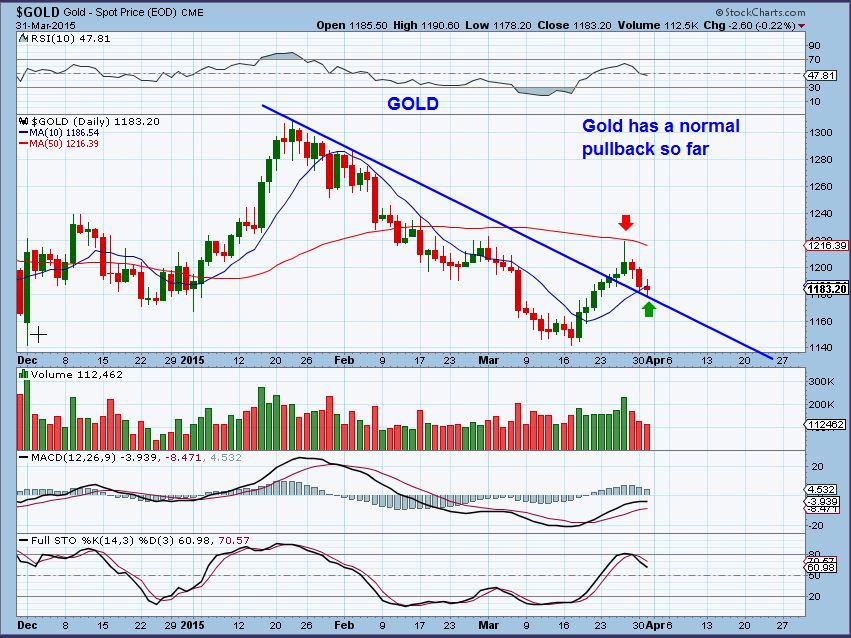
Today …boom! It looks Bullish and can go higher, but may find resistance at the 200sma? Also Gold is on day 12 today, so it can & will eventually drop into a daily cycle low. That will be a buy.
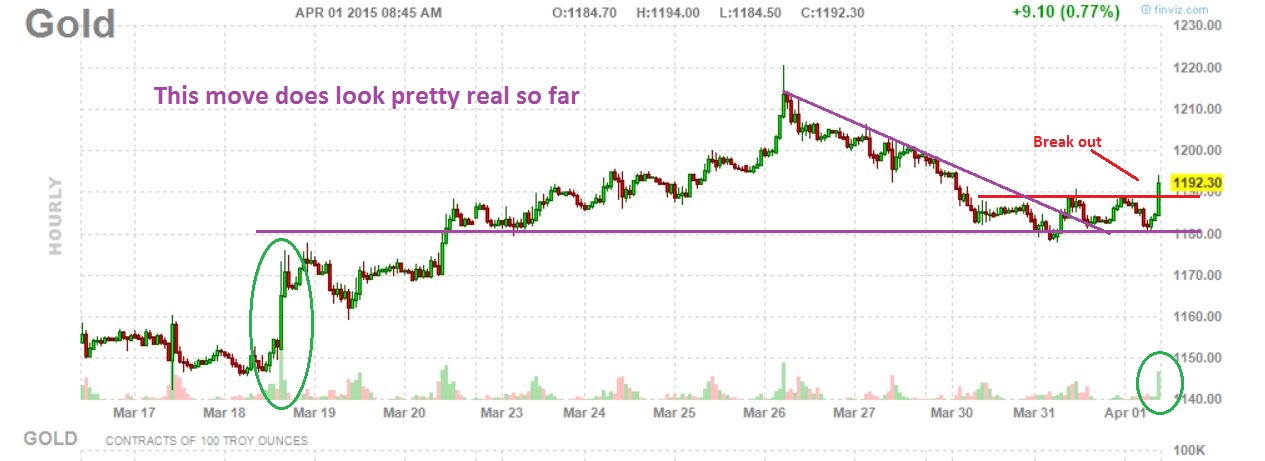
I posted this in the WED report along with a bull flag. As a trader I bought NUGT , once I saw the volumes in the first hour. I do not have any idea how long I will be in this trade with a 3 day weekend upon us. (Click on this or any chart)
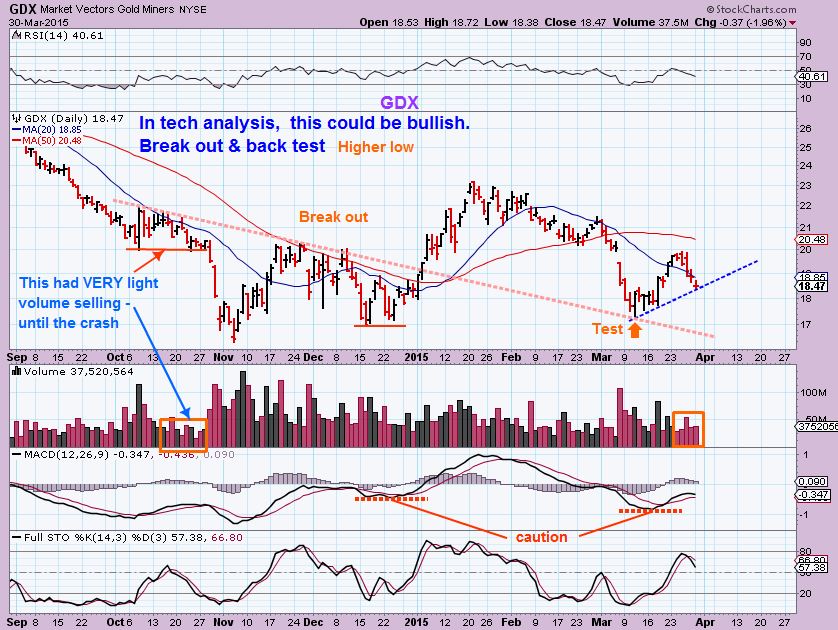
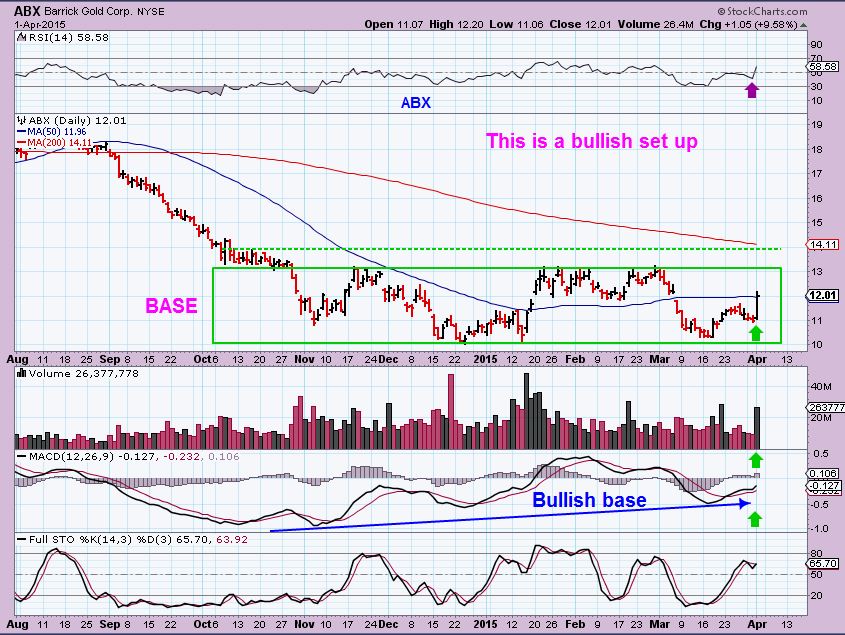
I had posted the bullish version of GDX on March 30, the ‘Break out” had back tested. ( but again I was still cautious thinking an ICL (deep lows) could be in front of us. In order not to get emotional over a bullish chart, I said that I was watching the inner ‘components’ of GDX- (GG, ABX , NEM) for clues.
So Wednesday – Look at ABX – this move was real, and I mentioned it in the ‘comments’ intra-day. Big Volume & Price spread. It completely swallowed the last 4 down days and even went higher. Many Miners have formed nice bases.
Let me explain my thinking the past few weeks
It seemed too early for an ICL, since they had been arriving roughly 5+ to 6 months apart. It had only been about 4 months in March. I drew this chart today to point out that & 1 other thing. I looked at how each 1st & 2nd daily cycle played out (Boxes) at past ICL’s also. They all look pretty different.
IF this was the ICL (Meaningful trade-able low) in March , its ‘starting point’ looks similar to the green box with a short run up & then a dip (Green circle) like we just saw. I added the projected path , a Run to the 200sma, sideways to a ( Daily cycle low DCL ), then higher. Just a guess, since they all played out a bit differently.
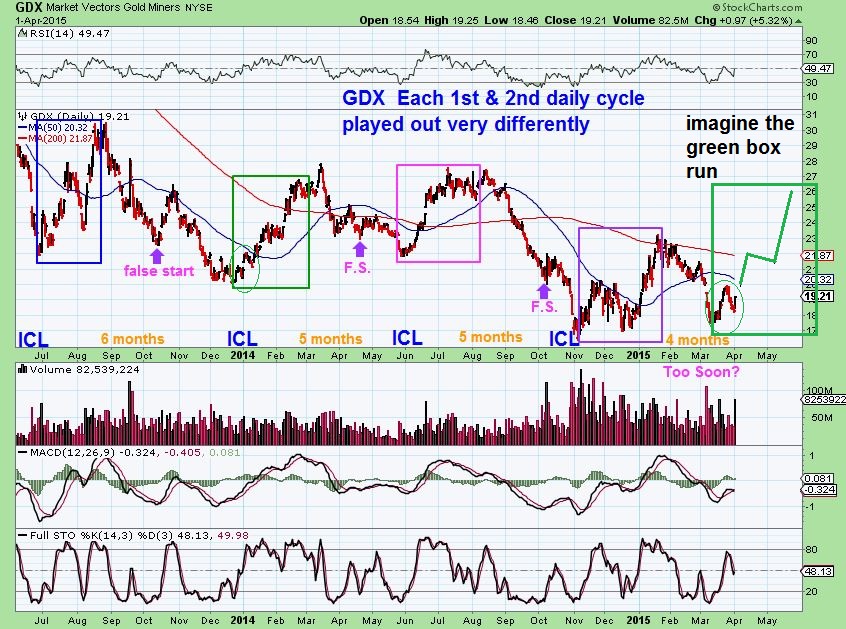
Please understand that at this point , there is no definite way for me to know if this is the ICL in March & it’s going to just keep going higher, or roll over like last October or other areas on the above chart when the daily cycle failed.
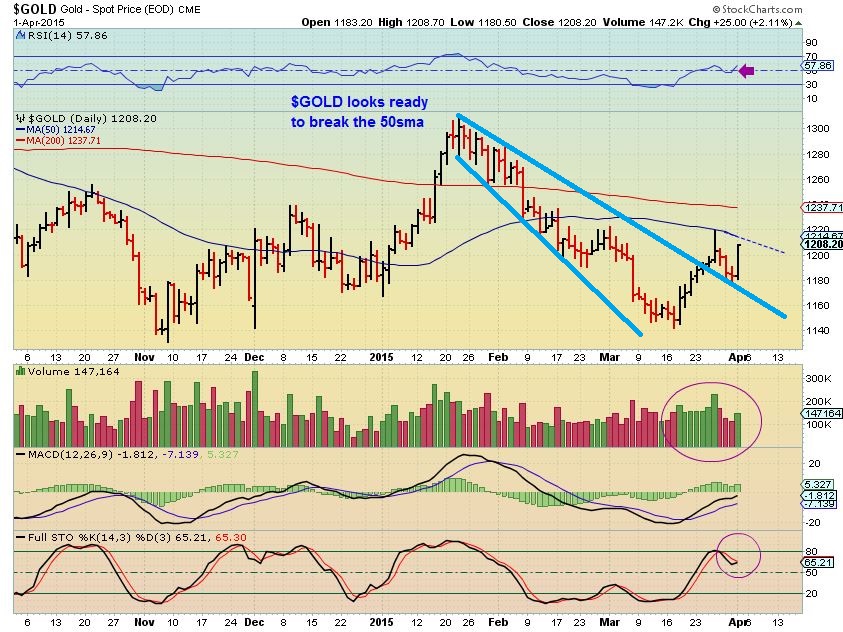
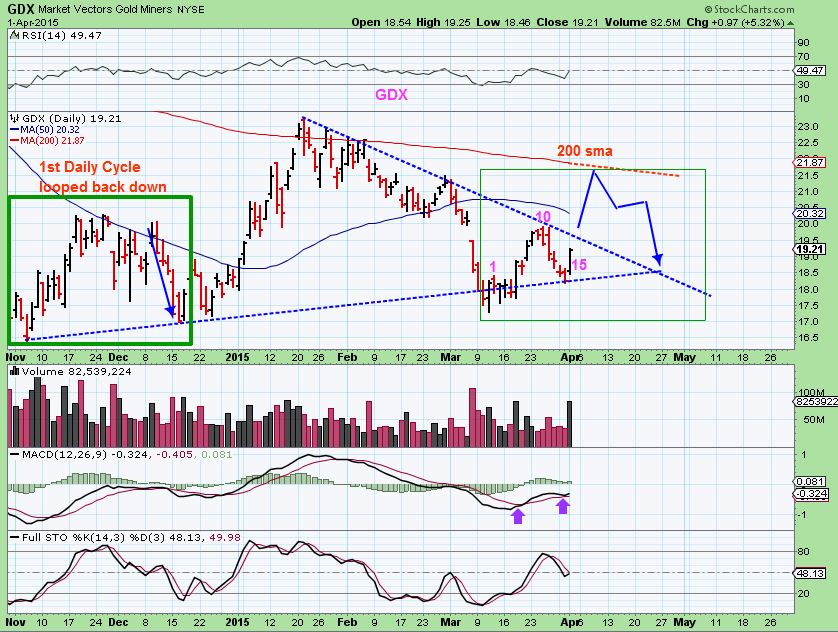
I also drew this for GDX, showing the cycle count that resembles last Nov- Dec. Last Nov Miners ran up & dropped in the first daily cycle. It would indicate that we may rise to the 200sma and find resistance later in the cycle. A dip right back down for a daily cycle low . Thats the buy. See the Blue trendline down? We may now break out , & That could test this future break out and bring price right back here for a buying opportunity.
1. A run higher & drop back down happened that way in NOV – DEC ‘s First Daily Cycle ( see the green box on the left) .
2. The money was made in that 2nd daily cycles rise. We will recognize that DCL when it comes.
SUMMARY
SO thats it for today. Again, we have only one trading day left this week . We have been watching Metals markets for clues as to when the next Deep Trade-able Lows would come in (ICL) . The action in GOLD, SILVER, and MINERS was surprising and now the question is , “What will happen next?” With Gold not trading Friday, Saturday, and resuming Sunday night- will people want to hold long positions? Also on my mind is the thought that with the unrest in the Mid-East, would anyone want to be ‘short’ Gold going into a 3 day weekend? It seems that if there was a chance of something related to further wars and crisis breaking out over there, traders might close their short positions today . That could push Gold higher . The NEXT DCL ( Daily Cycle Low) will be buy-able whether we still drop into an ICL or whether its a 1st daily cycle low after an ICL. Look back at all 2nd daily cycles and you’ll see good gains.
Many Miners now look quite bullish on their individual charts, so I am thinking of possibly taking a couple of positions if we get the normal pullback . I will look for Low risk positions , as shown on this chart. For the conservative trader/investor….The SAFE BUY is waiting for the next pullback into a daily cycle low.
For those who like to look up their own charts ( Tjis report took 4 hrs, I am out of time to collect , draw them up, and post here) –
I am watching bullish set ups in SOLAR STOCKS ( TSL, JKS,CSIQ, SOL , CSUN JASO , etc ). I still like many ENERGY Stocks , over the 50sma is getting important…..charts of ANW, ALJ, NOG, GNE, CDXS, GTE, GPRE and more actually look great in various ways) . I like STEEL AND ALUMINUM ( X, STLD, AKS, AA, CENX ) . In the past I mentioned MEDIA stocks doing great, so look at “MEG” . On a down day this looks set to break out ( I also follow Lions gate and NXST, SBGI, and a few others) .
Have a great day & 3 day weekend ! If we get a light volume pullback in Gold today, I will have a few MINERS CHARTS in the weekend report. I cannot tell for sure if the ICL was in in March and that was a 1/2 cycle dip or not, but it does look Bullish and likely that Gold runs to the 200sma sooner than later.
~ALEX


Thanks Alex, all the information we need. I am also in NUGT, so post if you see things headed south. I plan on getting out today because of the long weekend. I still own BAS and WRES, bought EXXI Yesterday. I’ll hold over the weekend unless things get bad today. Give us a little direction around 3:00 would be appreciated.
Hi Bill (Good grab on EXXI, I like that set up too)
Sorry I wont be around around 3. Last week when I kept saying I’d be away from my desk, my uncle was in hospice and has passed away . I wont be around later today . You’ll just have to look back at the charts in the reports today and yesterday and see what I was anticipating, then compare with what you see real time….or just go to cash if the 3 day weekend is too uncertain to you or you want to lock in profit & try again Monday.
I own a solar stock, Energy stock , and NUGT and so far I am not planning on selling ( Maybe NUGT to lock in profit if things dont look right by noon, but I actually just bought the dip and added to SOL this a.m.).
Alex, sorry for you loss. My condolences.
Bill, I pared back any metals positions big before weekend, but decided to hold all energy but raise stops above my entry so barring a horrid gap down would be in the green. Really like energy here- it’s trading up with oil against market as necessary but then trades up with broad index when oil is down. Double positive influence is really working. Now that jobs is out Monday is going to he INTERESTING! Almost started oil long Thurs But didn’t want risk in front of report and Iran news still fresh. But that may have been the opportunity.
BAS is acting very correctly today : )
Good Morning Alex,
Looking at USO on a daily, how important is the 4/1 Low at 16.79 in your eyes ?
I am thinking that that low is the bottom of wave 2, if price dips below that low should I/We utilize that break to take profits in the energy stocks ?
Hi Ken,
I am trading each individual energy stock according to their own chart analysis. If you are more comfortable trading them against oil (or maybe raising stops) thats fine.
Oil has been in a base ( A trading range) but when it has dipped to all new lows March 16, it did not affect many Energy stocks. And some are really moving higher now within their own bases.
Take a look at GNE, GPRE, CPE, NOG , etc – they look bullish to me .
If you are trading USO or UCO or UWTI…I trade those as OIL moves, but not necessarily the energy stocks. Many look bullish still.
See BAS today
Ok…..I understand.
Lets look at BAS as an example though….I was filled at the 50 dma on 3/30 would you place your stop below the 50 dma now or possibly the 20 dma ? Or take some profits off the table now and let the rest run with a stop at break even ?
I think BAS may be confirming an A-B-C today and my target is near $9+.
How you play it is totally up to you. Let it ride , raise the stops is good. Take profit now never hurts, but if it is a confirmed A-B-C…I let it play out. I would say 90% of the time if the volume is strong, it will play out, so I take that chance with my full investment (thats just me)
Personally- I would let it ride and I would raise my stops along the way . If it is confirming an A-B-C , it shouldnt drop below todays low really .
OK……Thanks Alex !
Thanks for answer, I had essentially the same question with EXXI. Looks strong and oil may continue up next week with USD down. I want to maximize profit of course, but I already took one round trip giving profits up. Don’t plan on doing that again. But you also don’t want to be so close that you choke trade out early or quick hiccup. Definitely an art to it…
Actually – its a different answer for EXXI- it is not in a confirmed A-B-C
needs more time to know
Alex, any thoughts on NADL? It seems to be bouncing off a low with strong support.
NADL is interesting, but I am not touching it until it shows some buying ( that doesn’t mean you cant with a stop at support).
When OIL bottomed NADL really took off a couple of time ( see January). Some of this may have been short cover & then buyers stepping in.
After the sell off brought it back to lows, I looked into NADL and found that they have ties with Russia , and that may be why it has less buying now. Geo-risk. It does look to be putting in a base, but I am not sure how long it will linger at lows ( or when it’ll take off). I’m just watching it as a lagger so far.
Alex
No rush, but I’d love your opinion on EGI long term hold? and what level would you step in and buy more shares if it was worthy of a long term hold.
Hi Steven
Thats a tough one, because it involves fundamental as well as chart set up.
( Refresh to see the chart attached (2 yr) and see that it has been in a straight down since March 2014. You would need it to break out of that , and it may take a solid bottom in GOLD to do that, since it hasn’t really done very much in any of the ICL’s we have seen.
Fundamentally they claim to have 33 million in cash, but also had a net loss of 8.6 million in 2014 and 11 million in 2013. I dont think it’d be accurate for me to try to guess when they will have a turn around, but if you keep an eye on it and see signs of life ( a break from that downtrend…maybe a sideways base ) you can ask me again and I’ll look at the charts. Hope that helps.
Thanks
Yeah, sorry, I know it was vague and you probably really want to say ‘ thanks for nothing ‘ : )
It’s just tough looking at that chart and thinking that it may turn up , may get cut in 1/2 again. On their earnings day a couple days ago it looks like it dropped from $.18 to $.08 and back . If that was a real tick…yikes.
STEEEEEEEEEEEEEEEEEEEVE!
I’m sure you saw it…maybe you bought it as it broke the upper trend line??
I will be away from my desk for the rest of today….Have a good weekend all!
All good Alex. I think they have some agreement with SAND, I saw that .08 actually looks like it ran stops on that chart you drew, I think one gold does find a floor it could easily double.
I used to trade that when it was $2. When Gold finds a floor I think ( If they are still in business, and the 33 Million cash should help) they will much more than double.
And that drop to .08, I cant tell if it wads a panic sell on earnings? fat finger accident? or bad tick. crazy .
Do you believe this, looks like it’s breaking out, my luck is the worst.
lol….happens 2me all the time 2.. no worries..as CF says… “there’s always another trade”… annnd there really actually is…;o)
There really is always another trade…even a Better one just around the corner : )
True, actually pretty heavy in szym, looks like it’s in a triangle consolidation over last two months
Good spot to buy CVI, RIG or PACD here. REXX looks to be finally moving. RES looks good!
Hey Bill,
Rexx is moving because I sold it the other day ; )
I added GDP and BAS today . Many are looking interesting for a down day in oil, huh? TPLM, KEG, REXX starting up , CRK, WRES, SFY off lows?
And now I am gone for the day (Again) : )
lol.
Good 3 day weekend to you Alex. Thanks for all your tips!!!
You too Shermo, thanks.
Framework for nuclear deal with Iran announced. Not helping things much here.
I am sorry for your loss Alex -My thoughts & Prayers with your family during this difficult time !! OIL is coming back..picked up few during this pull back for day trade..will close by end of the day.
Condolences on the loss of your uncle Alex. Hope you guys are coping ok.
Thank You Carl, ‘
We are doing well, my aunt is a little ‘lost’ and going through the motions, so we are just trying to be helpfl to her. Thx again!
Thanks Ash- I Appreciate that .
have a nice holiday weekend Alex and all … :o)
You too Maria. Thanks
Be safe Maria…stay away from those 4 foot chocolate bunnies! 🙂
🙂
what on earth? LOL .. i have NO clue how that climber got uploaded!! oops.. i just meant to upload the bunnys…
sorry….
STEVE asked me about EGI today (Before it moved). Did everyone see that move? And XRA? and a few others…very interesting action in some Miners and Energy today ( with oil & Gold down) : )
Hi Alex, Going to be a slow day. I sold my NUGT late yesterday, Broke Even. Still holding Energy. What are your thoughts on using harmonic patterns for technical analysis?
verrry slow… yes… ;o) looks like the sun is trying to peek out tho… :o) Happy Day….
Hello Alex ,sry for bothering you on holidays and also happy holidays to you and youre family 🙂 I have a small question ,iam in MHR and yhis news just came in http://www.wsj.com/articles/sec-warns-magnum-hunter-of-possible-enforcement-action-1428096977
Do you know what kind of effect or impact will have on the company ,will it dive? Again sry for bothering and happy holidays …tnx for the replay 🙂
I cant tell because it has to do with their financial reporting BEFORE 2013.
Not sure if it will be considered problematic at this point.