Things seem to be playing out as expected, but that still leaves a few unanswered questions longer term. Lets look at some charts…
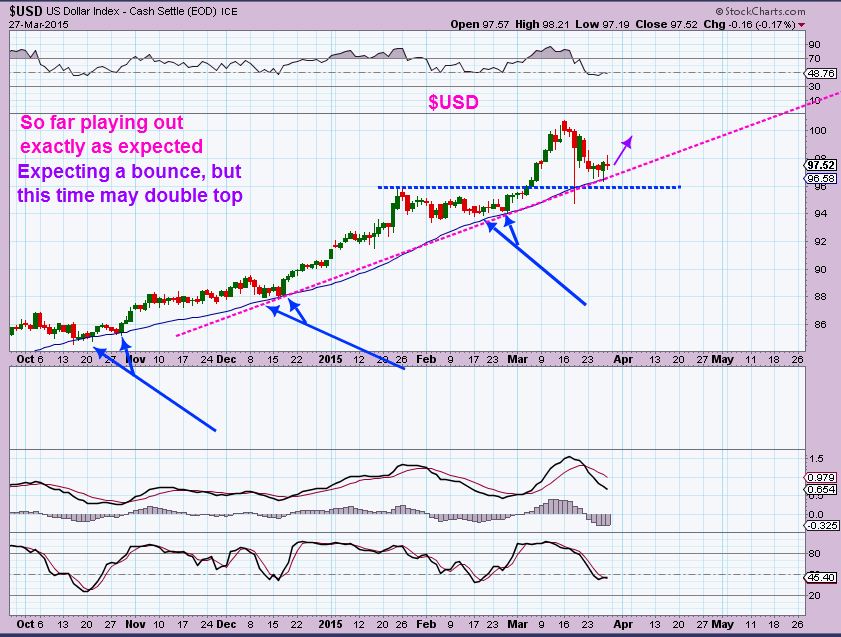
$USD – the pullback has acted exactly as expected (So far)
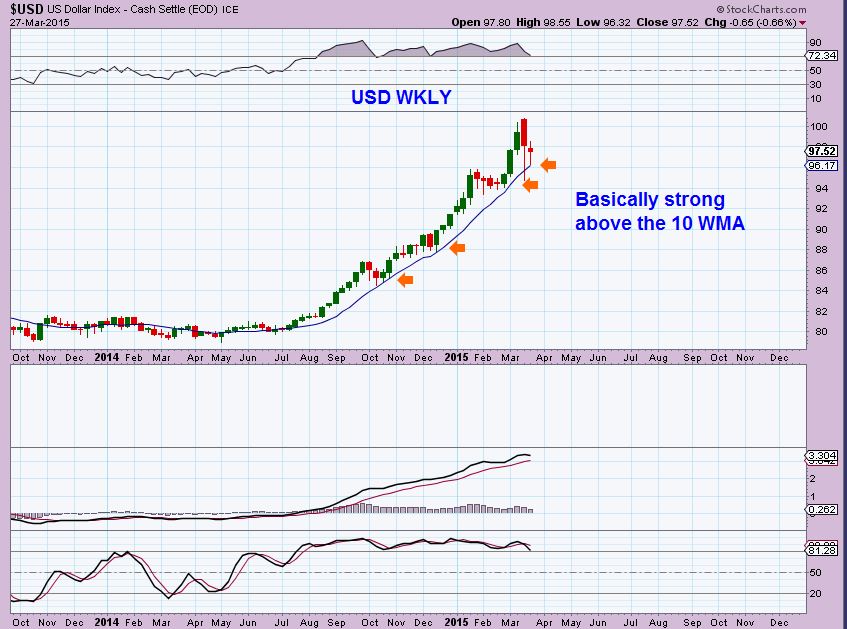
The weekly chart of the Dollar has been very strong…
Here is what I am watching on the Wkly chart
Honestly, If you re-read Thursday and Fridays report, it is more of the same in many sectors. The moves have been small, so for some sections this will be more of a review than any new information until things play out a bit more.
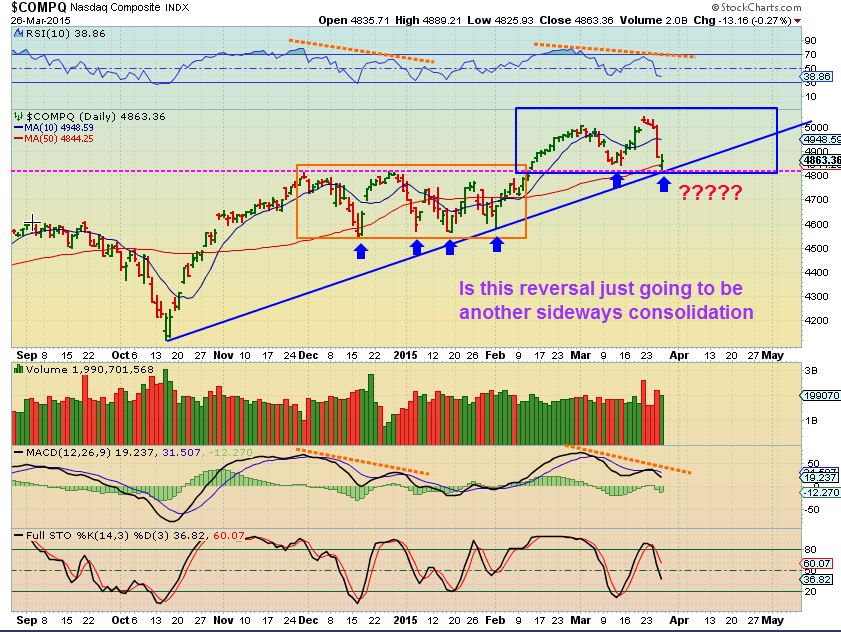
NASDAQ Wedge as of March 24
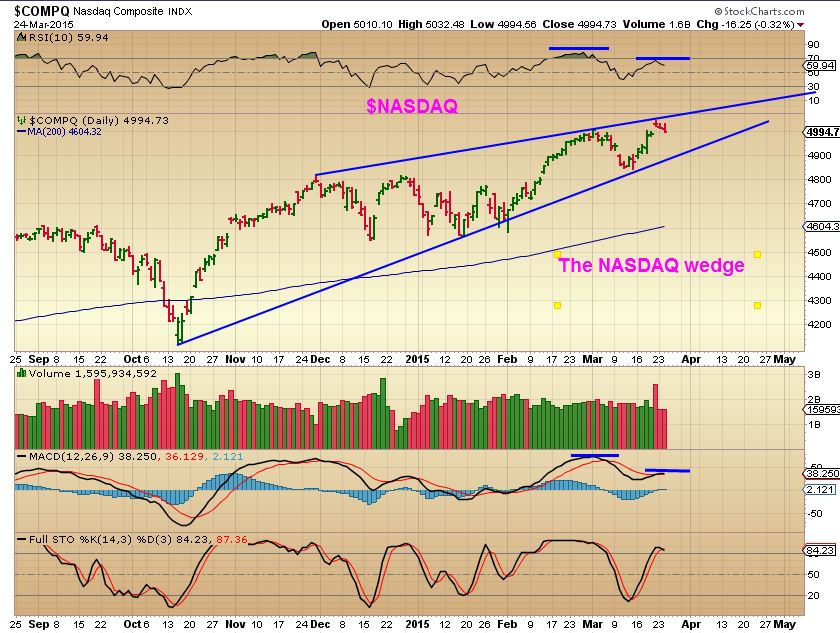
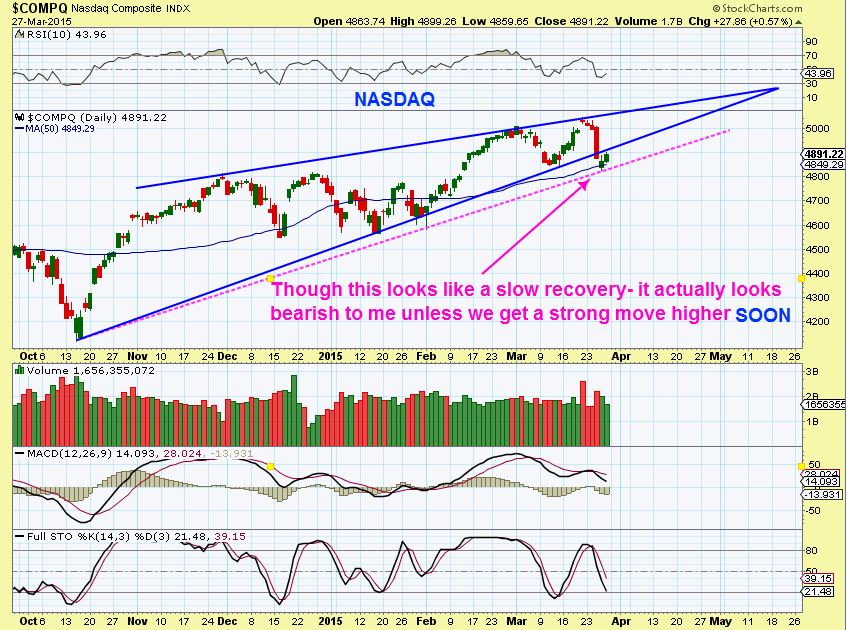
The NASDAQ – Broke down from my original wedge, but held the 50sma. This still looks weak in many ways longer term. We need a move higher fast, or this could just be a pause on the way down.
In my last report I mentioned that we may just see more of that sideways consolidation type activity ( Choppy short directional) as the wedge plays out. Even a run to new highs remains inside that wedge.
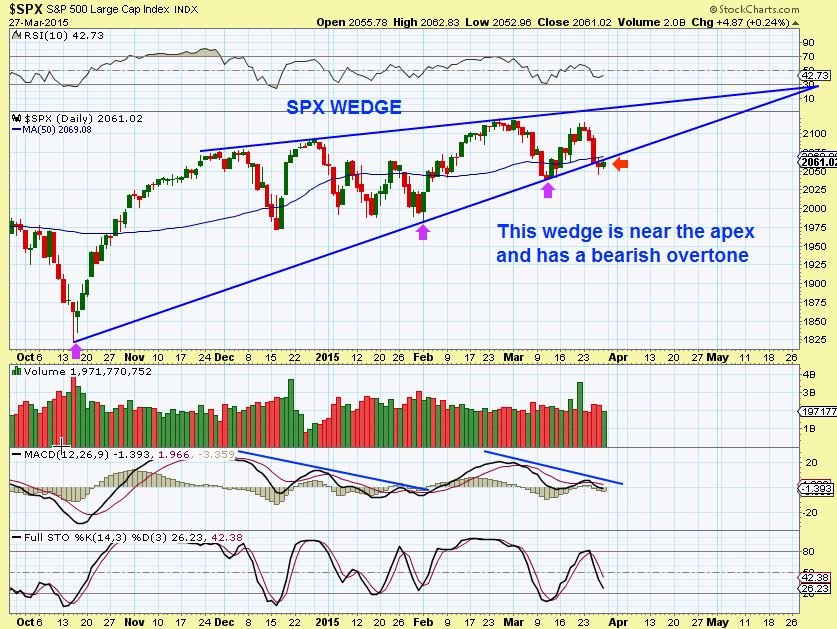
SPX March 27– long term bearish, but is now at the bottom of the wedge and could pop higher.
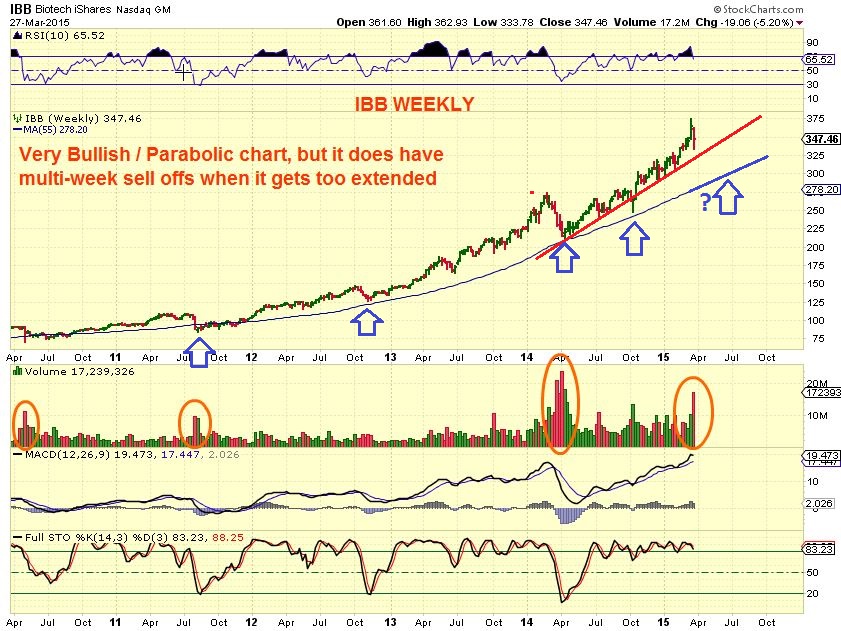
Biotech IBB WKLY – on fire for sure , but can experience multi week sell offs, as seen in the past. If it does a parabolic blow off top type move, it’ll probably hold the red line for now.
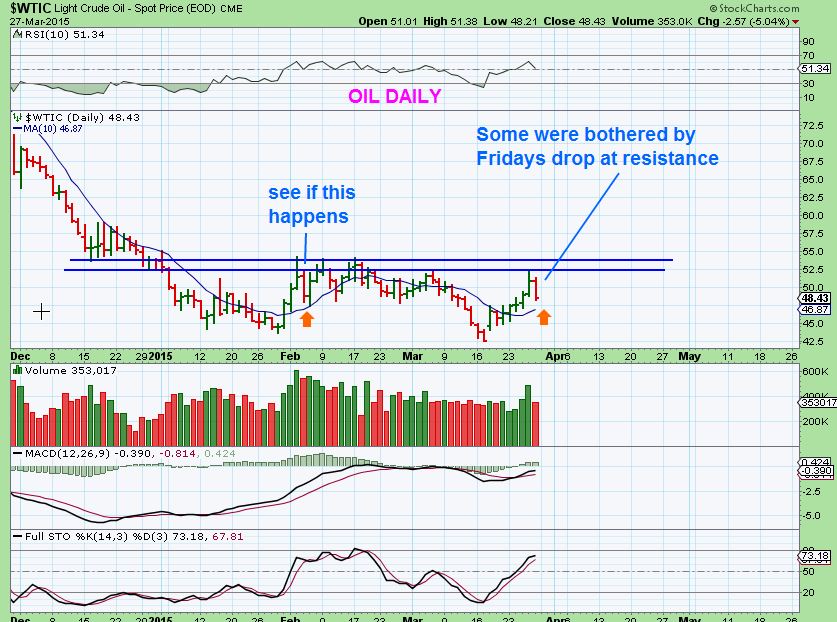
OIL WKLY
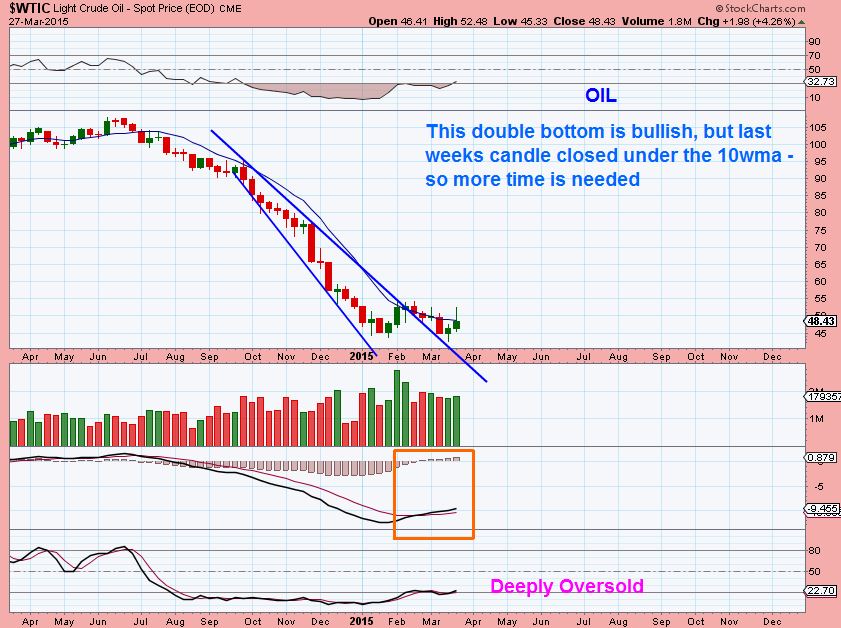
OIL DAILY- yes we had a big sell day Friday, but look at the Orange Arrows. Early Wednesdy had a slam down day. The next day dropped lower to the 10sma & reversed back upward, so we just need to see how this plays out .
GOLD / SILVER / MINERS – some believe we have put in an ICL, which means this pullback would be shallow. If we havent , we should break down . Time will tell as we pull back.
I have pointed out that in the past ( See OCT 2014 for example) strong rallies get many to go long & then have rolled over, so I am watching for that possibility.
I drew this for us MARCH 16 to point out that possibility that we could rally & break out ( green arrow) then drop to test (Magenta arrows) .
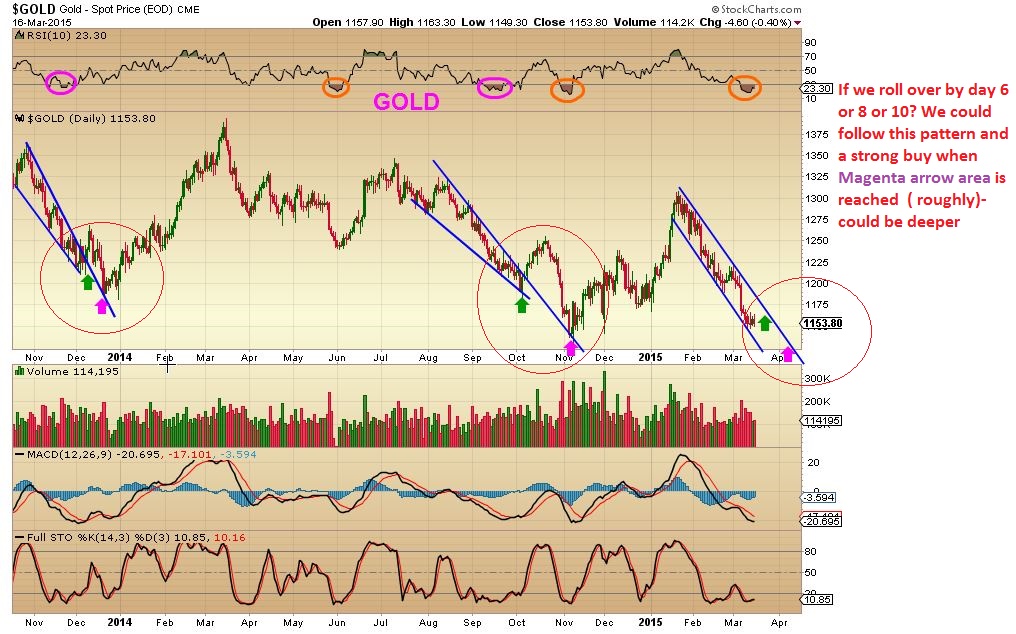
Here we were MARCH 27 and we have rallied for the break out. Last week we’ve started to pull back. I expected this possibility , so we’ll see if it plays out. A strong break higher now ( or a higher low) would likely mean the ICL was in place early.
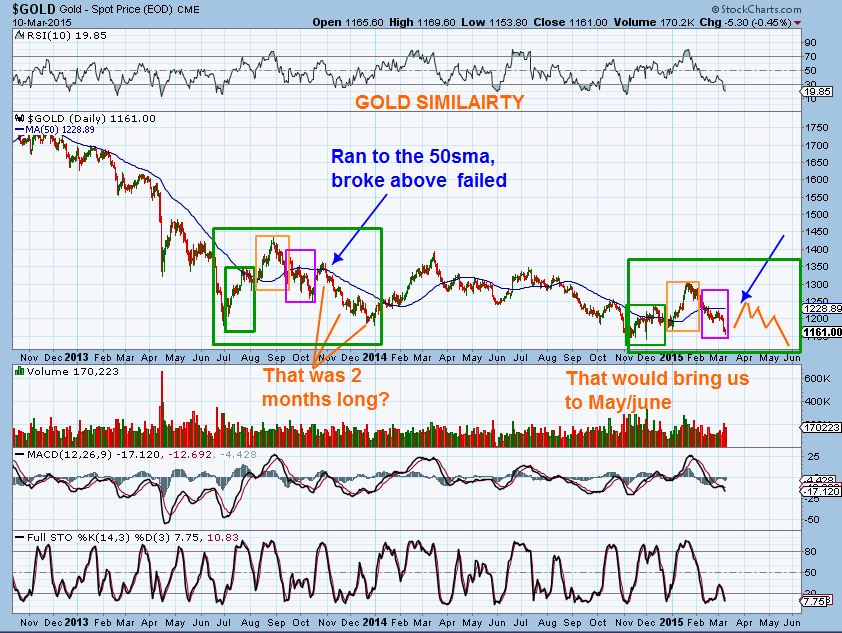
I have also shown this chart ( March 10) as a reminder that if Gold rallied and then sold off, it would become a great buying opportunity. We dont want to allow the “Fear” and emotions that will come at that time to sway us. Since this chart was draw, we have rallied.
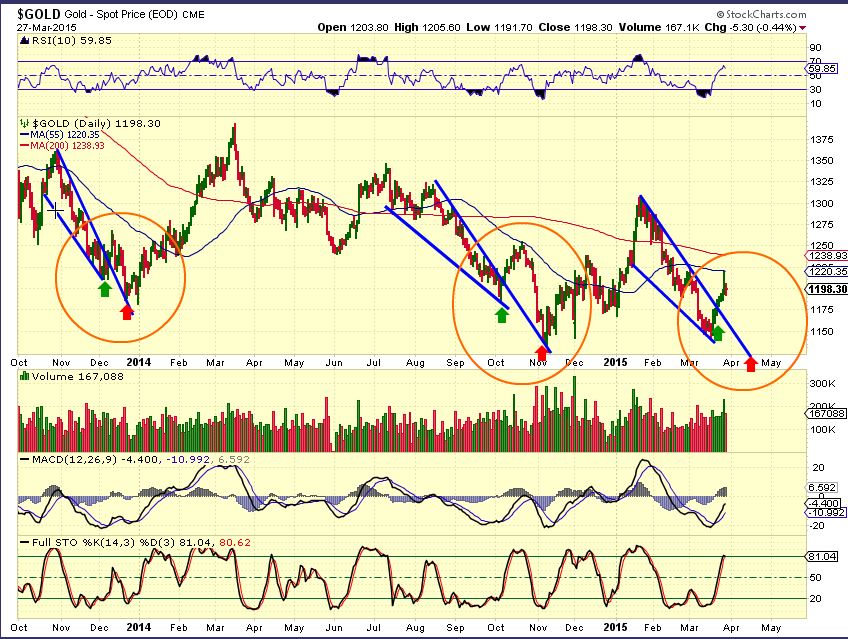
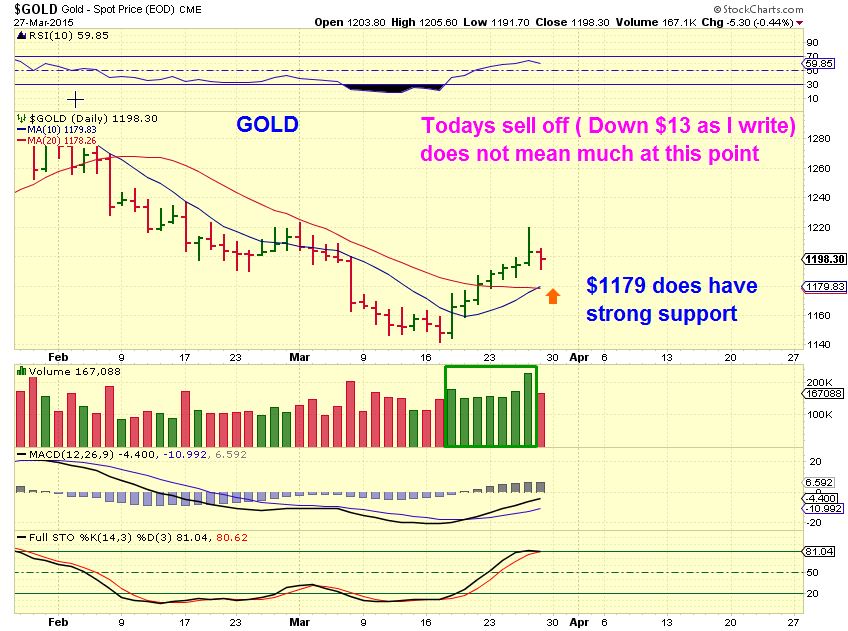
GOLD DAILY – Thursday chart below – rejected at the 50sma ( Dropped further Friday)
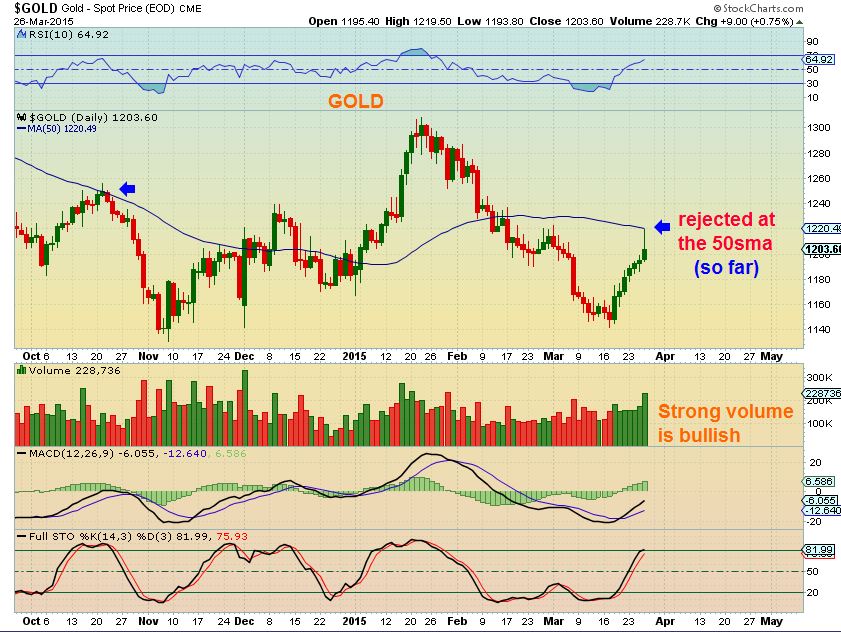
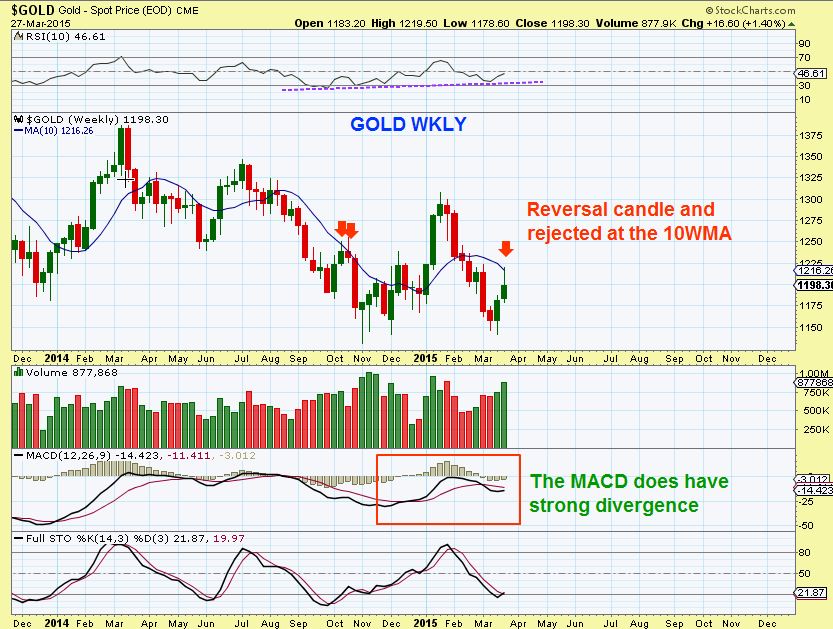
So that leaved us with the weekly …
GOLD WKLY- Rejected so far
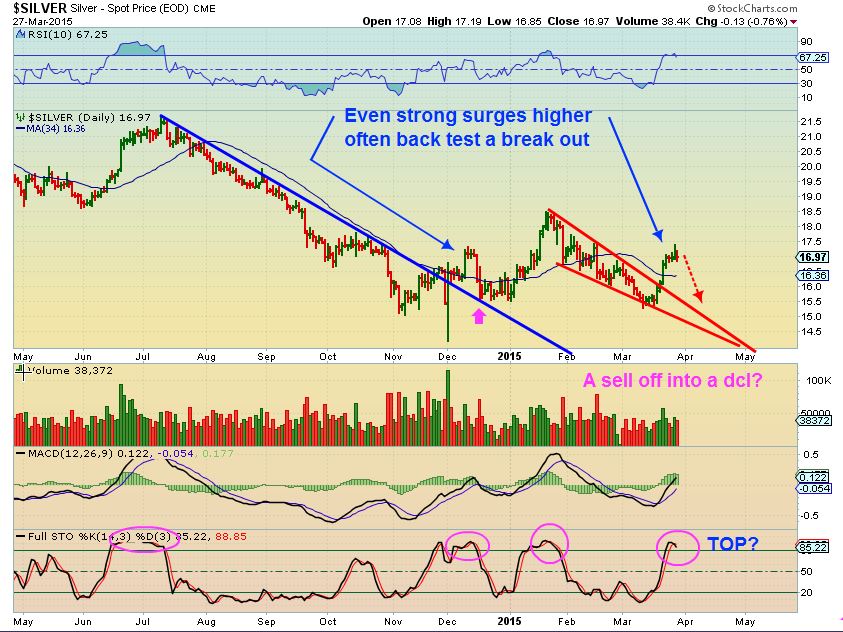
$SILVER – a drop from here to an ICL could “test” that break out. A smaller drop and break above recent highs would be quite bullish.
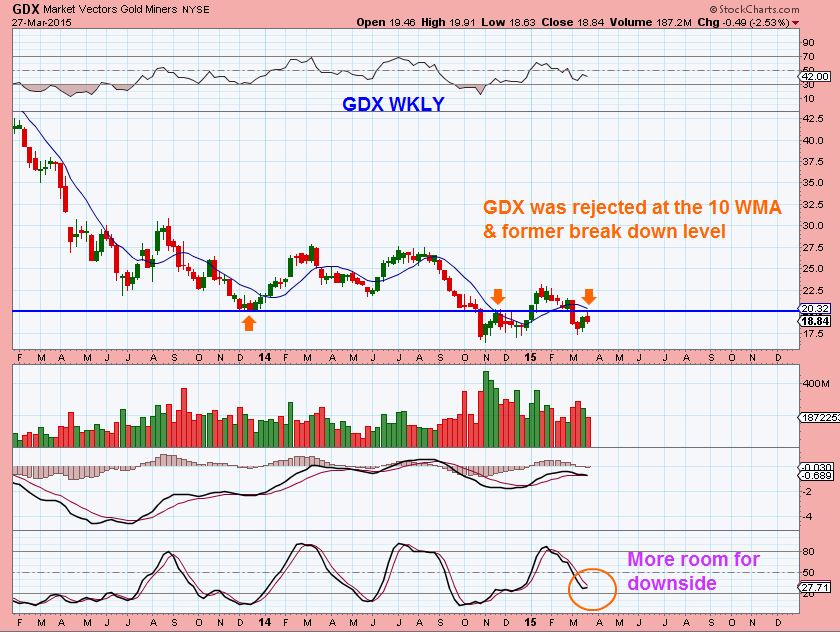
GDX WKLY – did not recover the recent break down yet, and was rejected . We need more time to see how this plays out.
I think a great buying opportunity is coming again in Metals and Miners. In the past I have traded these opportunities and done very well. Many Miners ran up 80- 100+% during the run up out of those lows in November, so I will be watching for this trading opportunity closely as time goes on. I bought the recent lows for a trade, but got out early. I currently still own my energy trades, and I still think OIL is in a bottoming process. In the past it has bottomed very much like we are seeing right now.
Please remember to use & honor stops in these volatile markets. We have seen some very big swings , especially in some Bio-tech stocks. It can be difficult and even frustrating trading in markets that are choppy or volatile. For example: If a trade goes against you or you don’t feel that it is acting correctly, it may be best emotionally to just step aside and wait for another trade. I know that in Energy stocks EXXI ,GDP,& BAS were holding above the 50sma, so if you bought them there, you made money and then gave it back. That often becomes part of the choppy markets. REXX and several others seem to be struggling a bit more. I don’t know why, and I don’t know if it will regain it again or fall away ( I still own some), so if you arent comfortable with it, move to cash and wait for another set up , or even wait for a good trade in Miners or another sector. The XLE even lost the 50sma , likely due to XOM & CVX losing theirs.
I was away from my desk last Wed – Friday during the day, and expect the same this week. Things are expected to get back to normal for me after this week and I’ll be available in the comments section more . I wish you all a great trading day!
~ALEX
P.S. Gold is down $15 as I write, so yes Gold got rejected at the 50sma and sold off. NO it doesn’t automatically mean we now sell off to an ICL. It does NOT mean that it is a good time to ‘go short’ . Your low risk short was rejection at the 50sma, this could recover. Down $15 sounds like a lot, but Use this chart as a guide.
Trade using charts, not emotions…It is not a bearish chart yet, even with this mornings sell off. Even down $20 & reversing higher is Bullish.
Observations 
 Stacking Up
Scroll to top

Thanks Alex. I sold most of my energy stocks last week for profit. Didn’t like the way things were looking. Let us know the next low risk buy. Long energy or perhaps short miners.
Thanks
Bill
Hey Bill
There is also the possibility that this pullback is really a half cycle low. That tends to be a mid point pullback in the cycles 1st run up ( If that ICL were in place). A break above new recent highs – like Gold closing above the 50sma , could indicate that the ICL came early on the last sell off.
I personally just dont think thats the case at this point, but I want to be alert to the possibilities. The C.O.T. is still in a bullish area and any selling in Gold would increase that.
Silver dropped below it’s 50DMA which I think is cautionary. Gold stock indexes are at what should be short term support. If silver can regain it’s 50DMA I’d be willing to take a short term trade in the miners. If it doesn’t miners can break down a bit here and test their recent lows.
Silver, be careful…..looks like a head and shoulder pattern forming (see chart)
Gold stocks declining today on very light volume. NEM only at 1.6m right now.
I dont want to sound like a ‘know-it-all’ or jerk or something : ) but if I may say so… A true H&S happens or is more reliable in an uptrend.
I’m a stickler for details and I believe it is only a true head & shoulders if it forms in an uptrend ( A true H&S is basically a topping pattern , resulting from not enough buyers to really push it higher on each attempt).
The pattern in this chart is often how bottoms form . Yes, it can break down as a weekly bear flag or something, but not a true H&S .
I never knew that a True H & S is more reliable in an up trend …. Thx Alex !!
Yes, It was a pattern first recognized (and named) by William O’Neil as a slow motion ‘triple top’ that shows a tired uptrend . The neckline is shorted.
As a sidenote: He even says it is much more reliable if the right shoulder is lower than the left shoulder as it rolls over, because their is no conviction in the buyers . ( No buyers)
Miners? Looking back at a chart I posted on the 13th and where we are now (refresh). Alex, remember when we were talking about the double bottom process with the loop up and slam down. I had a few targets. Looks like we hit the high, and now are at the lower trend line. This not the ICL. But it might be a good spot here to buy GDX or NUGT? Thoughts?
I do remember the conversation of the bounce & dip off of the lows
SO far the selling in Gold and miners has been mild, I am still watching for now.
Gold is on the 10sma and the Miners GDX are on that trend line
WRES, SFY, PEIX and CLINE all look similar. SFY is positive, I would almost expect WRES to follow as these two charts look the same to me.
Took another short term trade in UGAZ just because it seems like NG is at the bottom of it’s recent trading range. Not giving it much room on the downside.
I agree that it is close to a bottom, I just wonder if what I mentioned about NATGAS doing the same thing that OIL did around March 16 ish (with a shake out bottom )
Starting to see some green in Energy, no pun intended. RIG, GDP, PEIX and CVI! Wow CVI can’t be stopped. 😉 I like WRES here, see chart!
FWIW……..
I think Oil (USO) on 3/19 was the ICL. Wave 1 complete on 3/26 working now on wave 2 down ……. Entered USO Jan. 16 Calls this afternoon for a wave 3 up.
Still holding a basket of energy stocks with defined risk…..these stocks may be a long term hold for me IF I am correct. Time will tell. 🙂
Yes, I am thinking along those lines . That is why I put that monthly OIL chart in a report last week.
I have been looking at some of the other Energy stocks to see if they are acting well.
There are a few that I really like the looks of, even on a longer term weekly ( like GNE, ALJ, MPC etc etc etc)
Agree…..
Alex,
When you get some time would you please comment on $sugar or SGG ?
I like it for a Long on a daily buy signal.
Hi Ken,
I have been eying WEAT, CORN, COW, and SGG.
SGG just doesnt look ready, and I dont have an adge on when it may. The others are decent bases
COW is a very interesting chart.
Yea SGG is a falling knife but ……… will watch. 🙂
Yes, I forgot to mention that I also had JO (Coffee) on that list. looked good until today. Coffee & Sugar together again : )
SZYM nice move today on pretty heavy volume. Went up down then up into close.
Yes, I like it here too, along with Cash, it is still and its my biggest holding at the moment. I’m not too heavy anything right now tho
Alex, if you can tomorrow, expectations for energy stocks going forward would be a great subject. Based on comments here, seems alot of us are stillmin that space, at least a little bit. I held on thinking we had more upside ahead, but should have taken profits last Thursday. So, if you have any potential targets that would help. Understand may not be easy though with oil a bit mixed.
Great rundown on gold. Still firmly believe this isnt ICL material. Will look to see any small pops that are likely to rolloved.
Hi Cason
I expect higher in oil/energy…I am writing the report now.