
Patiently Waiting
As mentioned in the past, there are times when the markets allow us to see clearly the direction they want to head in for a sustained period of time, and at other times it’s just not that clear. Often times when the various markets are changing direction, price gets a little choppy. Entering trades during that period can be frustrating too, since even good set ups may work for a day or two , only to fail the next. Unless you are a day trader , then that leads us to this conclusion for traders who want to buy & hold positions for a week or two – Sometimes it’s a good time to be trading and at other times it’s best to just try to be patient.
Futures are currently higher in the DJIA, SPX, and NASDAQ, is the pullback over?
Yesterday , I was looking for a deeper pullback
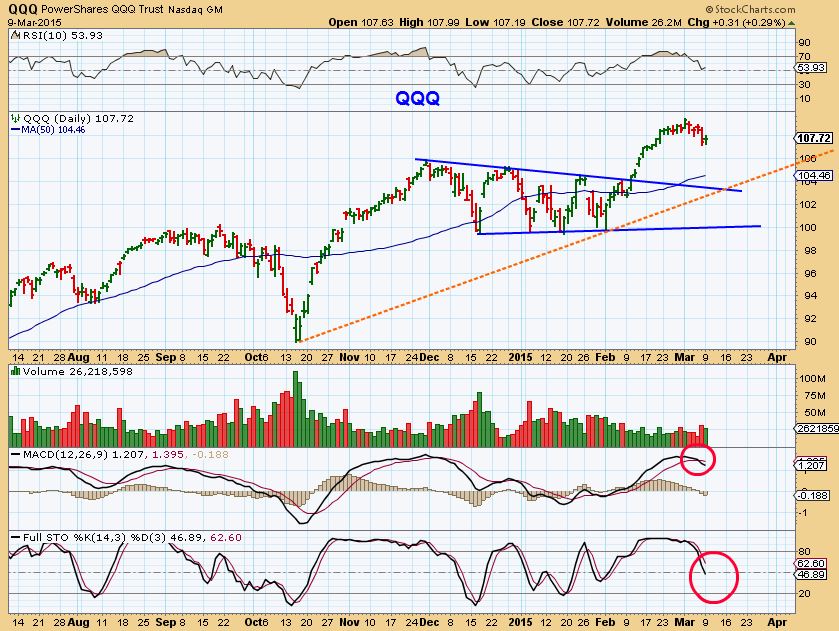
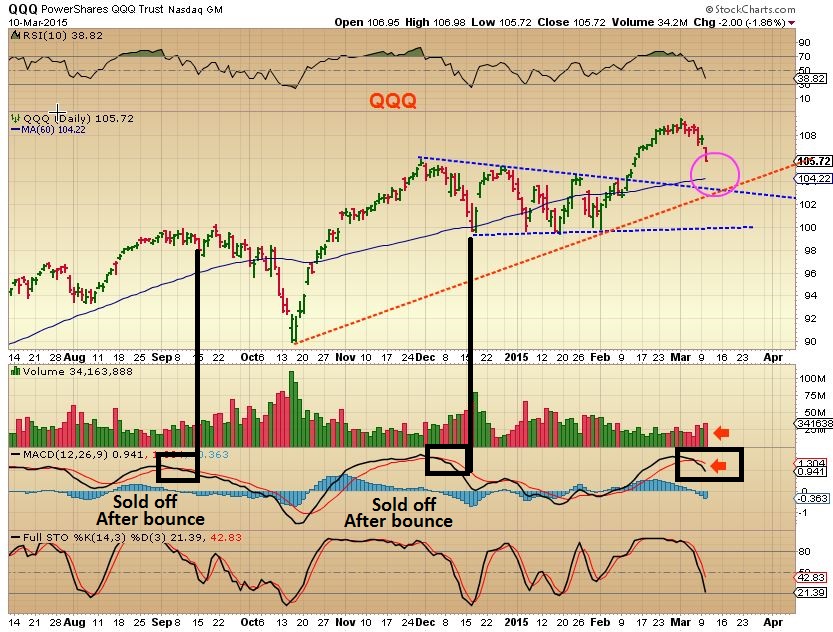
Yes, the futures are green, but is it just a bounce? Notice what I wrote on the following chart of the QQQ’s…
Todays Gap Open higher may lead to further selling later. I expected lower prices , since each MACD cross sold off again after a bounce ( Black line) and I had a target closer to 104. Almost oversold.
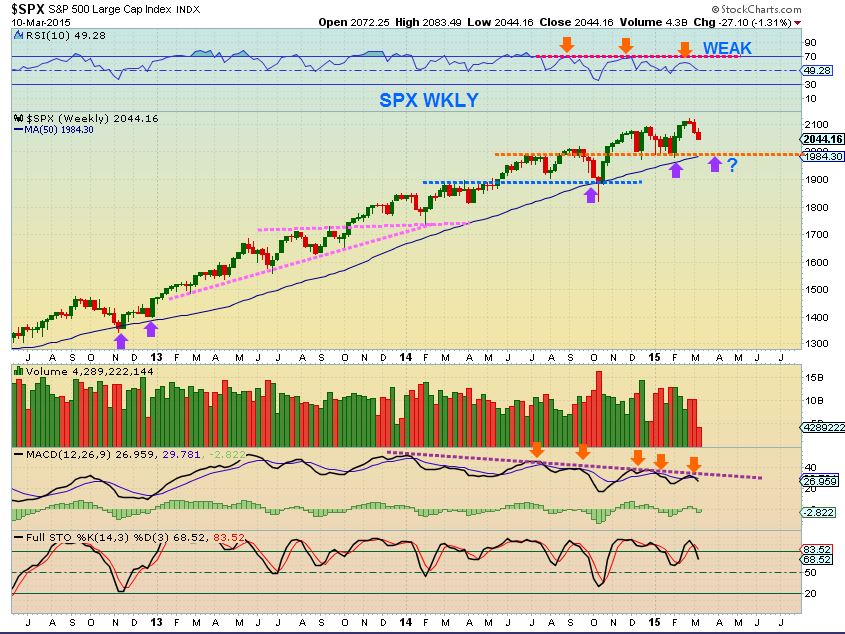
The SPX WKLY – looks like support is lower & the weekly RSI is weakening.
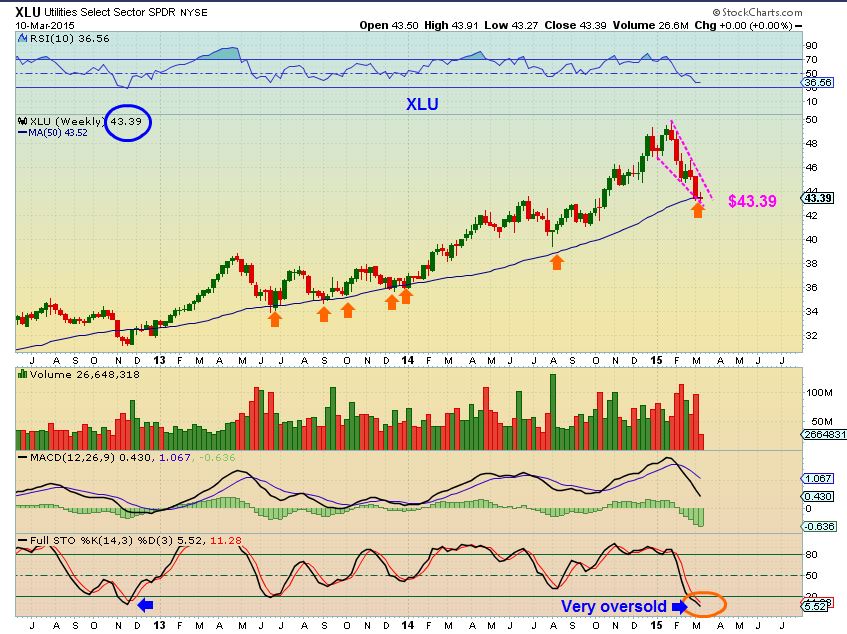
Feb 27 I pointed out that the XLU ( Utilities) Wkly chart looked to be setting up
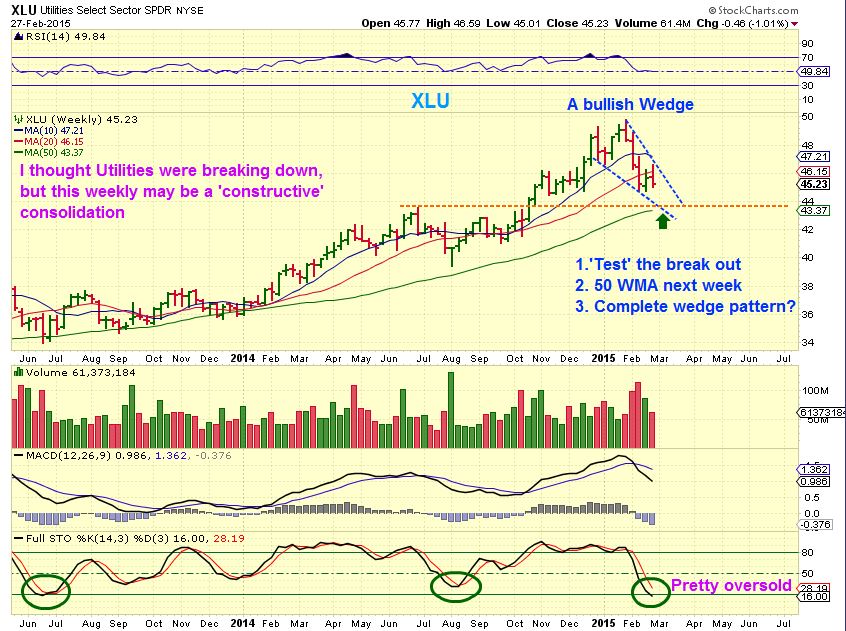
Notice the 50 WMA . As a weekly chart, you’d need to see a break out
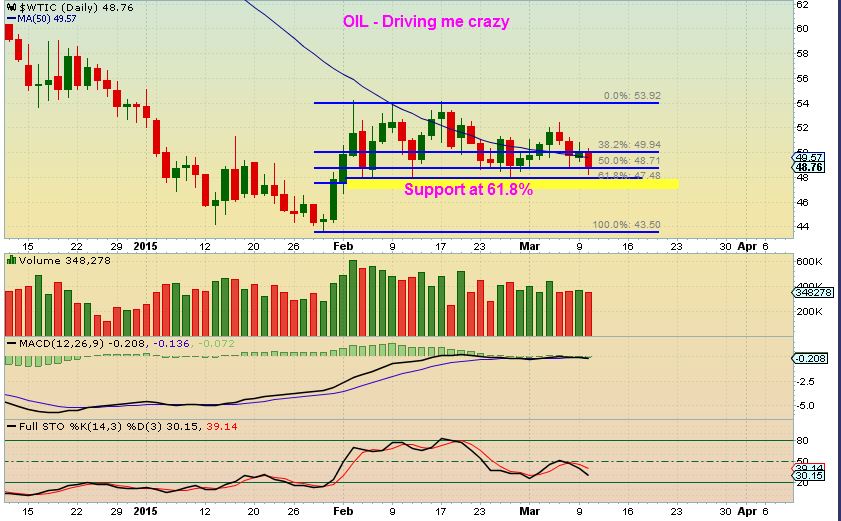
OIL– Nothing has changed from yesterdays report. IT is green and above the 50sma one day, then sells down below the next.
The Picture heading of the puppy with his leash is how I feel. We have been ready to go for another run in Energy / Oil , but the sideways move is just extending . Some energy stocks that acted well have now dropped below their 50sma. I mentioned that timing is getting late and it should seek out a low for a daily cycle low, the question is how deep will it be? It is frustrating and I am now unable to stay in my energy positions waiting for a break out higher. If it is going to happen, I can re-enter later, but for now it”s a matter of locking in profits or preserving funds .
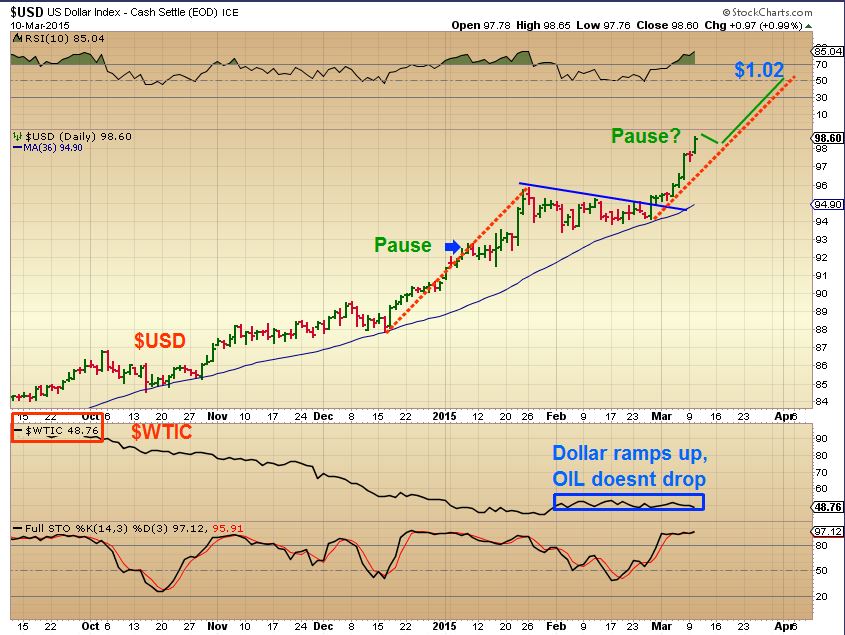
I still find it interesting that the $USD is surging and OIL is not crashing.
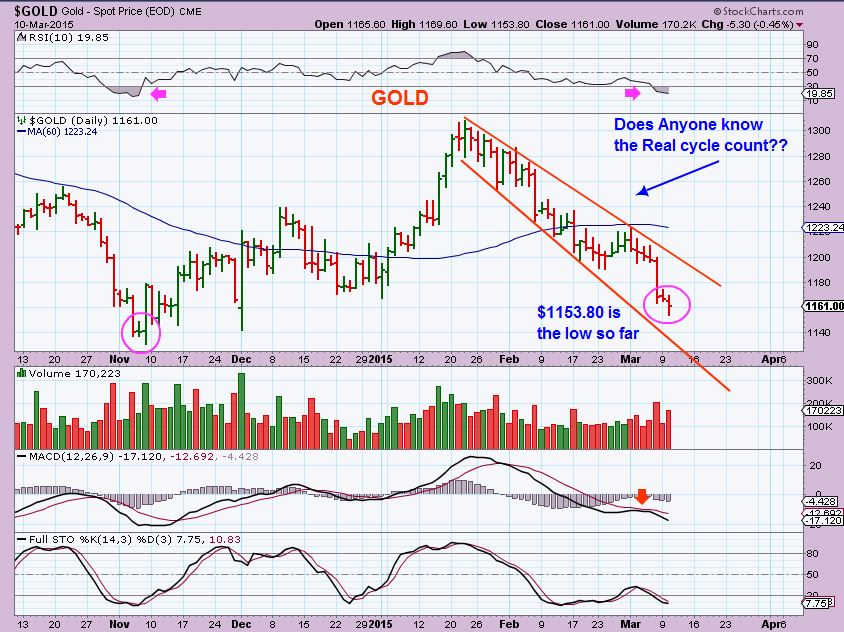
GOLD – The count seems unclear and I have seen in trading blogs many keep trying to go long with each intraday bounce. It has hurt their funds, but now I think we are very close to a temp bottom. ( Gold is RED pre-mkt as I write).
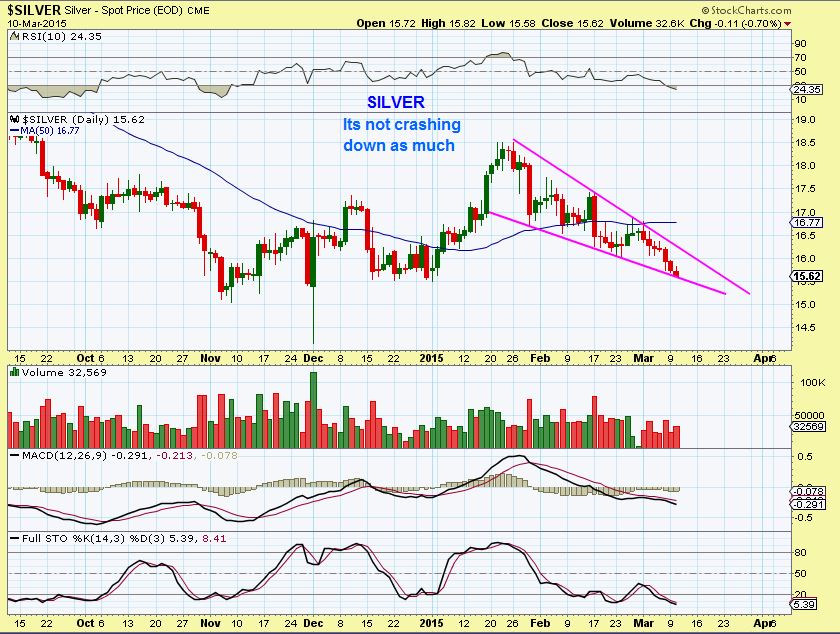
SILVER still looks like a bullish set up, the wedge may or may not be complete.
 ,
,
GDX often drops rapidly into a daily cycle low or ICL. See the left side of the chart for that fast drop, drop, drop.
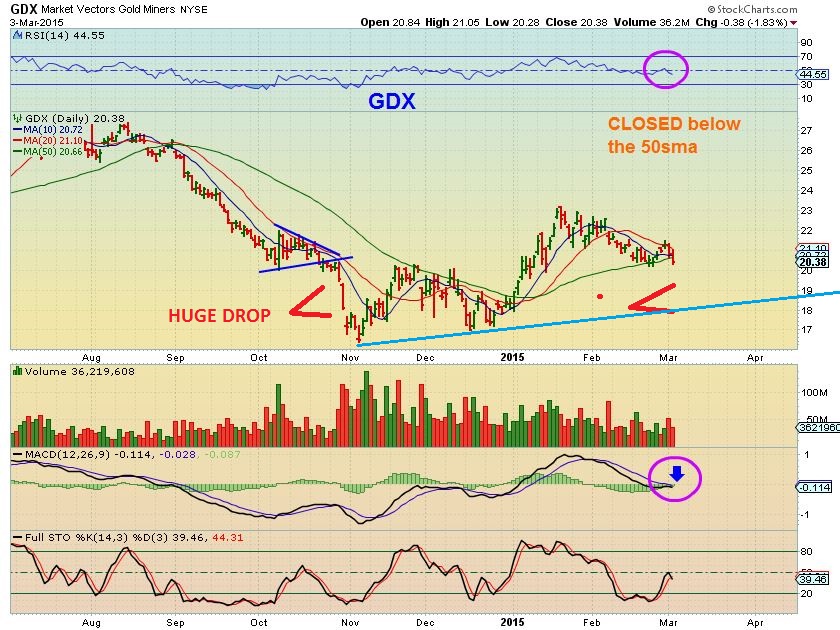
GDX NOW – we just got that type of drop.
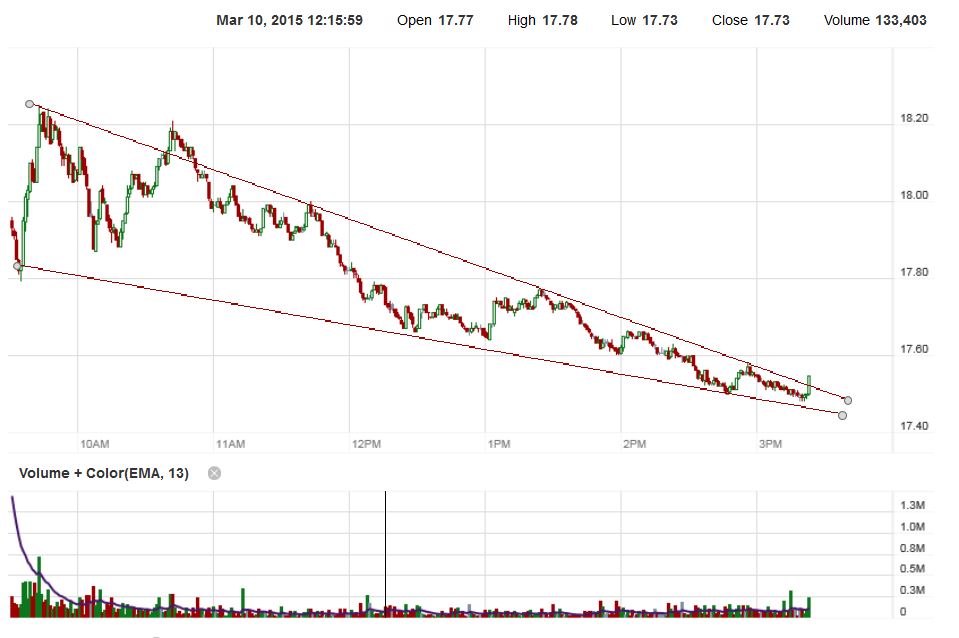
I also got a special “Technical Buy” in GDX yesterday and a wedge break out on an intraday chart. The Technical “Buy” works especially if we get a gap down today. It often catches the lows on The day of the lows or within a day. I AM NOT RECOMMENDING IT HERE. It can be temporary and is not low risk . Trading this area can be fast UP & DOWN and I wont have time to guide anyone on that type of trade. The real buy likely lies ahead in a month or two. The ICL.
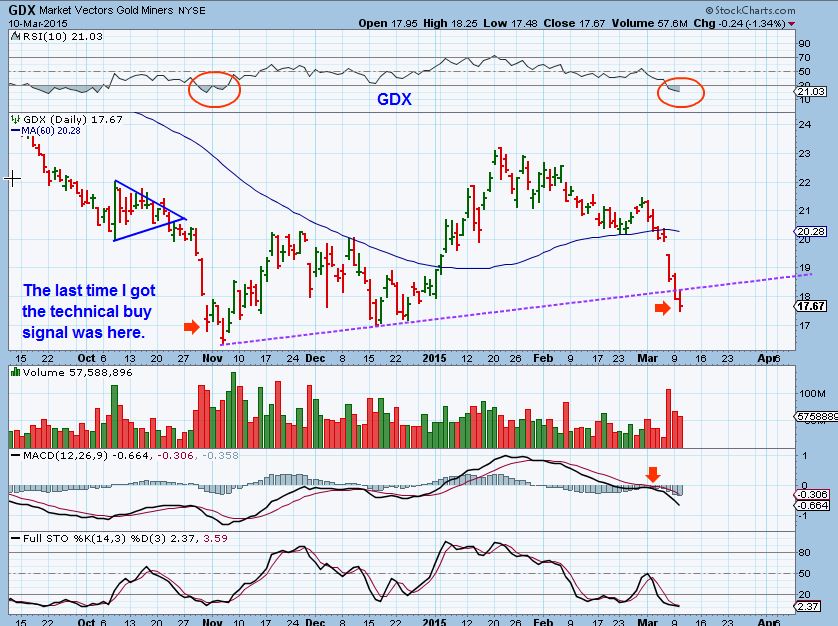
I may / may not not take the trade myself . In the past , it usually catches the lows. The LAST time I got the technical buy , it didnt catch it exactly. It bounced for 1 day and dropped 2 more , then the ICL was in as seen on the above chart.
I was going to buy a quick trade yesterday in NUGT when the buy signal hit near 3 p.m. and I captured this chart of GDX. This is only for active traders in front of the screen.
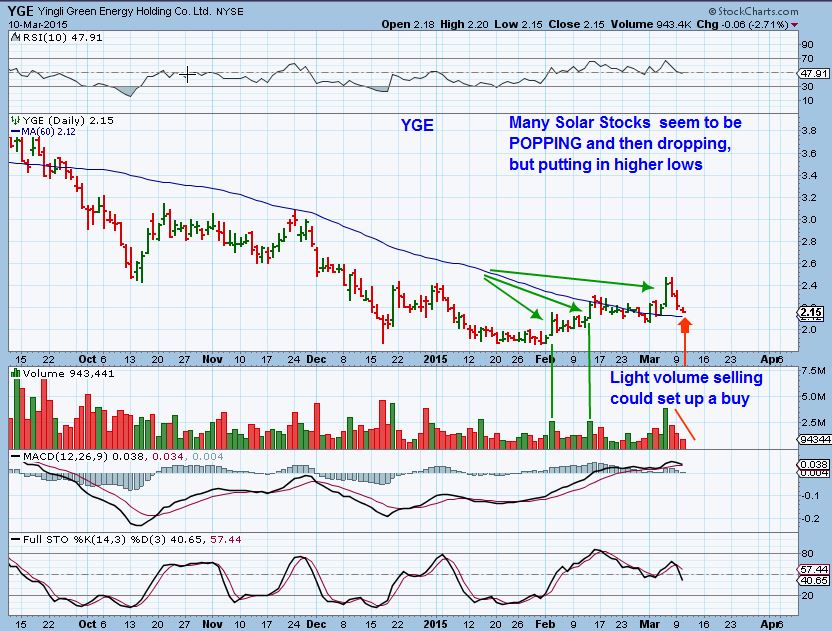
LIke that eager Puppy waiting to go for a walk, we are eagerly awaiting some good trades to take a walk with, but patience to allow things to settle down and set up correctly is often needed. I believe that there is still a little uncertainty in the markets and they are choppy. You enter a trade (Lets say we entered when the SOLARS popped), and then they pullback and it gets frustrating. However it is during pullbacks that you get some nice set ups to go long and I am currently looking for those now.
YGE & a few other Solars are getting close for example – Pops and pulls back repeatedly, but that can indicate accumulation in Solar Stocks. Rare Earth and Uranium stocks may be doing that too.
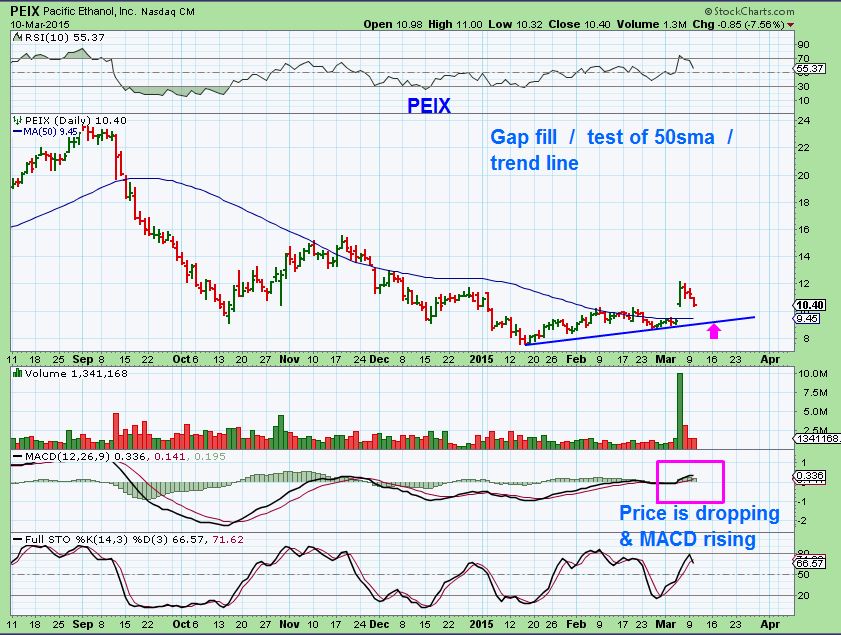
Remember PEIX had this base . I thought that it could pop.
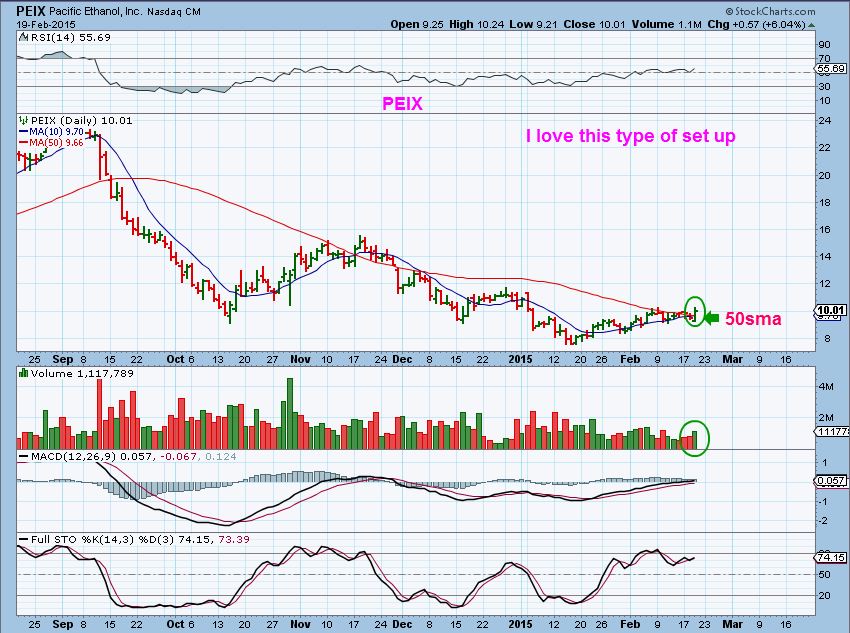
Popped, pulling back lightly- It may be a buy near the 50sma and trend line
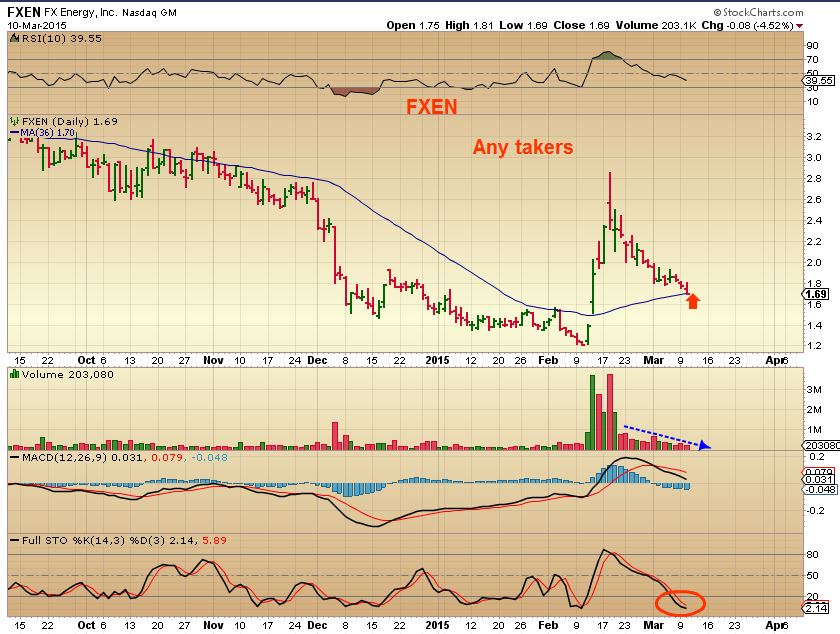
We have mentioned the strong run in FXEN. Yesterday it hit my target ( But I dont know if I should trust Energy enough right now with a New position, since I just closed a few as they fell under the 50sma) FXEN has a break away gap under the 50sma. It is worth watching as a future possibility.
2 Longer term trades that I said that I liked were Under Armor and VIMC if they continue to act correctly. They have now pulled back.
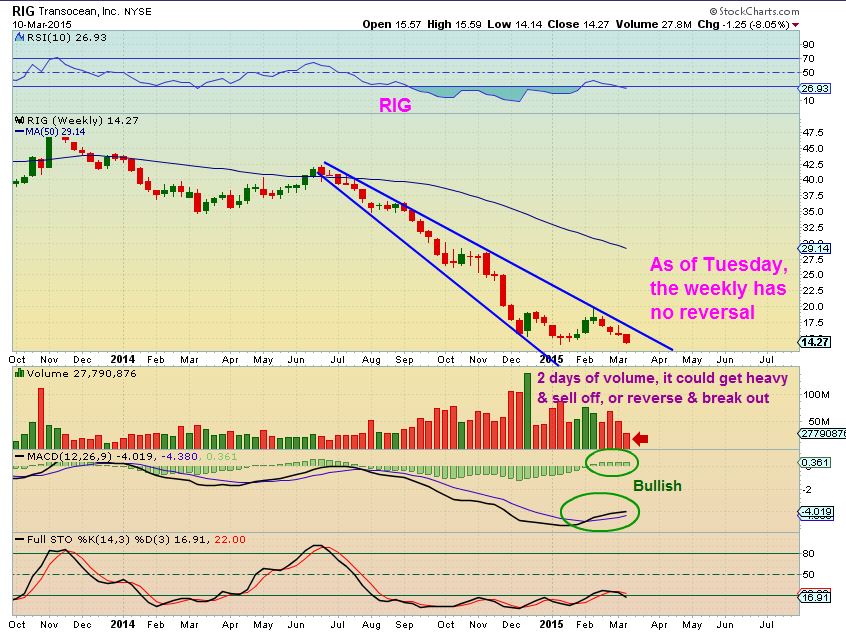
I was asked to look at RIG
Wow, Rig at $14. Who would have thought.
It could be at lows, but I dont see signs of a reversal on the weekly chart yet, it’s only Wednesday
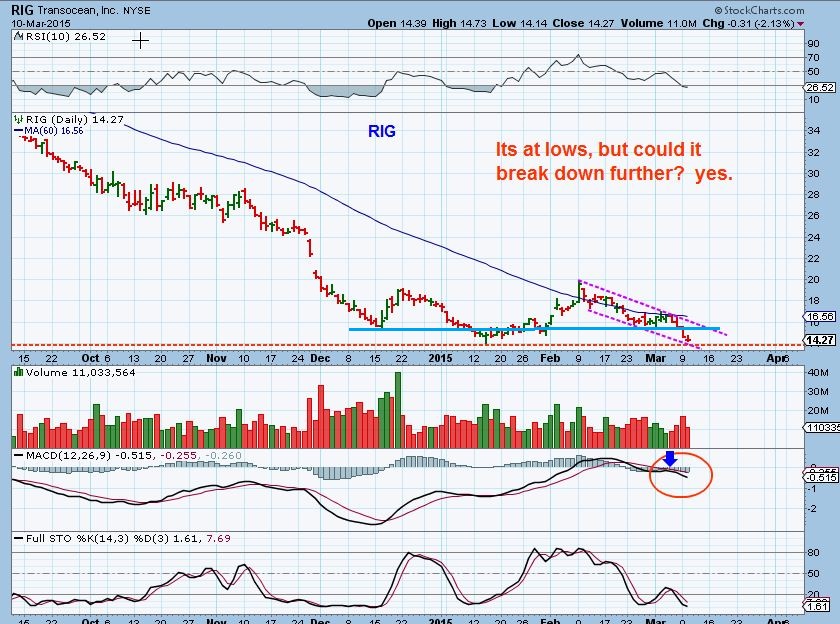
RIG DAILY – It may be at lows, but it also could break down further. A trader could take a chance with a close stop, since it is oversold a little , and at Jan lows. It may sell off further with that MACD cross down .


Alex, what stocks in Energy, Gold Miners, rare earth, were the first to start moving up last time? They might be good to watch as sector leaders. Kind of a tell!
After many double bottomed, most seemed to move up Feb 20ish – at rising at roughly the same time, but some definitely did better than others and some are still holding above the 50sma while others sold off more.
You’re correct though, its a good idea to look for past trength in case it is still there ( Like RIC with the Miners)
PEIX held up well thru all this.
And SZYM _ I still own that one
I sold SZYM when I exited the sector. I did see its up again today. Nice call. Waiting for the next entry,
SZYM is in a funny position. Its in the OIL & GAS sector, but its a clean fuel or alternative fuel producer and they also are used in cosmetics & food. I will copy/paste part of their “profile”
Solazyme s oils and biomaterials are used for bio-fuel production and
replacements for fossil petroleum and plant oils in a range of products
from clean fuels and chemicals to cosmetics and foods. The company’s
products are derived from three existing sources, including petroleum,
plant and animal fats.
Up 7% today, wishing I was still in! Good luck
I couldn’t find any news as to why the big pop in SZYM today. Does anyone know of any news item?
Gold Miners and Uranium are down, but some green Energy Stocks. GDX looks to be bottoming, but usually when it turns it goes up sharp. I’m not seeing it.
SFY and EXXI looking good here. The sector seems to be starting up! Solar moving. What do you think about a buy on those two????
I dont see what you are seeing with SFY & EXXI? I’ll keep looking
check out WRES though. I knew it was a lagger , but thats ridiculous : )
Now It could be a leader, it double bottomed first & took off upside
WRES? What is going on there? Could be the start off the bottom.
Earnings release and they did quite well.
FY14 Record Total Revenue of approximately $151 Million, a 17% increase
FY14 Record EBITDA of approximately $90 million, a 15% increase
FY14 Record Production of 22.8 Bcfe, a 77% increase
FY14 Lease Operating Expenses and Taxes per Mcfe Declines 26%
I sold WRES yesterday after they made new lows. lol
same here, wres break my heart
So did I jt. Too painful to hold on.
WRES and SZYM you killed it Today. 🙂
SFY and EXXI (see chart attached) look to be moving off the bottom. I’m using a 30 minute chart. MACD crossover and arrows moving up.
Thanks for saying charts attached, for some reason I see comments but no chart until I refresh. YGE moving too.
Any low risk setups yet?
Takes me a while to search , nothing stands out yet. BAS is set up correctly, but is it going to hold the 50sma if OIL drops? So it may not be low risk.
See how it landed on the 50sma and held. I buy with a stop right under, but I’m not taking the trade at this point.
Too random for me, right bowl. WRES let me and then has huge day today, BAS OK, REXX hot but had been clobbered recently, SFY taken to the woodshed. Seems to risky to just grab one and hold on right at this point.
SOL heading higher, trying to break the 10sma. 1 hour chart attached.
See CHART- there are other Energy stocks that are still acting correctly like BAS for example. REXX dipped too low for me to hold for now. .
What Im seeing it the Energy stocks that are close to a double bottom are getting bought up, while the others are going to have to go much lower to get close to a double bottom. Look at laggard NADL and KEG!
Funny thing, NADL ran up 100% from here in 1 month and we call it a laggard : )
What are we looking next with Crude Oil Alex – Thanks.
Nothing has changed. As mentioned in the report with that chart, it has been sideways. Will either break out higher , or drop to possible double bottom . Due for a daily cycle low soon, so could be a quick dip & then run higher to put in a dcl, or could drop and test lows.
Is Double bottom at 45$ ?
It is $44 something, but they can overshoot. Sometimes they Undercut to run the shorts & reversal takes place.
NG working out perfectly today – heading to 50 sma?
I bought NUGT this a.m. on a very low risk, extremely high risk trade lol
🙂
Me too! GL 🙂
You guys are trading maniacs : )
Yup, Agreed!! We’re in the green. Gotta keep watching charts! Shorts covering, but anything can happen. 🙂
We dont have a “LIKE” button . (insert one here)
I bought some this morning. Miners looking good now. fingers crossed.
Alex, thanks for the update. Yes, they were very oversold and your analysis was solid. I didn’t get to review the updates until midday, but it helped me get off my shorts quickly. Went long (very small posn.) actually DUST puts, idea being that if it consolidates some next week more likely for (higher priced) equity to lose more than NUGT would gain. We’ll see. Well defined maximum risk.
RES, anyone know anything about this company? Double bottom……..
Natural Gas 3x ETF anyone?
Looks ready to break out ( again) . The sideways move is a killer, but it does look to be setting up again.
Tomorrow morning the inventories @ 10.00 am.
I’m waiting and see what’s doing tomorrow morning, I just sold it this morning.
It was a great trade from Monday lows..sold now.Ugaz .GL if you are in.
KEN – ARE YOU READING HERE TODAY?
That was a nice reversal at the double bottom lows on RIG today. That makes it a lower risk entry , if you see it turn upward at support, your stop is below the lows
Alex,
a question on pm’s: I counted the cycles on GDX from November to now and I found the first cycle 28 days, bottomed on dec 15. The second cycle 29 days RT, bottomed on jan 29th, then I have a 3rd cycle which could be 28 days bottomed yesterday or we could break it in to 2 cycles one 17 days and now at 11 days long. I like better the 3rd cycle bottoming yesterday, same length as the prior 2 and now one more shorter cycle to go before the ICL, what do you think?
I have had the same count (And an alternative count with the same )
Alex, I hope that you took profits on your SFY. I did yesterday and I’m very glad that I did. Now just a little wait until it’s time to re-enter after the selling pressure is exhausted. Thanks for the recommendation, that worked very nicely!
Yes, I was only holding REXX and SZYM as this week began in Energy
Alex, probably not your thing but MELA…
Hi Jonathan- I couldnt touch this unless it pulled back. They often do after a strong surge ( but they dont have to ).
See REE, FXEN, etc
Of course. But just in case you a) hadn’t been aware of it and b) you would want to be. Can see 18 if it continues to rally.