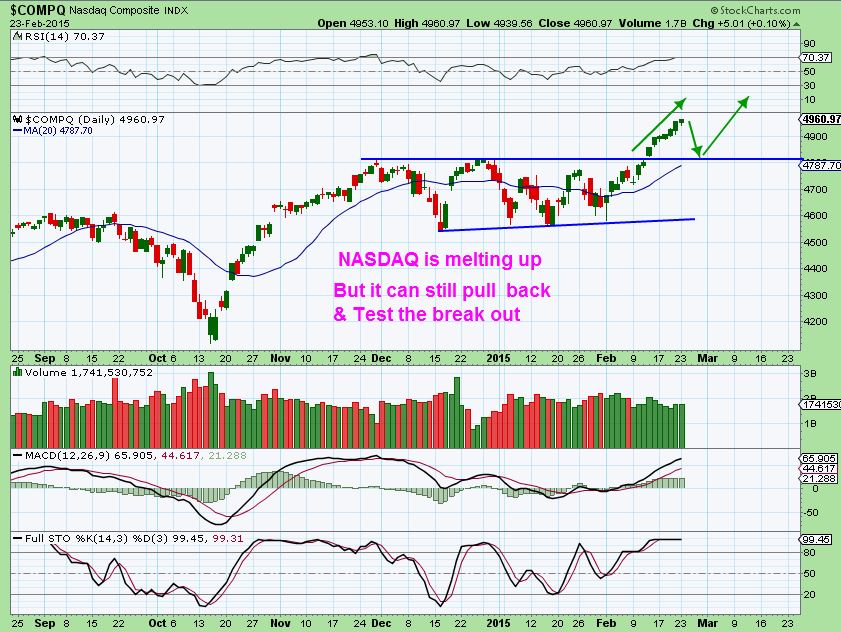
Whats in a number? I dont know, but I had mentioned back in mid Feb that the NASDAQ may pullback and could even test that break out , but probably not until it tags the big round number 5000. Why? Apparently, It’s just part of the game 
NADAQ MARCH 3
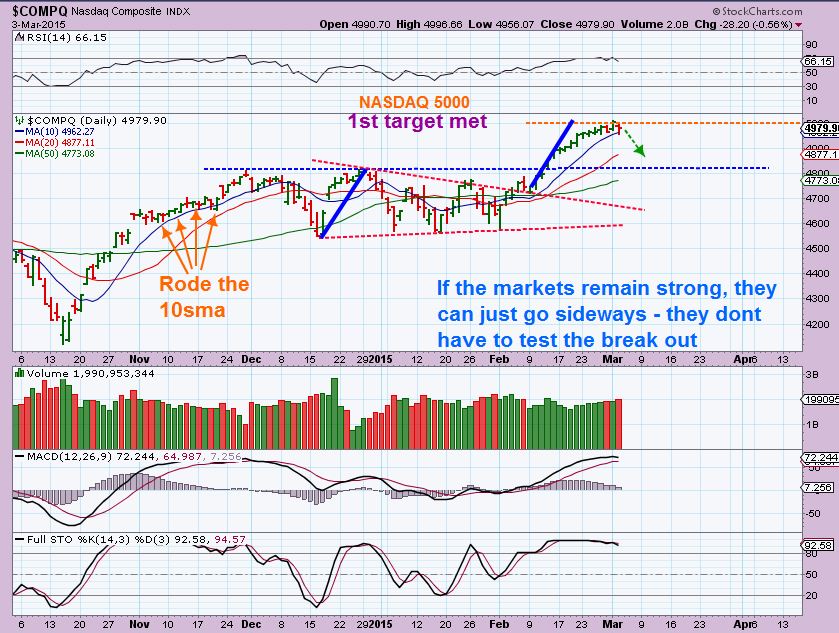
SO are we about to pullback 200 points to test the break out, or ride the 10sma again?…
At this point, the markets have proven to be strong, going almost straight up after that long consolidation. With that in mind I wouldnt bet too much against it. It can go sideways along the 10sma as shown above, it can drop and test the break out too. It is very over bought. During market corrections or pullbacks, often there are many nice set ups forming in stocks , so we can watch for those. Even though I expect a rest at that big round number 5000, I wouldnt short this bull.
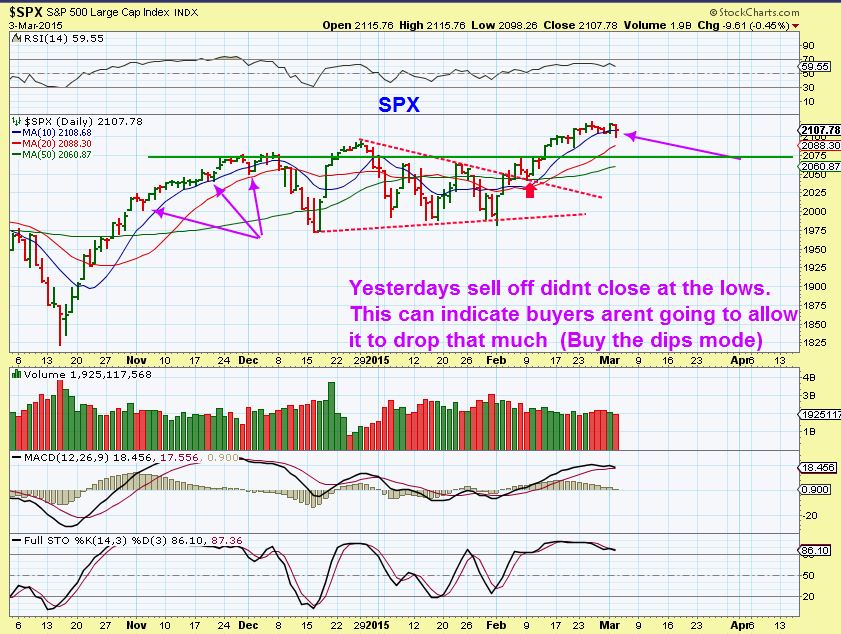
SPX For the SPX, a pullback to test the break is a small pullback to the 50sma, but after those reversals in the past price just went higher.
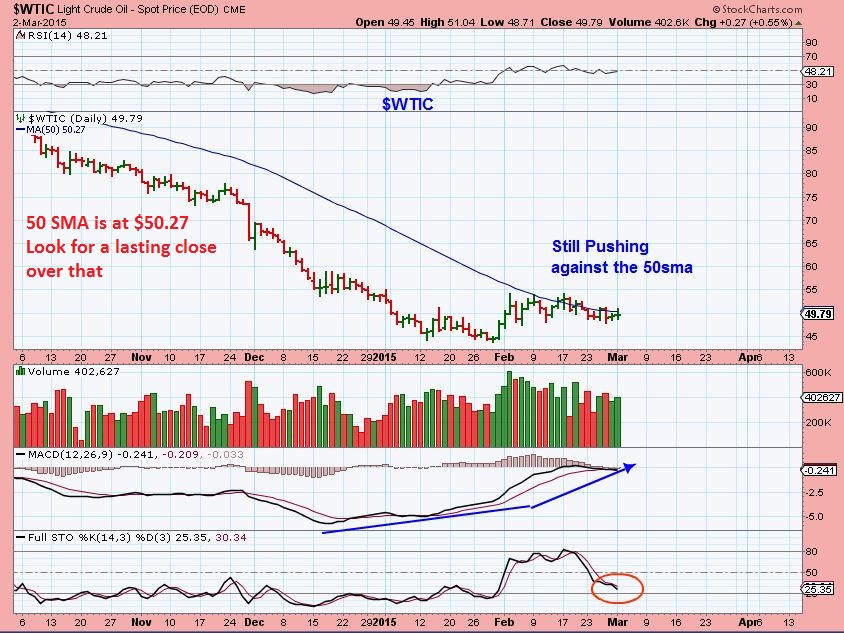
NOTHING changed in OIL –
It is still pushing on the 50sma, and I said I belive OIL is pushing to go higher. Mondays chart looks the same as Tuesday ( Mondays OIL below.) Pre-MKT OIL is at $50.92
I said that I liked the energy stocks and I captured these stocks charts yesterday mid day just to show the “PATTERN” That gives you a low risk entry.
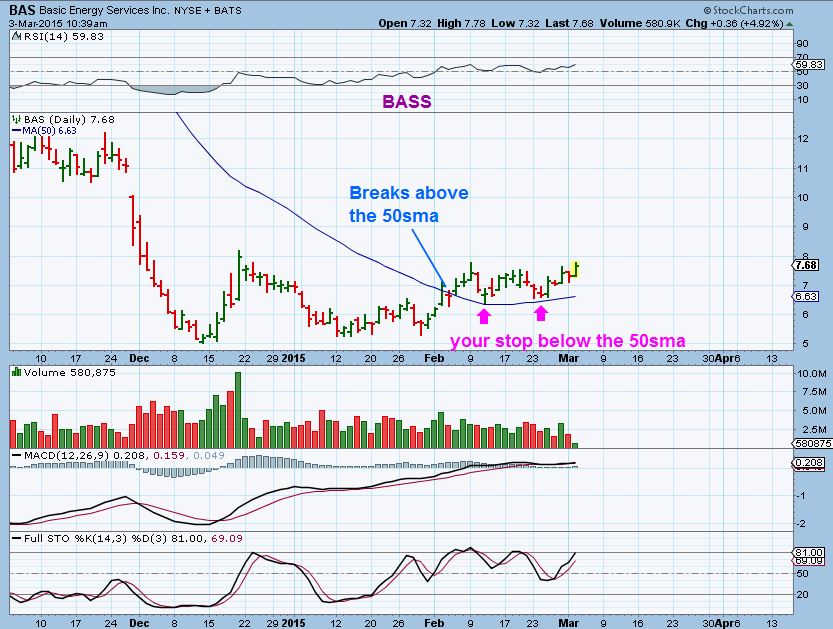
That PATTERN : They break above the 50sma, and then they almost all eventually drop back down to “TEST” the 50sma. THAT is a low risk buy, once the test successfully completes. You buy it and put your stop below it. A healthier stock may test it again, and can even break it again, but shouldnt close below the 50sma. Sell at a minor loss if they do.
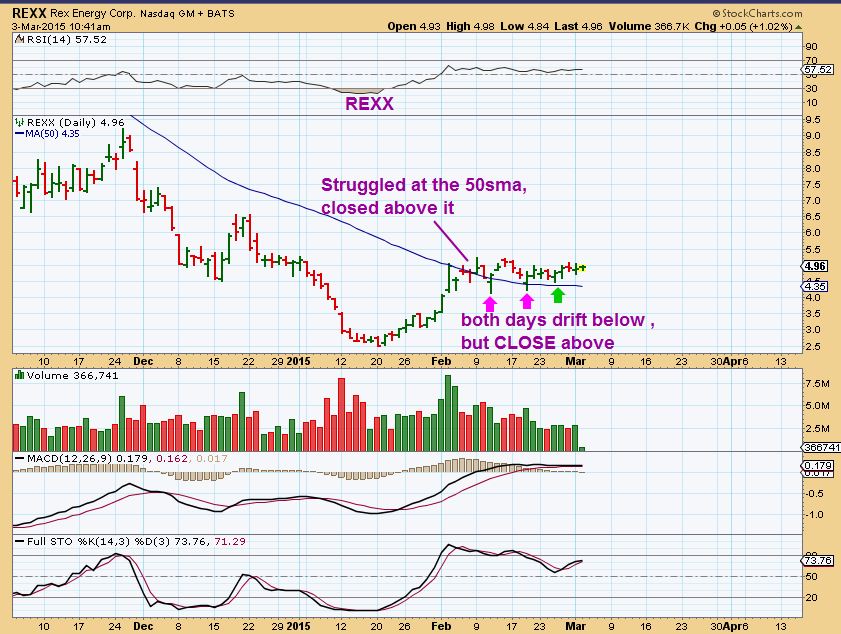
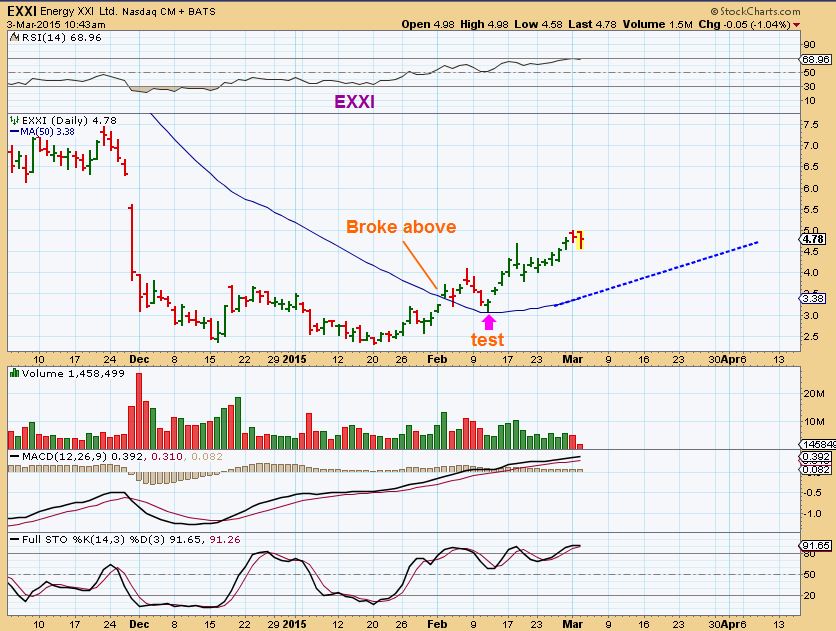
The above are stocks that I bought at the lows, and have added at the “Test”. I have mentioned this here before, but this review is because some may have missed this. I am still getting questions asking, “Is XXXX stock still OK, I own it but its not doing anything?” Answer: It is consolidating if it looks like the above charts. Some ran up 50% 80% , etc. I am expecting a second leg higher, and EXXI is an example of that.
Even the XLE is acting correctly, and just held the “Test” of the 50sma.
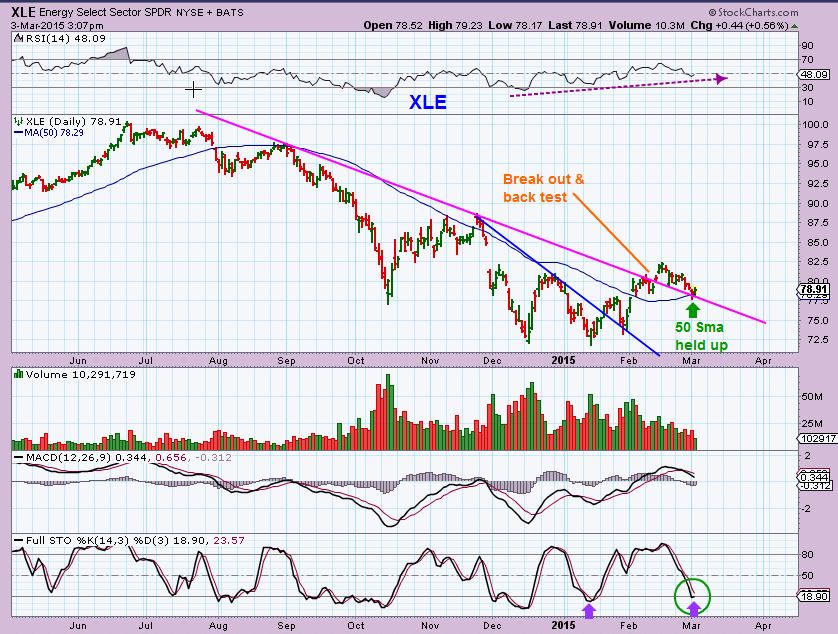
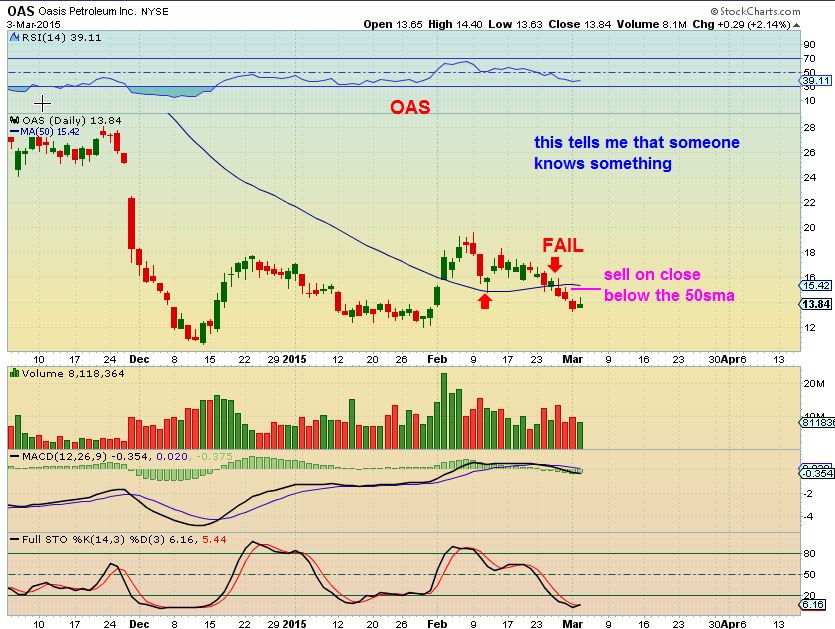
Like anything else, They CAN FAIL. Thats why I sell at ta close below the 50sma . It’s like someone knows something bad is coming here, and it may double bottom.
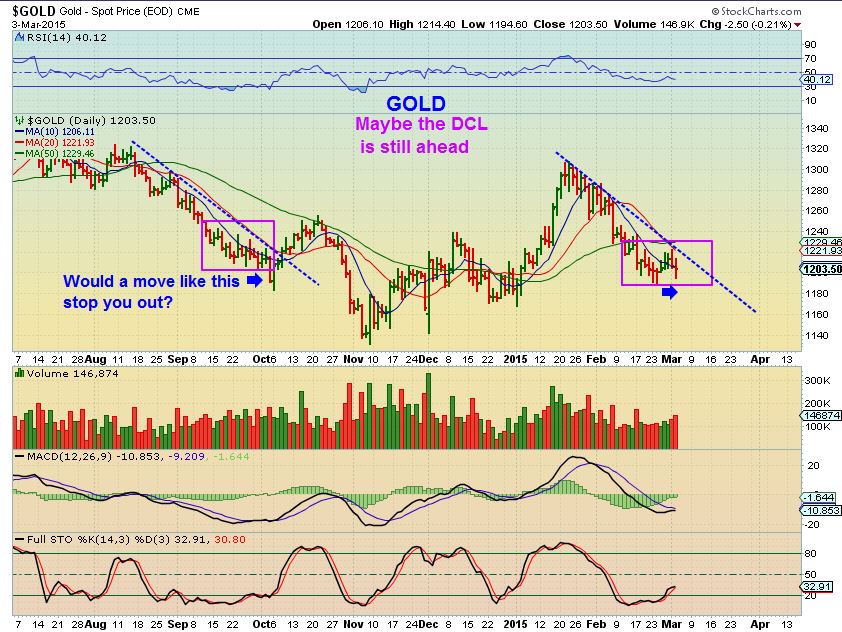
What can I say about GOLD/MINERS that you dont already know? Its in a 3rd or 4th daily cycle so it is acting weak so far.
1. Can it break higher ? Yes.
2. Does it have to? No, it could go sideways.
3. Did I recommend a trade here? No.
4. Is is a good place to put your money? Yes, if you want a quick gain or a quick loss.
NOTE: It is a FED Wednesday. Gold is unclear right now, and It is at an indecisive point , not low risk really. It can break higher, it can drop lower. I said in a prior report after mentioning that 3rd & 4th daily cycles can be weak & unpredictable , “If you are an experienced trader and want to try to trade this area, honor your stops, but I think the real buy is coming later this spring.” So let me add to that, if you take a trade here, know where you want to sell if it goes higher and if it goes lower.
Let me show you something with GOLD
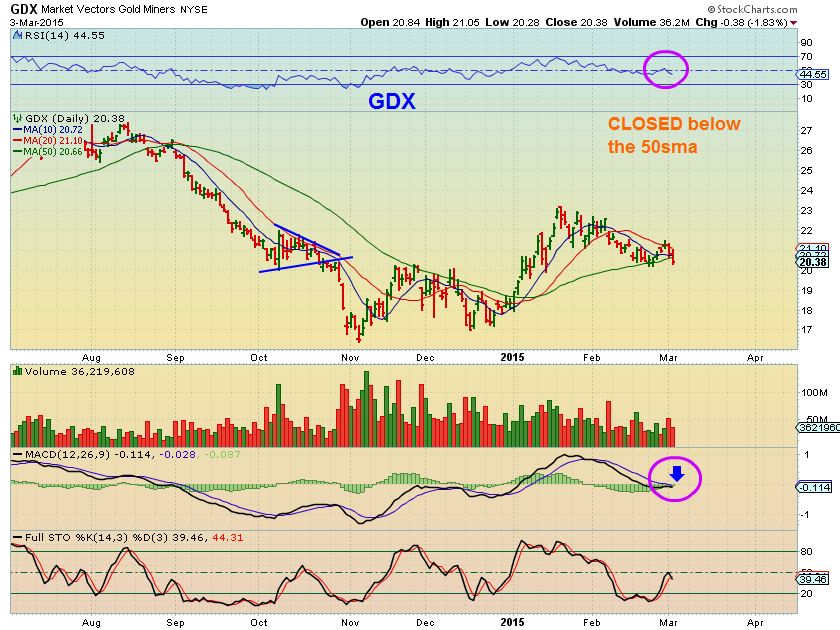
With MINERS , we could be on day 6, and it closed below the 50sma by roughly 30 cents.
1. Cycles arent that clear
2.This chart isnt healthy from a T/A standpoint
3. This needs to recover the 50sma quickly , or it is not a good set up.
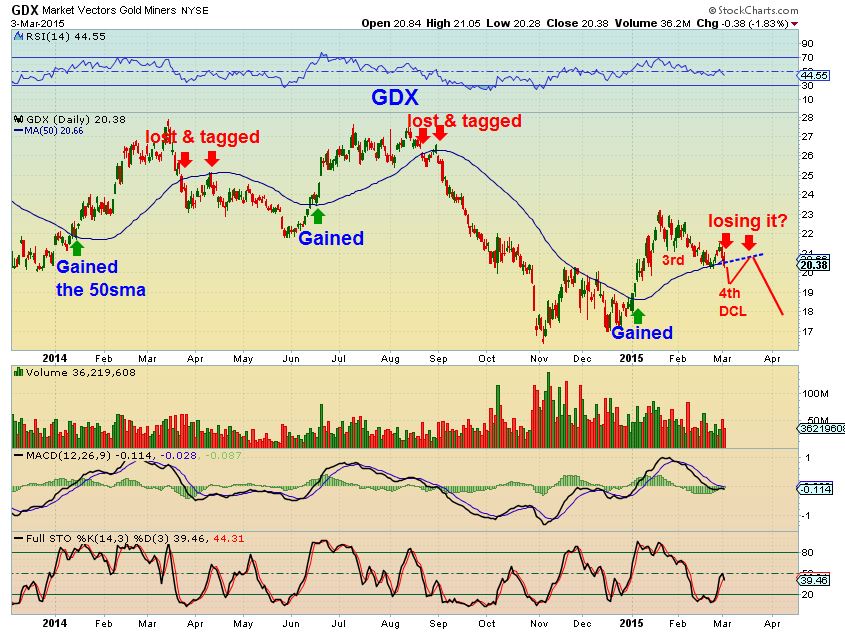
Let me throw an idea out there using technical analysis. In the past, when the 50sma is lost for a bit, it gets tested and drops. IF GDX doesnt regain the 50sma immediately, we may put in the real ( now 4th) dcl and drop to a double bottom low.
I did have some requests for good longer term buy & hold if possible. I am looking into that, but with the recent market run up out of that consolidation, the time to buy at a lower risk entry has passed on many. We may need a pullback in some .
For example, a company that has been doing very well the past few yrs and looks to be just braking out again is…
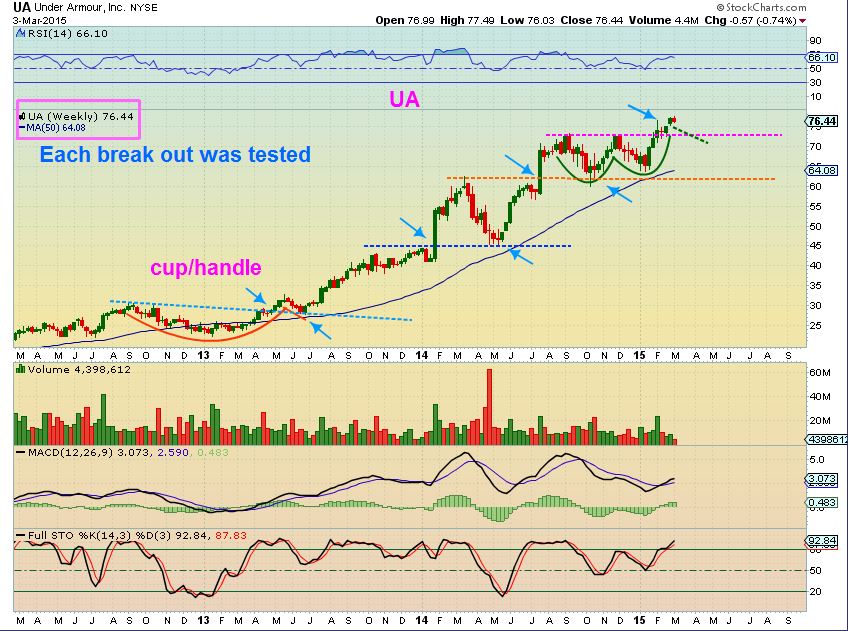
Under Armour – It has steadily moved higher , the product is well received. It is breaking out again, but may test that break near $74. Not a big deal since its at $76 now. (Last spring it dropped quite a bit and looked shaky , but recovered strongly and almost doubled, then formed that ‘W’ pattern base). If I had money in a retirement account and wanted to buy & Hold for a while, I think UA could continue to do well, IF RETAIL remains strong.
“IF RETAIL remains strong.” That is the problem, we are well along in this bull market, and they dont last forever.
I will look for other stocks too, but remember that there is risk in all sectors going forward. Since Bull markets don’t last forever, We could experience a serious correction . This bull market has been running strong since 2009. I will discuss this in the future, since I need to get this released. Thanks for being here. At this point I am still in energy, watching for some possible set ups in TECH if we get a pullback. GOLD / MINERS may be an awesome buy in the spring ( April?) . Sometimes patience pays off big time, since you dont lose capitol that can be used for the big %-Gainers.
~ALEX
Putting It Together 
 Look – A Pile Of Dots!
Scroll to top

Hello alex ,whats youre thoughts on solar stocks? JKS? Tnx for the repley
In my report where I mentioned that the energy stocks were breaking above the50sma and then often drop to test it, that happens in many stocks. JKS may do that soon, but the chart ( of JKS & many solar stocks ) look pretty good at this point.
Actually, look at TSL…that broke out & is still running higher. JKS could perform similarly
Thanks Alex, good writeup and very informative. Liked your comments on testing the 50 day after a break above it. I was thinking along similar lines yesterday and I got some GDP and SZYM, both looked interesting after the successful retest.
Thanks. I own both too.
Thanks for the update. When you do see that low risk set up again on NAZ (if it back tests) let us know, I’ll be there with both hands. Good warnings on gold, you made it pretty clear now at this point. I got stopped GDX and had to move on. Actually then took a quick short which I closed some of yesterday. Continuing to follow guidance on energy, expecting some good results. 🙂
Yeah, sometimes people have a tendency to want to find and enter a new trade everyday ( I fought that urge myself), but when a real nice set up presents itself after a sell off or long sideways move , that is usually an entry that you can hold for while.
I’m one of those people, don’t want to ‘miss’ anything. But this year being more patient and just letting set ups come to me, really trying to improve while following your reports.
You see that pop in TAN this morning? May make sense to trim some here on solar? Daily went well above upper BB, RSI well above 70. Could stay high, but could come in a bit, too!
I didnt see that, but yes,
If I owned TAN itself, I would sell for the reasons you pointed out & its a pretty clear 1-2-3-4-5 pattern to. I’d expect an A-B-C type drop
Thanks, Alex, booked a 10% profit, not bad for unleveraged ETF, I’ll take it and look for next set up.
Alex, or anyone else. I don’t see the strength in WTI! What am I missing? The MACD looks to be crossing over and heading lower, we are not at an oversold point yet in the STOCH. The volume looks good, but we are still below the 50SMA. Help me out with a why?
Hi Bill ( Refresh to see my charts)
We are not still below the 50sma, It has been above the 50sma for 2 days now. I wrote the number on the chart so all could see it. I actually dont remember saying “I see strength” in oil , what I said that it is coiling under the 50sma and indications are that it is pushing (not backing down, they cant sell it off ) to push above the 50sma. It has now done that.
When you say that we are not at an oversold point in the stochastic yet, what do you think it would take to get there? A steep drop? Well look what it took to get from over bought to almost oversold. It was just sideways movement.
To show you what I am seeing : Look at CDE, GDX, NG , etc last NOV-DEC. They were coiling under the 50sma too..its pushing under the 50sma & bears cant sell it off,. It may look like weakness to many, but often will just break out higher.
.
Just trying to understand what you see when making trades. I said, ” I don’t see strength in oil”, I wasn’t quoting you.
Yep,
No worries….just trying to help everyone to see what I’m looking at . When you said, “I don’t see the strength in WTI! What am I missing?” and attached that question to my chart, I thought either you were misunderstanding what I was pointing out with that chart , or it may confuse others into believing that I said I see strength in oil in that chart, so I just wanted to clarify for everyone.
Not strength, but consolidation / coiling under the 50sma. No problem.
I don’t see any real strength in the WTI chart that would say BUY to me. We are all in Energy stocks here. The price of these stocks are tied to oil prices are they not? I have noticed Brent will go up and WTI down on any given day. I expect WTI is the bigger effect on the energy stocks?
With NG,GDX, CDE they all had a rising RSI and a bullish crossover on the MACD before they broke above the 50sma.
Do you see it now? : )
Not a good day to be in the miners. I hope everyone got out! Unbelievable.
Not been a good 2 years to be in miners
May sound funny, but I see about 10 green miners so far.
Hard to believe any of them are green!
Personally looking for a HUI move to the underside of the 50 DMA After these three down days.
I’m always trying to find a good BUY point with the miners. At some point their value has to go up. Could we be completing an AB=CD pattern? A giant bull flag? I could see us going to $12.54 to the bottom trend line on NUGT then a big move higher. Could this be the next Cycle low? Could this be the big move point in the spring that Alex talks about?
I was shocked this morning when the 61.8% retrace didn’t hold, because it was also the completion of an AB=CD pattern.
Just my 2 cents!
Yeah, Monday just blew me away, was sure we had it and it just flat failed. I won’t be taking a long until we see the next ICL. I’d short any good pops from here.
Another private note offering – EXXI this time. Down about 6%.
Really, that sucks! What are these companies doing!
Raising money to pay off debt, the miners do it all the time once they get overbought.
OAS too
I really would like to hold on to SZYM and wondering what price we need to see at close for it to still look healthy. Thoughts anyone?
Hi Alan
I own it and it isnt doing what I expected. Its not ugly bad, but it has broken below the 50 sma.
I wanted it to hold above the 50sma on a closing basis , because if it closes below (it’s there now) , it can just continue the base consolidation action shown on a 4 month chart. I will attach it . They released earnings a few days ago & no bad reaction, so I thought it might be ready to break out.
So if you look at this base…it can drop to the lows in the $2.00 area and still just be basing out.
.
Thanks Alex. I should have waited for the 50 sma test before entering the position. I bought it a $2.74 and so of course I’m sweating it now. Will sell if it breaks low of the day.
It’s all in the learning. The 50sma looks close, but then if you buy and it goes there, it feels wrong. What I have done in the past is a partial position in case it takes off, but add the other part if it keeps dropping to the 50sma.
Hopefully this is going to hold and break from this base. I still own it too.
SZYM back to even 10 minutes before the close. I think we’re OK Alan : )
I actually bought a little more of this today as it looked like there wasn’t much selling pressure a little below the 50 DMA. Also some more GDP. Did you see that PEIX posted strong earnings after hours up over 1$ now.
yes :o) woohoo… cheers!
yes, it was a good tight set up, and often runs nicely
OIL Exploded $49.60 to $51.80 – Now on a daily chart its above the 50sma and a MACD cross.
I knew I liked that set up
.
Refresh for chart
Yes my uwti is doing great so far:) UGAZ back to 2.77 ..(NG) I mean , a close above 2.76 might be good for UGAZ for another DT on or before reports I guess. Anyway stops are in place for both position.
“stops in place” is a good idea ; )
hi A.
would you recommend a buy of USO (or some other?) right now.. or wait till it falls back to test the 50sma?
Its been up for 4 consecutive days now.
I’m liking that it has just penetrated a thick band of moving averages.
USO at 8.45pm GMT/3.45pm EST
Hi S.O.G.
I do like UWTI, USO , & UCO for my personal trading, and any traders here who feel that OIL is acting correctly ( or can wath their positions closely) can take those trades. I hesitate to mention them here at times, because some dont see what I see in OIL. If OIL drops a little these 2x & 3xetf’s can drop 10+ % and I get emails that I dont always have time to address in a quick manner.
I liked what I saw today, as a quick trade, one could buy the break above & plan to sell it in a day or two, in case the 50sma gets re-tested. .
And this is AFTER the report that we ADDED 10 million barrels to inventory. Most of our energy plays (except for BAS!) lagged a little bit today, but are in good shape with WTI move!
HI Alex,
I got stopped out of EXXI today, then one of the Najarian’s on CNBC mentioned unusual call buying activity in EXXI. I don’t recall the details, but he bought in and it was his pick of the day. I bought back in too.
Hi Morgan,
Yeah, its still a nice chart and it pulled a nice recovery / reversal. It dipped almost to the 20sma and was bought right back up. I’d say you made a good decision. I cant find a solid straight bottom trend line, but a channel seems to be forming anyways. It ‘could’ still dip again and get bought up in kind of a sideways move, but for now it looks like it didnt want to go down : ) ( refresh for the chart)
.
Hi Alex,
My weakness in trading is knowing when to exit with profits. I have no trouble pulling the trigger on entries or honoring the stops. Since I/We have a basket of energy stocks currently do you look at TA in that sector (XLE) or each individual stock to exit (50 DMA). Or do you normaly raise your stops a certain % and let the Market take you out ?
I am certainly Not looking to exit at this time but I value your expertise and want to learn. 🙂
Thanks Alex
Hi Ken,
It varies, but I definitely look at each stock individually when I am watching a stocks.
If I like the sector as a whole, and feel that OIL/Energy are going up ( or say also for Miners, If I feel GOLD/SILVER still have more upside) I just make sure my stocks are performing well waiting for that move to complete.
So for example: With GOLD lows in Nov- I knew I wanted to hold my basket of miners for at least a couple of months. If Some were stronger ( like CDE was in an uptrend ) and I was holding a weaker one, I might trade into CDE when it pulls back to the 10sma (But thats me as a trader too).
So with ENERGY, I expected OIL to bottom and maybe base out or v-bottom higher. Many energy stocks bottomed first and built bases , then broke upward. I see many energy stocks that ran up are now going sideways at the 50sma…its a good looking set up for them.
When or “IF” OIL breaks higher , I would expect them to make another leg up ( possibly equal to the first leg up) like A-B-C-D.
Maybe I should explain that more in a future report? Thx for the input.
Gotcha ……. Thanks !
A future report on the subject would be great.
Thanks again Alex.
Ken, you are in good company. Same issue here. Sometimes I get it right, others you give it back or end up frustrated that you left potential gains on the table. If you are up good you can always trim and trail. Increases your commission payment but can be effective.
Hi Cason,
Trim and Trail meaning taking some % of profit and then use a trailing stop on the remainder?
Yes, exactly. You could take off half and move up to hard stop or use trailing stop. Or even most of the position and leave a ‘runner’ in case price keeps moving in your favor. Lots of variables how Alex describes below. Depends on your targets, how large your position was, etc.
I understand. Thanks Cason.