Since I have 32 charts in this wkend report, lets just get right to the weekend wrap up and discuss future possibilities, shall we?
Feb 25 – I felt that the NASDAQ is close to a ‘rest’ here or near 5000, and then pull back.
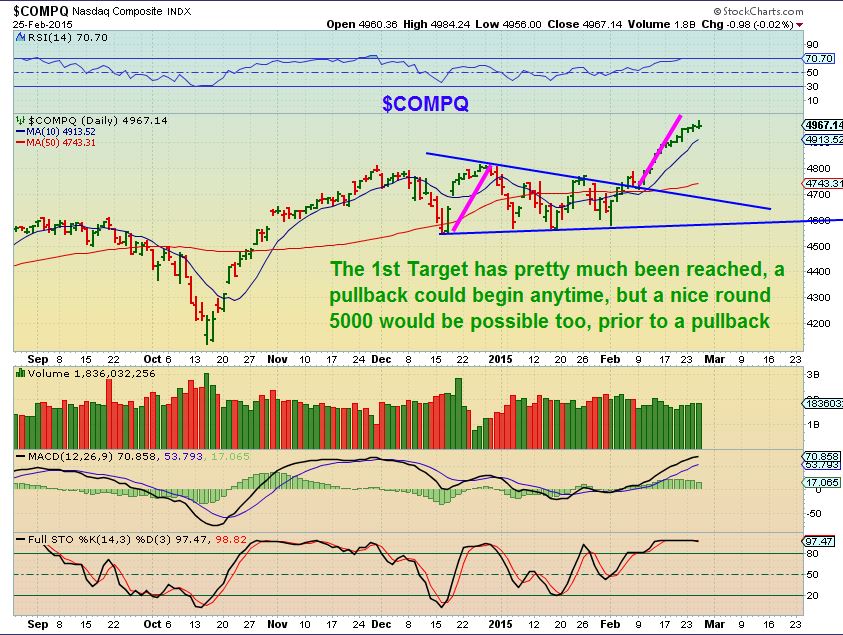
Does that mean it’s done and going to fall apart, or just a small pullback, maybe even sideways move ?…
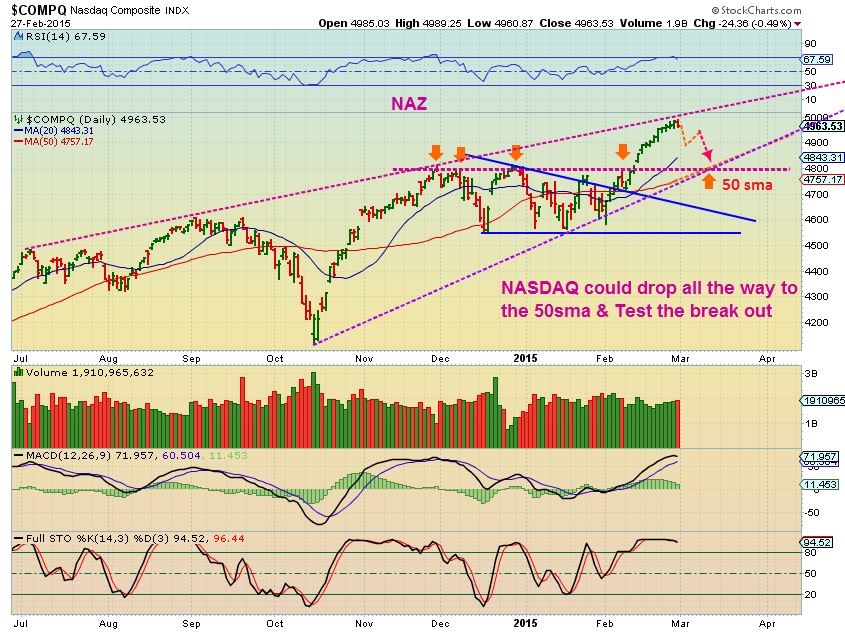
NAZ FEB 28. Is a wedge forming? We’ll keep an eye on it, for now we could keep drifting to the 5000, or drop to the 10sma, maybe even test the break out. This is a realistic view in my opinion. (All charts are click-able)
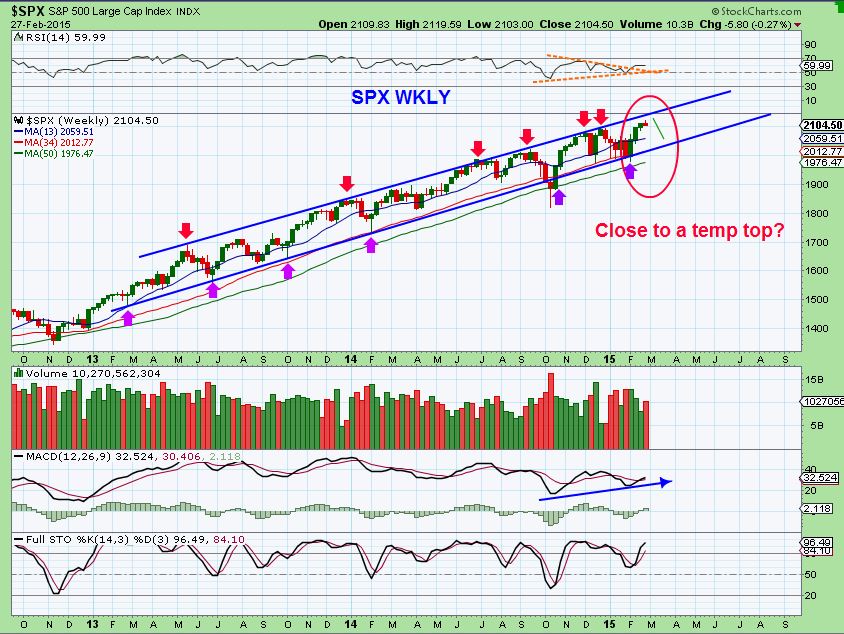
SPX WKLY also looks to be near resistance. Could still go a bit higher, but in the past ( see Aug 2013) didnt always reach the top.
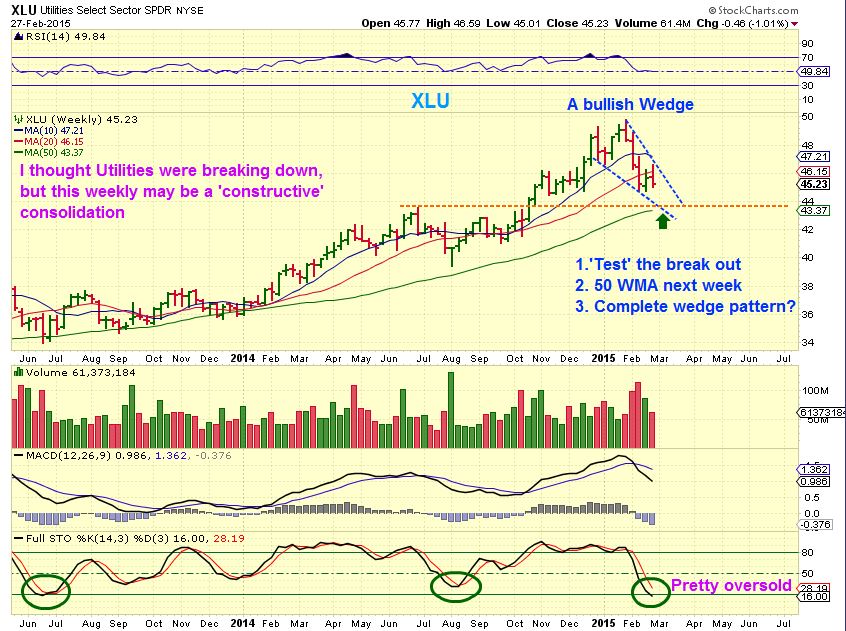
XLU WKLY – I dont often cover utilities, but I saw this nice run up and recently a possible bullish falling wedge playing out. It becomes a low risk buy at $44 for anyone interested, maybe even our options traders?
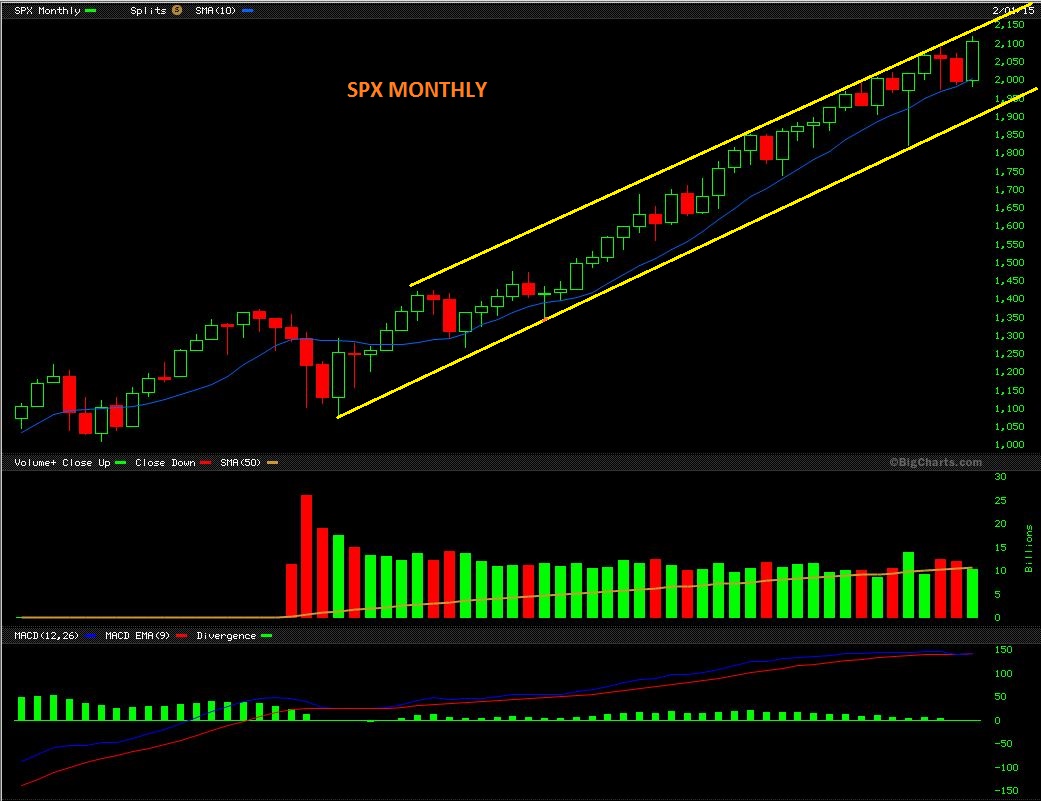
SPX MONTHLY- Bullishness, huh?
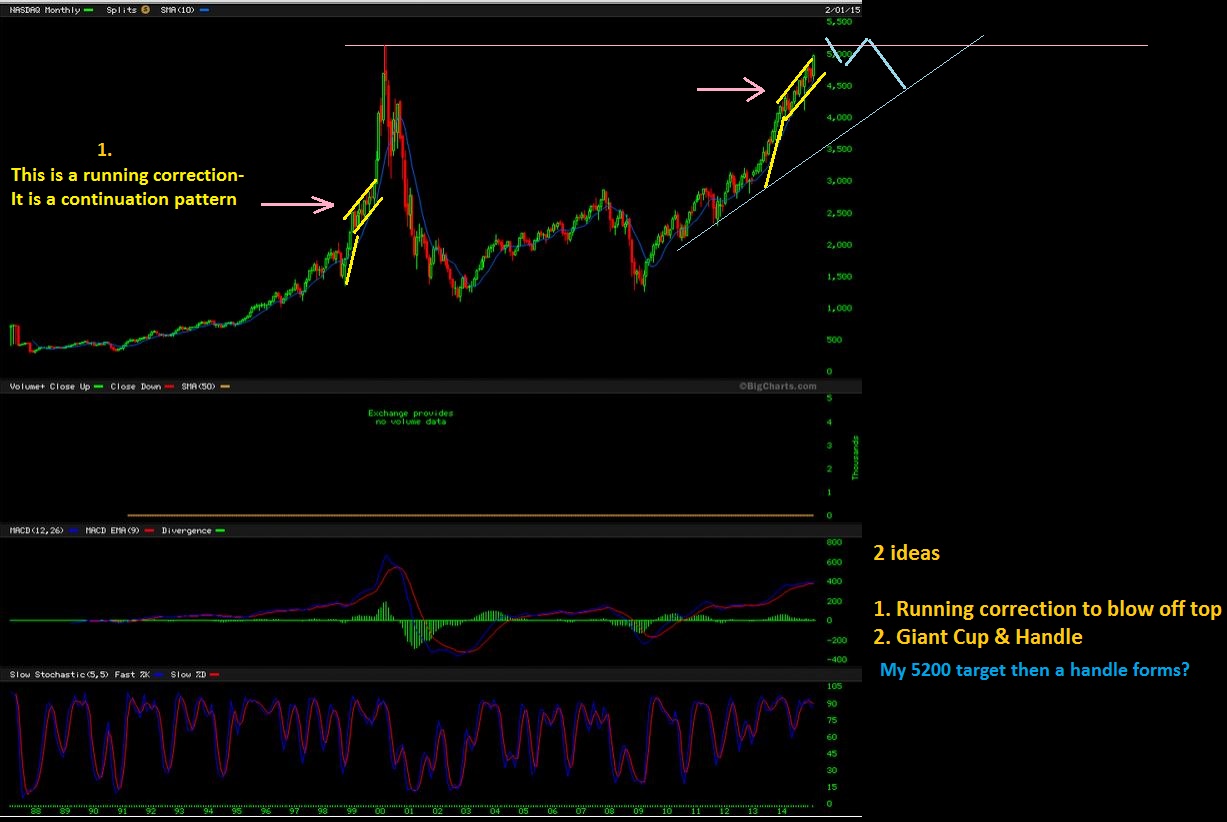
NASDAQ big picture. WOW! (Click it) This could be an enormous Cup & Handle forming. That handle would consolidate likely for months or could just go sideways . It also could just be preparing for a blow off top again. Look at the running correction on the left, it is similar to now . It then burst higher for 5 months in extreme fashion.
This COULD get crazy again like the tech bubble of old, but it’s too early to try to predict.
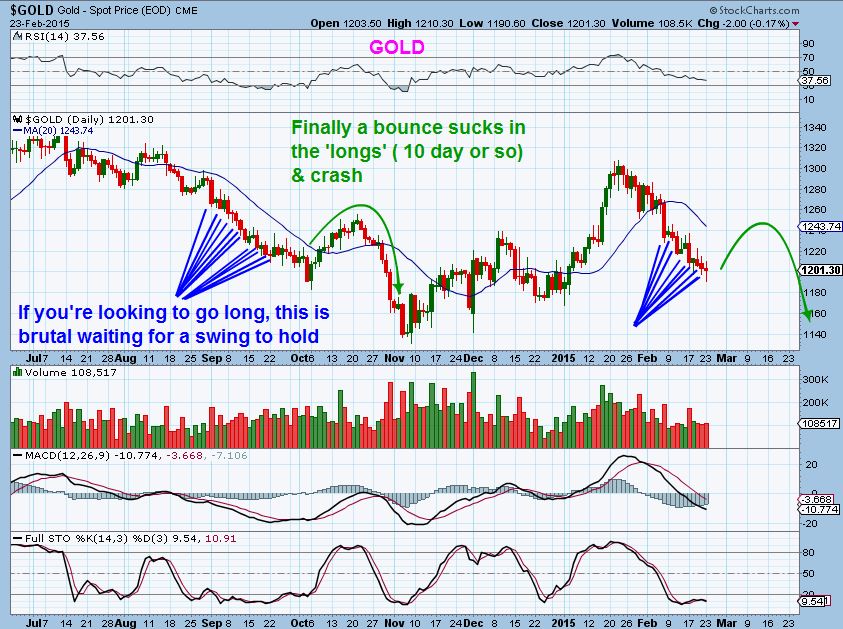
GOLD , SILVER , & MINERS are moving out of a low as expected. All I can do here is express caution again that this is expected by me to be a short term trade. It could roll over 5-10 days after the lows are in, so I will just re-show charts highlighting that.
GOLD lows Feb 24 – Bottomed on resistance & a test of the trend line. Now at $1213, we are nearing the 50sma overhead as possible resistance ( $1230 area).
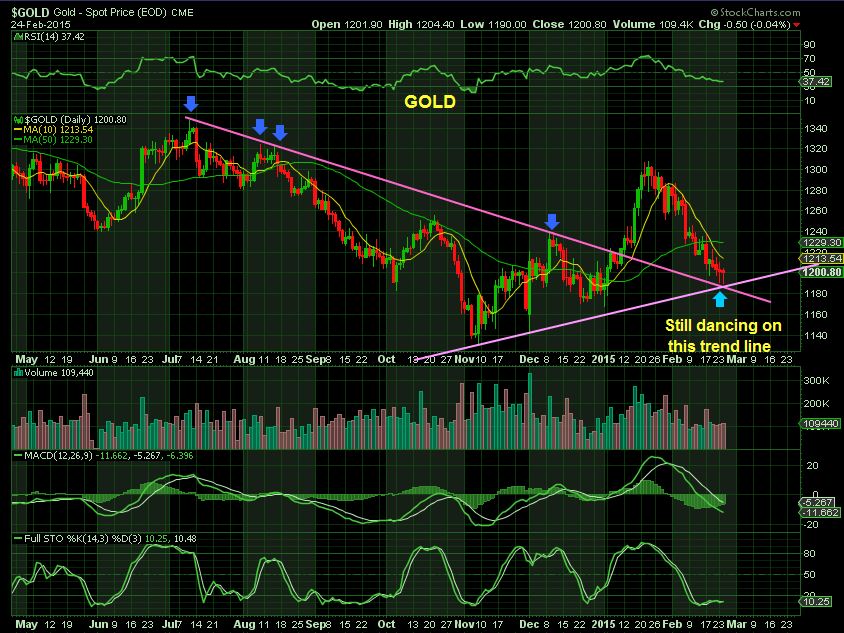
I expect a similar roll over like Oct to Nov ( see the Green roll over). Then we got the ICL= Meaningful trading low, possibly early April. THAT will be strong buy.
Silver – Feb 27 is a bullish wedge ( That volume cant be correct)
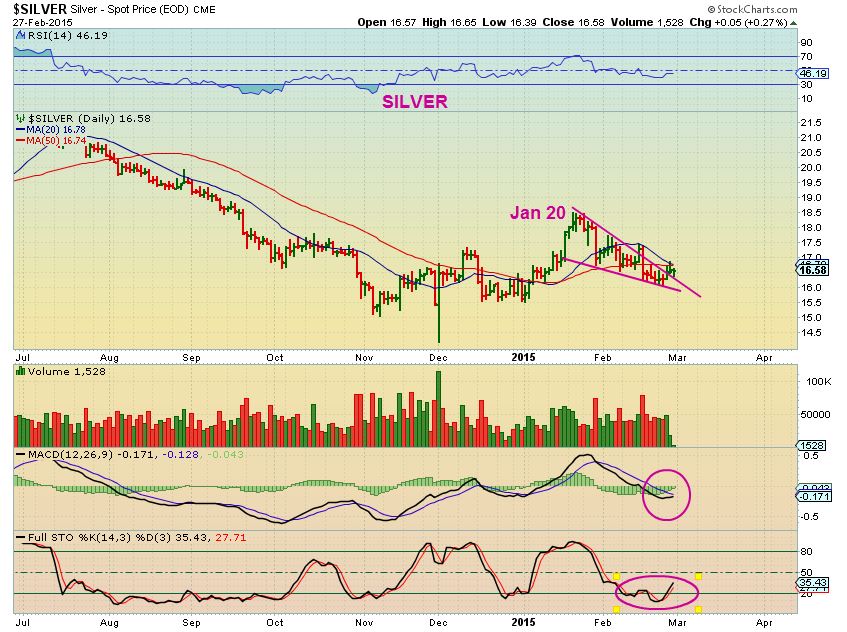
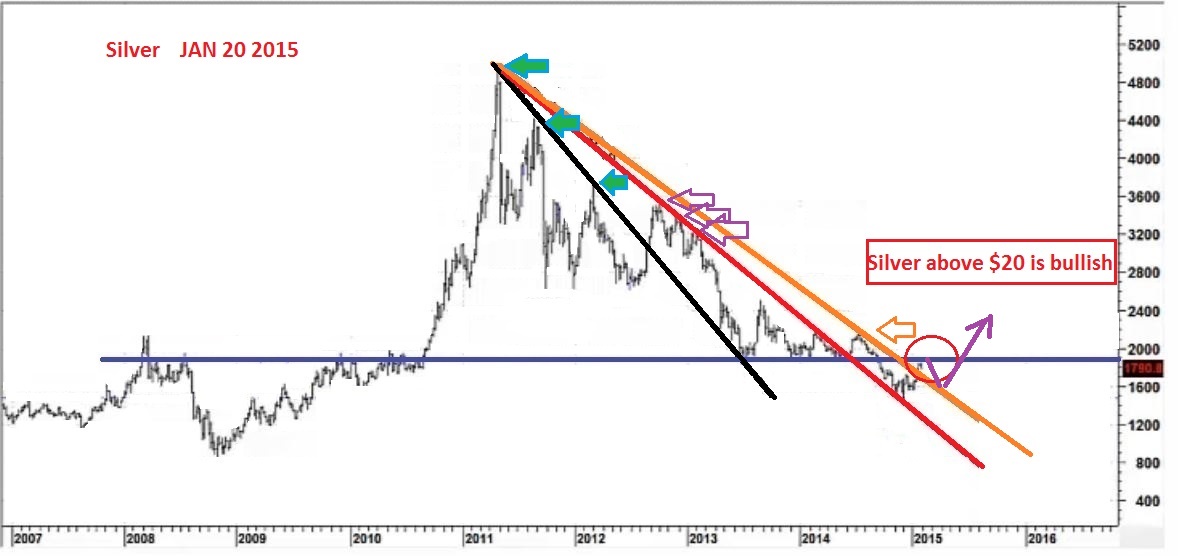
SILVER bigger picture, above $20 means a lot, but this rolled over and tested the break at the Orange Line. It may do so again into the ICL.
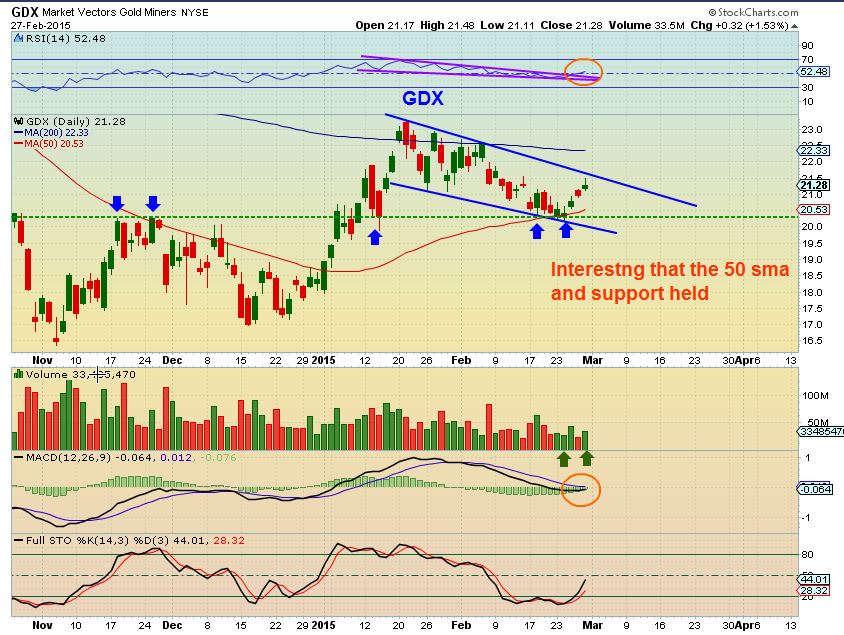
GDX FEB 28 – Felt like it dropped forever, but only 50% to the 50sma. Watch the trend line & 200sma overhead for resistance.
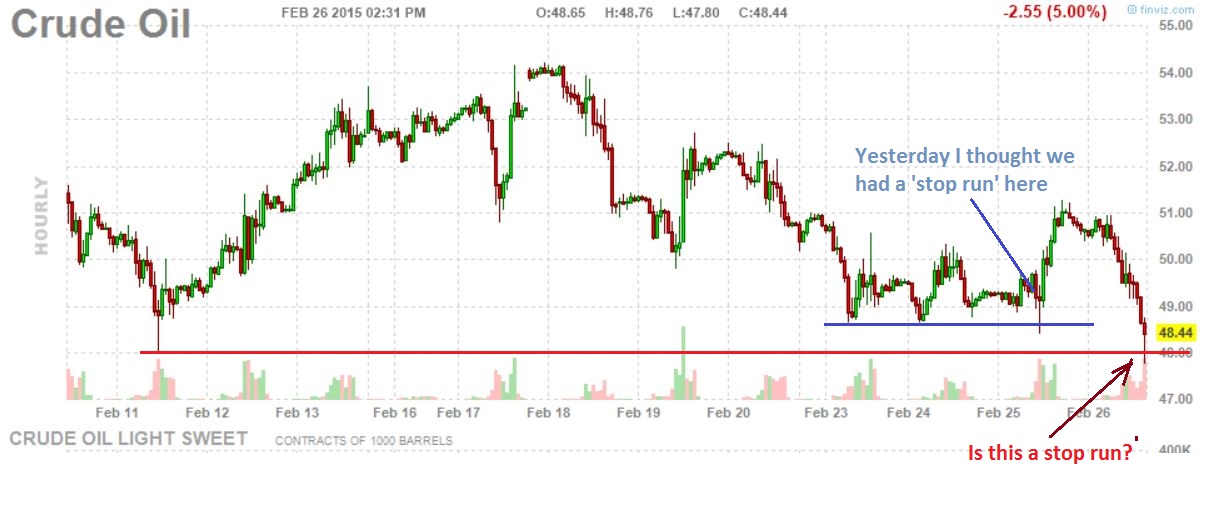
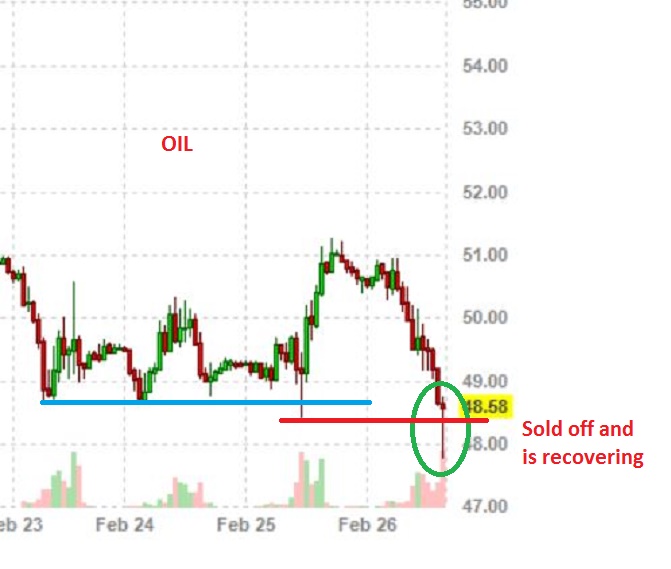
$WTIC – Crude oil still holding up, though it has been rocking this bottom. Honestly, it has only dropped 61% intra-day, and closed down 50% from the rally off the lows.
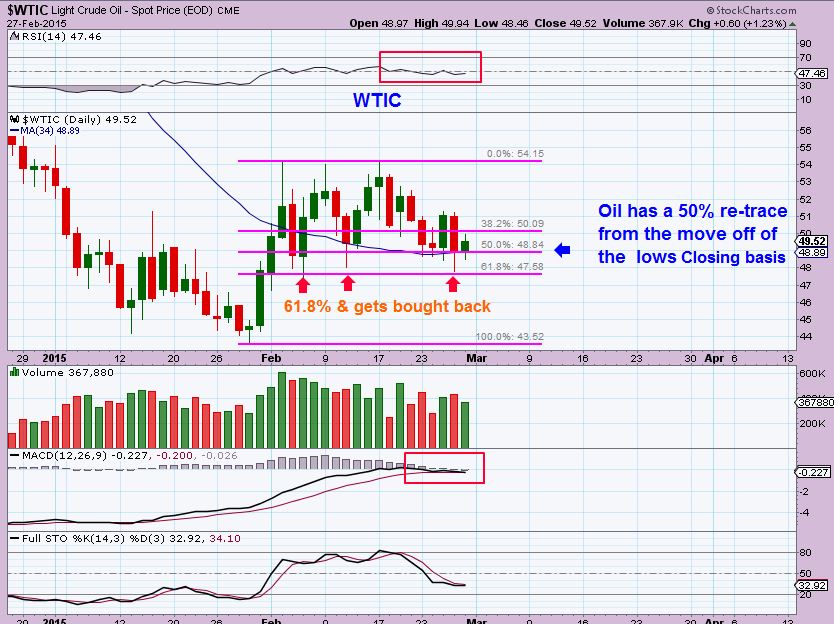
OIL has done shake outs mid day that really make people wonder if we are dropping to another leg down into the $30’s. I still read that everywhere. These were last weeks shake out type sell offs. Probably not the last.
NATGAS dropped a bit more than expected, it almost looks like it wants to double bottom. Below all of the moving averages, I would assume that everyone got stopped out? I still expect it to have bottomed and to rally, but a possible double bottom means I’ll step aside and wait.
I am still bullish on the Energy stocks that I have been outlining, even as they report earnings. I will discuss those a bit more at the end of the report. XOM, CVX and a few other larger companies charts aren’t as pretty.
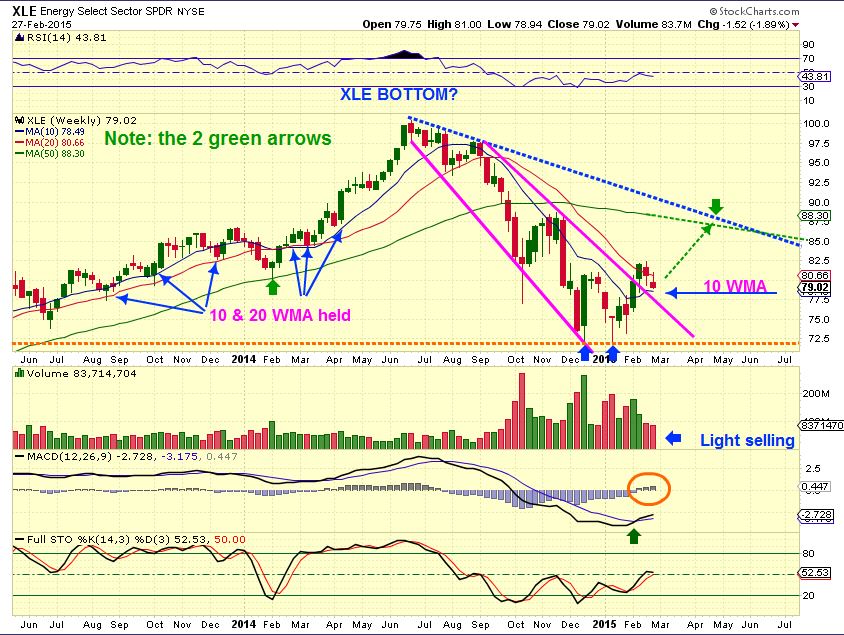
XLE WKLY – Energy sector . Looks like a break out & possible back test on light volume here. Still above the 10WMA
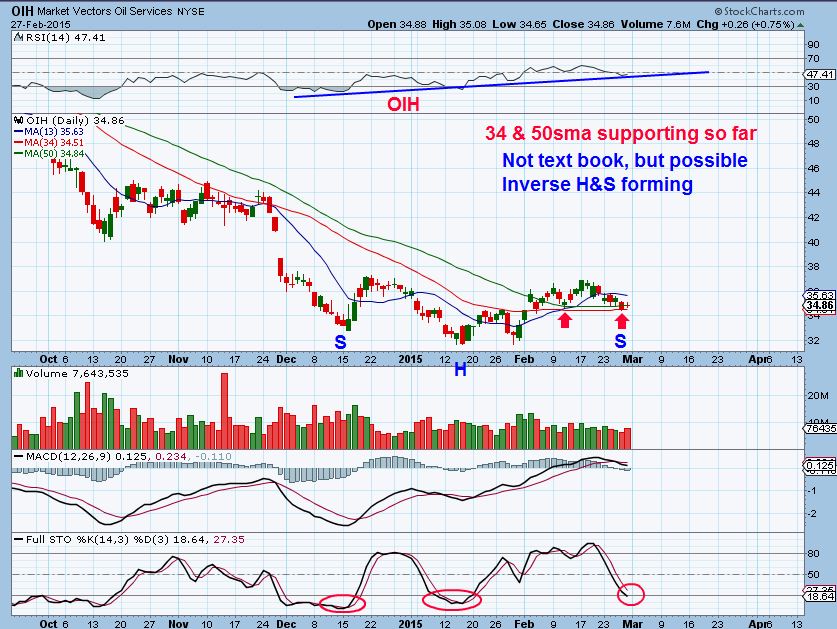
OIH DAILY – oil services
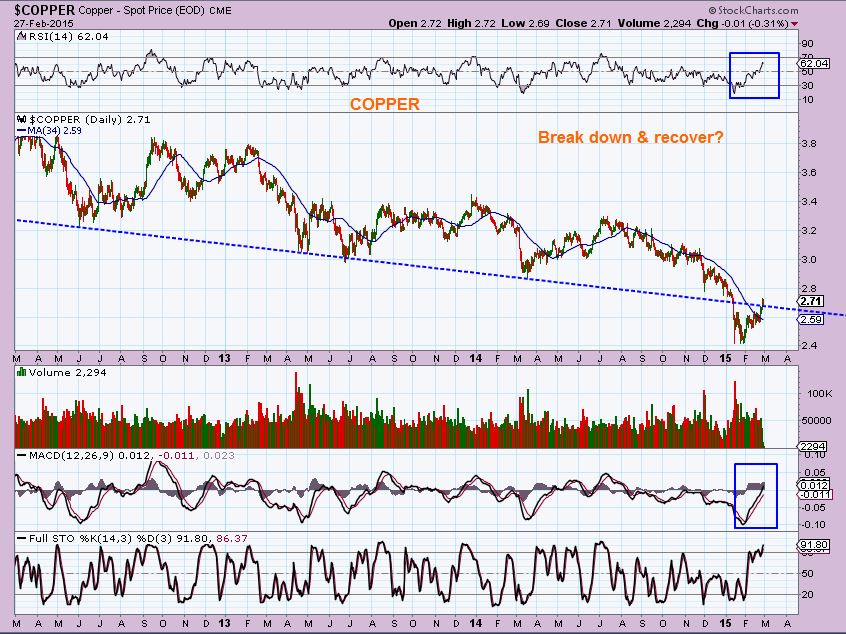
I thought COPPER had an interesting look to it, break down & recover? A copper company FCX ( Freeport-McMoRan) just bottomed under $17 & ran to $23. It looks pretty good sitting on the 50sma right now consolidating those gains.
QUICK review on just a few of our beaten down Energy companies. Since the OIL sell off, you may recall members asking me to cover OIL in early January and I kept saying that I wouldnt , it was a risky set up. When I saw the bottom and started covering them, however, this is the results of just a couple of good set ups that presented themselves. ( I mention this for a reason *** )
Recommended – GDP @ $2.59 and EXXI @ $2.60 & REXX @ $3.04 & BAS at lows.
GDP just hit $4.48 , and EXXI hit $4.75 , REXX hit $5.00 and is a buy again. These are nearing 100% gains.
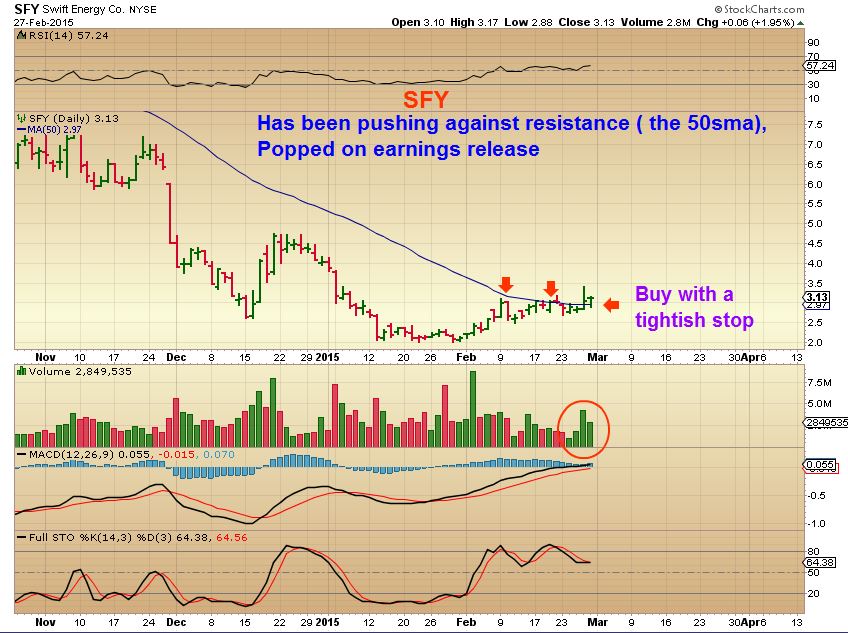
Others have done as good, while a few others have been lagging. Some like NDLE took off and looked good, but gave up most of its gains heading into earnings. SFY has done just ‘O.K.’, but it now looks set up to possibly do better (earnings are out).
That said, This is why I like to:
-Have a basket
-Look for proper set ups
-Monitor them as they move onward
*** The reason that I mention this is…. after watching them progress for a month now , I still see good patterns setting up. I see good ‘continuation patterns’ . They dont ALWAYS play out, but they are considered lower risk set ups, because they are likely to run higher, and stops are closely set below. Some missed the first run, but seeing almost 100% gains in a month, maybe the next run will be strong too.
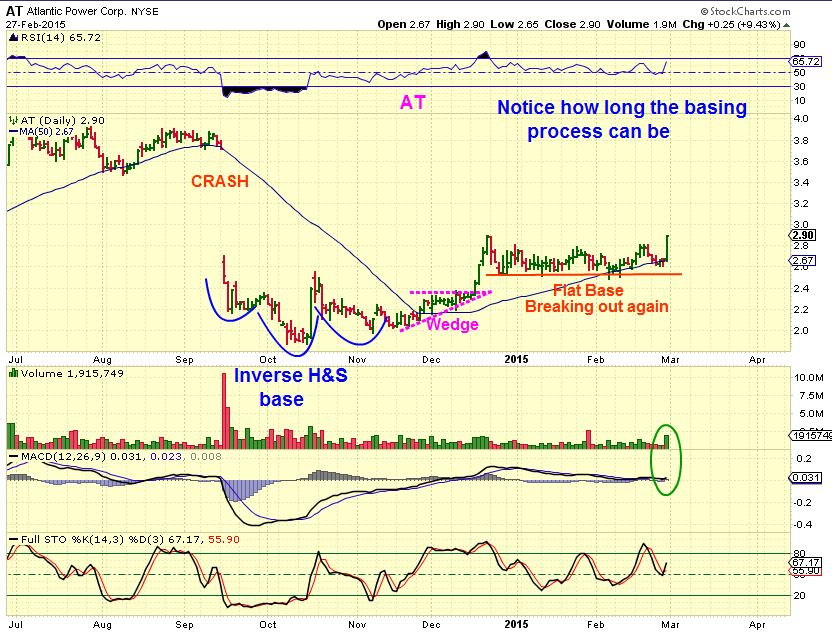
I like the current set ups on REXX, BAS, GDP, SFY, RES, KEG, and many more, even new candidates. IF I left your favorite out, it is likely still there, but remember that if they are basing, it can take longer than expected, like with this next chart. Notice 3 bases formed, so it w can become a lot of sideways action!
AT- formed 3 bases since Oct lows.
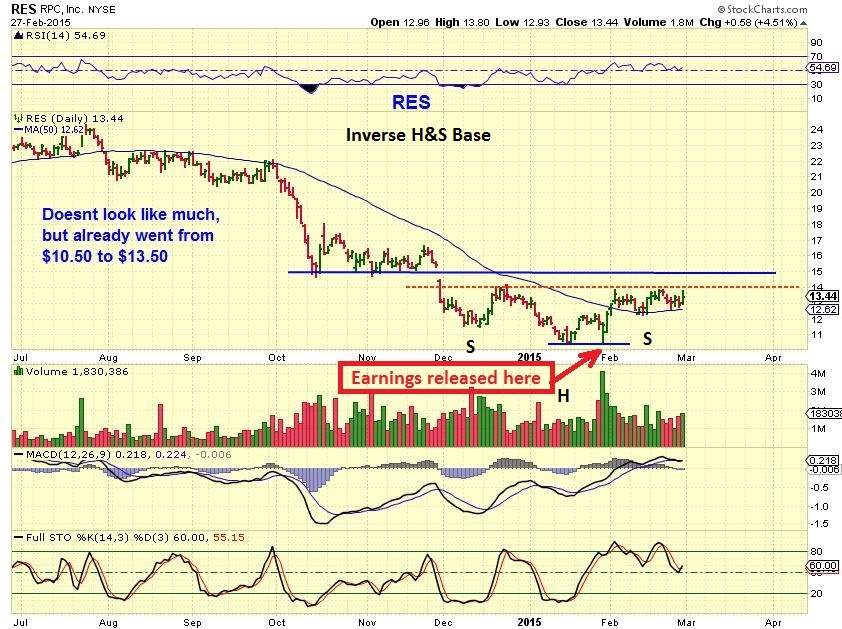
RES – You like them over $10? Inverse H&S, above the 50sma.
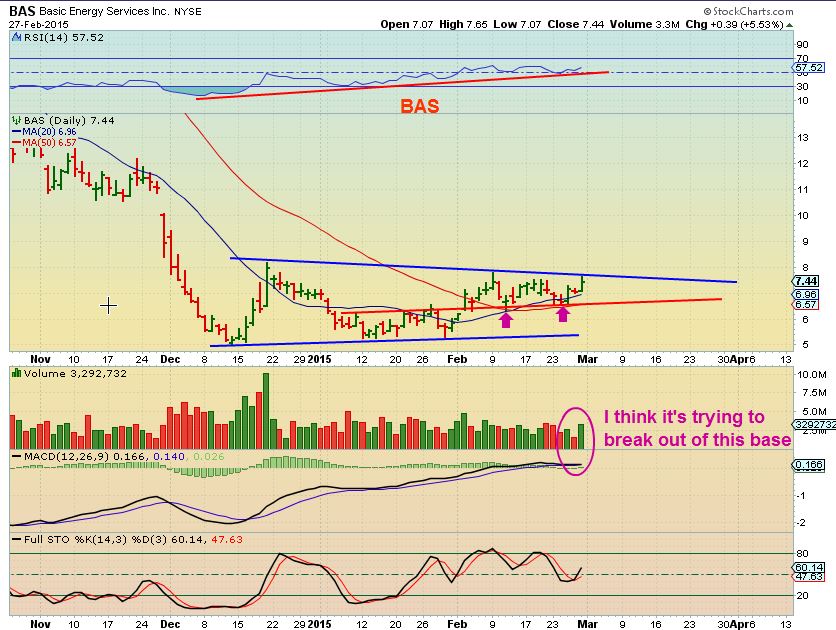
I posted BAS last week at $6.50 on the 50sma, & then here at $7 as a buy
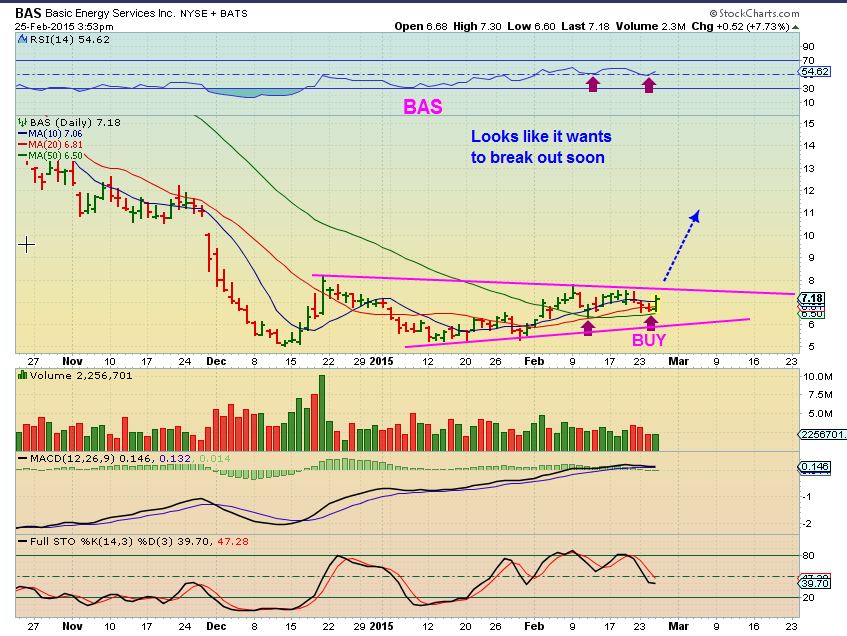
To Me, It is still a BUY if it drops to the 50sma or breaks out.
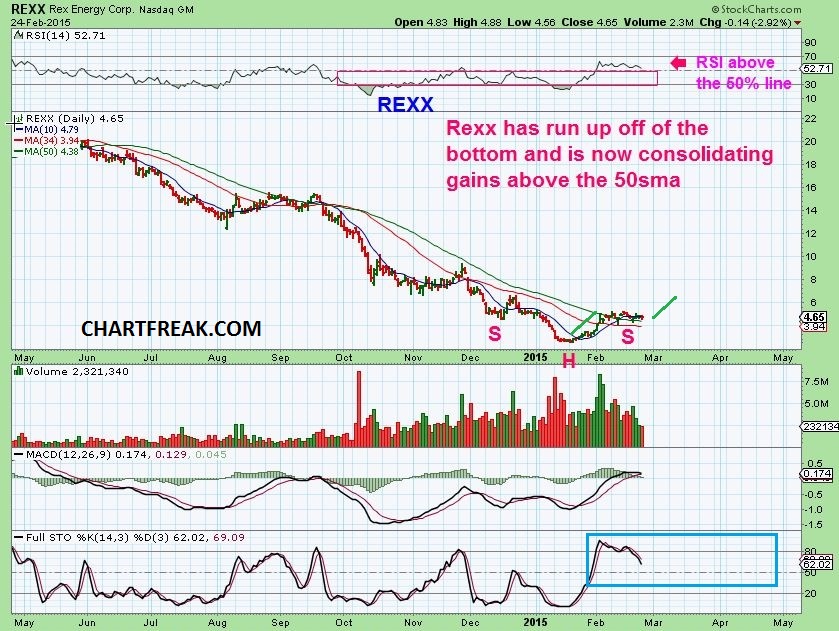
After buying the lows in REXX and selling higher, I have now been mentioning this base. ( Feb 24 chart, bases can linger)
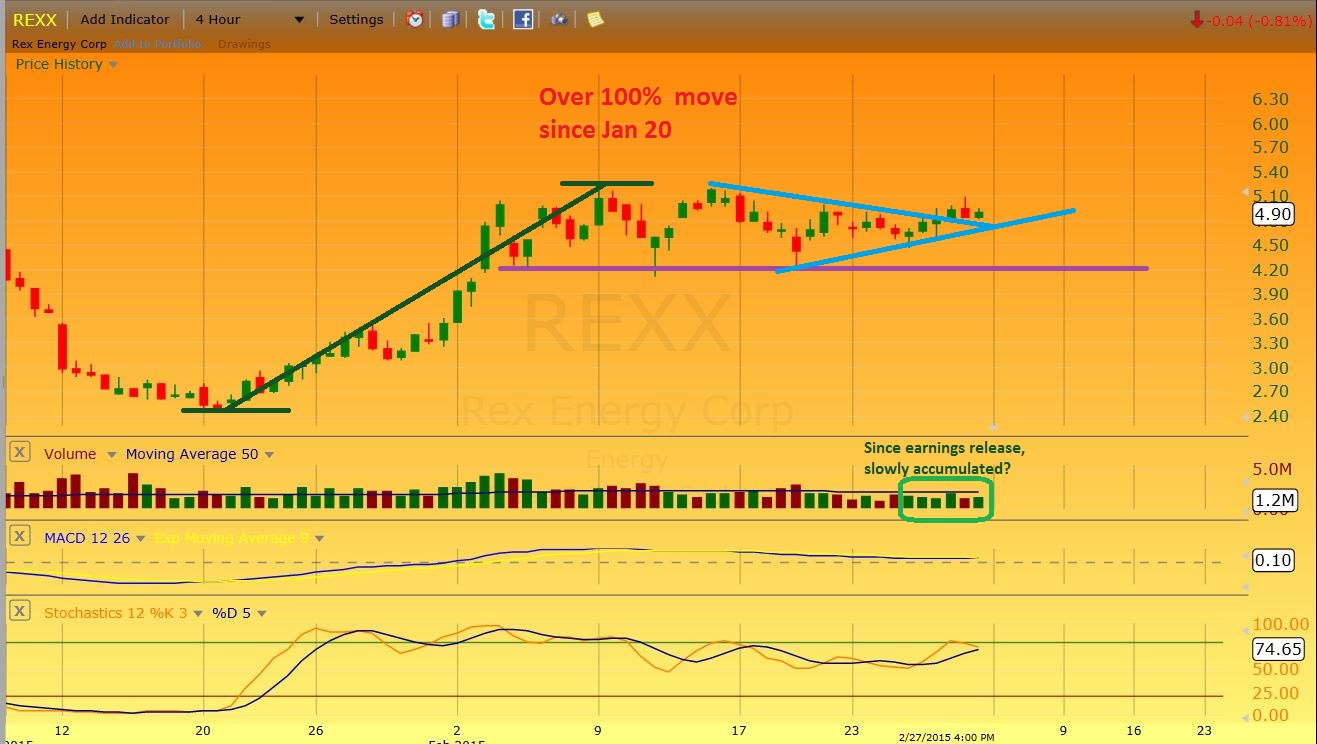
REXX on a 4 hr ( earnings out, it may be set to break higher)
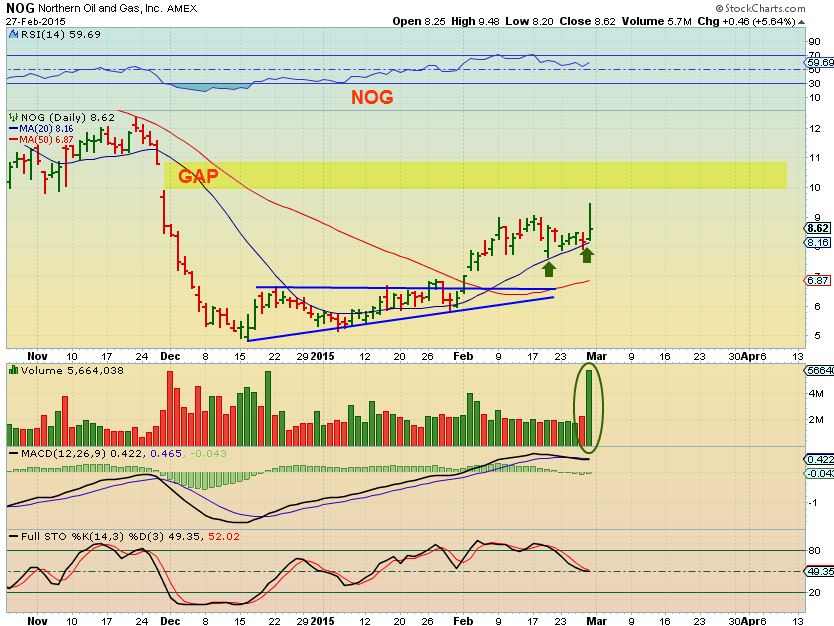
Remember this base in NOG as a buy at $6.50?
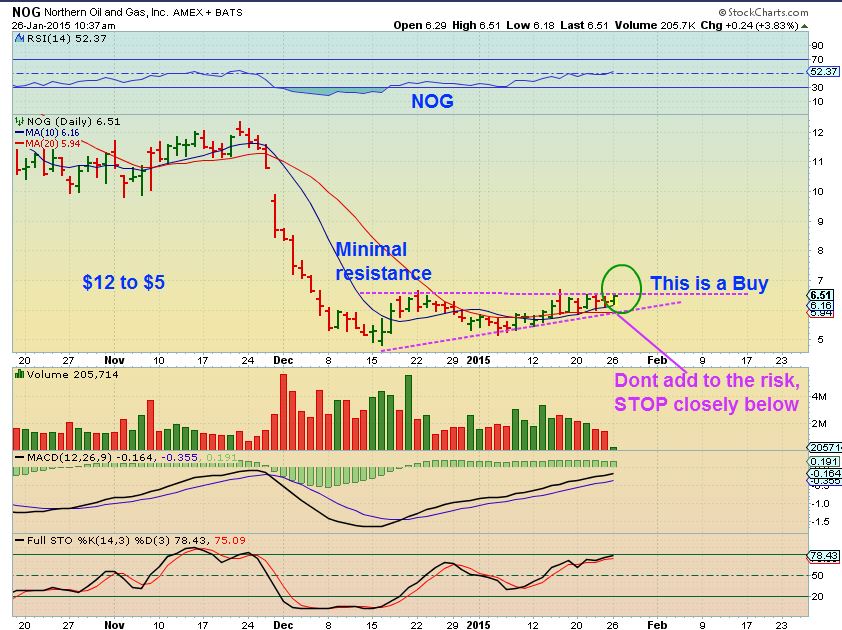
It has formed another base and volume surged on earnings. A buy at the 50sma each time, now its $8.62 and looks set to run again.
SFY – Formed a base , earnings released and its holding the 50sma.
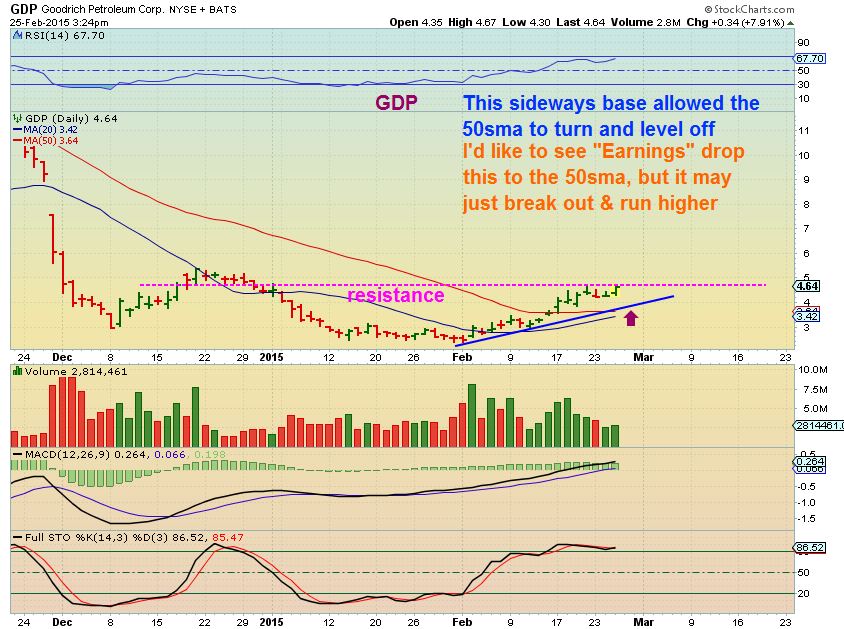
GDP– This was Feb 25 basing. Earnings released now, it dropped to $4.13 pre-mkt then turned higher to $4.48 Friday.
I also have been following some Clean Energy , Bio Fuels, etc .
I mentioned PEIX as one on here, and I want to show you my next interest.
SZYM. If this whole group starts moving, you can possibly catch the lows in SZYM. Here is why I say that, I will start with
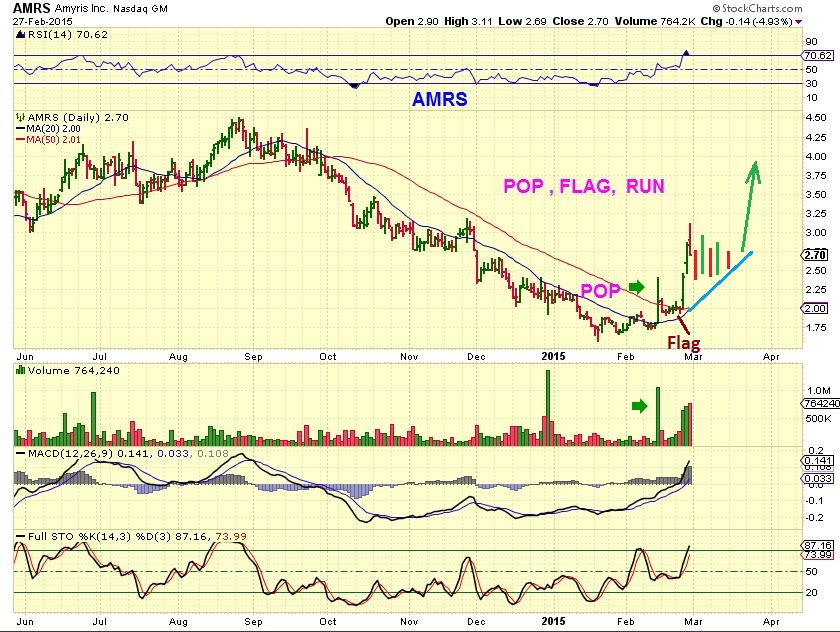
AMRS– POP, Flag, POP, (Flag?) I almost bought the first POP, then it just flagged. Popped again, so This needs to pullback or flag to buy.
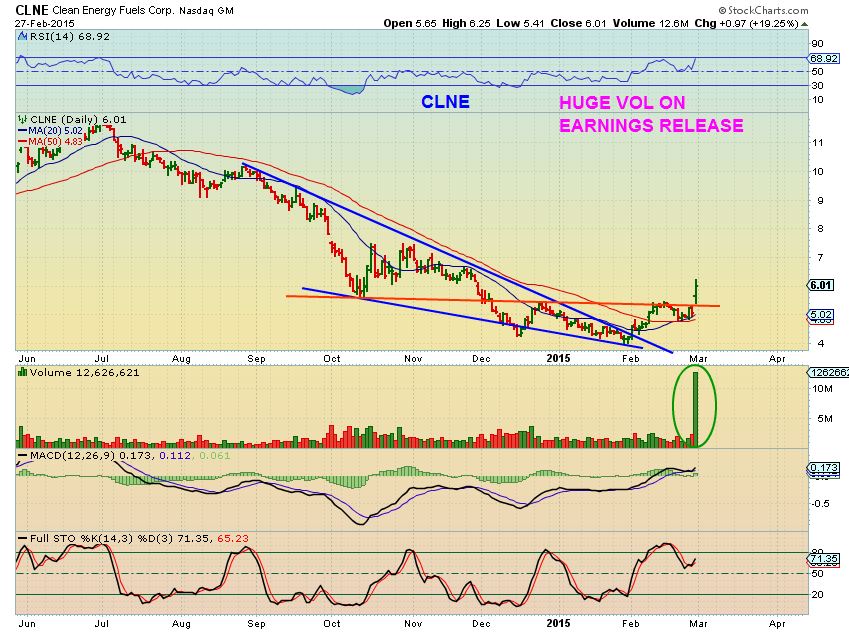
I was watching the base in CLNE and it too POPPED on huge volume, I missed this too , ARRGH. I have seen this run strongly in the past. I’d buy a drop to the orange line if interested.
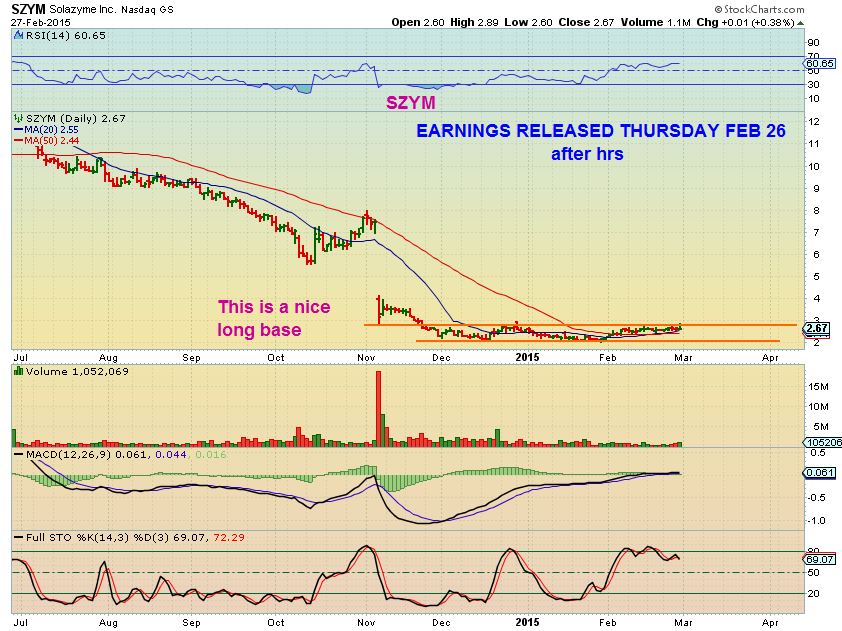
Now look at the base on SZYM . Sweet long base. I was waiting for the earnings to release, and they did on Thursday. It looks like it hardly reacted, right?
Lets zoom in. Did earnings hurt it? No- a POP to the upside. It was on the 50sma and I think that initial POP on earnings may have been “Short covering”. If buyers step in, this could have a nice short covering/ buying rally. I bought the close Friday and I will add on a break out & close higher. It ran from $8 to a $16 last yr at this time, I think it got overdone to the downside.
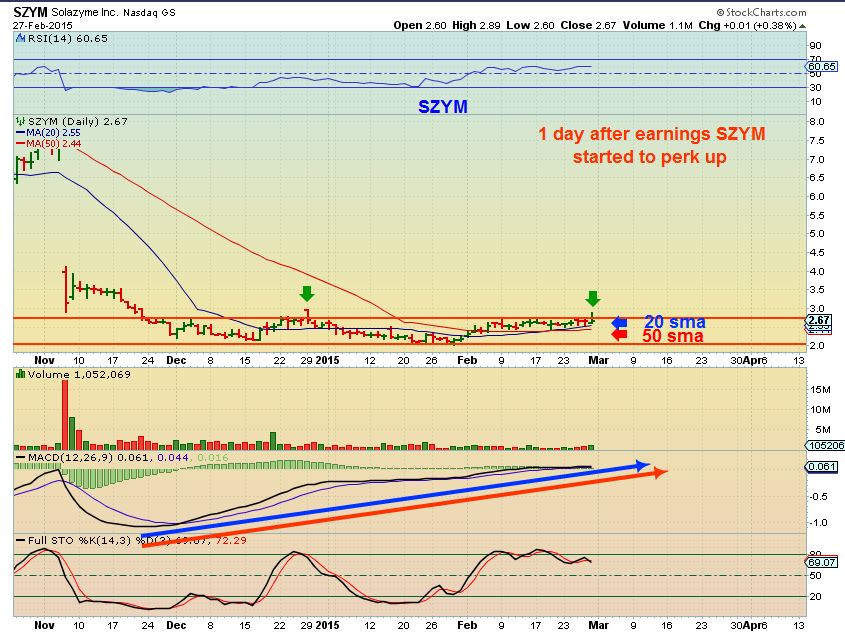
SZYM earnings report. I am wanting to accumulate SZYM and just hold it. I can set a stop below the 50sma if it just keeps basing. This may break out and run higher, I will also add on a close above the base too.
click here for earnings
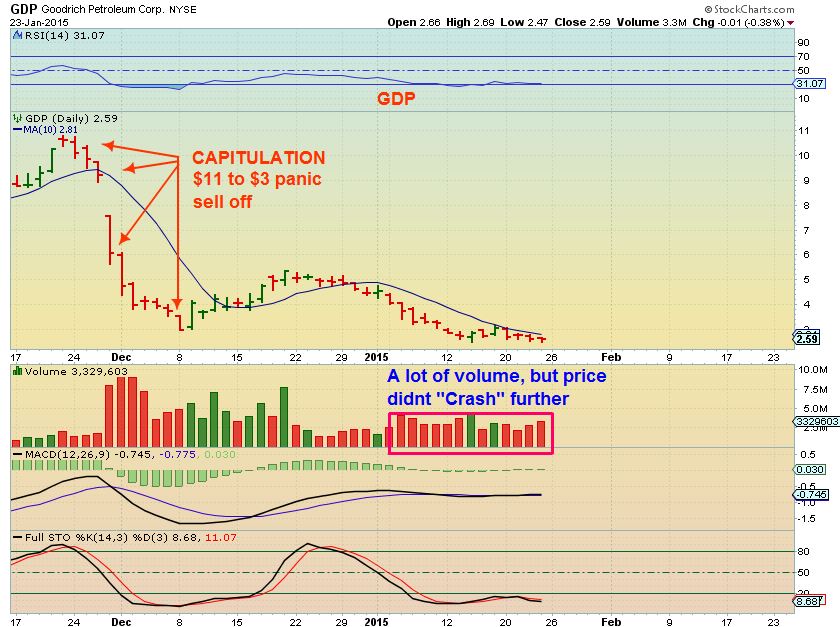
SZYM may be in it’s early stages, worth keeping an eye on. Remember when I posted this a month ago ? GDP basing at $2.50 & now it’s near $5.
So thats your weekend report. I’m watching the markets for a pullback, Energy stocks to break higher, Metals & Miners I am watching closely. The 50sma overhead for GDX for example. NATGAS should be moving higher, but isnt. It may double bottom. Thanks for being here and have a great trading day Monday!
~ALEX
P.S. On the last report, Maria posted a question in the comments section for anyone about a good long term buy & hold . The question was posted this way, and comments can be left in this wkend report comments section addressed to Maria if anyone thinks that they may have any helpful advice .
The question was worded this way: Please excuse her extra punctuation, I think she may just be mocking me ( lol) 
Any suggestions for say a 5 yr set it & forget it time frame? My son has saved a nice little chunk for college..been in an s&p index fund butttt naturally i am wondering if it would be better placed in an say a sector specific index fund and rotate as they come in/out of favor????? or perhaps split up between a handful of steady eddy favs…. just thinking out loud this chilly afternooon… thought I would post here in case any one else has a similar situation. Cheers
I would check it minimally quarterly…probably monthly…ha! but the idea was longer term not short term day trade.
ROSE COLORED GLASSES 
 What’s On The Radar?
Scroll to top

Alex, any thoughts on WRES? It was one of the lagards so bought since I was a little late to the party but it was a bit sickly last week, losing 20 day late Fri. My stop is only a couple cents lower now. Think it might recover or would I be better of moving to SFY, BAS, or GDP instead? Still holding on to REXX. Thanks for the thorough review this weekend.
WRES is a tough read, its a mixed picture now.
On the weekly ,it looks good with a MACD cross up about to take place and it was a double bottom ( Dec & Jan wkly bottom) low with great divergence. The weekly wants to go higher, but thats a slower time frame.
The daily is a tough too.. It is a 61.8% re-trace off the lows, but closed at the lows.I wish it pulled a reversal into the close. It actually just dropped down & filled a gap from Feb 11, so it may be done selling, but it also looks like it may want to double bottom on a daily chart. Its not clear.
Its 50/50 right now. I would just sell it if you dont like it , and use the money elsewhere….and dont look back. Who cares what it does after you sell it, unless you’re looking to get back in.
I gave it a 2nd chance when oil rebounded in the AM. But we all know how that story ended, have changed mode from profits to minimizing losses, will look to redistribute remaining capital elsewhere.
Maria, I would consider NVO or SFY as a long term investment. NVO continues to have double digit growth. NVO is the leader in the insulin supply and delivery sector. The tricky part is picking an entry point. Maybe Alex can help you there.
thanx 4 the input Bill …
Alex, my laggards right now are SOL and YUME. How do the charts look? Would you stay in? I’m thinking of taking the loss and putting the $$$ to work somewhere else?
Sol is below all moving averages, I would have been out of that anyways. The chart for YUME still looks good, but you may be bored with it, so the choice is yours .
SOL moved back up this morning.
Sol looks good again, especially if you look at other solars TSL, JKS, JASO, YGE all reversing & look good
Hey Alex, GDP getting hit hard after issuing new common stocks about 25% of its current outstanding allotment (seems like a drastic move). I’m guessing this would be a good time to jump ship? Thoughts?
dehsy, right you are, premarket down large? Wow!
Hi Deshy
Individual Miners always used to do this (Still do) and the price usually drops to where the public offering price is stated. It doesnt hurt it long term, but the initial reaction is that the stock ” went on sale. ”
I havent read what the price of the offering is yet, but I usually sell when that happens just because I can use the money elsewhere. Ironically, it often still fits the chart structure, and doesnt hurt it in the long-run, but obviously hinders gains short term. When the earnings was going to be released, I drew this chart, so in a normal chart pattern…it could drop to the 50sma.
I have seen some use these opportunities to add to positions, others bail out & move on. To sell or to hold is a personal choice, but it may not snap back quickly .
Thanks for the quick response! Offering at $4.15…so I guess we’re essentially there:-)
Maybe you’ve seen how this can turn out, but for an ‘example’… DQ did an offering Feb 5-
Price smashed right down to that offering price and you can see how it based around & went upside now.
Alex, I think you’re right GDP is on sale right now. I sold YUME and bought GDP.
F.W.I.W. – I added to my SFY position this a.m., since Earnings has already been released , I like the chart ( as shown in wkend report) , and it is slowly melting up the way EXXI has. (Kind of Under the radar-type move so far )
Also F.W.I.W. – I got bored with YGE & sold it, it just passed by sell price moving higher : ) Probably about to rocket higher
I’m with you Alex. I sold USO on Friday because it was a dog with oil up. It’s up nicely today. I did hold my YGE but sold SOL as owning SOL was about as interesting as proverbially watching the paint dry. Perhaps I’ll do the board a favor and post my trades so everyone can trade inversely of me and make some money. : )
Well, I kind of like that reversal in YGE ( I sold mine last week). It has that flag look on a 2 month daily & today YGE reversed higher at the 50sma .
Theres still hope : ) Check out TSL, JKS, JSAO
lol
And it did : )
yeahhh… hence the giggle.
Wow OIL & UWTI..that was worth the overnight hold;)
Hi ALEX….. last week you like LNG-A, how does it looks now it’s around the 80.30 ?
If I look at one year chart, is this a double top?
Thanks ALEX.
Not likely a double top. Look on a 2 yr wkly, looks more like a cup & handle possible (No handle yet) .
Also please understand that your question is not clear to me, and my answer could cause you problems.
You ask ” How does it look now …?” My answer is that it looks great , but…
If I look at LNG, It looks good, but that doesnt mean its a ‘buy’ here. It has run up a bit and so it would need to pullback or go sideways for that.. And if I say it still looks good, I mean it looks healthy, but it doesnt mean that it looks so good it will not pullback from here. LNG can actually drop all the way from $80 to $72 and still “Look good”. $72 is the 50sma.
Thanks Alex….. indeed I was not to clear on it, but you answered it excellent.
I own it, buying last week 2 long calls Jan.16
I think I will keep it for now ALEX.
You teach me very well.
Ok, I wasnt sure if you owned it or wanted to enter, or wanted to know if you should sell it, because it may not look right. Thx
Hey Alex
Where would your stop be for something like KEG if you go in at the highs today 1.84?
Hi Steve,
Read this then click on the chart.
Actually, I think KEG wants to drop a little lower than that, maybe in the $1.75 area and hopefully reverse higher from there. So with a stop, It depends on position size & it you can take the loss if you lower your stop to $1.70 – $1.75 and it gets hit down there ?
The test of the triangle break is done, so it also may just go sideways until the 50sma catches up in a day or two also.
.
NUGT holding at the 50sma
Wow, I am absolutely shocked that Gold has rolled over all ready. Coming off a pretty solid AH session made today’s loss all that much worse. Stopped out of GDX for mild loss. Seems the play here is now to short pops for an aggressive traders. But I certainly wouldn’t want to remain long this complex; when it goes it gets ugly quick. I thought we had a solid 4 days left.
Also a tough day in the oil pits (if you can’t tell by now, I got smoked today!). REXX still hanging solid, a few others still hanging tough. Not sure if we can get a big 2nd leg unless oil moves to the upside also, though.
Alex, solar did look good today, I’m in TAN as my alt energy play – solid day. Best trades for me recently have been bio-tech. CLDN, QURE, CNCE. Frothy? Sure, but it’s still working. Just like that magnet that drew NASDAQ to 5000.
CNCE?
You’re telling me that you rode that? Last 6 trading days it went from $15.50 to $13.16 2 days later, then to $15.70 next day and 1 day later $13.92. And you thought GDX got slaughtered : )
Tonight gold dropped 10$ to under 1200$ now has quickly recovered 14$. I wouldn’t be surprised if we get an A-B-C move here, with the B today’s down move. That would give us another 4-5 days to complete the move. We shall see.
No, I actually didn’t. I was in CNCE, but when I saw volatility picking up, I took profits on recent spike in Feb. I am in the other two currently, looking at adding CNCE back or ZIOP (it would need to pull back first), just wanted to share some non-commodity linked names.
I had the perfect plan for miners and it was all lining up then it gave It all up at opening bell. She broke my heart, Alex. I was way more upset about my plan and the implications for 3/4th DCL then the couple of dollars I actually lost on that trade. Actual GDX entry/exit near same, but lost premium on options plus comission.
The GDX slaughter was bad b/c I had used options since I had a defined time range, a specific target, and wanted to define a maximum risk. 🙁