Did you see what I saw yesterday? I had mentioned in the weekend and daily reports what I was looking for, and by the end of the day I was fairly certain that we got what I was looking for . First lets review the markets and then discuss other sectors.
Again, I had been shorting the Nasdaq at prior highs using TZA, but I stopped last week and pointed out why last wkend…
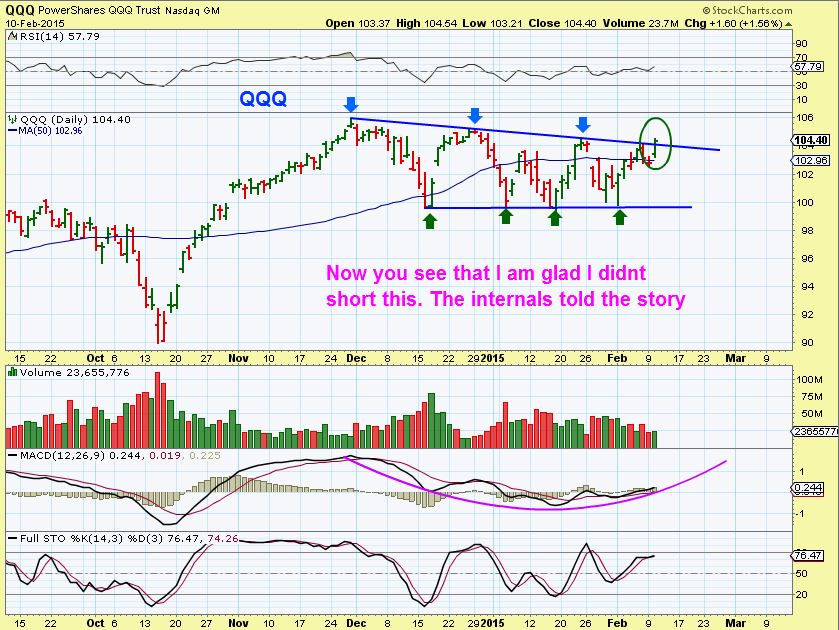
What do I see now in the NASDAQ, SPX, and DJIA?…
NASDAQ – resistance again, but also a possible break out could be in the works. TQQQ & UPRO are higher risk ways to play this as a long position.

The OIL chart from yesterday is still valid, OIL actually looks to be in a bottoming process here. That process CAN fail and give way , but so far it is holding up well. Along with OIL…
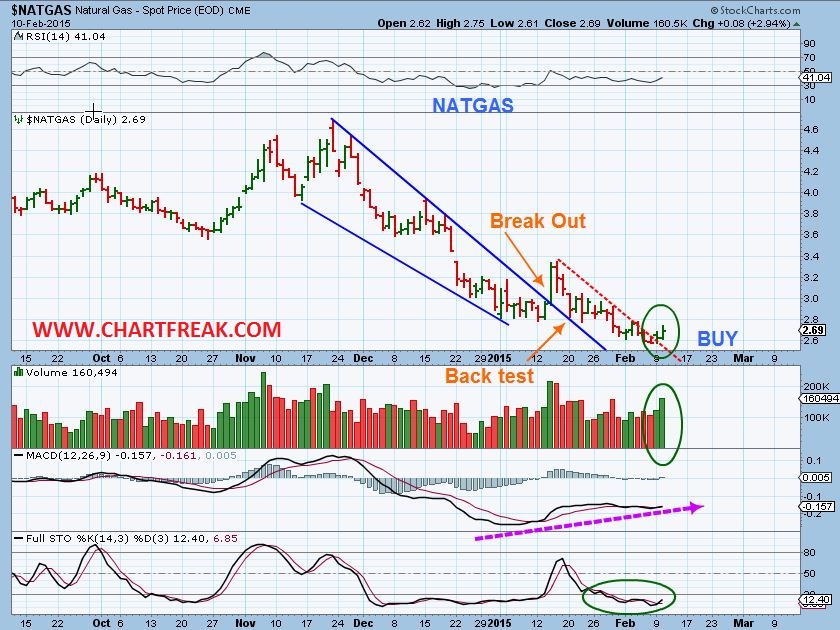
I mentioned buying NATGAS, pointed out what to look for as a break out approached with this chart ( I bought UGAZ 2 days ago- I do NOT recommend 3xETF’s here. It is far too risky, but the “traders” here know what to do).
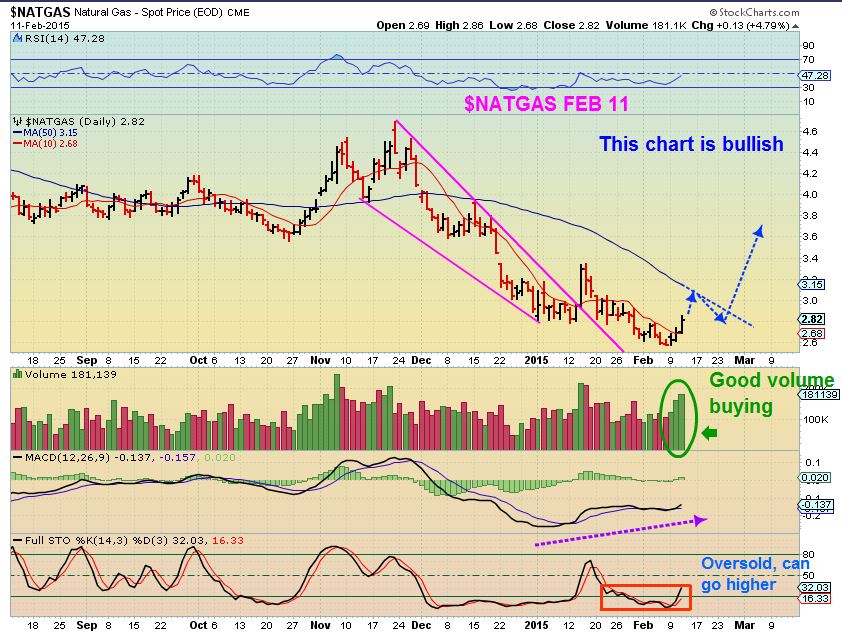
NATGAS Feb 11 – ‘possible’ path
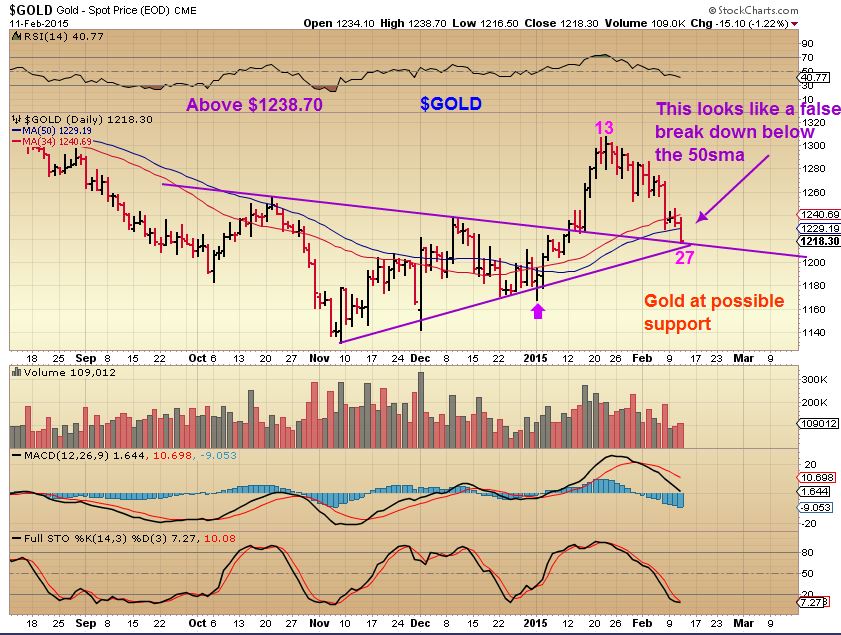
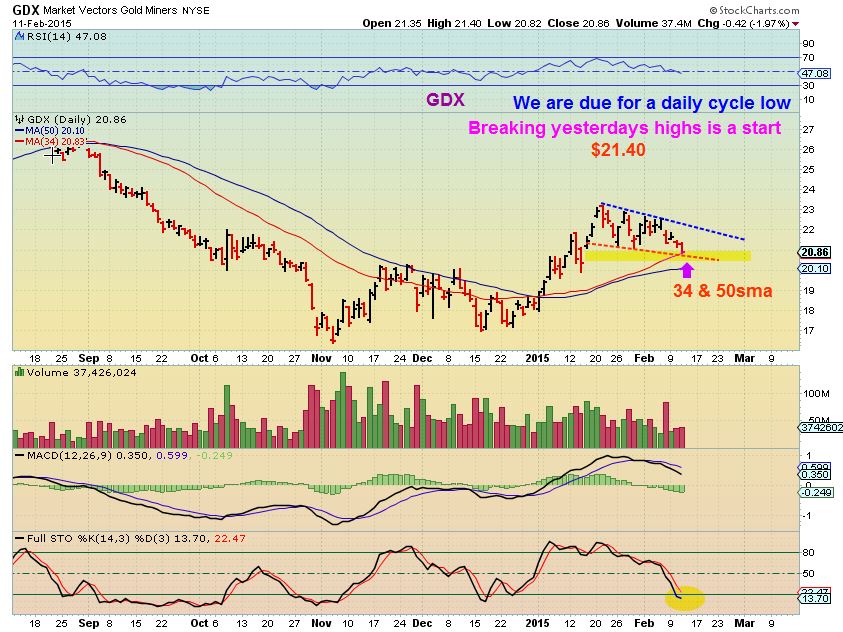
$GOLD & MINERS- we are very close to a daily cycle low. I have mentioned that the 3rd daily cycle has been week in all the other bear mkt rallies ( often double tops with a false break out spike). It is up to you whether you will try to profit from a brief rally, or choose to focus elsewhere. Encouraging is the fact that Various MINERS look good, and have held up very well (CDE, NG, PZG, etc) , but …that can change , see HMY for example, so remain cautious. .
GOLD– possible support, may reverse higher here ( Now left translated = weaker)
GDX – possible support, a break of $21.40 is a start, break of the blue trend line confirms a new daily cycle
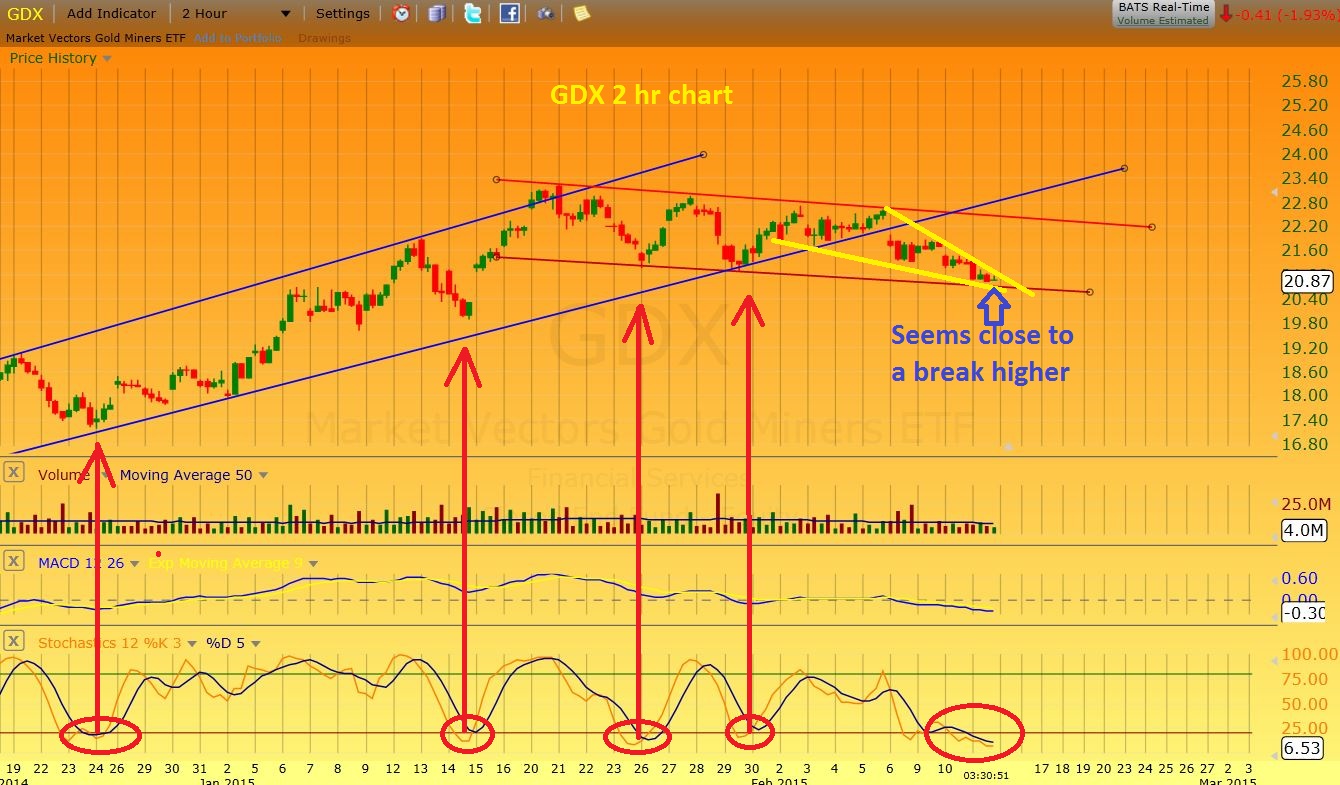
In the comments section yesterday I said it looked like GDX was close to a reversal higher on an intra-day chart. I was watching this 2 hr chart –
ENERGY
IMPORTANT: I have mentioned watching for Energy Stocks to pullback lightly and find support IF they have bottomed. This would show that they may be preparing for another leg higher. I also pointed out how the MINERS did this…
1. Some Miners were running up in DEC to the 50sma, then dropping slightly , building steam to break through.
2. Others broke above the 50sma and then dropped to test it , before running higher, so …
3. We look for reversals in these areas as possible low risk entries
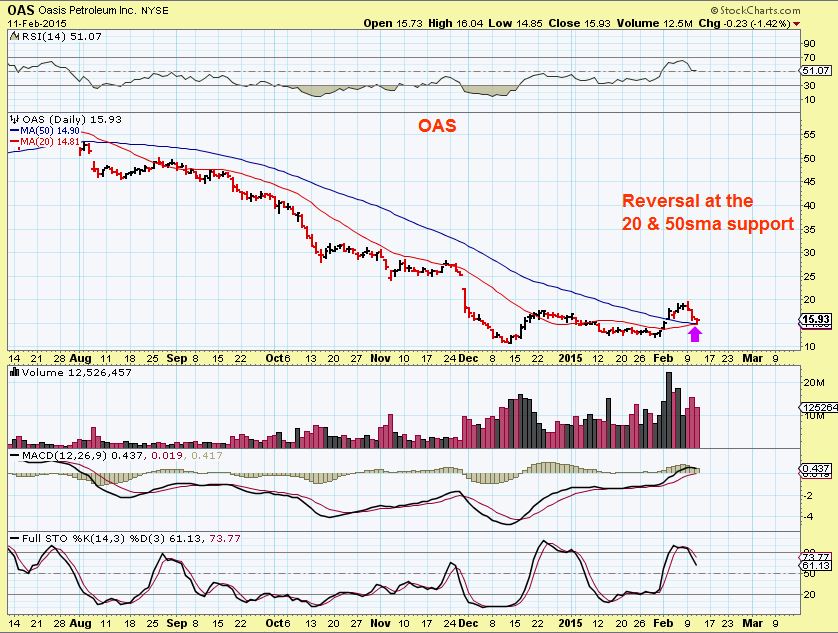
Remember, there were Energy stocks that I pointed out to buy first as LEADERS ( OAS, DNR, NOG, EXXI, AXAS, BAS, etc) and then we looked at buying some LAGGERS after the leaders peaked. It stands to reason that Those LEADERS should reverse first. They have, and many looked like a BUY yesterday , they are still a buy today , now we want to see if they progress.
The Leaders: These could have been bought here, or can be bought here with a stop somewhat below the 50sma ( use your own risk preference, how much below that price can you afford to give up if the trade goes against you?). You can also watch how these play out (Seccess or Fail) and if they succeed, you can enter the laggers ( GDP, SFY, HERO, NADL, etc ) with more confidence. IF THEYGAP OPEN, some may want to wait and see if the gap closes, others may take 1/2 a position in case it just runs, take the other 1/2 if the gap closes and the support area holds. Use your own strategy based on your risk .
These are buys as of yesterdays close- or wait for other laggers to do the same
OAS
EXXI
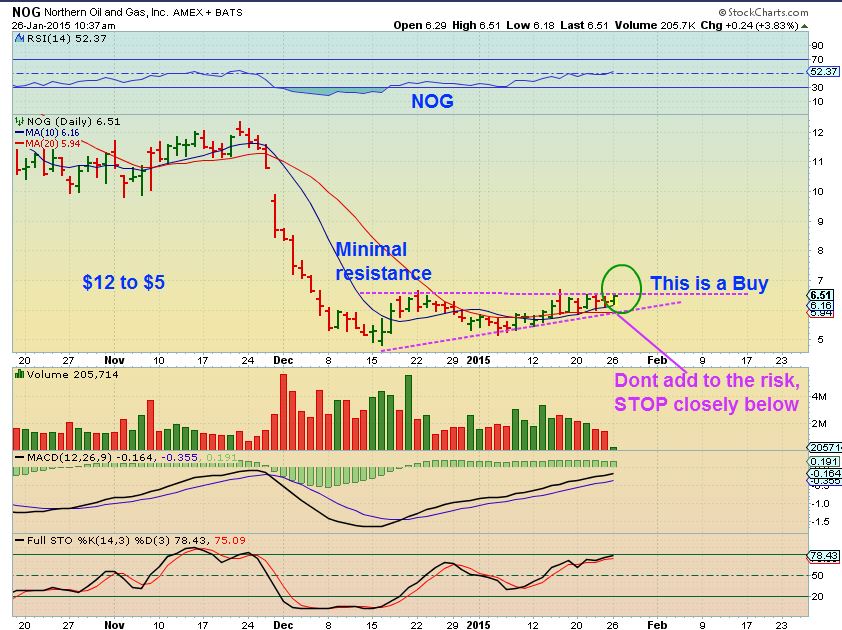
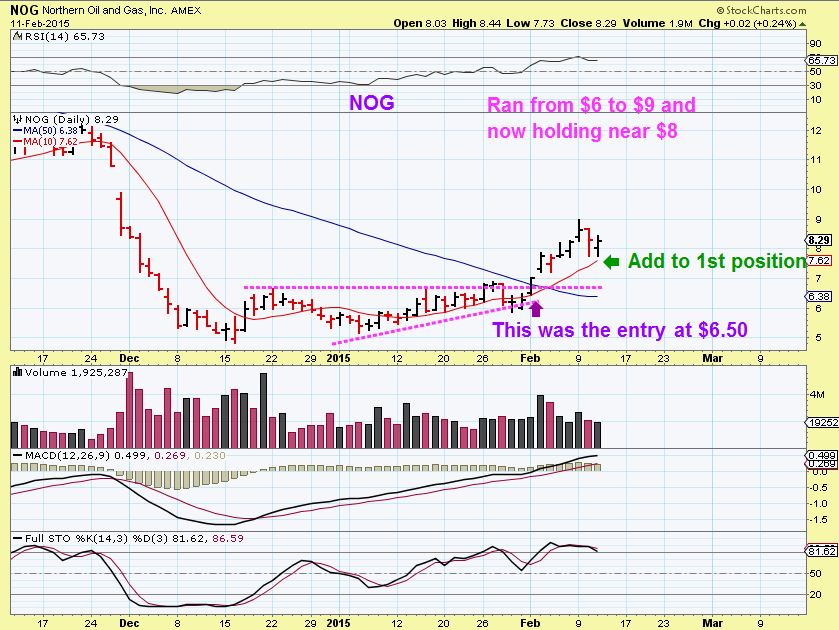
This was my first NOG recommendation, then look at yesterday
NOG FEB 11 (Acting nicely)
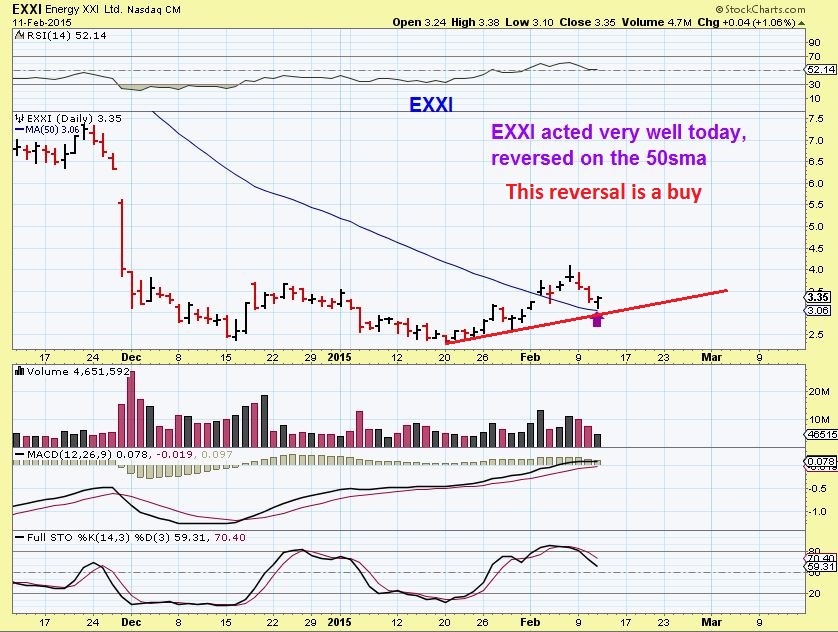
EXXI first recommended (buy at $2.50)
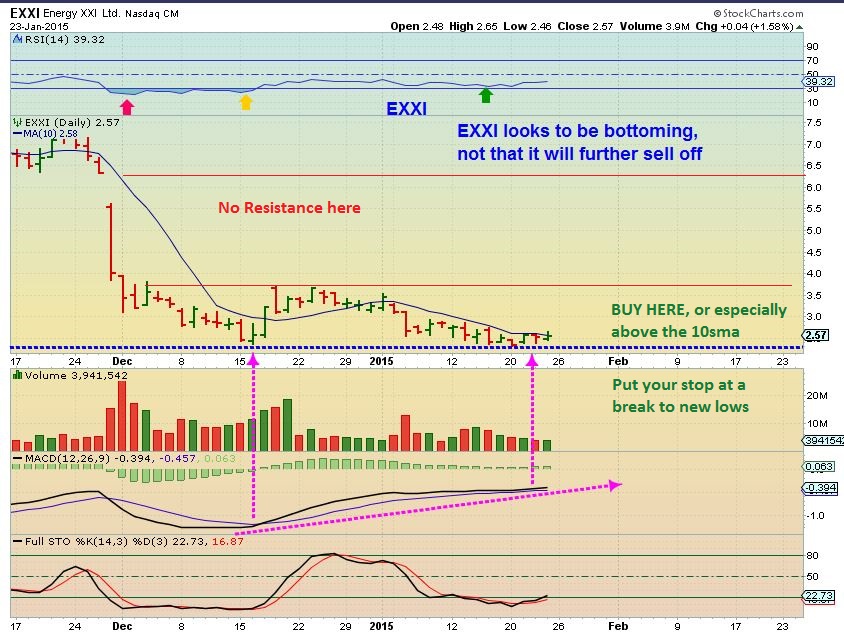
EXXI (still acting correctly, reversal so far)

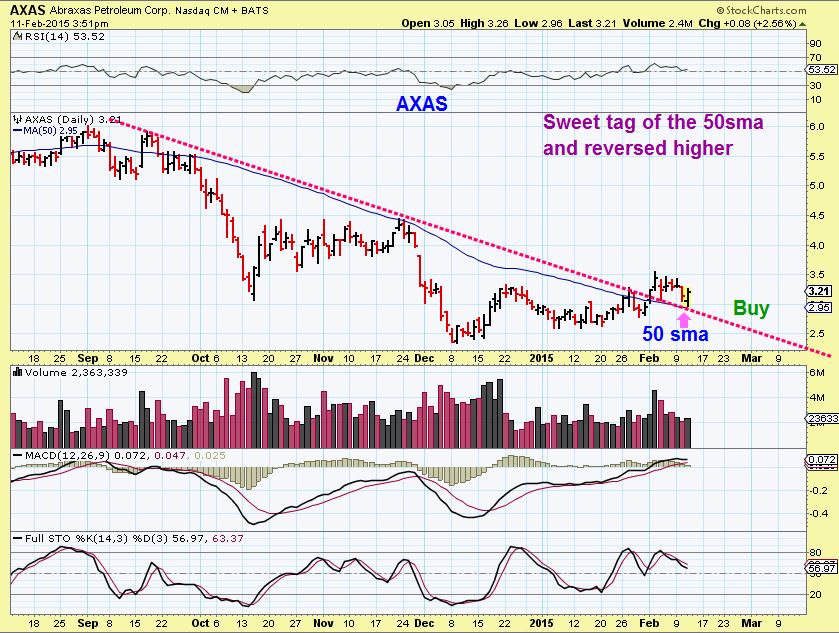
AXAS- is a buy
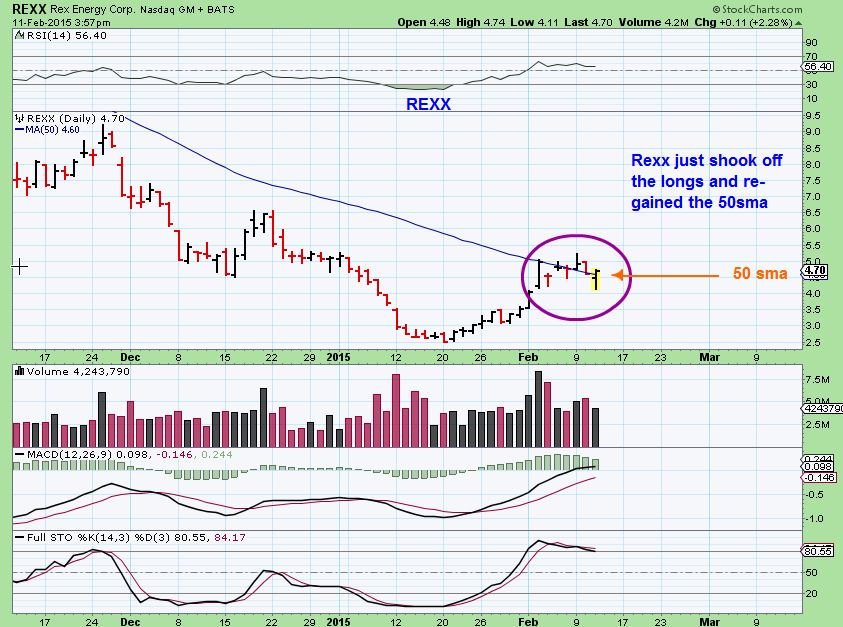
REXX FEB 11
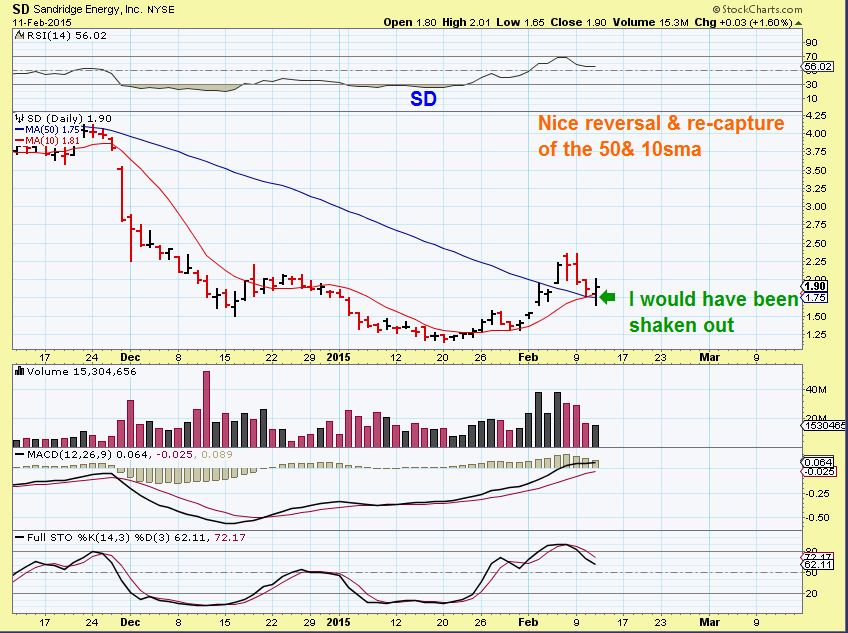
SD – this drop below the 50sma may have shook me out if I was in, but then a nice reversal immediately made it a BUY
THE ABOVE are also examples of what we are looking for in the ones that didnt reverse yesterday ( NADL, GDP, SFY, HERO, WRES, and others that lagged last time.
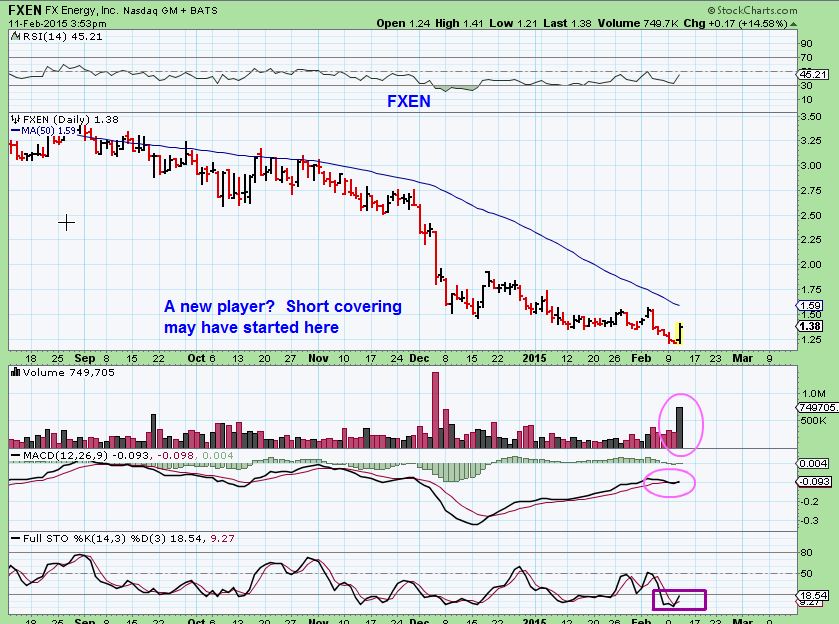
And I found a possible new contender FXEN. It was around $3.00 2 months ago, a run back there is over 100%. Other energy stocks like NOG, EXXI, SD, REXX, etc have done close to 100% already. Its not impossible to return to former highs quickly.
Those who like stocks near or over $10, look at DNR, OAS, SDRL, ( I love LGCY if it reverses at the 50sma) . These stocks are buys that have reversed at the 50sma. They may not take off right away, they can flounder around the 50sma, scoop them up & use a stop. Your downside risk is small, your upside potential is better. THEY ARE ENERGY & OIL…so remain alert to the fact that they are bottoming and that is a process, it can include volatility.
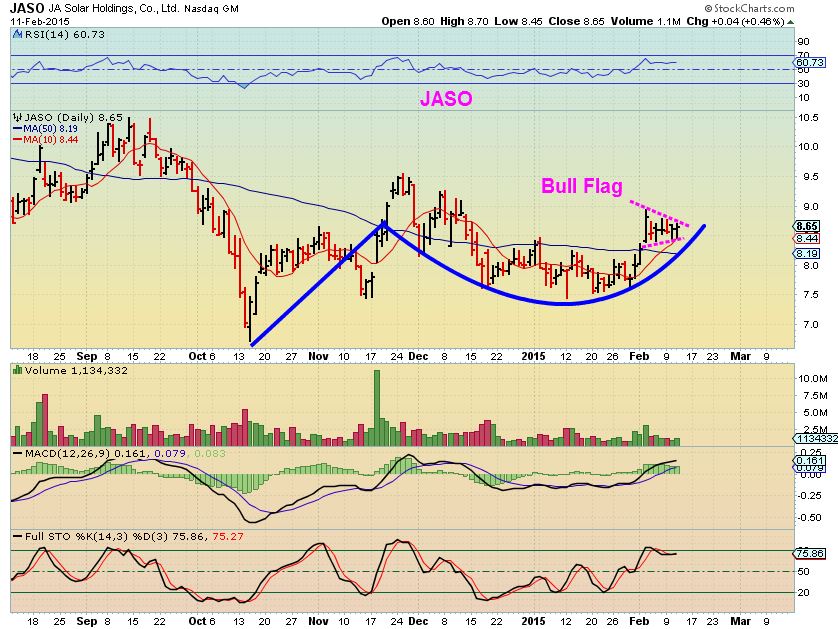
SOLAR STOCKS look to be set up correctly too. I pointed this out already (chart below), lets see if there has been any progress?
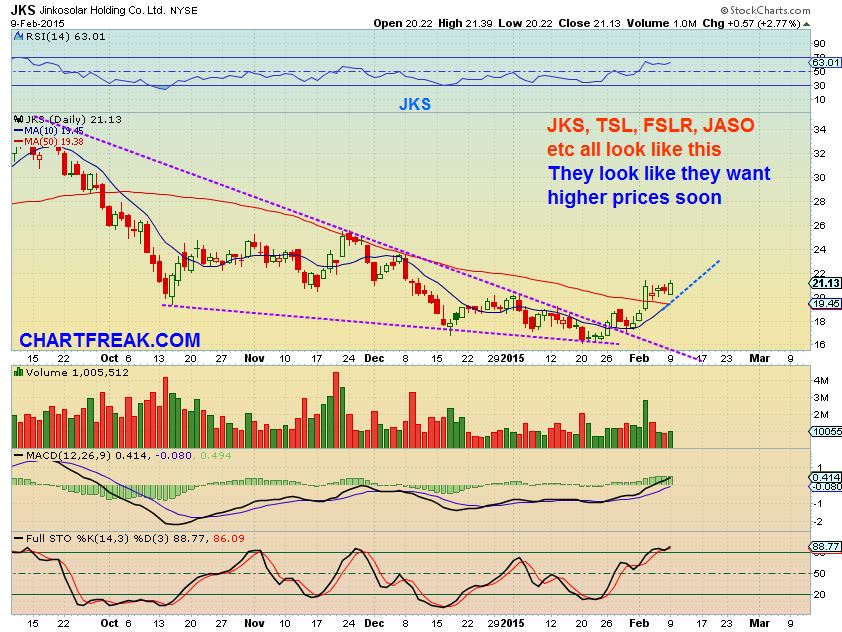
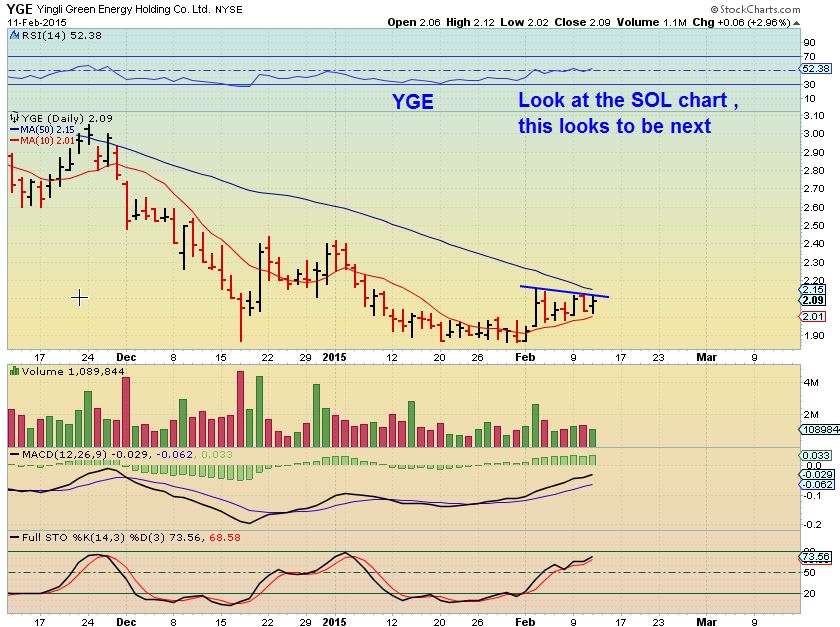
JASO / YGE / and SOL – these can be bought here before they break out
YGE – I’d buy it
SOL IS A BUY HERE
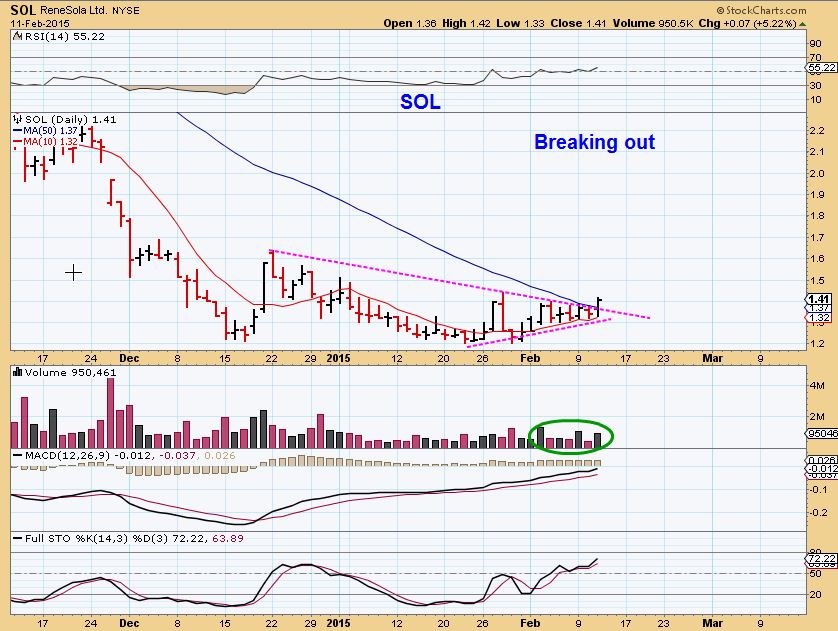
So there are many set ups that look BULLISH to me. There is risk in ANY trade you take, and especially during a bottoming process you can get volatility. The ENERGY stocks can be accumulated in my opinion, SOLAR STOCKS are a buy here , and you need to put your stop underneath support in the form of moving averages that they have bounced off of or trend-line support like the bottom magenta line on the above SOL stock , for example. I believe we may be very close to another run up in ENERGY, SOLAR STOCKS , Clean energy , And possibly Miners. I do not know what kind of a rally will unfold from the miners, so I am more cautious in this 3rd daily cycle.
Therefore ENTER MINERS AT YOUR OWN RISK, but the trade may be a good % -Gainer for 5 – 8 trading days. Another draw back if GOLD puts it’s reversal in & runs higher is that the U.S. Mkts are closed Monday, GOLD trades Sunday night onward, So trades in the Metal or Miners may miss a good day of Gold Gains in that limited time to trade them.
ENERGY & SOLARS look to be a buy yesterday or right now , others that didnt reverse may follow today. Yes there is always possible volatility near lows , but I expect another run higher. You didnt miss it yesterday, though buying a reversal is what I like to do for a low risk entry. You may wish to Wait for NADL, SFY, GDP, etc for their reversal? Or just look at the above charts of BAS, SD, HK, REXX, EXXI . They havent taken off with out us, they reversed at support so far and look to be acting correctly . They look to be set up for higher prices in the coming days /weeks. I wish you profitable trades.
~ALEX
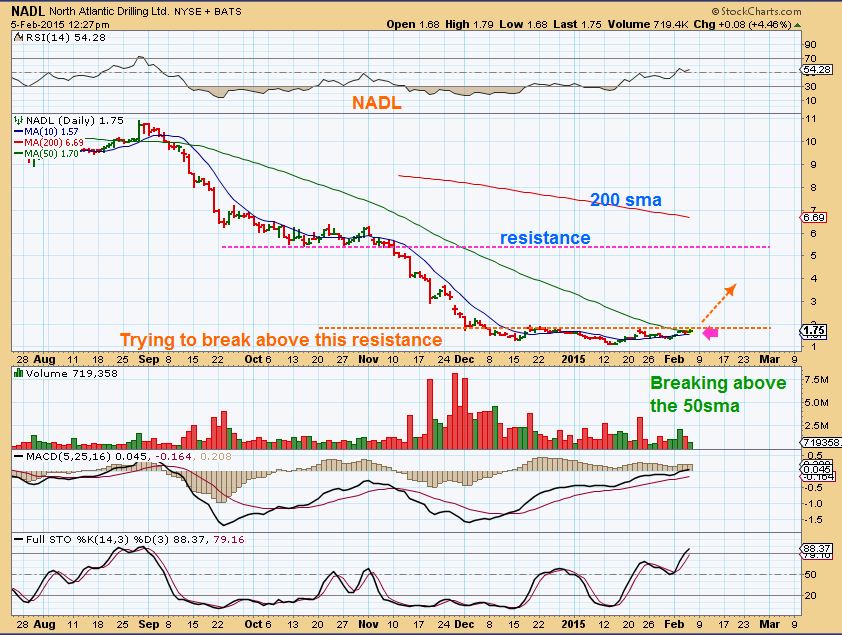
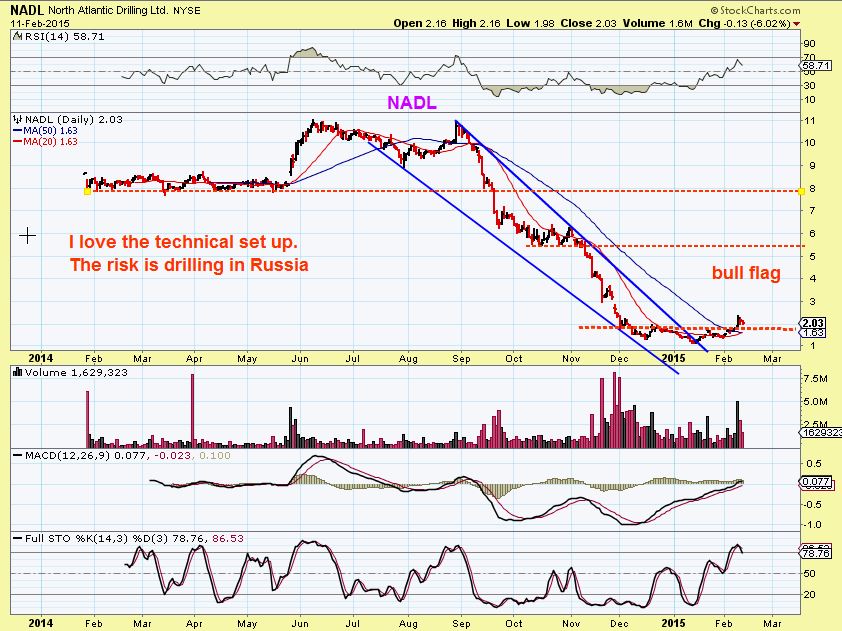
For those that dont mind beaten down / lower priced stocks , I still love the set up on NADL in the chart below and it is apparently bull flagging above $2 here.
NADL reminder
Buy The Dip? 
 3D Is Popping Out
Scroll to top

great report w/ tons of options.. THANX!! ….. is that a pic of your setup? LOL
Thanks Maria- And THAT? Thats my older , much smaller set up ; ) J/K
lol.. well .. it’s HOT! :o)
Well then…I think you need to get one 😉
oh yes…. it’s on my bucket list ;o)
P.S. as you likely already know, S.T. is lame again today : (
YES…. ive basically ditched it for twitter.
Thanks Alex, I am still with you on EXXI, GDP, BAS, SFY, and NADL. Looking for them to move higher. I took a small stake in UGAZ yesterday, nice gain there. I have some NUGT from Yesterday. Today is crucial to staying in that. I usually don’t stay in a 3x overnight, let alone over the weekend. Good luck Today everyone. Keep up the good work Alex.
Longer term Alex? Im traveling next week with limited trading access. Would you advise against staying in NUGT blindly next week? I think there is more upside now than downside? Stops I guess.
I would be comfortable staying in ENERGY if I was away next week, NUGT is tricky one. I think it’ll be higher next week, but it is a 3x and I cant personally recommend riding it out in a 3rd dcycle.
wow the older, smaller one is quite strong….you rock Alex!
Please can you clarify about the GOLD cycle being left translated.? I don’t quite understand why as if we bounce here – its a higher low right?
Hi Jay,
Yes, what that means is – from the last low to the current low ( And we arent 100% sure that we have the next low) you look at where that cycle of days ‘peaked’. The highest point was day 13 , so a 26 day cycle would have had the peak right in the middle. A Peak at day 20 and a low at 27 would have peaked to the right of center. We peaked on the left side of ‘center’ , and thats IF day 27 was The low. If we did 1 more time and put a low in on day 30, its even more left translated.
It gives the idea that it was weaker and couldnt push to another high point before dropping for days into the low. It lessens the chance of good strength coming out of this low. SO I would expect it to possibly only double top on the 3rd daily cycle. It may not even get that far before rolling over.
Ah got it.
Many Thanks.
Sure, and I meant to say that I included a chart, you may need to refresh to see it, comments load without refreshing.
Alex, is the KITE setup dead?
Not really “Dead” , but it is struggling a bit. It needs babysitting and may flounder around a bit. I almost wonder if its trying to put in a rounding bottom, since it needed to consolidate the big run up it had . Refresh to see the chart.
‘
I wish it hadn’t broken the 50 SMA. Chart looks like it’s trying to bottom, I agree, but yesterday’s 6% positive to negative swing is disappointing.
Yeah, You can see that it did that a week ago too, but the sell off didnt have follow through. Price is currently under the 50sma, so that has to be respected as weakness.
If I was looking at it now I would likely try to be cautious. That would lead me to keep it on a tight leash or maybe sell and either wait for more bullish signs from the sidelines, or find a better looking one
Alex, I can’t overstate how happy I am with your service. After suffering through an extreme account draw down and making all the typical rookie mistakes I am finally making money more consistently. Your charts and comments are clear, concise and actionable. My new behavior is that when price action happens that previously would have spooked me out of positions with a loss, I keep in mind your “what to look for” advice and I don’t panic over short term volatility. So there’s hope for me yet!
Thanks for all you do.
Alan
Well Thank You Alan,
I’m really happy that you are getting better results (And especially the less spooked out part). We’ve all been there and I’m just trying to show everyone what I’ve learned along the way . I learned mostly from trial and error, so dont feel discouraged about past mistakes. Thats why I always do try to say “What I’m looking for” when I think a pull back is coming. I want readers to know they are normal & may be buying opportunities ? They also can be harmful…so we watch for _______. : )
I’m glad the reports are helpful ( Tell all your friends- lol)
lol…such a hustler…
It looks like the gold stocks are not quite ready to run. Volume was really light on this morning’s rally. Maybe we’ll head down to GDX 20 Gold 1200 HUI 180ish. We may need more time in an oversold condition. But I think the next rally will be the real one. Just not quite ready yet.
Hey Carl,
yeah, patients and not trying to jump in on every down day could pay off when the lows finally turn this upward. It may be a good trade if we are careful.
Robert, what do you think of GFI here? Down on earnings today.
Its approaching the 50sma, but it could blow right through it if selling picks up. Just a little too early to tell…it really needs to show us what it wants to do. If it reverses higher, then buyers stepped out after sellers bailed on earnings. If it drops , bounces at noon, and then closes at lows end of day…its going lower I.M.O.
It needs to tell us more
CHECK OUT FXEN ( MENTIONED IN MY REPORT AS A NEW RUNNER)
Wow! missed that one! 44% great call. Give me a different one! LOL
OK, RGSE , YGE and CSUN : ) J/K but the set ups are nice
BTW is this mornings picture Alex central? Nice
Good call on all of them.
Don’t see any news on FXEN? What gives where it pops like that?
Alex: What do you make of NatGas at the moment? when should the longs be really worried?
Today was a NATGAS report and it was bearish. The chart still looks to be bottoming on various time frames though.
As I look at it, I am thinking that it is possibly going to drop down ‘testing’ the recent break out from a technical view point? I just dont think it has to, but thats all the way back down to $2.50 area. ( refresh & see the attached chart) but it needs to hold theat area.
As mentioned by Alex, it has been at the 3rd DC where the PM complex has rolled over and gone on to make new lows. That being said, I have been looking at GDX during the July/Aug topping pattern that eventually broke down, and it seems to me that the stochastics (on the daily) never really got oversold during that sideways pattern. When GDX finally broke down, it therefore broke down hard. Right now, we have a similar consolidation (though shorter) and the stochastics are already approaching oversold levels. To me, that is a notable divergence from the last failed failed 2 DC rally and possibly could allow us to surprise on the upside when the 3rd DC begins. i wouldn’t go adding to positions just yet because it could easily breakdown and fail but it is something to keep an eye on.
I think that’s a terrific point. Many are expecting this thing to fail and make new lows. I’ve read projections anywhere from March to end of year in which new lows will be made. That’s a big spread of opinions. If there are to be new lows, there just doesn’t seem to be enough “juice” to start the process. We’ve been so conditioned to this that we continue to expect yet another breakdown. Maybe so but a good rally out of the blue first seems to be looming instead of a breakdown. Looking to the RSI on GLD to move down to more oversold levels to set the stage. Sudden drop should do it.
New free public post here https://www.chartfreak.com/3d-popping/
LOOK AT THE SOLAR STOCKS THAT I POSTED ABOVE & look them up now. See RGSE, CSUN, SOL, YGE