
WATCHING INTENTLY
My observations in last weeks reports and the weekend report are playing out very well and my recent recommendations in Energy are already up 20 – 40 % . There isn’t much to add, but we are watching how things unfold to try to see whether we have further upside in some sectors, reversals in other sectors , and so on. This helps us to see where our opportunities may arise in the future. To the charts….
I expected a turn down, but wasnt shorting it this time
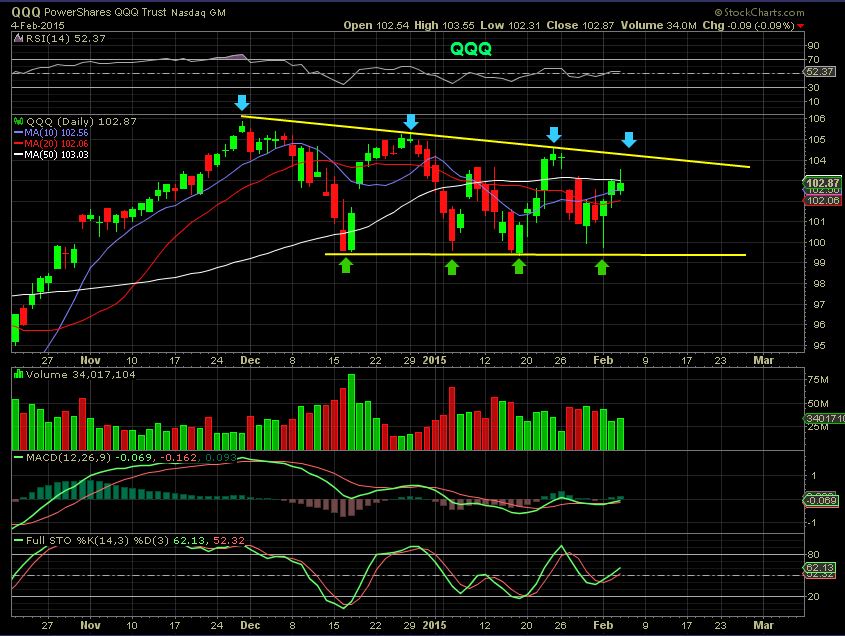
Why wasnt I shorting it this time? …
As mentioned in the weekend report, I thought that the set up may not drop as far this time, since many stocks that were falling apart strengthened.
QQQ- notice the MACD / RSI are showing signs of change. This is why I am just “Watching” this time.
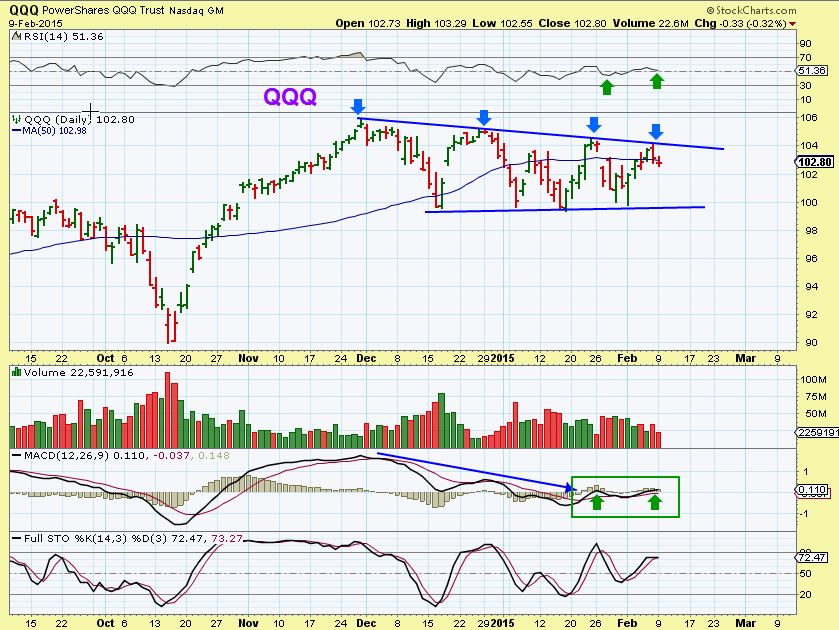
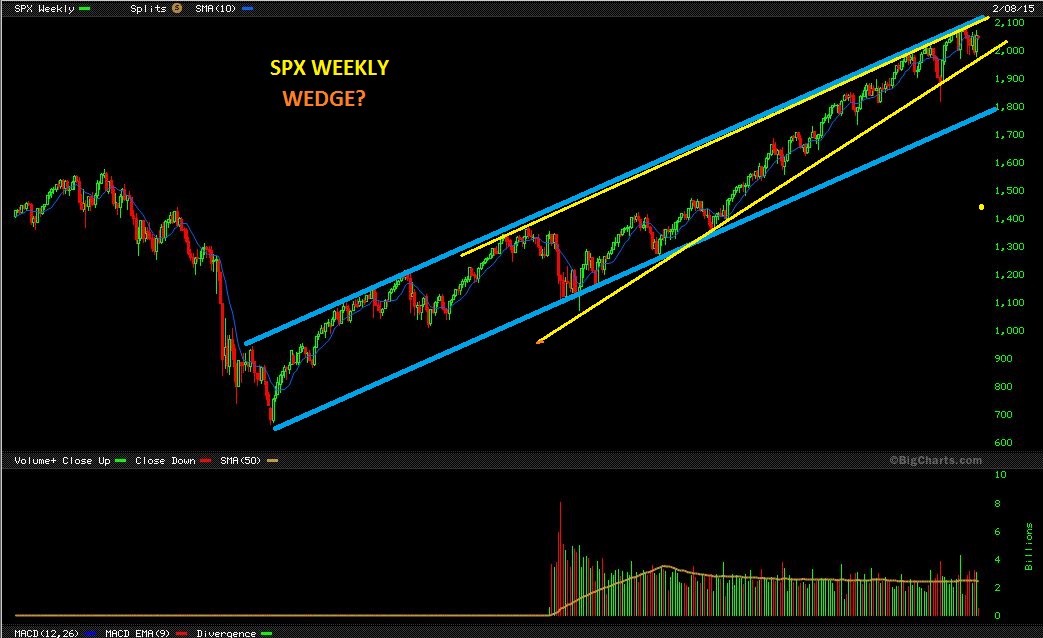
Long-term, I have to wonder about this possible rising wedge ( These are Bearish). I’m “Watching” it.
ENERGY
Also in the weekend report, I am also WATCHING $NATGAS
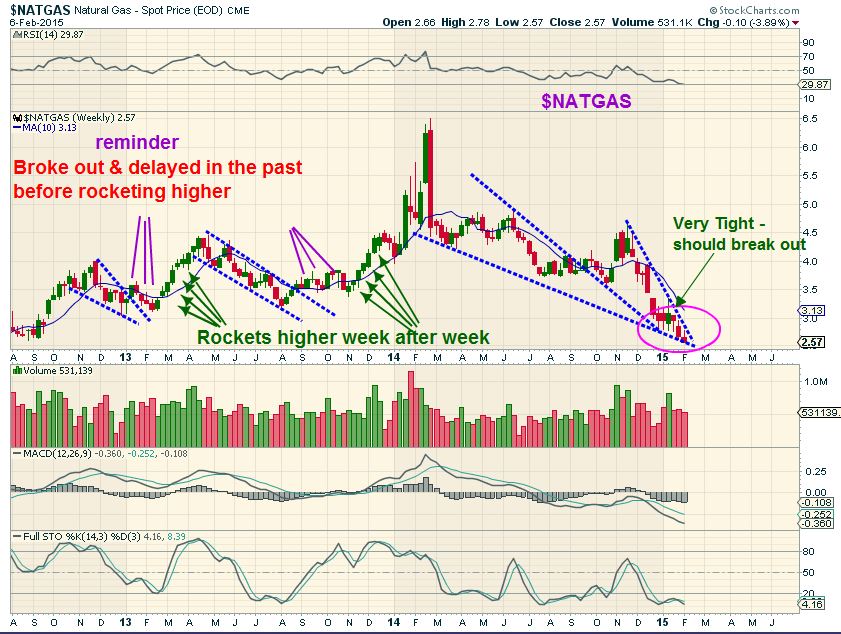
CLOSE UP- I think it wants to break out higher. For the traders here that like to play NATGAS and ask e about it, I think we are going to break out higher soon. $2.70 would have me very interested. The only way I like to play this is UGAZ , but that’s a long 3xETF. I don’t recommend those here, because you can lose the gains you just made on 5 days of energy trades in 10 minutes if this goes against you . UNG can be traded too, but I dont find that it follows NATGAS very well. I will just let each Natgas trader trade it in their own favorite way.
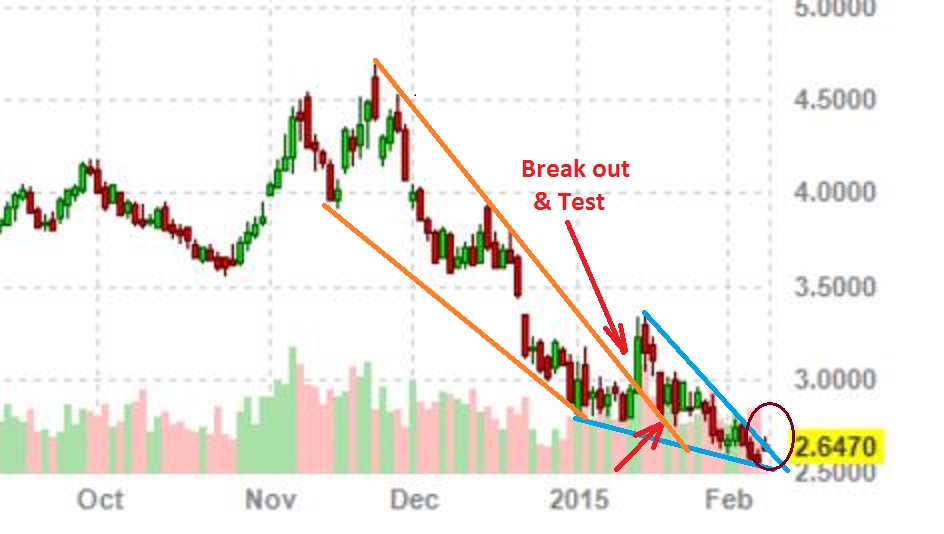
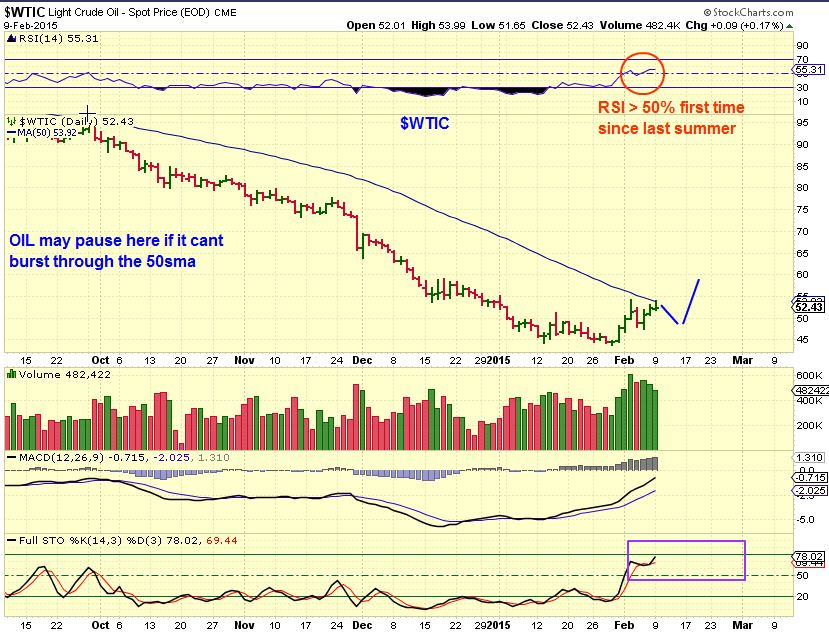
$WTIC – it may stall here ( And CNBC will likely announce hat its dropping to $20’s again ) . I think it may drop & break higher.
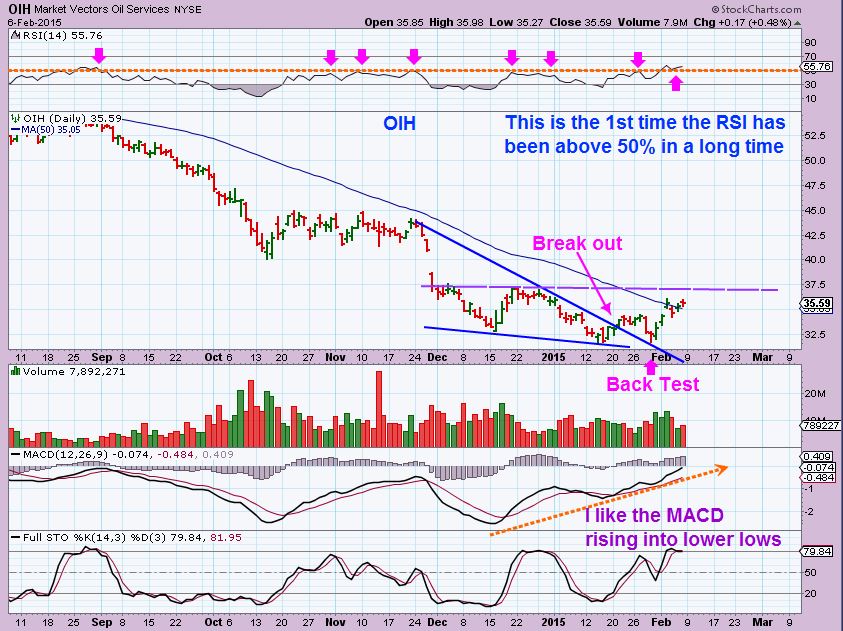
OIH – someone asked me about it this wkend and I drew this up as possible resistance. It hit that area yesterday, may pause?
XLE looks the same as OIH, and it also set to pause / buying volume is drying up
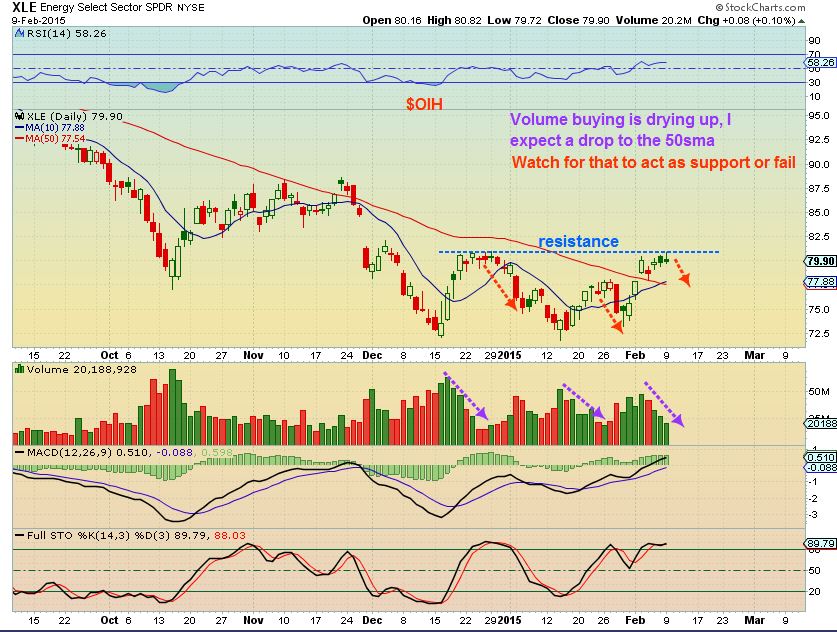
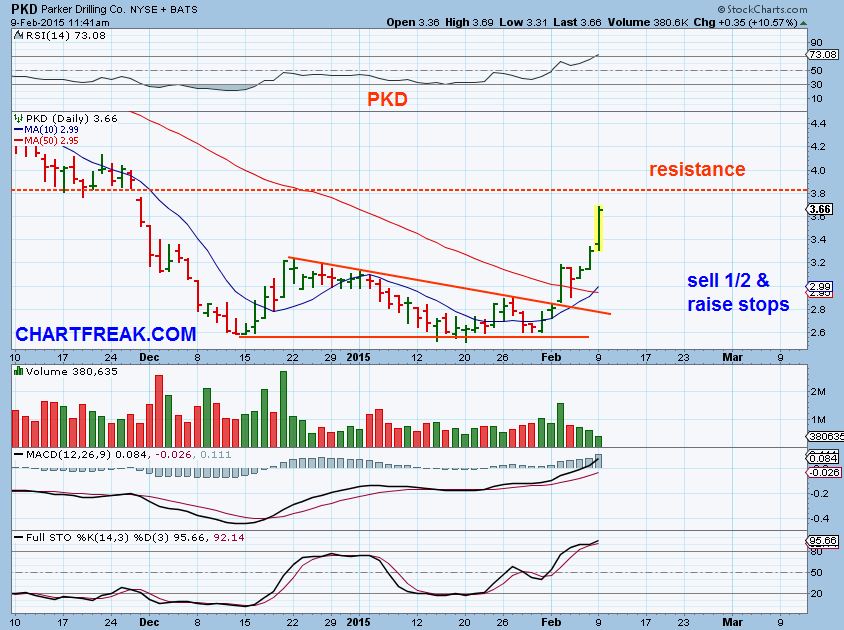
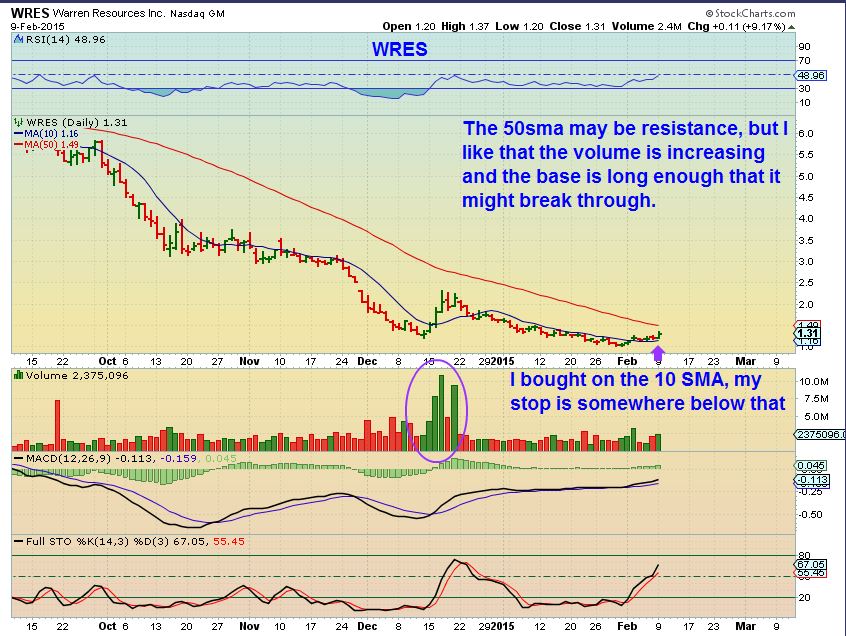
So that means that OIL, OIH, and XLE look ready to rest. Your energy stocks may stall, may pull back ( Possible opportunity for some to buy , others to add. MAYBE- we are watching to see how this sector pulls back). Some may want to sell some of the semi extended positions? I have sold some and rotated into other laggers. That is just what I do as a trader. I bought WRES yesterday , after selling 1/2 my position in ones a little extended like this …
I want you to understand that these are acting like the MINERS did in Dec through January (So far). Some Miners pulled back with Gold, others just ran higher regardless of whether GOLD dropped or not ( remember GFI, CDE, HMY, etc). SO some of these may pullback fast when OIL dips, others may not. Find a target to sell if you are concerned. I have read in the comments that some ‘Lock in gains’ and dont worry about missing the rest of the move. Others ride the ups & Downs and ‘watch’ to see if they are acting correctly. So far they are.
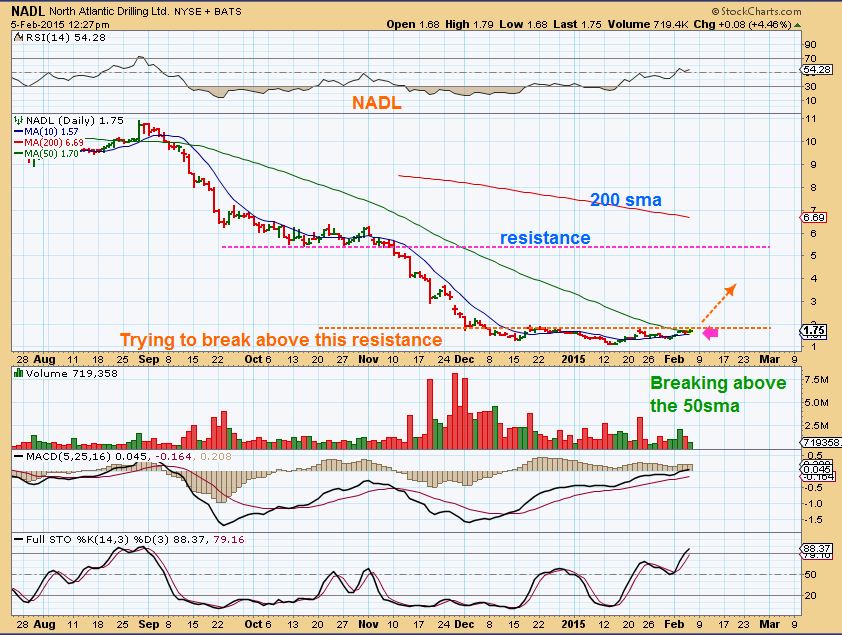
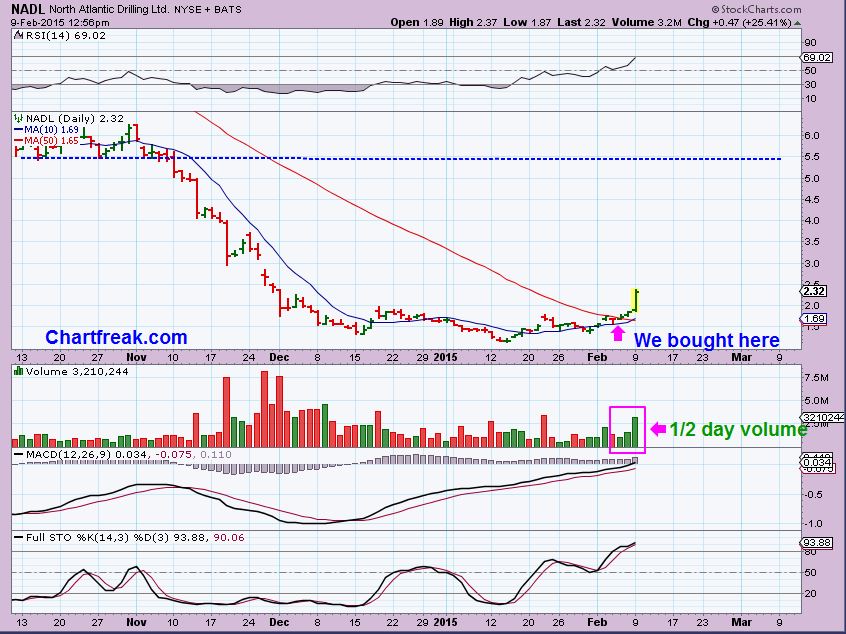
I recommended NADL as a ‘lagger’ near $1.55 , $1.65. This looks like it has a lot of upside if this is the bottom for Energy. I didnt sell this
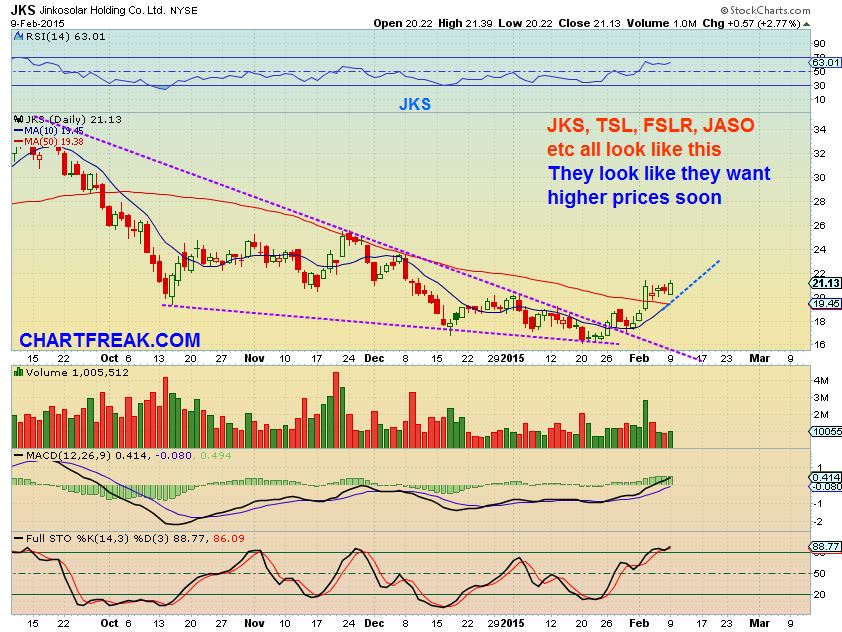
SOLAR stocks look like they are consolidating gains and want to go higher. I pointed out JKS, TSL, FSLR, SCTY, YGE, JASO. Most now look like this , not pulling back much . I will buy if it tags the 50sma, with a stop just below, but it may just go sideways.
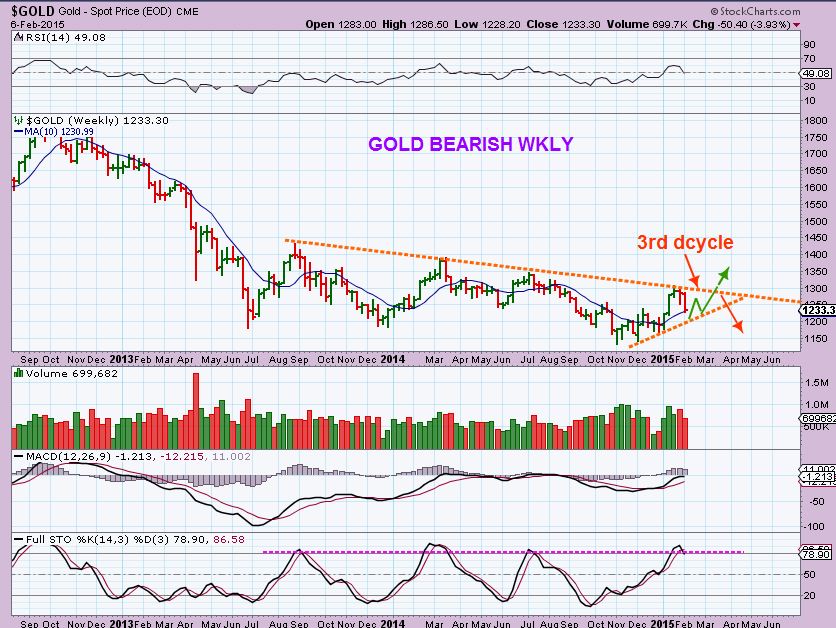
GOLD/ MINERS
– I am out of all MINERS. It doesnt mean that they cant run higher after a daily cycle low in Gold, I just wanted my money in ENERGY last week. I hated selling AG, it looks good. CDE looks excellent, but I dont love the way GOLD & GDX/GDXJ look right now and the money has been used elsewhere. Let me review what I have been ‘watching’ again.
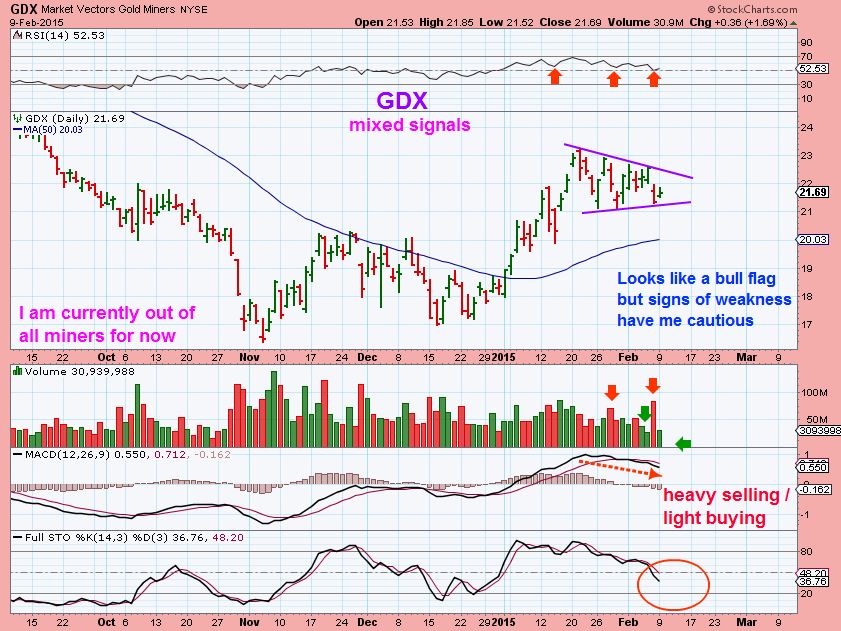
GDX FEB 9 (looks like a bull flag, but can still drop to the 50sma) I mentioned that the last run to the top was light volume and I dont like that. Then it dropped. Watching for now.
NOTHING Has changed with EXK- your stop was the 50sma
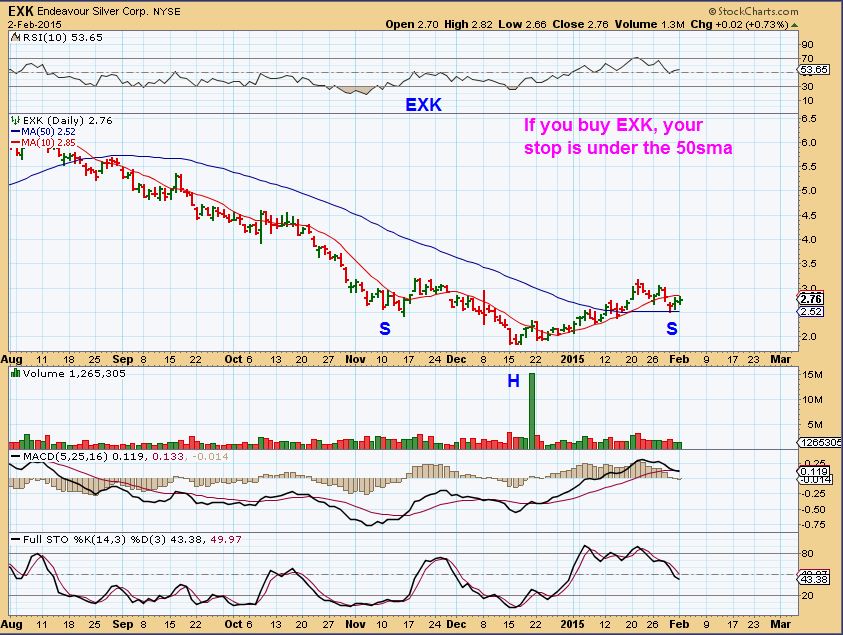
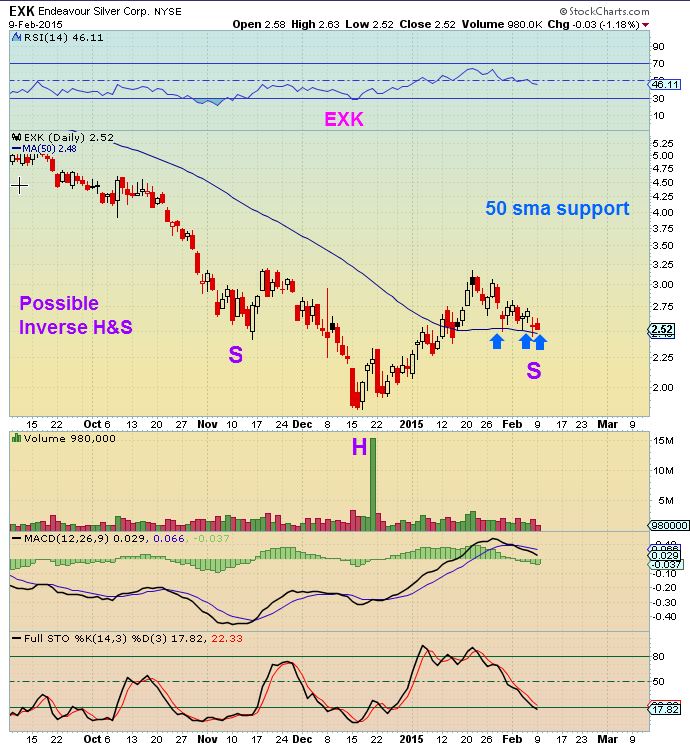
EXK a week later, nothing changed
HOWEVER…
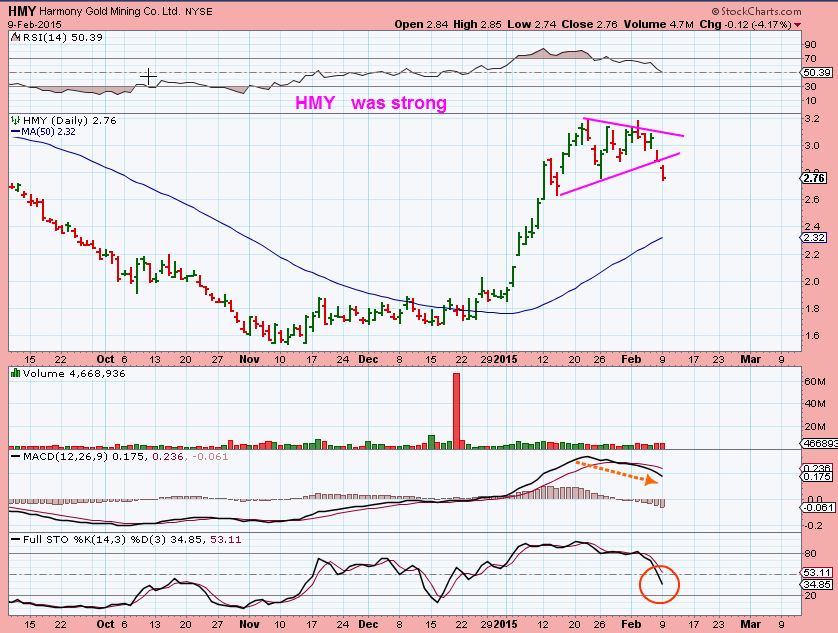
GFI – A strong leader looks like it could drop now. Double top.
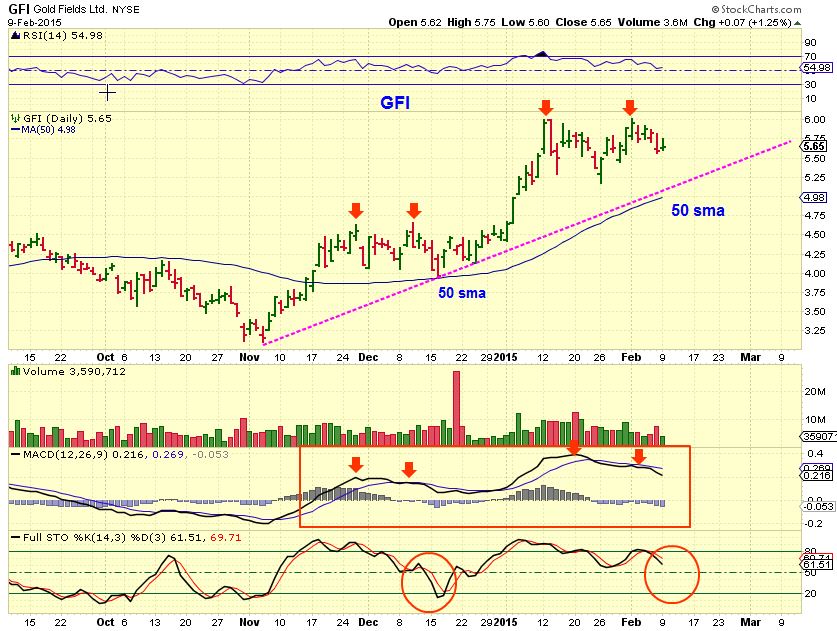
If you think it is too strong to drop? I was ‘watching’ HMY too. Nothing is invincible when time is up.
Doesnt this look like GDX? SO I have been trading out of metals and miners and just watching for now.
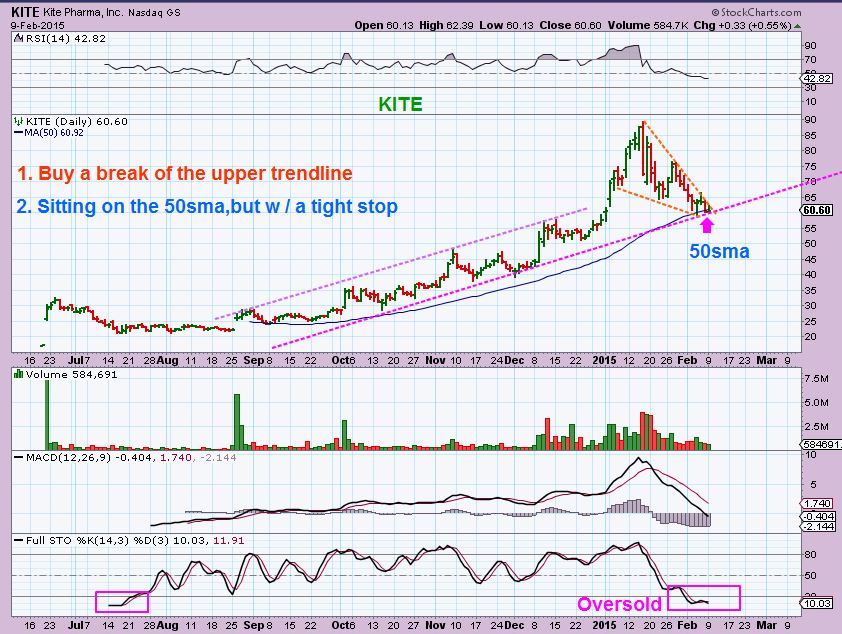
Anyone like to trade big PHARMA? this is a trade opportunity I noticed. STOP out below the 50sma.
KITE
I bought WRES yesterday. I mentioned above that Energy may pullback here (Charts of XLE OIH), but some may act on their own and I bought this as a lagger. It can still be bought here. This chart looked like NADL in some ways.


Wondering If you ever play the short side?
In the past reports, I said I had been playing TZA (thats short), and I’ve mentioned SOXS SDS JDST too.
now I’m Wondering if people read my reports , or just skim the charts : )
Good morning ALEX! OEPS….
Yes….. I know you sometimes talks about resistance and support?
Sell them at the top and buy at the support!.
Even with my broken language I understand you go short?
G-Morning Geurt
Yes, I have in the past at the tops on that QQQ chart, but this time I didnt because it seems a little less weak , so I am just watching a lot of things .
lol
Yeah, I was just being funny.
Alex, although we are getting a pull back this morning, I wanted to thank you for getting me into Energy. I probably wouldn’t have noticed if it wasn’t for your postings. I am up pretty good in BAS, SFY, NADL, EXXI. Now, where to set the stops?
You mentioned big pharma. I love that sector as a safe bet, but I am never sure when to get in. Love NVO and BIIB. You;ll have to let us know when they set up.
I am looking at the 10sma as a possible target for this pullback in energy. If a stock blew righ through the 50sma, it may just land back on that. like Miners, some will drop faster, others may drop , get bought back , etc etc until a sideways move gets the moving averages higher.
Energy Stocks seem to be rebounding now, somewhere around the 50sma on the hourly charts. 🙂
I took some partial profits on some the the energy stocks yesterday (good thing)….Looking to add on a pullback….normally I would add on a bounce off the 10ma, but some of them (sfy,nadl ect.) are so stretched above the 10ma, I don’t think they will be pulling back so far. What will you be looking at to add?
Thanks
Second this request. Just your thoughts when you think its appropriate.
Hi Mark,
I thought I answered Harrys question above , the 10sma or the 50sma supporting and a reversal , what is the question?
You did. My post crossed with yours. Watching….Oh. I know you prefer UGAZ (because I read your posts:)) but are you watching/interested in any NG stocks?
Funny : ) I used to trade XCO & UPL. Havent for a long time.
I will copy paste my comment to Bill below , its a good question : )
I am looking at the 10sma as a possible target for this pullback in
energy. If a stock blew right through the 50sma, it may just land back
on that. like Miners, some will drop faster, others may drop , get
bought back , etc etc until a sideways move gets the moving averages
higher.
Good report Alex. I’m also watching NADL along with EXXI and GDP.
Here is an example of something encouraging:
I like REXX off of the 50sma and bounced. I would like to see many of these do that to their moving averages, or go sideways and allow the 10sma to catch up.
http://www.chartfreak.com/wp-content/uploads/sites/18/2015/02/NAT.jpg
Alex is this the UGAZ charts?
That is actually NATGAS itself .
What I understand UGAZ is similar ALEX ???
UGAZ is 3x ETF. It moves like lightning in the direction that natgas moves, so faster gauns, faster losses…please be careful .
UGAZ broked 2.70 nicely. Do you have any targets for this one?
Hi Arigee
Honestly, 3x ETFs move far & fast It could really fly, but I dont have targets for 3x ETFs ,
NATGAS is really oversold , and even if it just does a simple bounce? UGAZ could pop to $4 easily.
Let me just add this: I rode JNUG from $13 to $40 last year and NEVER had that high of a target for it, though I knew GDX/GDXJ would run nicely. NATGAS is breaking from a pattern where it could eventually run nicely.
Thanx Alex! What Ive learned in 1.5 months trading, JNUG and UGAZ can be really tricky. Bought some WRES today with tight stop, and wondering would EXK be worth a try, if golds daily cycle low is soon in? Also holding some UGAZ from friday and GDP.
EXK looks interesting.
It lost the 50sma today and recovered (so far) . That could be a mini shake out ( I would have had my stop there below the 50 sma, so I would have been stopped out).
You could buy this recovery at the end of the day to make sure that it holds. Or you could just buy it as a recovery of the 50sma and then realize that you may get stopped out if it sells off again at the end of the day.
Another good thing is the volume is really light in EXK’s sell off. Bad thing? If the cycle low is not in, you may get another break below tomorrow & may be stopped out.
Alex, you mentioned big Pharma. Looks like NVO is a good low risk entry on the HR chart (below), but still has room on the Daily. How do you decide when to get in? How does NVO look to you?
Hmmm, I dont understand why its so gappy? Is it a foreign stock and the gaps are just currency differences? Sorry Bill, but I honestly dont like this chart, its not normal to me.
That said, I think the low risk entry was yesterdays reversal. From here I cant tell if it’ll gap fill or go higher. The weekly chart is at lows, but it looks like it could break down too ( the MACD momentum is bad and it’s under the weekly m.a.’s
If you buy it, put a stop in $42, there’s no support to the left.
KITE is the low risk entry to me , broke the 50sma and re-gained it.
When you say the MACD is bad? You mean because the trend is down? Looks to me like its turning up? Just asking so I can learn.
Hi Bill
Sorry- maybe I I wasnt clear…I was mentioning the Weekly chart, because before I buy I want to look at all angles. We are looking at different time frames.
I was looking at a weekly and it has lower highs, maybe H&S type move? The Weekly MACD is down and so to me it looks like you could get a move from $42 to $44, but risky (At this point, but it may improve).
Hey Alex,
Lets say you purchase a stock at the 9 dma which is above the 20 and 50 dma,
do you value the 50 dma over the 20 dma as to where to place a potential Stop ?
Thanks in advance 🙂
Hi Ken
I wish I could see it, to know if they are rather grouped together after forming a base (Like some energy stocks) ? Or are they really spread apart after a strong run up?
And If it is trending higher for months ,you could just use the common point that it seems to dip to.
If you want to ask in tomorrows comments with the stock ticker, I’d be more helpful.
I think it’s ok, but also depends on where one bought it. It looks fine over all though.
Hi Alex….. one short question how looks EXXI ?
I still own it. Thank-you!!!
I think it’s ok, but also depends on where one bought it. It looks fine over all though.
Yeah, I got stopped out of most of the rest of miner positions this morning – GDX from Friday and SAND which went net/net nowhere in a month. Gold looks broken to me but do you make anything of SSRI being up against SLV and also notice that sell volume was low today? Maybe people are just losing interest in the sector as it flounders?
Did the one thing I was worried about with energy – late to the party. Gotta be the only person who has actually lost money in that sector in past week or two. Stopped out on BAS early. Still have GDP, if stays above 20 may add? Or was the dip to 3.0 this morning the add? Issue with some of this is that the drop to 50 sma could be 15% – no thank you on that ride! Will look to repurchase BAS if it comes back to there, if it takes off will have to do it without me. WTI hit upper BB on daily yesterday, may hit some serious resistance for a few days.
Miners have a better look today ( yes, light volume dropping now ).
Energy pullback may not last long, but they acted well even though some down 10% or so…they ran up pretty well.
GDP might be another buy if pullback to 2.80 where 10/20 have converged, I think. Long consolidations in miners after an uptrend have always ended ver badly for the past few years.
Notice even with the markets at top of range, not far from all time highs, the VIX remains elevated as compared to 2013, 2014.