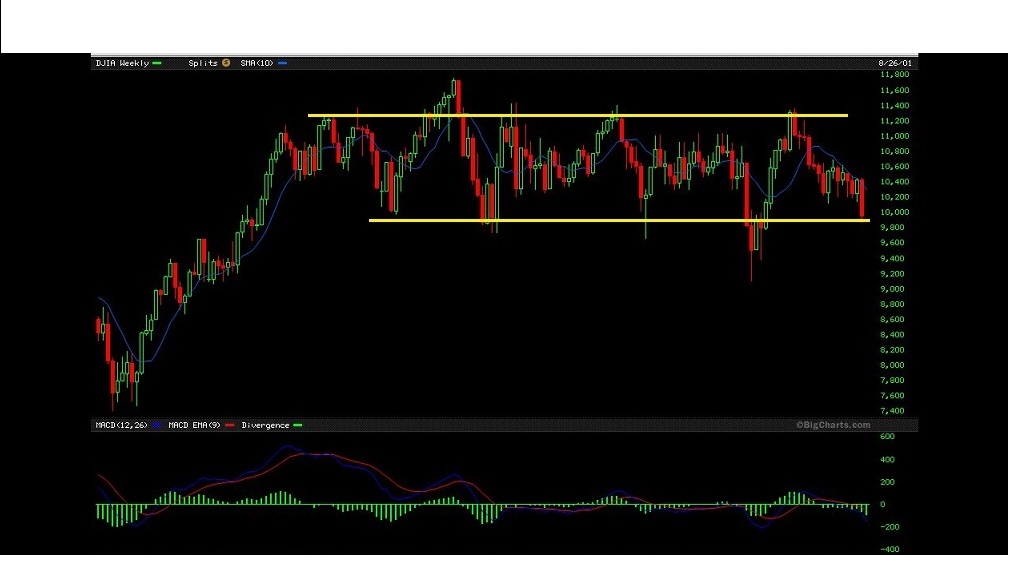
Answer: Frustrating ! Actually its an example of a trading range. Often after a stock or index Price has run higher , you get a sideways consolidation that is called a trading range. They can form as flags, wedges, channels, etc. It can be a trading opportunity on one hand, buy the lows & sell the top/ flip and short the top , ride down to the lows. If you aren’t an active trader, however, and you are just waiting for some directional move, a nice trend to ride? It can be a little frustrating. Its tough to tell which way it will break, and the chart above actually looks like it may break higher. The chart below is the end result of the chart above.
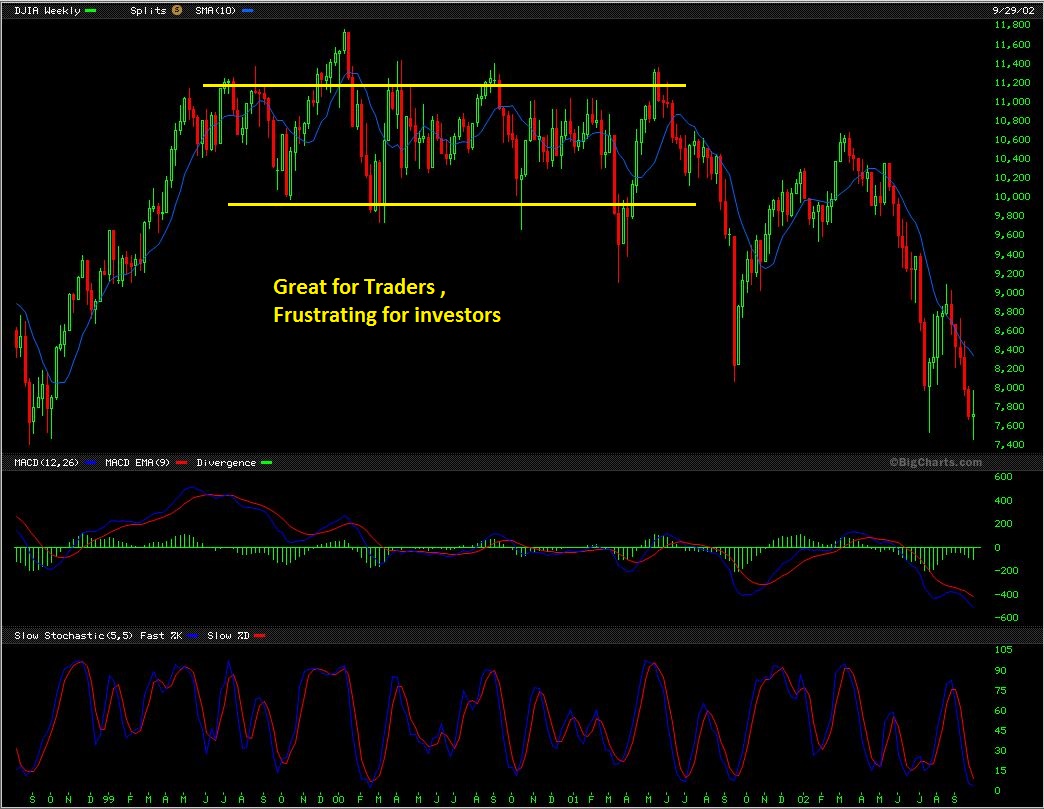
The reason that I bring this up is because our markets are currently in a consolidation too…
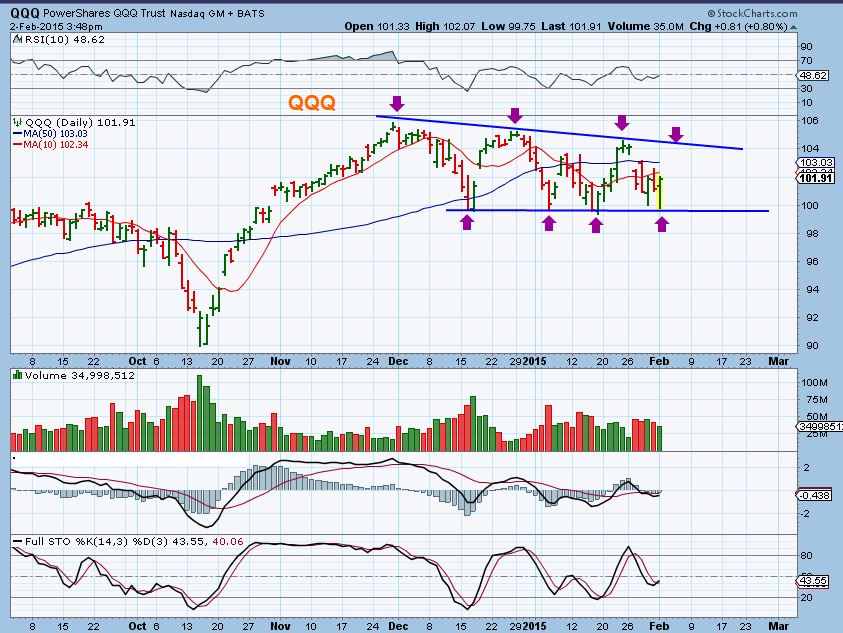
This is the NASDAQ represented by the QQQ’s. It too is range bound and yesterday put in another reversal.
SPX – that is a reversal candle
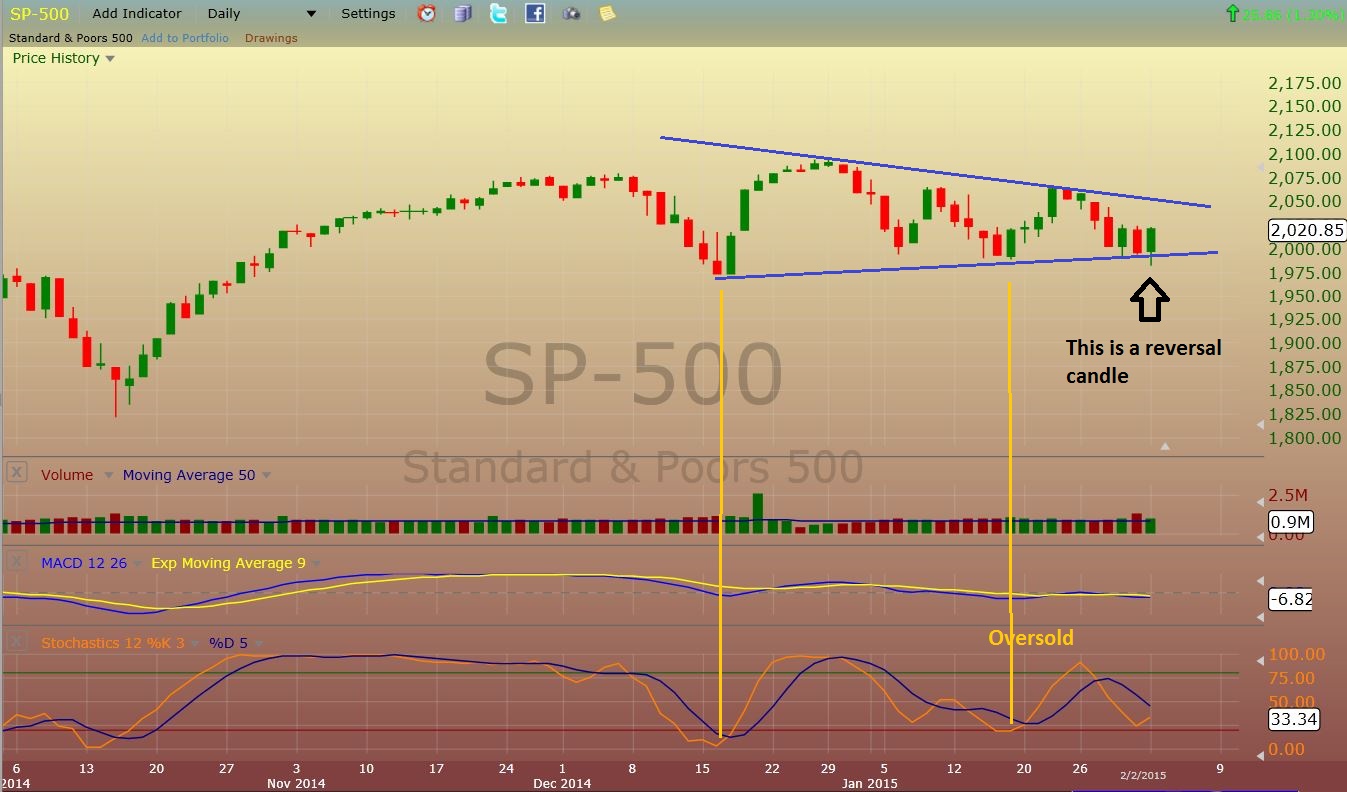
You can see how a trader would trade this. Buy the reversal lows, sell at the top, go short at the top and ride it down , etc etc until it finally breaks in one direction or the other. I have been doing this with 1/2 my position in TZA, but have held the other 1/2 through out , thinking that we were going to break down one of these time.( See the wkend report for my discussion on TZA, TECS, SDS, etc)
This is TZA- broke out higher and gave it up (reversal)
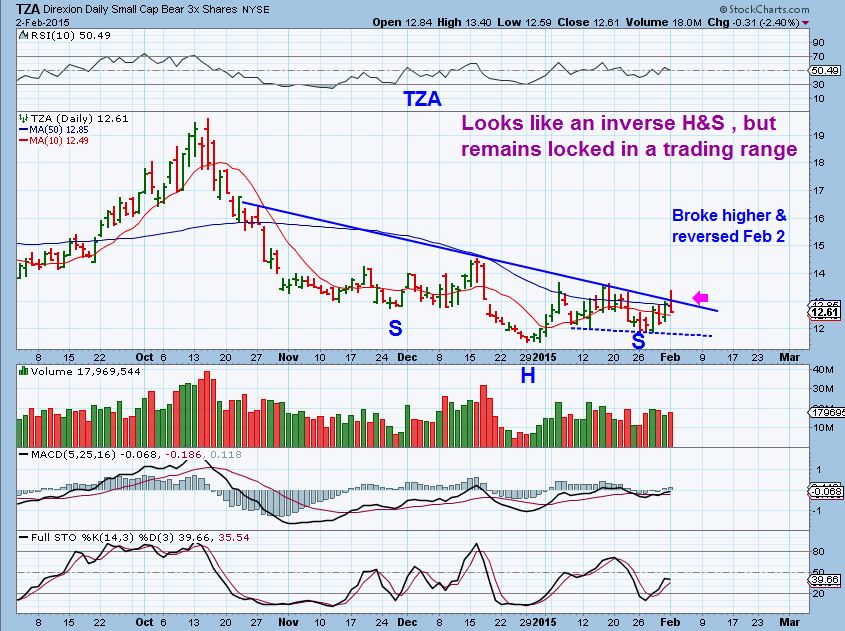
Thinking that the markets want to test the high volume lows in Oct and also seeing weakness, I have traded TZA. I know some have also purchased it, but I dont know if they did so wanting to hold as a trade just inside the trading range? Or buy looking for QQQ to drop to Oct lows? At this point , we have a reversal and follow though may be back to the top of the range (Where it risks breaking out higher ). You could sell TZA because of that reversal and watch the QQQ as it approaches the 50sma. It has been rejected there and that is the area where I have added TZA.
With the reversal yesterday right at the lows (no break down) it is likely that price ( see the chart above of the QQQ) is heading to the 50sma or the top of that trading range. I know this can be frustrating for non-traders who want to see these markets either break out higher or break down lower….but we trade what the markets give us. They are still in a trading range.
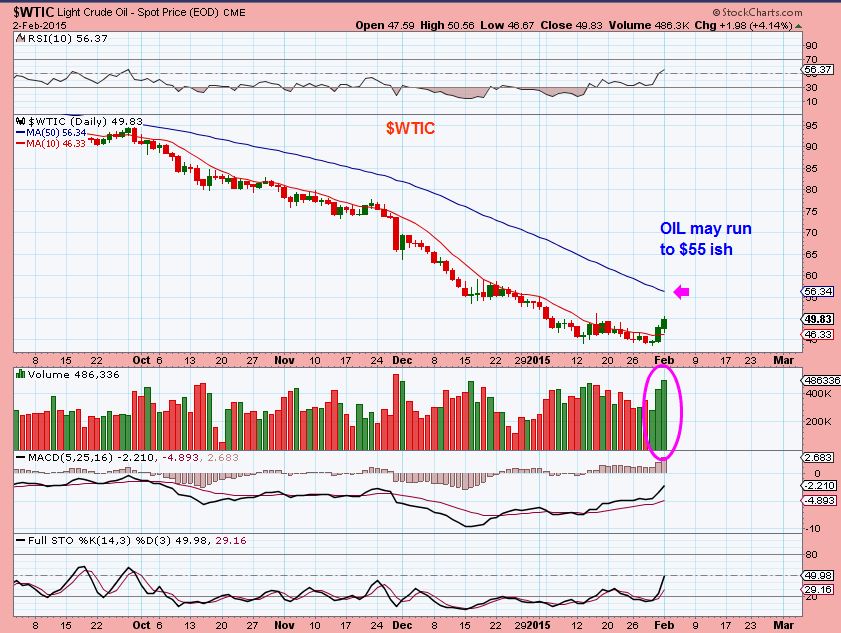
OIL
I pointed out this weekend that OIL broke out, looked legitimate and now the energy stocks that we saw had double bottomed may start to run. I showed a chart of NEM and pointed out how the miners had a similar shake out as these energy stocks seemed to have just done . The shake out worked, They shook me out & I sold all of my energy positions for small gains, and they are now higher.
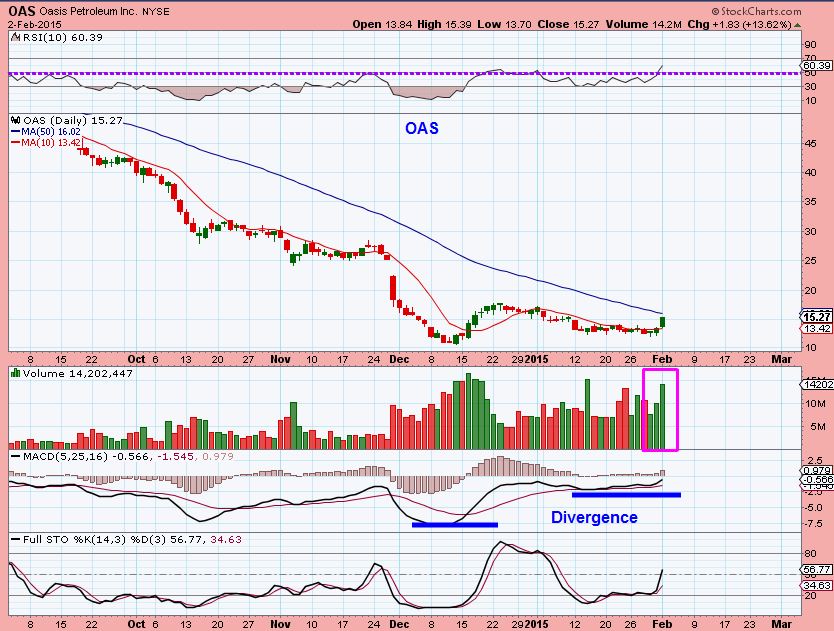
OAS is an energy stock that looks like the Miners did in Dec/Jan. Double bottom, great volume. MACD divergence, and so on. I am watching how they approach their 50sma
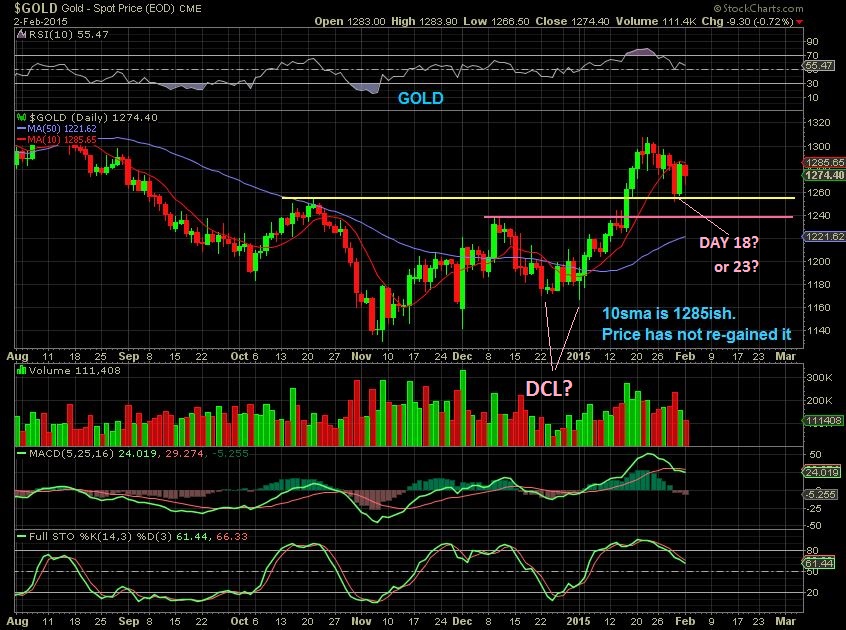
GOLD – Hasnt re-gained the 10sma. Held support. Cycle count a little unknown , could have put in a DCL, could be too early.
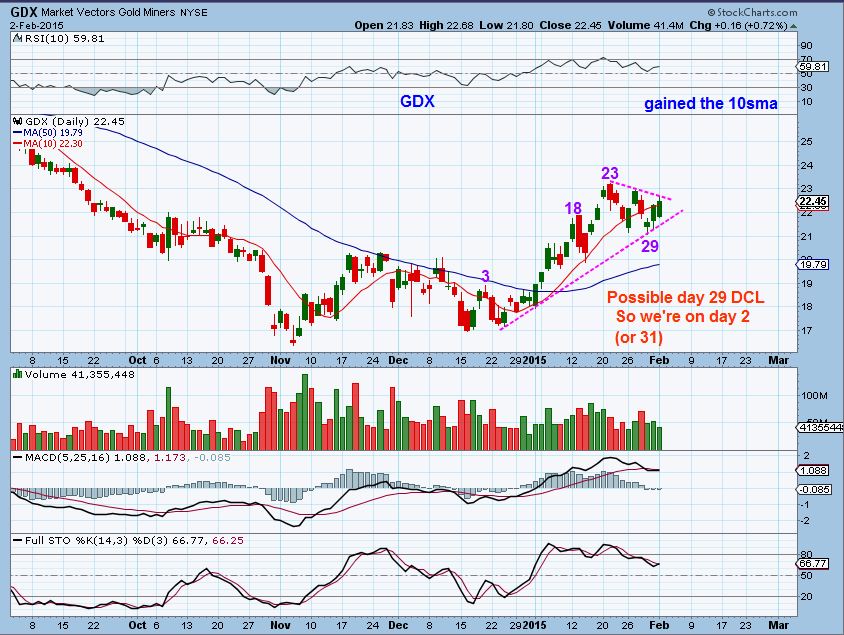
GDX – Miners later in their cycle. was a low already put in? Possibly on day 2 of a new cycle, or very late in the 2nd daily cycle. GDX re-gained the 10sma yesterday, see if it holds and can break from the possible bull flag, or drops to a DCL day 33 ,34 ?
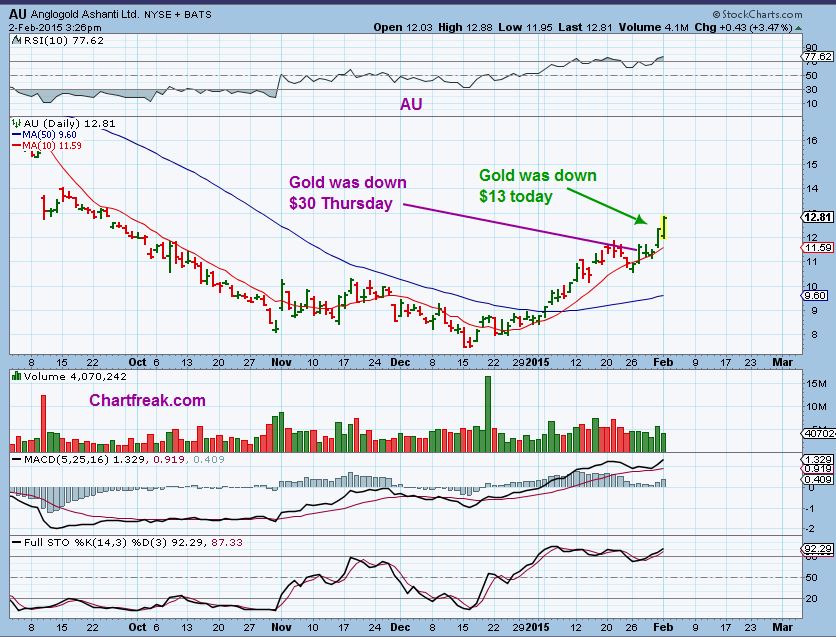
With the above questionable count in cycles, the positive is that many Miner are holding up & still look like Bullish set ups . They were pointed out in the weekend report. I like when more than just 1 Miner is acting bullish when the gold count is hazy. To see Bullish looking charts , see AU ( below) , AG, CDE , GFI, HMY ,NG , GG, NEM, ABX, and more. I like the way they are acting.
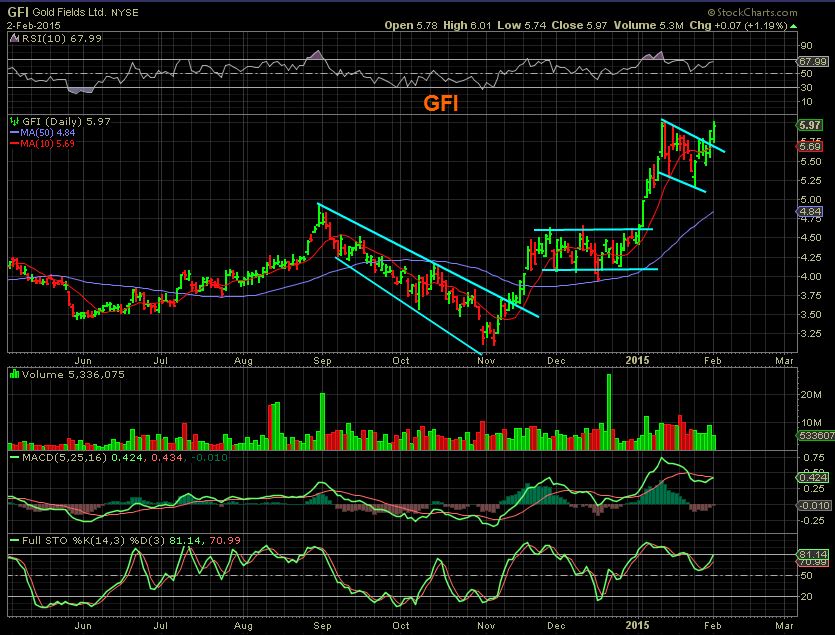
GFI – at highs
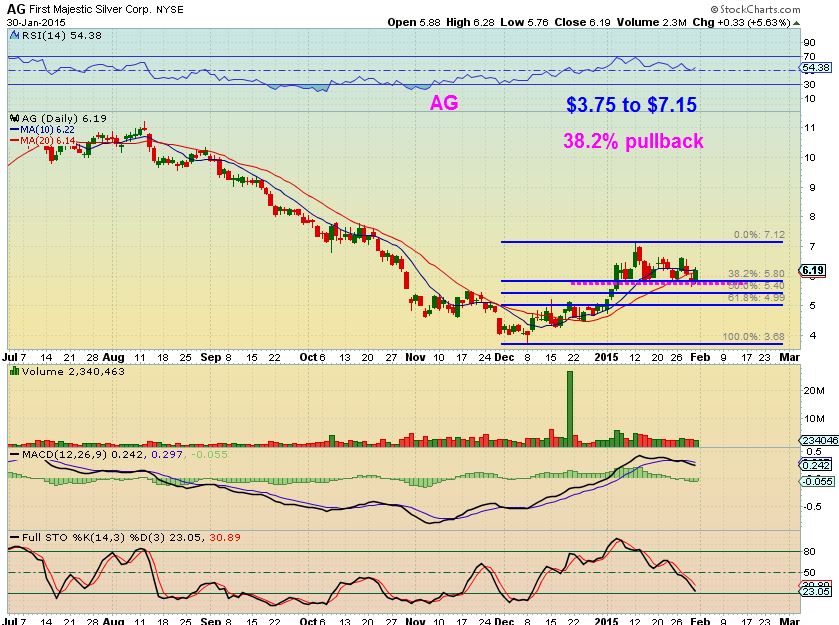
Its hard for me to recommend buying Miners when we arent sure of cycle counts, but if you are in front of a screen or holding a core that you purchased lower, I would be comfortable holding until we see signs of weakness. I am comfortable adding too. I actually added to AG on it’s dip and have purchased NUGT on dips, but I am in front of a screen all day. I see bullish set ups so far, but they also are consolidating and some arent comfortable with any down side. If thats the case , but you want to buy …you need to buy the dips. Buy at lows if we have a pullback. I pointed this out on AG to show that it has held up . Just a 38.2% re-trace.
Wrapping it up. I am buying MIners and have been since the possible Daily Cycle low. I CANNOT be sure that we wont get another dip. I cannot be sure that that was a daily cycle low. If you are buying and cannot be in front of a screen, buy at an area where you can place stops & you’ll have to honor them.
I think ENERGY plays are materializing , we had pretty much perfect entries in my energy report, but unfortunately I think most of us took profit or got stopped out. I would have been stopped out if I didnt sell on the day that I was going to my parents house to help them shovel out from the storm. I couldnt watch it and felt more comfortable “Out”. That reversal in OIL was strong and they recovered quickly. Short covering can move things fast.
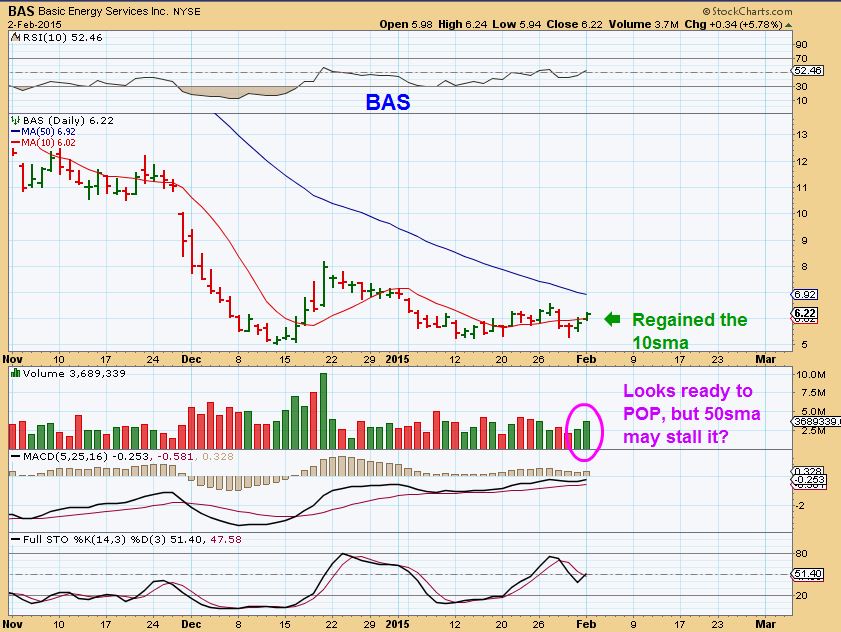
EX…this was how I felt about BAS and I had owned it . JAN 28. ( THAT is what the miners did too, as shown when I pointed out NEM. Shake out type move).
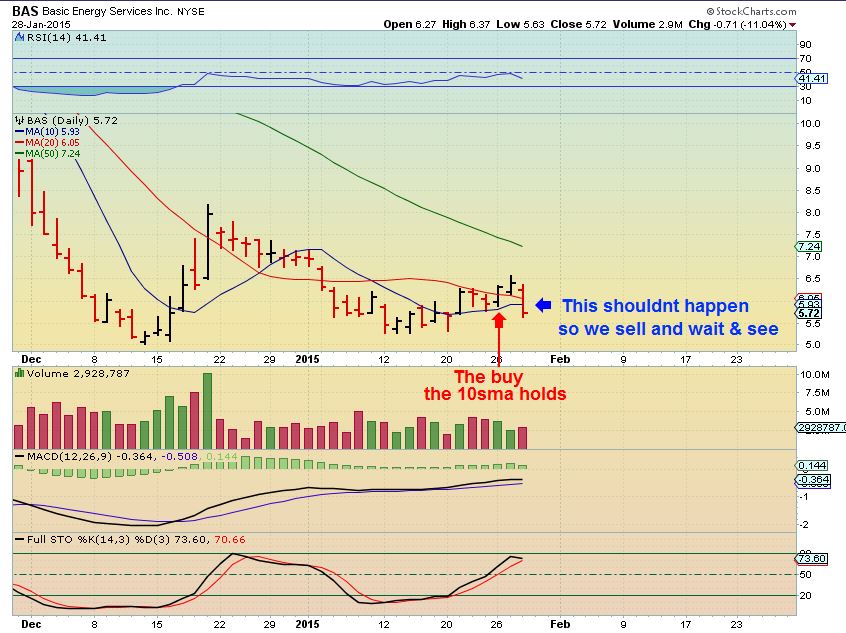
BAS Feb 2 – That down day is hardly seen already. This now looks like a buy set up right here, but the 50sma may stop it from running.
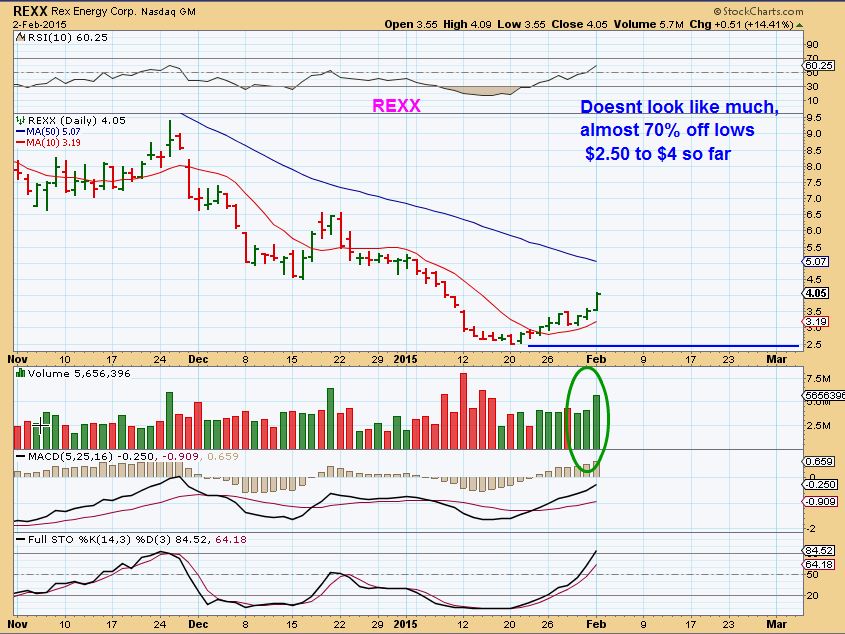
REXX – nice run
SO I am again watching energy. Was that a LOW in oil? will it double bottom? If so, will these energy stocks that have already double bottomed just run to the 50sma and coil along under them, building steam for a break higher? I will be watching for that. Some are currently trade-able if you are a trader.
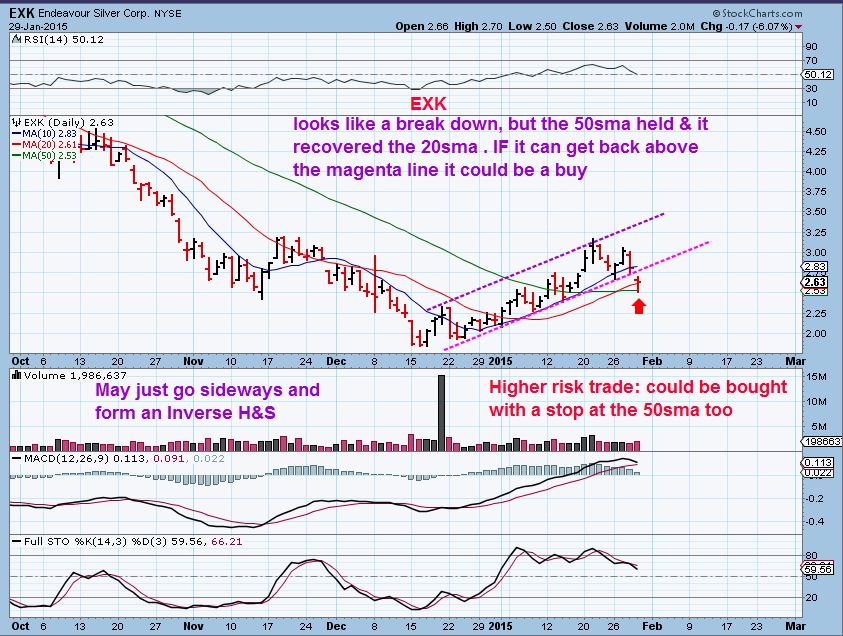
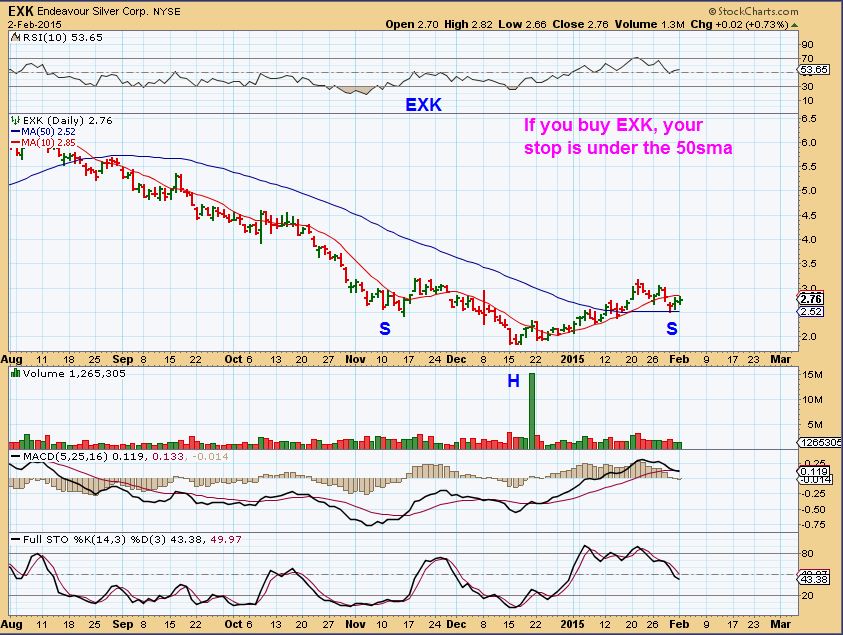
Some MINERS are trade able too. I pointed out EXK here Jan 29. Buy above the magenta lower trend line, stop at the 50sma I mentioned that it may go sideways and form an inverse H&S
This is now – forming an inverse H&S?
So for now, the market is set up for traders. Its trickier than normal , because the moves are volatile, but there are Trades in Energy, Trades in Miners, and Trades in that consolidation that looks to want to break down, but so far is just building steam dropping and popping. That is what the markets seem to be offering . If you are able to be in front of a screen you have an advantage. If not and you want to buy something, please use stops . There are many trading opportunities. If we pullback in METALS/MINERS/ Or ENERGY today I will include some in my morning report. Thanks for being here!
~ALEX
P.S. When I started writing GOLD was up at $1282, it has since sold off to red at $1267. Thats why the market is for traders, but todays selling MAY offer an opportunity in you favorite Miner. Is it dropping to the 20sma? Is volume Light? Better yet, is it rising while GOLD is dropping? Is it holding support? (AU , GFI, AG , NG and a few others have been).
QUITE A BATTLE GOING ON 
 TRADE IDEAS
Scroll to top
hello alex ,i just dont understand why gld is droping along with dollar
Hello Dumani –
Sometimes they run opposite and at other times they don’t. They havent been as inversely correlated lately as at other times. The Dollar has run up to new highs in Jan and Gold ran up too.
still stuck in AUMN i guess bad luck for me ,since november ,there many other good picks but stubborn am i :/
1260 is the key i think if it breaks im in jdst and dust til late march /april for the gold to shine again
sorry for the grammer ,english second language ,iam from Croatia
You’re easily understood and trust me, your English is better than my Croatian ! ; )
hahha tnx for the chart and a kind words 🙂 maybe its time to switch to ugaz or some oil ticker .OAS has alredy gone away haha 🙁
I dont want to give a false hope, but AUMN may be ok. It might be forming a rounding bottom. IT is a type of base . Any bad news could cause a break down, but it can climb up the right side if it has good news
There is also a tiny open Gap at the lows.
My apologies to WISHFULTHINKING (Forgot to address your question in the report)
When you buy a 3xetf and it drops – as you know – it drops fast and can steal your gains quickly. IF you catch it in a sideways move, even if GDX goes sideways for 2 weeks and ends at the same price , NUGT will not, it will decay and end lower.
The key is, if you catch it in an uptrend, you get 3x the move up and so then a small sideways move costs you some of your gains, but since you made 3x on the way up, it just costs decay, then if you get another leg higher, it exaggerates that move higher and your gains multiply a lot again.
The point is… If I catch an ICL or 2nd DCL ( those lows that launch a rally higher for about 2 weeks) – I will buy & hold a 3xETF and the gains can be great. I trade it here and there, but I have ridden JNUG from $13 to $40 in a few weeks.
I cannot recommend it here because JNUG for example can move 20% in one day in either direction. If I recommend it and it drops one day 20% , stops people out , then runs higher 20% , then 15% the next 2 days? Some people can not remain unemotional when that happens and I’ve seen all kinds of reactions to that. Over trading to get it back. Afraid to enter great set ups , simply because they got burned. Not honoring stops because they’re down 40% and need to make some back on a bounce (that doesnt come for a week), etc
Options and 3x ETF’s are not for everyone.
Morning Alex, I’m still holding my energy stocks, they are coming back. Hopefully I’ll make something off them shortly. Wish I held AG, but hey, stops are there for a reason. GDX not looking good here. Might trade some DUST today.
Hi Bill,
I think many of the energy stocks have nice looking set ups and of course many are already extended for me to enter. GREAT moves in SD, EXXI, AXAS, and so many others.
I have been looking for some that have not made the move yet ( GDP , but I’ll wait) and found SFY acting interestingly. Cant break above the 20sma yet… Hasnt moved , but strong volume in the first hr. I drew this chart of its base earlier.
( GDX doesnt look too bad to me..use 20sma)
Alex, when I say GDX doesn’t look good, I’m looking at shorter time frame (2hr). Looks to me like it wants to go lower to the $21 level before bouncing higher. Probably one more day to work it out. Then we still have to resolve the lower highs and lows?
Many many miners now have perfect set-ups. For anyone wanting to participate in a third cycle, now is the time to enter imo. Stops are right there, risk is low. I’m quite long and also quite short Canadian financials, and the S&P. We’ll see how it shakes out. No guarantees. Great work Alex!
Hey SIMONSAYS
I agree , was just watching the GDX bounce & reverse off of the 20sma. Could stop out below that. GDXJ looks like this . On a daily I thought it might tag the 50sma again, but this trend line held so far.
Two beautiful charts in addition to all those you have mentioned are MAX and PLG (both TSX). Folks will want to be careful though due to low volume.
Thanks ( yand I agree- , too light of volume is difficult to get out of if it sells down quickly).
Hey Alex! I’m wondering whether we have a date with GLD 118-119 and GDX 20 after all? GDXJ punched below its neckline this morning and is being shorted I would guess. I still don’t think that trade works out so well. Stocks like EXK GFI AG look fine so far as they move down on low volume. RIC is running into resistance from 2006-10 at 4ish. But, once overcome…. But, look at BIB (biotech) the one shining star in the market is down. The technicals look very suspect.
BIB makes BIS look interesting : )
GDX could go to the $20 , thats where 50sma will be. If it does, I dont know where GDXJ goes since it already tagged the 50sma. I do see many miners holding up nicely, so just watching for now.
Lots of interesting things going on in the mkts today.
One a bright note, the energy stocks are working nicely. I’m in the black on EXXI and BAS. Waiting for GDP to get there, should be soon. Do you think we should sell here. BAS looks like its up against the upper trend line (2 hr chart) and EXXI may have already hit it. Thoughts???
I was watching them as they approach the 50sma overhead. Some hit and turned back down, others burst right through. (See charts below) It leads me to believe that ones with double bottom MAY be ready for a nice run.
I may be buying the pullbacks
Alex, when the stocks blow right thru the 50dma do they usually tend to test the 50dma? or keep running? I know there are no guarantees but just wanted to get your opinion based on experience. Thx!
They will often test that 50sma, but it can be quite a while later, and this also can give the 50sma time to rise higher, so the test comes higher.
I also have seen price run up to the 50…crawl along it for a few days and then burst higher.
See AG, GFI HMY for NON-TESTED 50sma – so in ENERGY the same could happen
Alex, so you’re not buying anything energy today? Major breakout on the sector, especially GDP as it looks like a big reversal on it. Thoughts?
Hi CS
Not sure if you read further down comments. Bought SFY shortly after I posted that chart. It dropped to break even but had high volume on the surge up. Also GDP and a few other laggers . Not buying the very extended ones until a pullback .
Thank you Alex.
I will have a list of laggers tomorrow that look to be set up to possibly join in and follow ( charts are SFY, GDP, TPLM, and a few tohers, but I want to see how they close too).
I for one loaded the boat on energy when Alex recommended. I put in stop losses with tons of room. I still got hit out on a couple positions but overall best trade in year for me so far, thanks Alex! Been too focused on miners myself, and there seems to be alot of headwind in that sector. I have been so beaten up by miners I cannot bring myself to add to energy….
Hey Mike, excellent.
I re-read my article this morning dealing with energy. I bought and sold most when they reversed and I had to leave for the day . I couldnt risk a strong sell off while I was away. I am happy that you were able to stick with it, some of these are up 10 to 20 % day after day : ) Congrats!!
Alex,
You mentioned you’re looking to add to energy on a pull back. What would be a solid entry target price for BAS?
Hi Curtis,
Its tricky because it depends on your risk reward. Because it is breaking above the 50sma, If I owned it, this might be my second buy. Sometimes they get a flurry of short covering and can run well above the 50sma
Here is the problem…My stop would have to allow it to swing as widely as it is moving and below the 10sma is quite a ways down. If you wanted to buy a pullback, you have to wait for it to finish the move up to know your pullback target.
The overhead gap “COULD” get filled. WOW. there is no way of knowing at this point. You also could buy at the end of day if it CLOSES above the 50 and keep a tighter stop below.
I trade on the fly, so I just do any of the above and watch it . Sorry if that wasnt all that helpful.
Alex, did you catch that big move up in NUGT and then the big move down? Wow. I caught some of the smaller intraday moves but not the big ones.
Alex, any thoughts on X?
To me , I’d wait for a pullback.