So Much Going On, It’s Hard To Know Where To Start – Dizzying!
I’ve started this report a few times and there is so much going on, that I found it difficult to explain everything that I see, so I’m just going to cut to the chase and try to show basically what I am observing in various markets and what the possible implications could be. Lets start again with the general markets. SPX, QQQ, DJIA in JANUARY are still unfolding as I thought they would way back when I posted this in DEC. I saw weakness increasing

Our expected sideways consolidation continues before a directional move takes hold. We look for weakness or signs of strength going forward, to see if this is going to resume as bullish or bearish (short?) Here is what I’m seeing…
Audio available below ( Right click/ Open in new tab/ Find “Download’ click it then u get the option to ‘save‘ or ‘open’. Click “open“ – when it plays return here)
http://www.screencast.com/t/oxwCzxa6lUO5
I still see continued weakness -and now I am starting to see possible signs of weakness growing in what I thought could be our next leaders ( IWC, IWM, RUT. ONLY IBB remains in the very strong category . IBB is Bio tech.) .
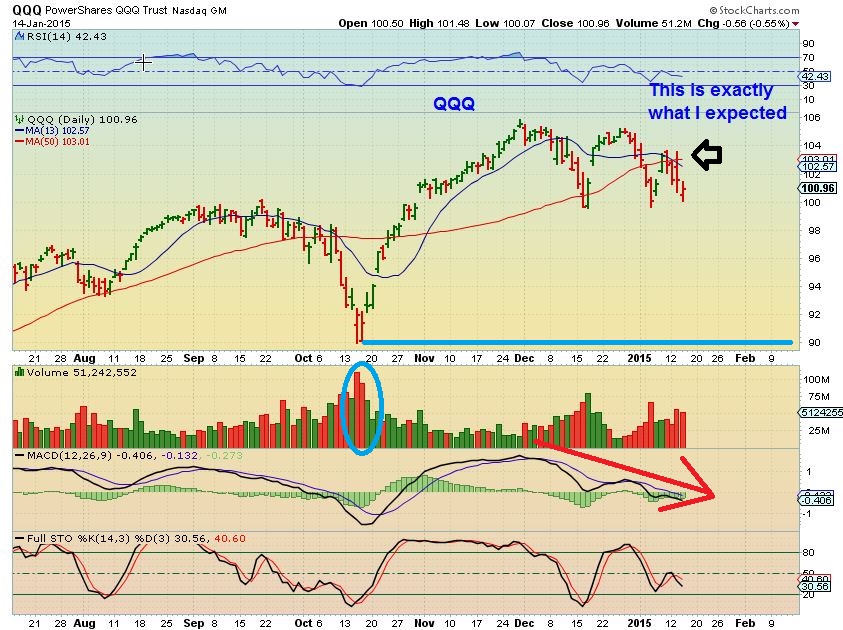
I’ll just use QQQ Jan 14 to remind readers that I THINK we may be pushing these lows to drop to the Oct lows and test that High volume area. I am thinking that shorting ( some would use puts, others TZA for NASDAQ , SDS for SPX , etc ) when these markets keep tagging the 50sma & reversing may pay off soon. Right now we keep pushing sideways
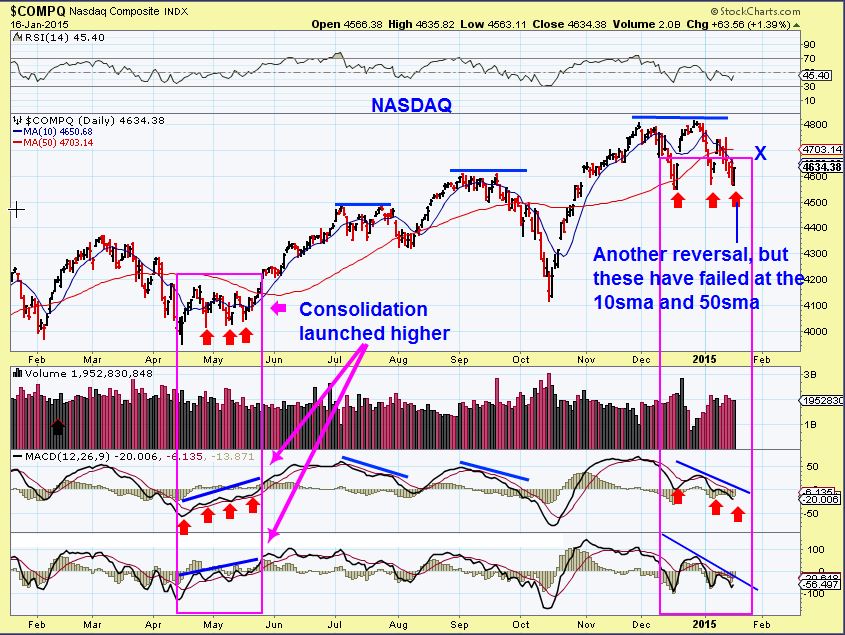
This is NASDAQ Friday Jan 16, It has put in another “reversal’ which gives BULLS hope.
I want to point out that in MAY – that sideways bouncing around looked Bullish in my indicators. Todays is showing “Failing” strength.
Watch for Tuesday to bounce to the 50sma and fail, if you are a traders that will go short, I think that’s a safe entry .
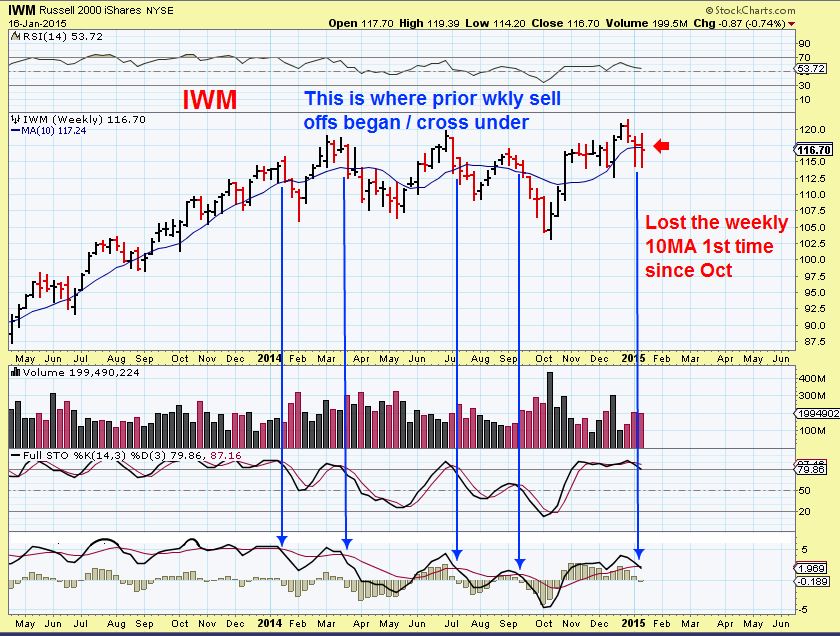
Now IWM daily. This has been holding up & looking ok as I’ve mentioned . Reversal is good. It still doesn’t look outwardly bad or weak here, but it IS below the 50sma . (No real biggie, but…)
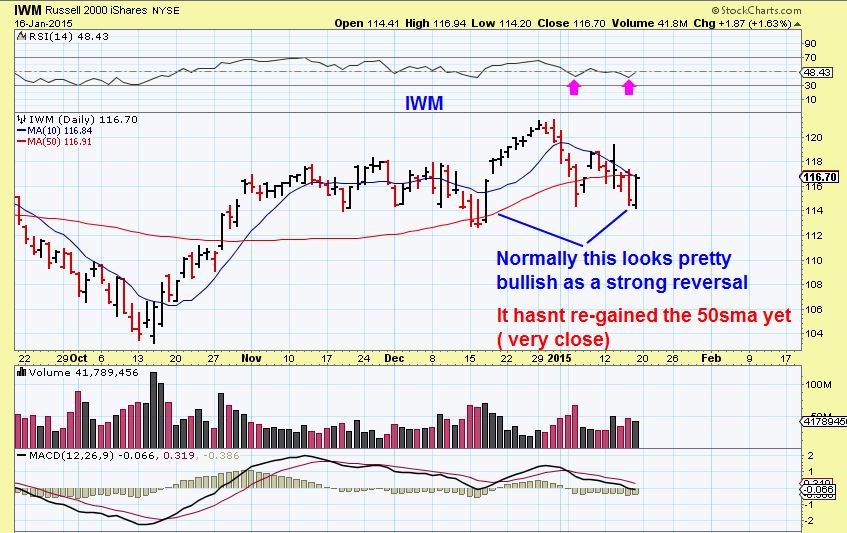
IWM weekly – It is showing signs of pre-sell off when my indicator crosses. In my opinion, it needs to rally now , this is weakening & is overbought.
So to me, The markets (At this point) look more like a shorting candidate than buy the dips. Is this year going to be very different? Time will tell, right now it’s too early to know. Please remember that SPX sold off last Jan and GOLD rallied. Neither lasted….Stay Frosty!!
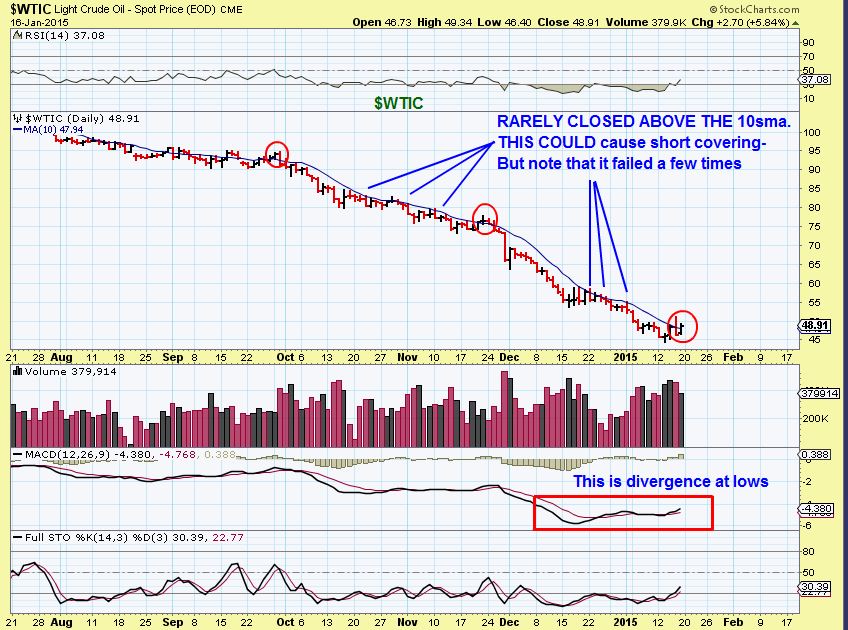
OIL
Dont go by me, But I actually think OIL may finally be ready for a small rally / bounce. ( Today – MONDAY Oil dropped back below the 10sma shown here, but this divergence may have me take a small long position). HIGH RISK – TRADERS IN FRONT OF A SCREEN ONLY (UCO UWTI are dangerous – honor stops)
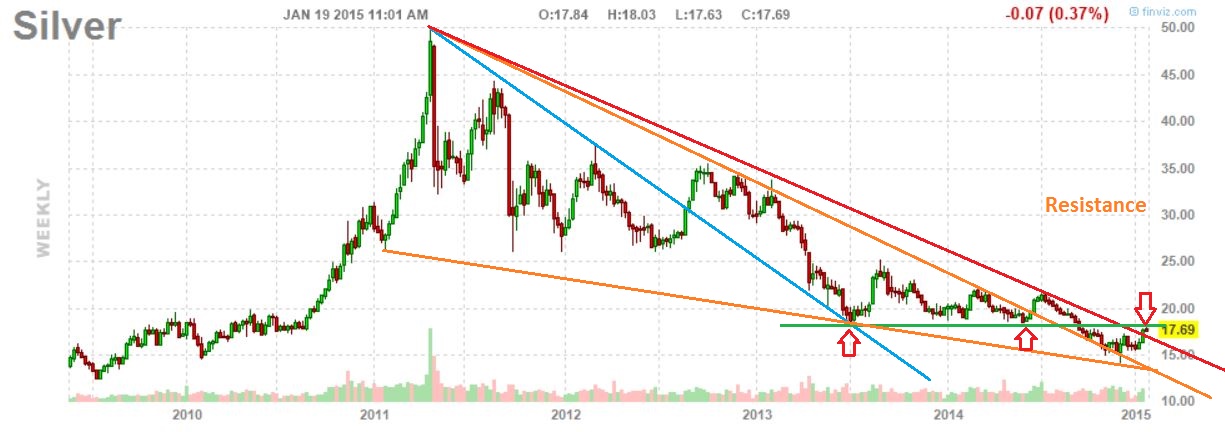
GOLD / SILVER & MINERS
SILVER has done well, I expected the recent POP ( see chart below) , we are now nearing overhead resistance again ( below X)
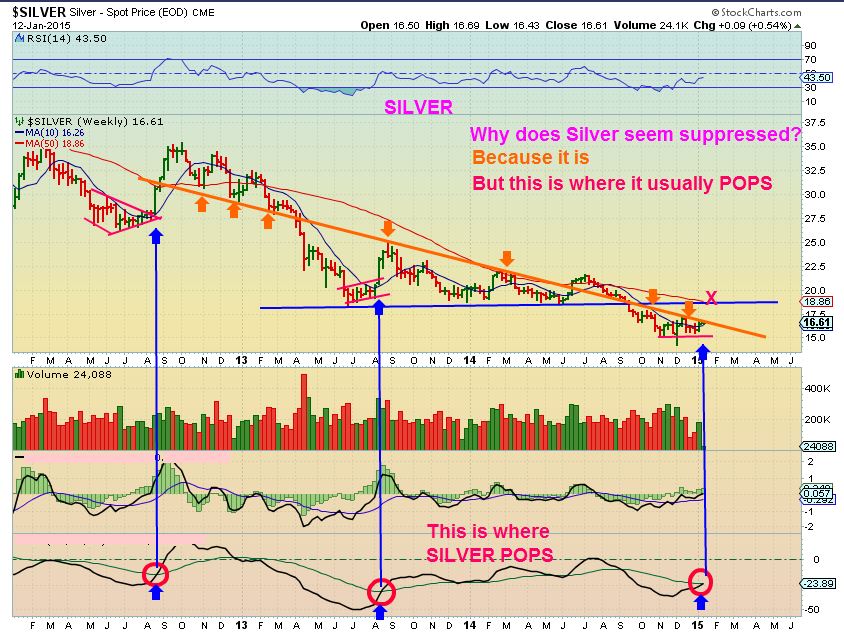
LONGER TERM WKLY it has work to do, but it has a small base that its coming out of to help with the push higher. Likely it’ll pause at resistance overhead.
GOLD , when I said I loved this Jan 9…
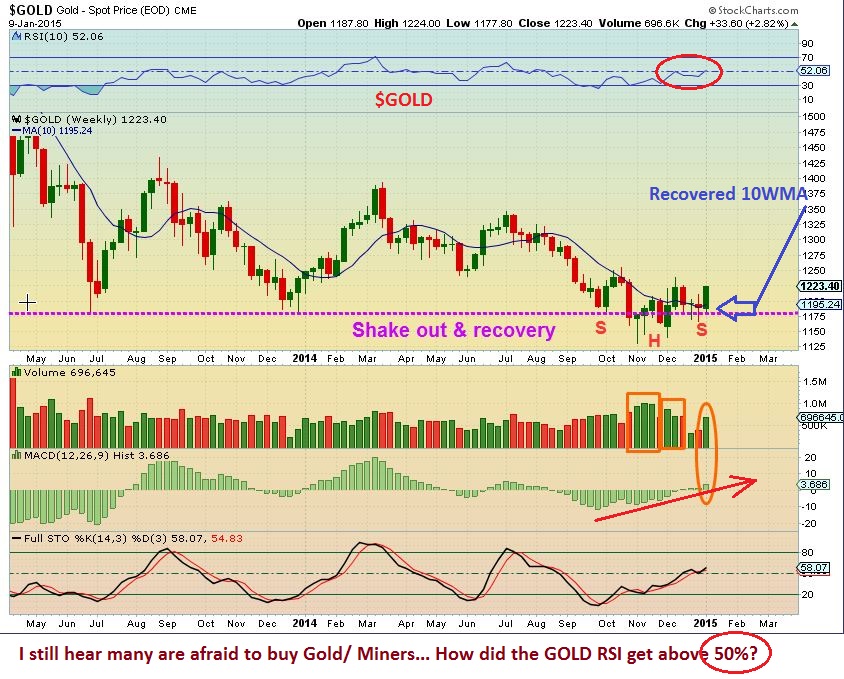
I love this more. That is great follow through
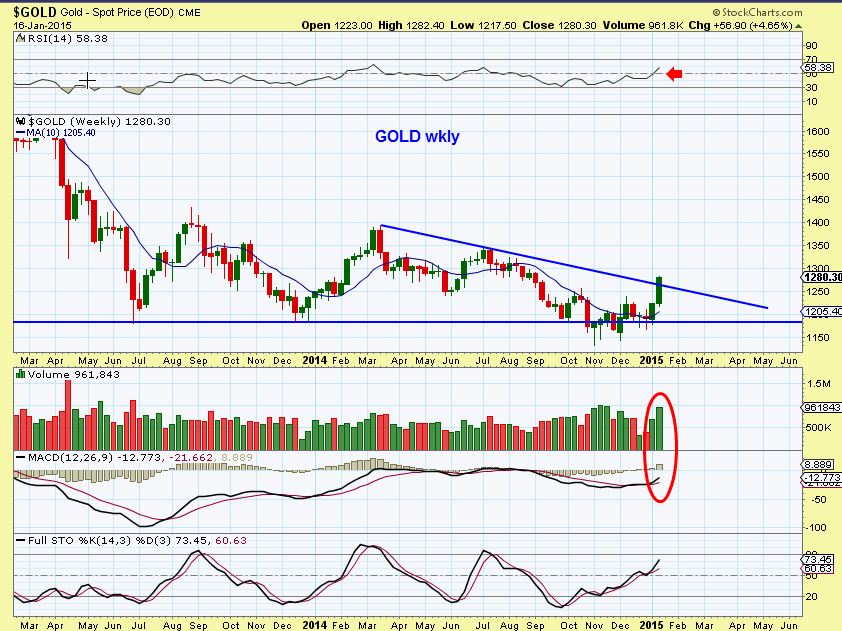
My Dec 26 targets are playing out – I was so alone then ; )
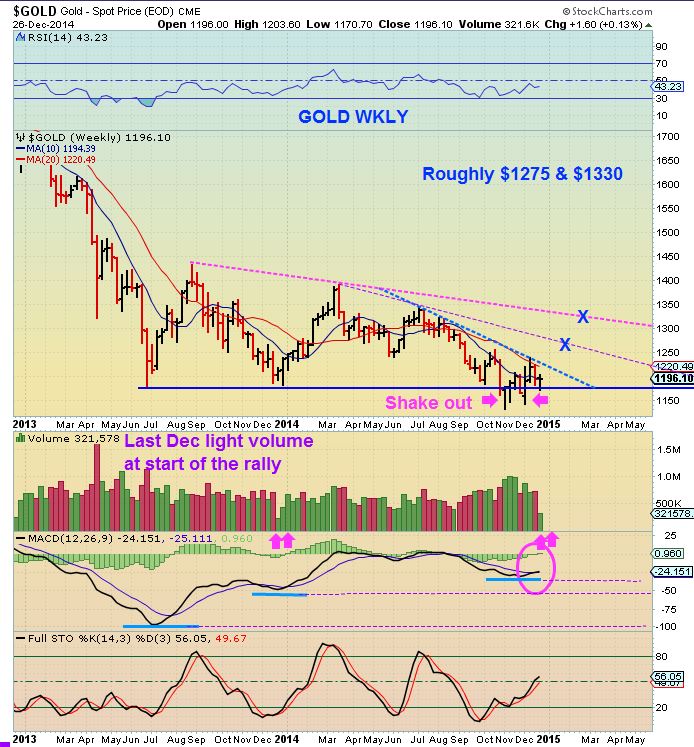
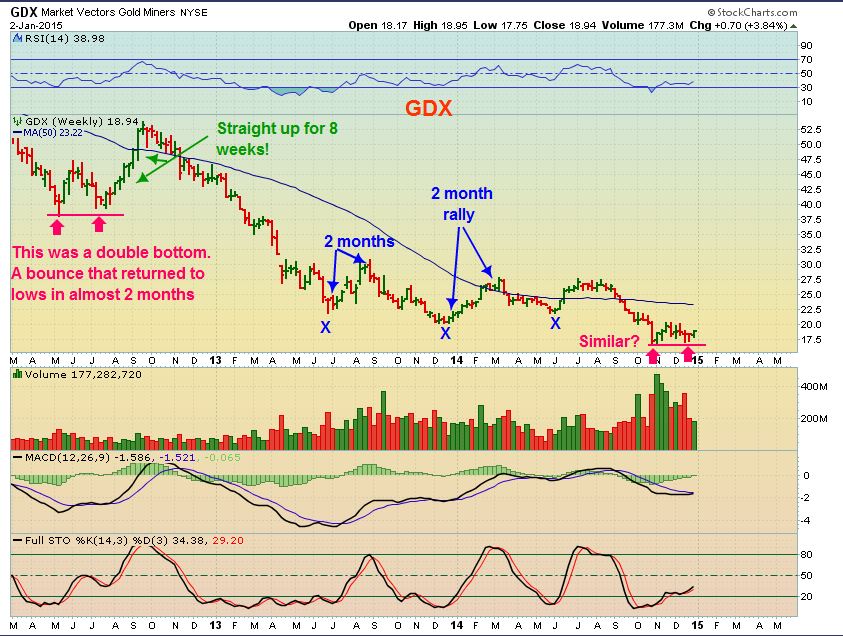
My thinking JAN 2 was this – 2 month rallies out of lows , and Summer of 2012 was 8 weeks straight out of the 2nd low .
Will we go 8 straight weeks ?
( It hits a snag now …I will explain)
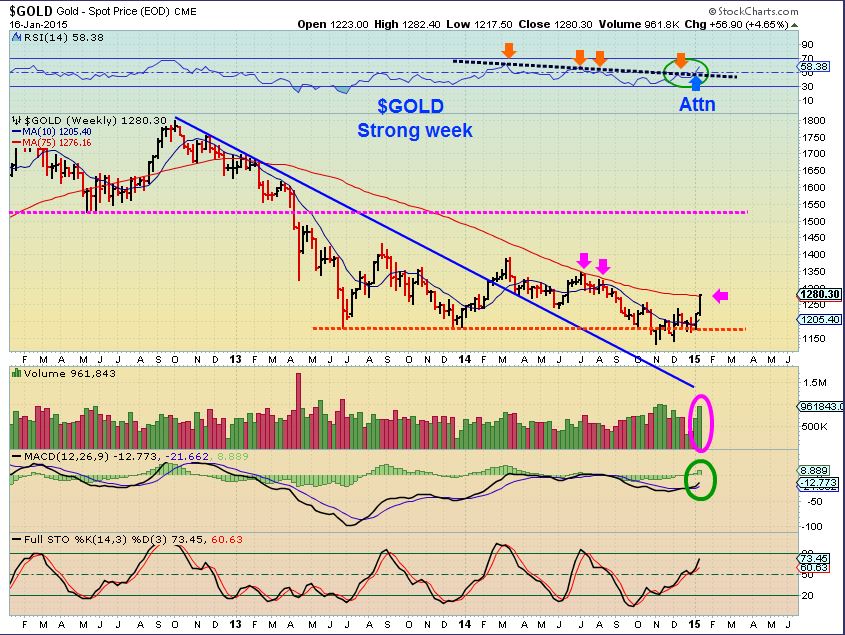
Each of those “Bear Market Rallies” Had similar %-Gains ( near 40% max) they just seemd to take longer . We are currently 37% off lows. ARE WE ABOUT DONE NEAR 40% ( Maybe AT THE 75 WMA)?
The %-Gainers are all similar to now. I DO SEE other differences however.
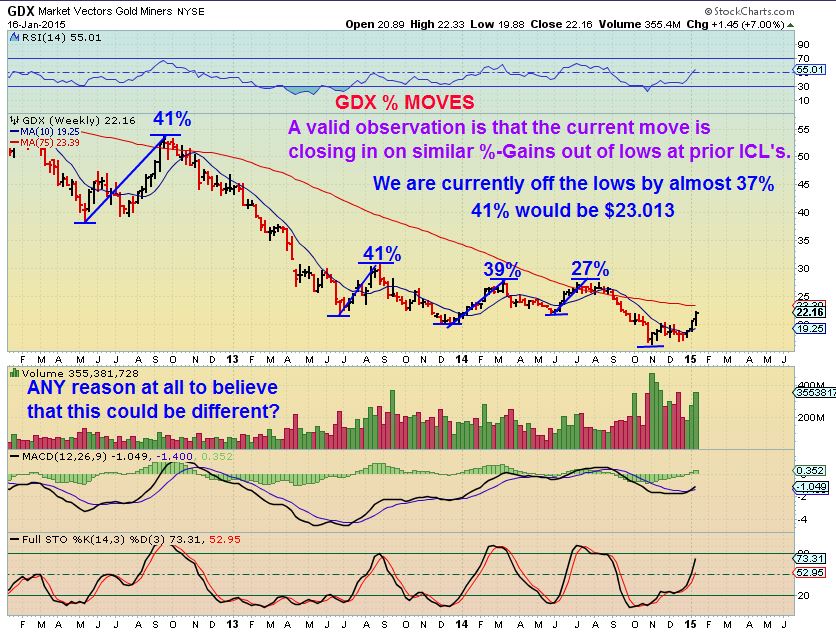
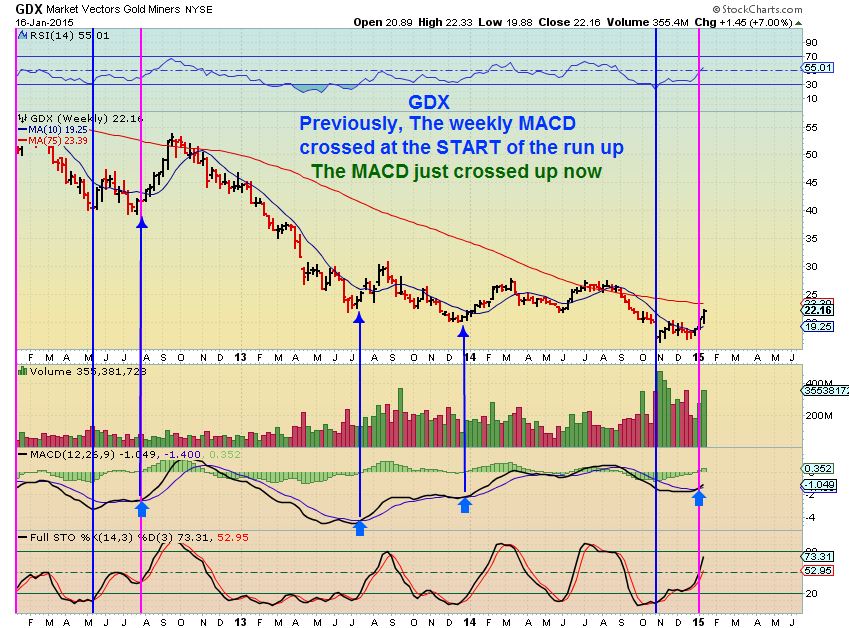
Technical Analysis – Though the gains are similar, The MACD wkly crossed at the start of those rallies, not the end . Ours is crossing now, though we’ve already gained 37%. I see other things that indicate that this rally could actually be stronger and more ‘Real” than just the avg bear mkt rally ( Time will tell after a DCL)
So we are due for a 2nd Daily Cycle low, those usually started the end of the prior bear mkt rallies. This one being right translated MAY be telling us that a 3rd Daily Cycle is going even higher. Maybe. A Break from prior “Bear Market Rallies”. What does that mean longer term? …I dont want to become Bullish biased, But I do want to watch and see how this unfolds. Right now it is displaying inner bullishness and has left almost everyone behind . Sentiment is still Bearish and at those Prior highs , Sentiment was closer to bullish. Everyone that PROMISED to ‘buy that low’…has found many reasons to stay on the sidelines.
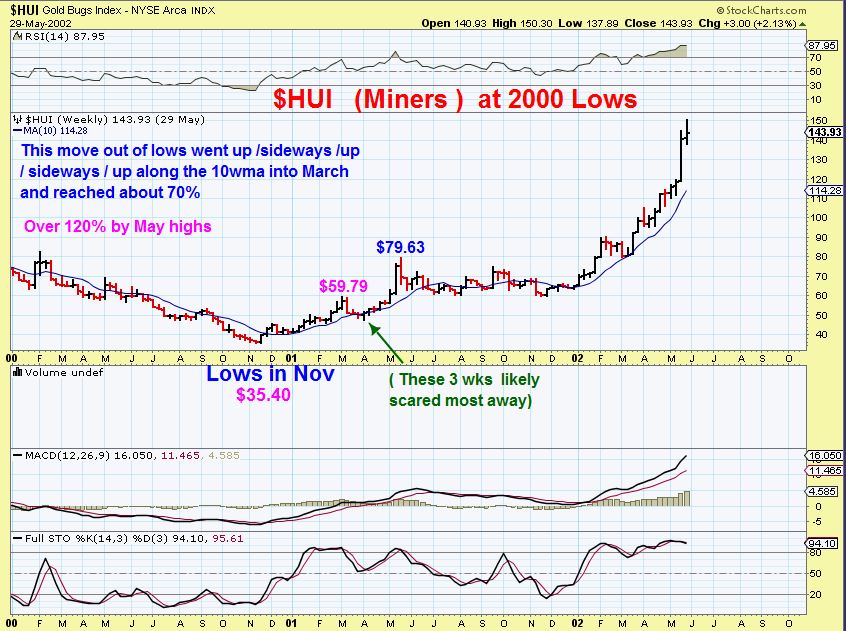
Lets take a look at something different than just a “Bear Market Rally”.
2000 lows out of a genuine Bear mkt… Initially rallied 70% in 3 months, pulled back, and went 120% total off the lows.
2008 % GAINERS out of lows. NOT a bear Mkt Rally- Were they stronger than 40% initially?
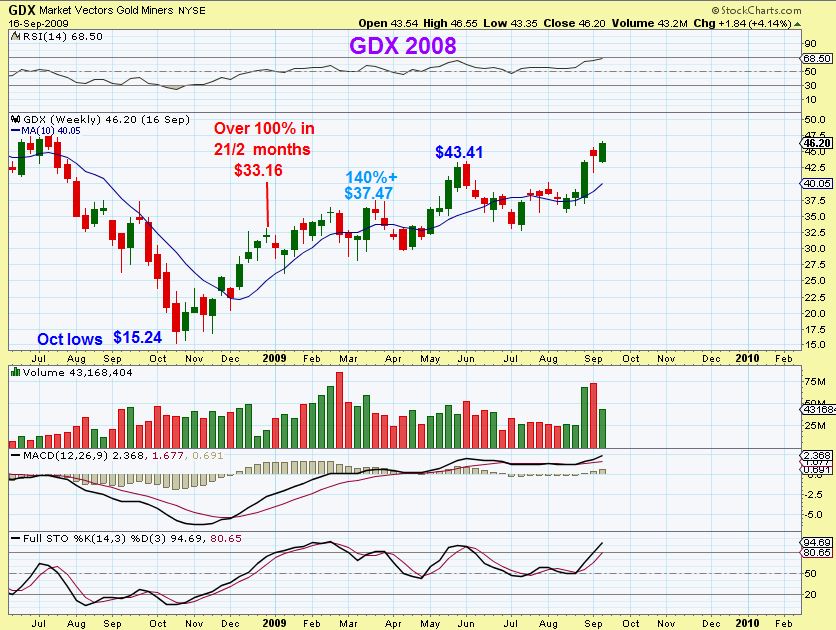
Technical Analysis MONTHLY CHART- HUI rose for month after month out of the reversal lows. Right now, THE MONTHLY MACD for GDX is VERY BULLISH.
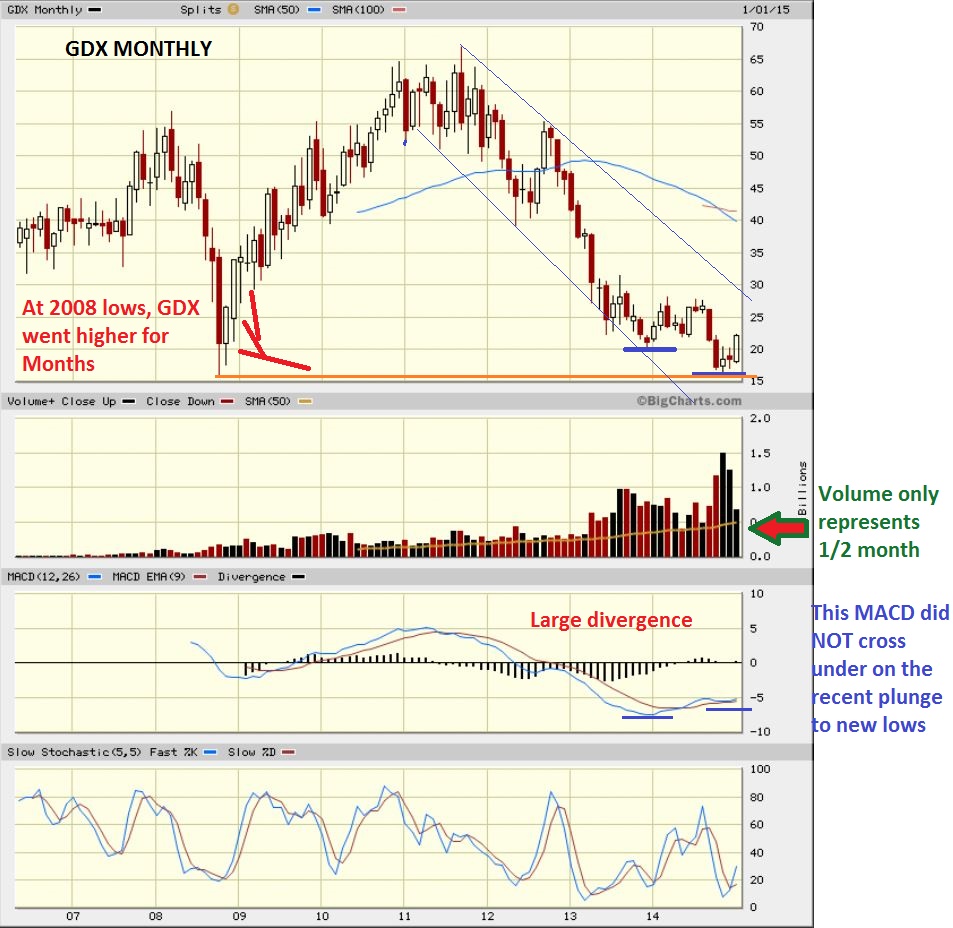
Do you understand what I am watching going forward? Time will tell. It should not take long to find out.
Do I see any clues? YES, I will have them in Future reports as needed. These Clues lean toward bullishness currently.
Look at GOLD from a technical Analysis point. Bullish RSI break out weekly.
GDX WKLY ( I drew this for a friend Friday at 10:30 a.m. ) as it broke through red resistance line . Another resistance is above. If gold is up Tuesday and GDX pops , Near $23 is a place to lighten up & anticipate a daily cycle low. ( We may just start pulling back Tuesday anyways) . It should be watched.
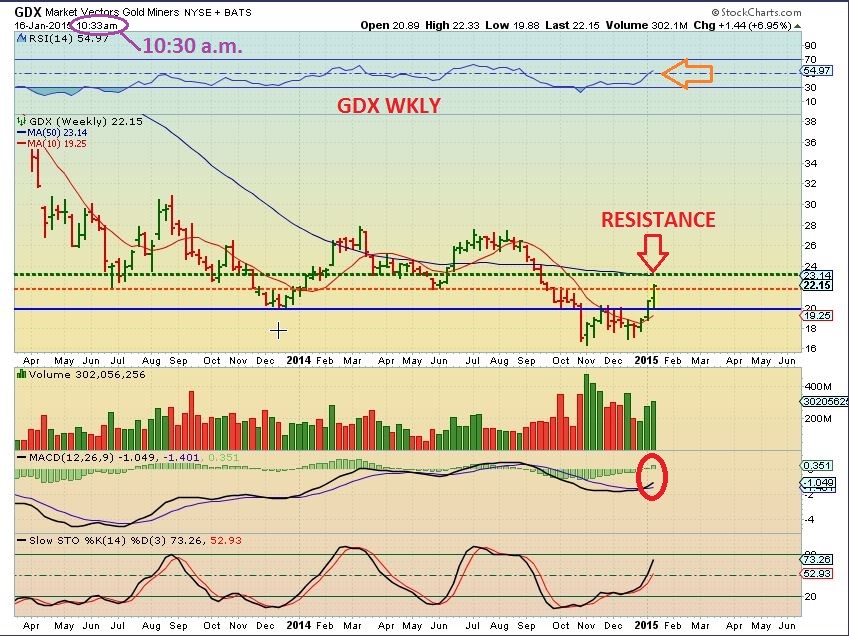
THOUGH GDX is due for a low, it may go sideways and end on the 10sma. Why do I think we may see a shallow retrace? Because GG, ABX, NEM make up a good part of the GDX and they do not look weak. IN fact, many were worried about ABX.
I called it a BUY at Thursdays close on this chart . Looked ready to break that 50sma . It did Friday .
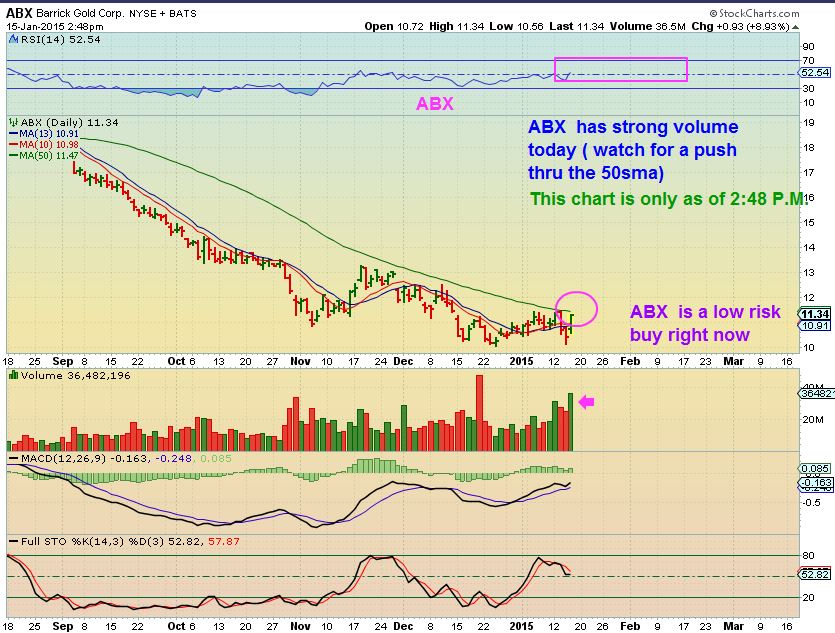
ABX WKLY looks EXCELLENT here.
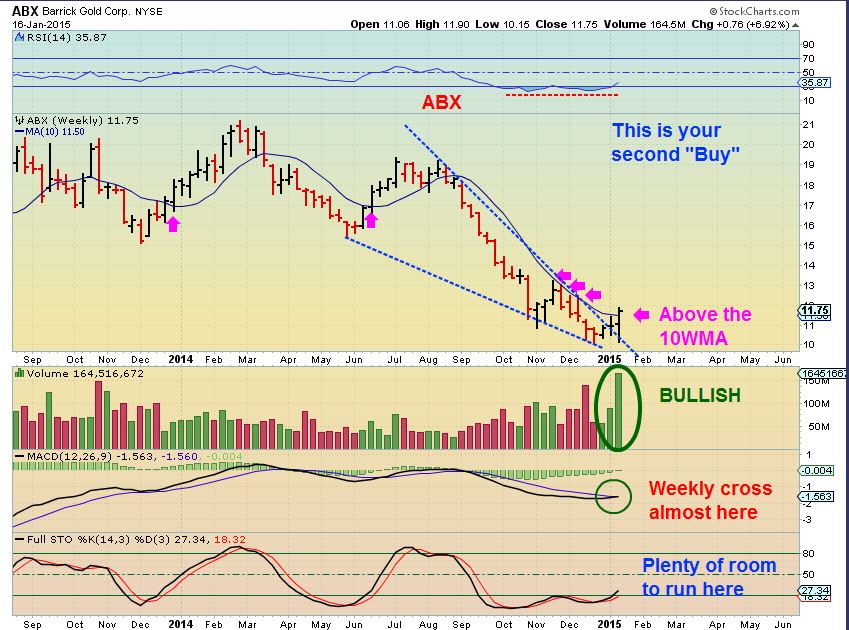
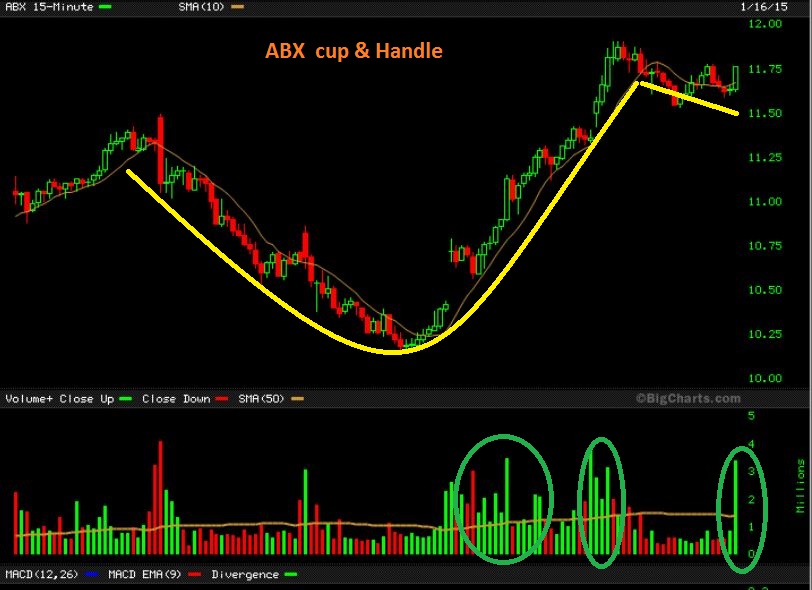
And this is how it closed Friday – LOTS of buying & or short cover off those lows (Cup & Handle)
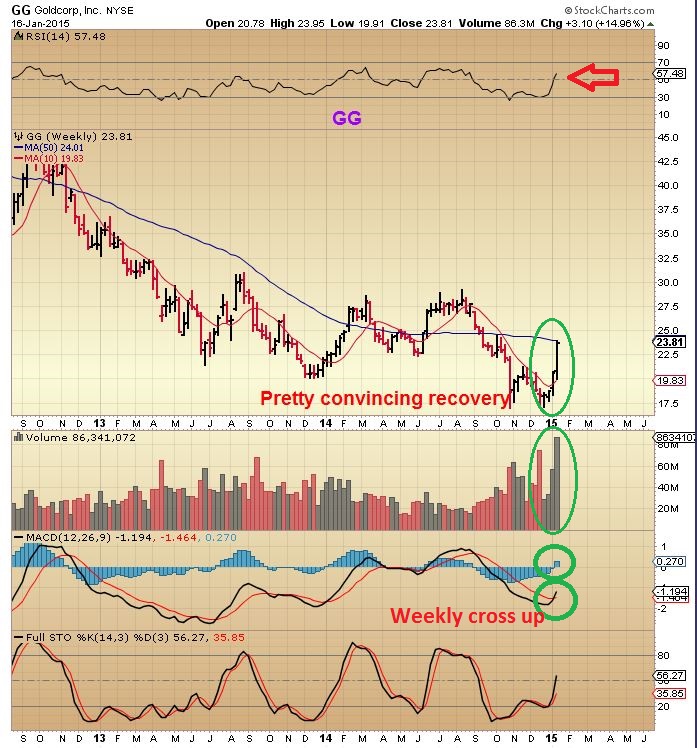
And GG WKLY. Yes, it may pause, but it looks strong pushing & fighting through resistance. See the wkly MACD.
Sure , we may experience a pause or pullback in Miners, We may get a bounce in the markets, but my read on things is even more bullish on metals and miners and bearish in the markets. CAN THAT CHANGE? Of course, thats why I examine, re-examine, and allow things to unfold to see how things look going forward. Right now, Cycle work expects a top . I use leverage at ICL’s and DCL’s ( meaningful lows , because the upside is potent). After a nice run, I Lighten up, Leverage should not be a part of the current plan, because we are at a point of possible rest.
Lets see how these things play out. Stay with me, The equity markets seem to be setting up for a big move 1 way or another , and the Metals & miners could be at exciting beginnings or could just fall apart like every other bear market rally. The charts will let us know as time rolls on. Thanks for being a member here.
~ALEX


Hi Alex: this is the audio from Friday the 16th. http://www.screencast.com/t/RGc49fD6Rzz
I see what you rae aying….I connected the wrong link.
I fixed it above, should be good now , thanks
Thx for the response. That makes sense. Was thinking about the individual miners themselves rather than relationship to GDX.
Well, to me it has other implications too. You can sell leaders as they pullback ( say when IAG , CDE , AG just pulled back ) and you can go long ABX , AUY , or other laggers just starting higher again .
NEM, GG just broke out with conviction last week, AG, CDE, IAG that were former leaders pulled back
Love the candlestick charts Alex ….. much appreciated!
I tried Conrad ; ) … I’ll keep it in mind. I cant read them as clearly ( Gaps are less visible , etc) so some have to remain the same
Dear Alex,
About where are we in the daily cycle for gold/silver? I assume from the notes we are near a pullback area is that about halfway through the current daily cycle?….shermo
Gold is only on day 10 , so say it has a 28 day cycle low to low….it can go higher for another week or 2 really (5-10 days) like Miners did until it starts to seek out a low .
Miners peaked on day 21 ( which is right translated and calls for higher prices after a pullback anyways). In a normal scenario I could picture GDX bouncing around and eventually tagging the 50sma , because the break of the 50sma usually gets tested. In an uptrend it could be that the 50sma just startss rising and the 3rd daily cycle low tags the 50sma later after its run . I’m getting way ahead of my self with that thinking though. : )
thank you so much Alex!!!
sidenote: If you dont count the shake out move as a low, GOLD would be on day 17?
Wow so cool to see the emailed dialogue. Thank you. Great site you put together!!!
Hey Alex! You are really kicking the tires on the is thing. We appreciate it very much. Regarding the 2000 charts on the HUI, interestingly enough the miners as you showed bottomed on or about November14, 2000. Gold as you know, at that point reached only a temporary bottom. Gold rose with the shares from November 2000 until about the end of that year. However, at that point, gold would start its final decline of another 8% (275 to 255) and wouldn’t bottom until early April 2001. What shocked me, the shares not only resisted gold’s entire move down, they would gain about 70% (as you pointed out) until March 2000 at which point the shares corrected slightly as gold found its final bottom. An 8% move down in gold now would take us to 1180 ish. But, we have precedent for the shares not only to resist but to continuing increasing in value during such a decline should it occur. Is this analog relevant to the current set up in gold and their shares in your mind? (Yikes. that was too long).
I did have this conversation with someone in an email about a month ago (was that you?). Its something to obviously take note of.
In that email I posted out that
– MINERS bottomed in Nov 2000
-GOLD double bottomed in Spring of 2001
-Silver bottomed ( A yr later) NOV 2001!
So yes, basically even if GOLD dropped to $1000, it doesnt mean Miners will have to follow. In Nov 2001 when Silver bottomed, $HUI was Well off of its lows, and above its 50 & 200sma
It was me but because of that “hacked” situation I mentioned to you (now resolved) I never received you reply to that email. Thanks for responding again, Alex.
You missed a lot my friend : ) I sent charts and other info on GDX lows. The hacker is probably rolling in dough now with all the info I gave him about Golds lows – lol
lol
Never thought we would get to 1280 gold quite that fast. Appreciate resistance and cycle notes; might be wise to play some defense with positions coming up. I just don’t think gold can keep running up without some pullback.
The good news with the 3rd daily cycle is that we should know soon enough. As you stated, in the past that 2nd high was met with devastating selling immediately after. So the real question will end up being can we buy the next dip or not? ECB decison might play some havoc with positions too. Keep your head on a swivel this week!
Wow, this has been Fantastic! Update, I stopped out of tight stop on GDX calls for huge % gain this afternoon; still in SAND. Looking for pull back and end of ECB drama likely before next add. Nat gas got hammered today thought it was overdone so doubled down and will look to get out at near breakeven as that works out.
Almost went long S&P Friday after the morning reversal but staying cautious here as you suggest which saved me from what would have been a stop run this morning.
Real question is ahead, what is in store for 3rd cycle?!?!
Hope for AM update if possible. Just considering a possible route to $1350. Unfortuneately GDX:$GOLD Has started to roll over alright already. Continuing strength in POG might break that deteriorating relationship with the miners.?
Update? what more could I possibly say from yesterdays afternoon report – lol. Except that the 200 plus futures in equity markets could fix the weakness as it gaps over the 50sma, but all things need watching .
There is nothing further to say until things play forward.
giggle… that was lonnnnnng…i had to get up and have a snack 😉
sorry to bug you— just got excited before bed. Afraid to do it but went ahead and doubled down this am.
Beek… You do NOT bother me, it was funny. : ) Be careful a little here, because even though I’m not sticking to cycles counts, we are late in the daily cycle and could START dip down into a Daily cycle low with the ECB meeting or even a day sooner.
Some of the individual Miners do look to be just starting (ABX as mentioned) so they may hold up, but please be cautious with options or leverage near possible toppy areas. or be quick ; )
Hi Alex,
Where are we with oil this morning….just leave it alone?…..maybe double bottom ahead with the positive divergence? You have never mentioned anything to do with cycles and oil….is all of that out the way window with this fallking knife senario.
Thx.
Hi Curtis
OIL MIGHT be trying to still bottom, but it’s definitely high risk. Double bottom near $44 could still hurt depending on the trade. Cycle wise it was due a week ago I think, but falling knife is tough.
That said , I thought I’d try a quick trade ….its staggering right now : ) UWTI ( Widow maker) at $2.95. I do not recommend this trade to anyone, I am babysitting it as a speculative trade.
ANYONE READING HERE IN THE COMMENTS.
I had mentioned how you can sell your leaders when they get over extended and then rotate into laggers with good set ups. Todays some LAGGERS are ripping higher.
See : AUMN, GSS, LSG, EXK, BTG, and so on. Some arent real laggers, but were slow movers, now ttacking on 10% + as thry stretch out. I am not recommending these (they can be extended) , just pointing out what I meant so if we get another run up later….you can look for this.
What’s next resistance on gdx if it closes above 23?
26 +/- POG, (but more so brussels). ( :- ) I’ve used 13 month chart for this view, as I’ve seen many correlations to 12/13.
Alex- incredible call with abx and the entire sector. I am thinking another dip to 10 day to shake out late longs post Ecb that would be a dcl. What are your expectations for the 3rd daily cycle. Would this make sense to you?
It does, then we have to see how the 3rd plays out ( usually not as strong).