
Hanging In There?
Volatility is here and the markets are rocking and rolling. If you have been reading my thoughts here, you know which ones are ‘Buy the dips’ and which are not. Lets review.
I said that I was interested in this , for one thing. A break above 22 would be ‘Interesting’ to say the least. Do you know where we are now?
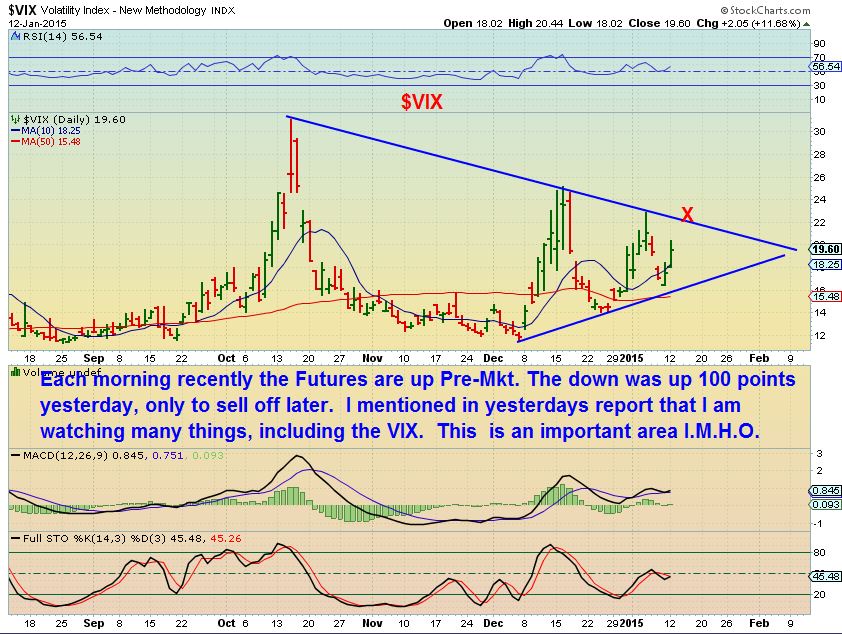
Well, the markets gapped down big yesterday and and thus Vix gapped open to 24 recently and then sold off back under that line to $21.50 yesterday . Is that the end of it?
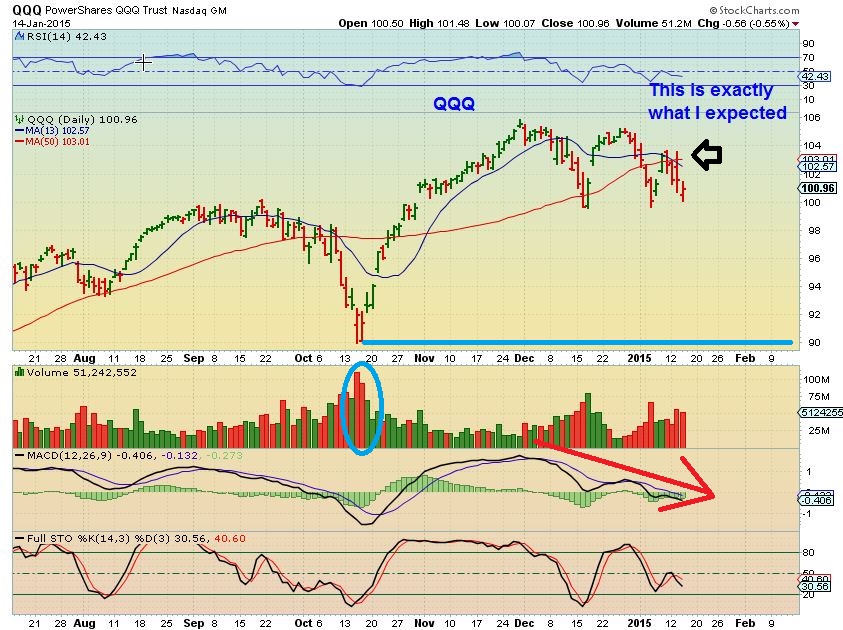
I now think that the markets are going to sell off, possibly down to test OCT high volume lows. I have kind of thought this the whole time, and based those thoughts on the idea (As mentioned) that former leaders AMZN, GOOG, TSLA, etc are ugly and already at their Oct lows. I am still wondering about the strength of IBB, IWC, IWM, RUT. IWM has now given up the 50sma, but the others remain above and my theory of Small Cap and Micro cap strength vs Consolidation in QQQ,SPX,DJIA still remains possible.
I was tempted to try recommending FAZ or TZA , but there is still a buy the dip attempt propping this market up , so its risky. A TAG of the 50sma and fail again might be a low risk entry if we see that.
Doesnt this look exactly like what I started talking about 2 weeks ago? Weakness and a struggle at the 50sma? I just have a hard time ‘timing’ this and tza has decay. Those who are good at shorting may want to consider shorting.
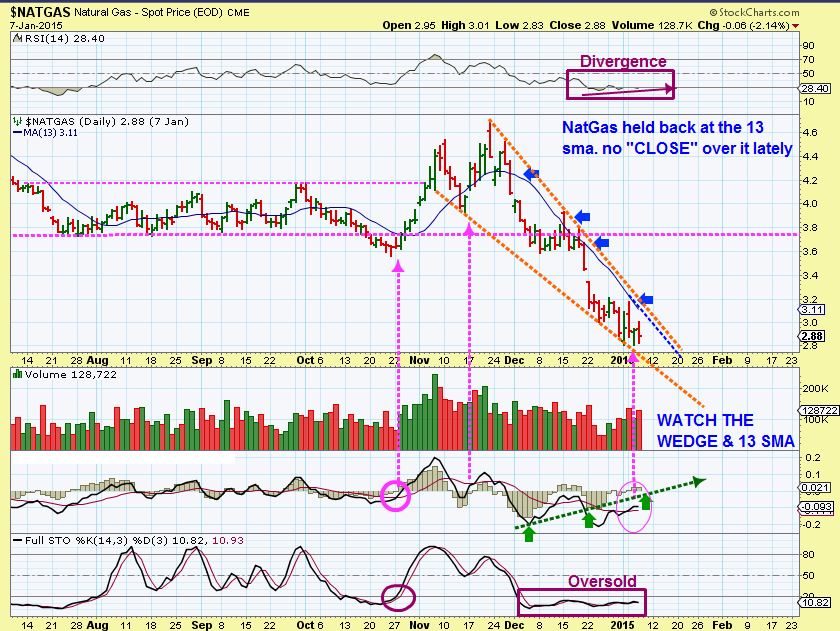
$NATGAS
I mentioned Jan 7 to watch NATGAS. Buy above the 13 SMA and I said I thought it looked close. I posted this and another chart as a guide.
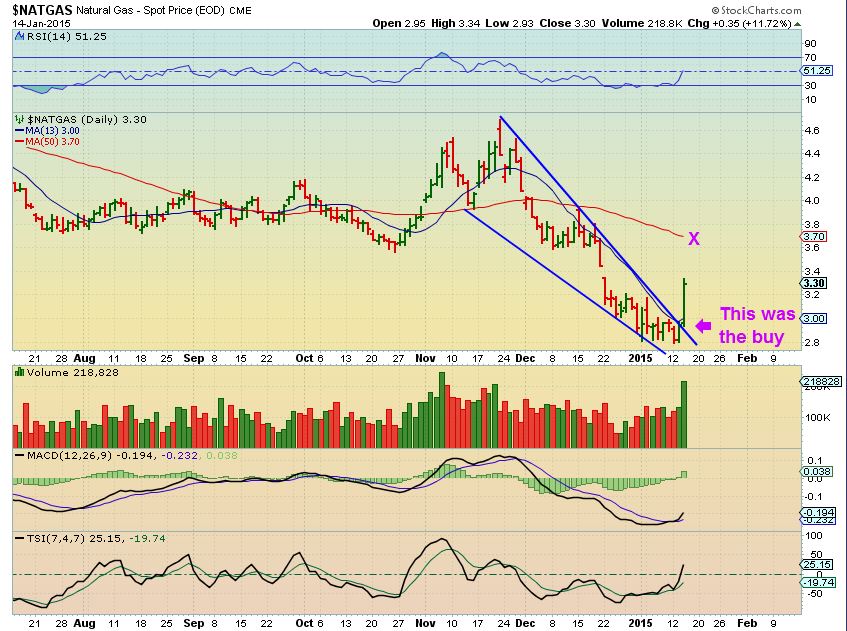
Yesterday was a Buy (actually possibly the day before, but that was riskier). I hope some caught it intraday. UGAZ screems but is leveraged so be careful. I target the 50sma first, but $natgas is explosive (Pun intended) and can just rocket higher. I would LOVE to see a dip for a day or two, maybe 1/2 way down that candle to allow for buying. It is only a quick trade if you missed it and want to try to scalp a day higher at this point. It could hit the 50sma in a day or two.
Now for GOLD & MINERS
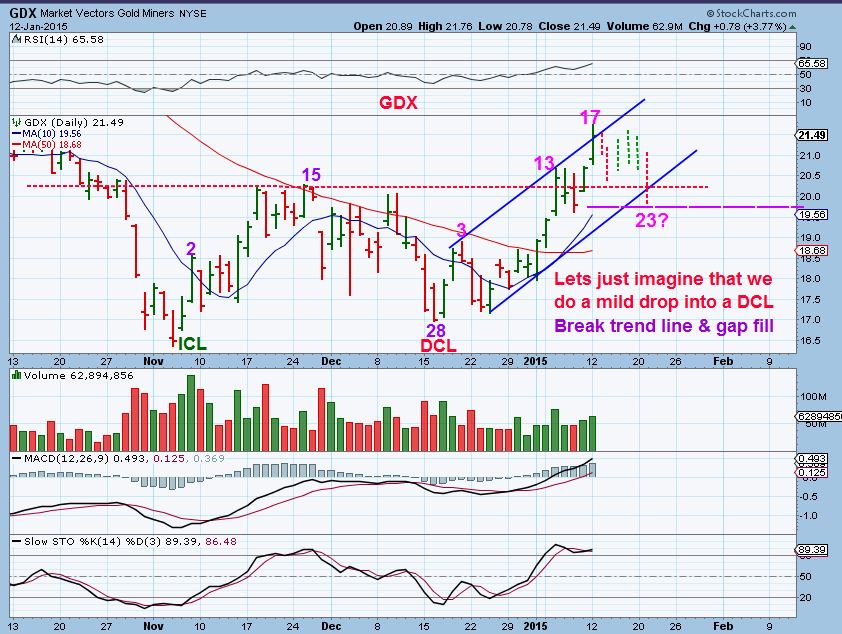
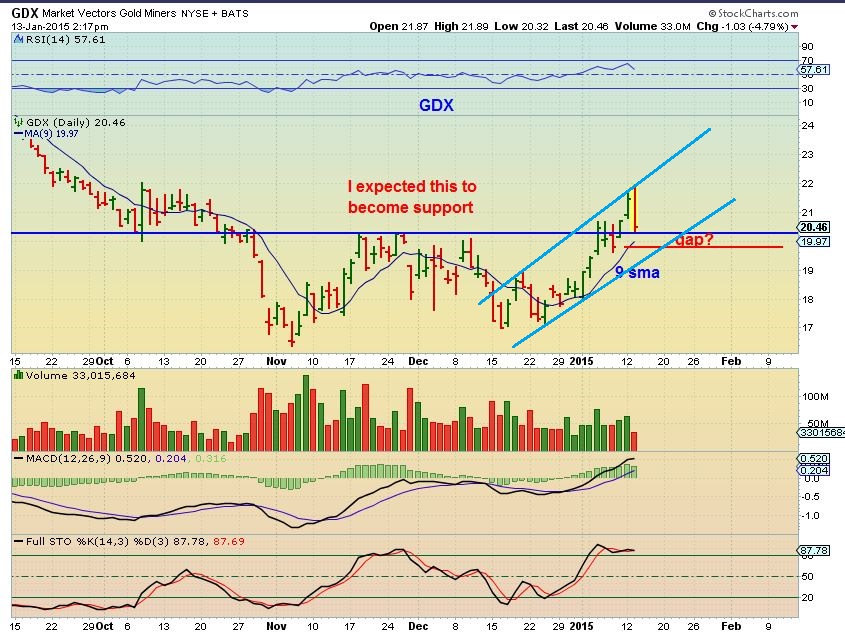
I want to mention something here…you have to take it for what its worth. I Posted an intraday alert Tuesday and mentioned that it could become an engulfing candle, you may want to “remove Leverage” and honor stops, even take some profit TO BUY THE DIPS. By no means did I want to incite “Fear” or negative emotions. If you re-read my post, I posted charts of what I would be looking for, knowing that I wouldnt be here Wednesday . If it got worse than what I had drawn, then one would have to consider a deeper drop into a DCL. I posted this showing a GAP , Trendline , and Moving average.
I mentioned that even if we were dropping to a daily cycle low, it could go sideways like this (Again, No fear, No Panic), possible buy opportunity.
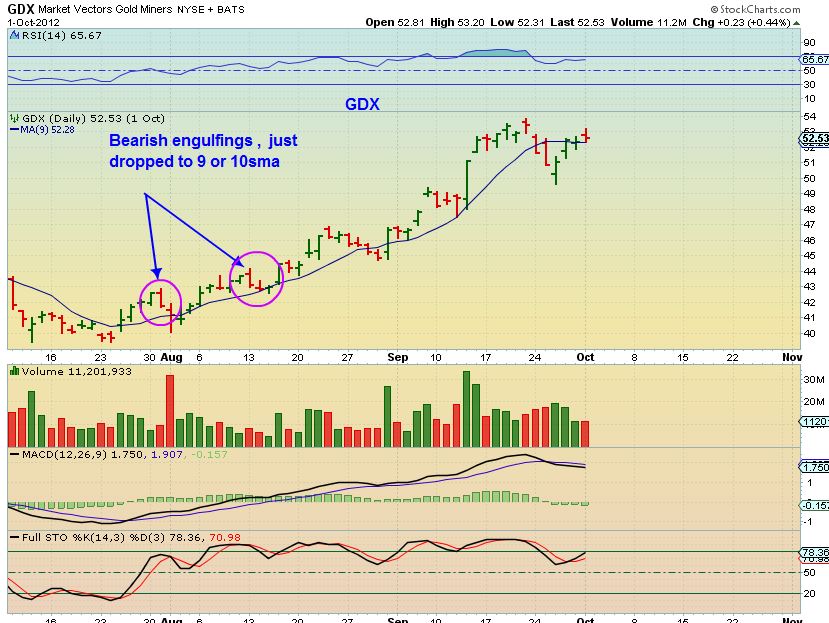
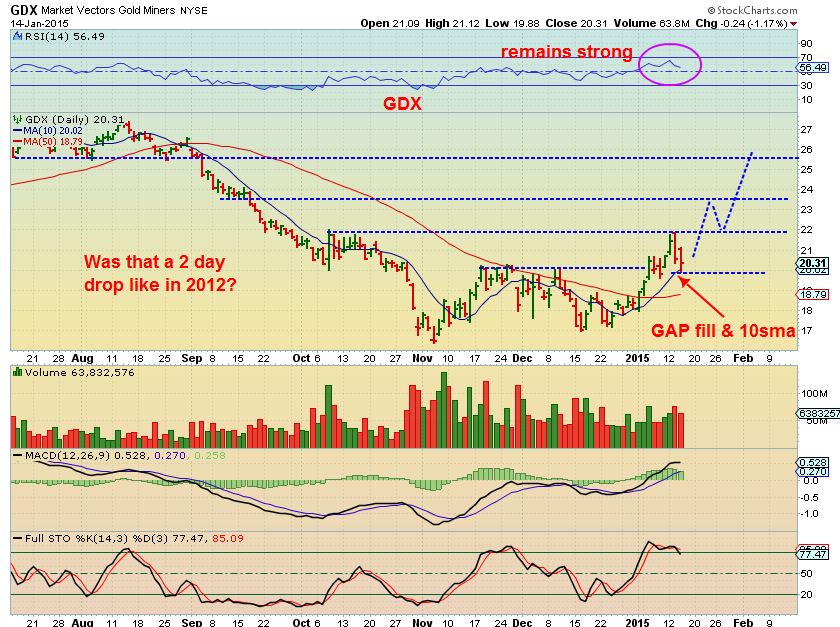
repeatedly I have mentioned that this looks like 2012, and the dips were shallow. ALSO notice bearish engulfing was only a 2 day event then. No Fear No Panic. You buy if the 9 or 10 sma holds.
I need to address something here, I almost hate to, but I got several emails and so I need to mention this. I will specifically mention a nameless commenter (and he can email me for a full refund if he likes) or stay and learn , I like him. No ill will , I promise, but this has to be mentioned to help people here. My mid day post was about normal profit taking, removing leverage , and possibly buying the dips. A commenter came on and posted about “Banksters” and “Manipulation” taking this thing down. When he said ” Big money just manufactured an exit by breaking the triangle and then handing the bag off to over zealous retail traders right before they terminate the intermediate rally.” Is that ‘fact’ or unfounded fear on a 1 day blip? Sadly , some linked his comments to my post about selling (Forgetting that I mentioned to look to by the dip). Afterall, who would buy the dip if they feel Banksters are outsmarting the foolish retail buyers? I said look to buy the dips . SO I get a number of emails asking me to explain the banksters. huh?
Understand that posting your fears here is fine …we can all comment what is on our minds. Sadly, some people were influenced by his fears & linked it to my post thinking those were my ideas too ? : ( I tried to refute the comment, but had to leave and didnt see other following comments. Some have confused his emotional reaction to a 1 day event (1 day events do happen a lot – its the follow thru that tells the story) with my post & became afraid to trade. I hope that isnt you.
Without at all being harsh, I just need to make something clear for my readers. I have known that poster for yrs, I like him just fine. I actually at times dont know why he is a paying subscriber if he doesnt believe a thing I’ve said, but thats fine too.  Let me remind readers of this….2 or 3 weeks ago this same commenter came on when Gold was down pre-mkt. I had Just posted that it was another stop run, and he came on ‘implying’ that I’m wrong & said ” Gold is in a triangle pattern, I advice that no one does any buying until gold breaks out of that triangle. ” Doesnt that tell you that he has had no position to date? He recommended that we dont buy , so he likely wasnt. So You can see that he doesnt believe the charts as presented by me anyways. He missed the entire move that we have enjoyed so far in Miners , possibly due to fear of Banksters and other theories . Thats fine. It should be noted : He posts only when Gold is red and fear is in the air. He never posts ” Gold is up $20, Banksters are buying, Lets join the smart traders” Right? SO I just want my readers to recognize that some commenters only post when Gold is down and they think I might be wrong. I have never recieved a nice job or well done from that commenter. Thats ok too…I’m just saying that if you want to listen to him, be aware of these things and draw your own conclusions. Enough said, I’m not wanting to be harsh or critical, but some were mislead here – Again. Does he have bad intent? NO – I dont think so, I think he just wants to come on and make a contrary call , and one day it will be a cycle top and a drop to a dcl and he can say he was right. For now? I hated writing this , but as in the past , He has warned you for weeks to avoid my trades and I get emails of concern that “Commenter so & so said this…did you even consider that possibility?” I cant answer them anymore, Actually, I just wont, its quite time consuming and takes me from charting. From this point on, you have been notified. We see things from totally different eyes and he is free to post whatever.
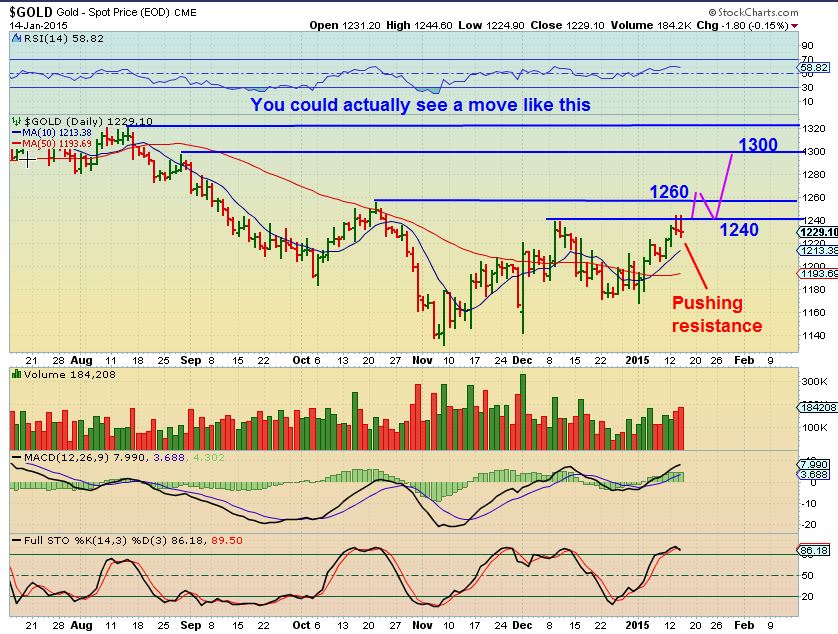
$GOLD – The triangle was broken Tuesday and dropped back inside. NORMAL.
I have said that with the bear mkt in Metals, we have been conditioned to fear the Miners . I maintain that The charts are NOT ugly. The charts show normal action when pressing on resistance. Often at resistance, price hits it, hits it , and then BREAKS Through. Normal action at former highs.
GOLD is pushing resistance with volume & NOT selling off. See the 10sma – Its bearish if it sells off with volume. This is not.
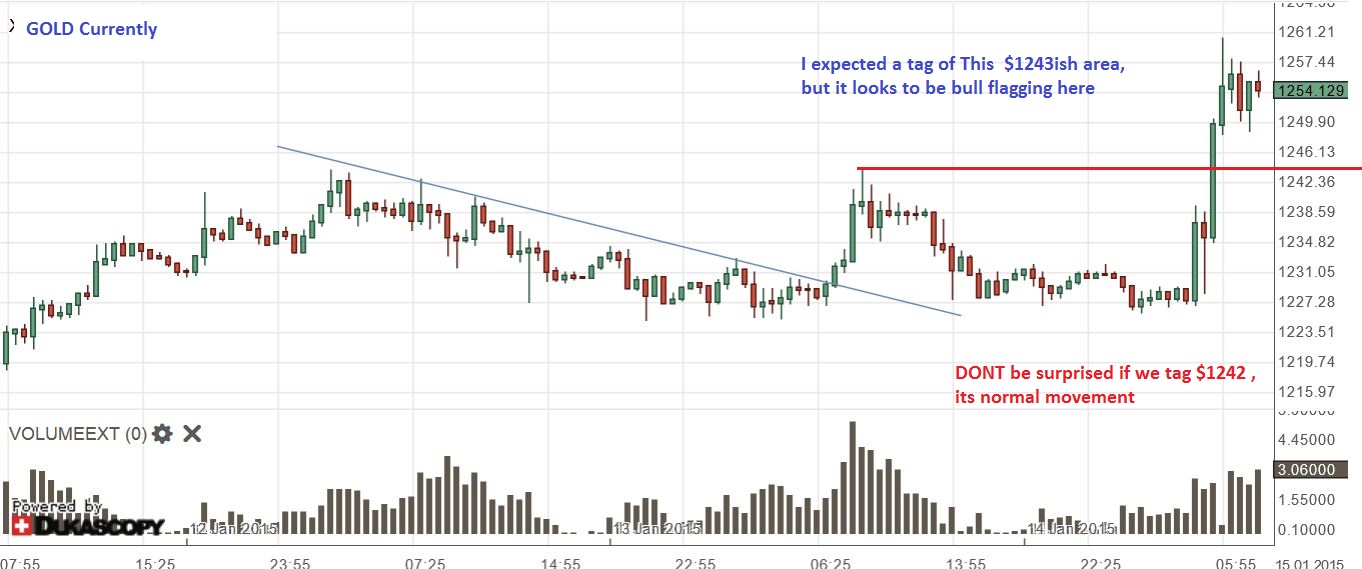
Today it broke out . This is GOLD Currently. I expected a deeper dip, dont be surprised if it does. If not, it may bull flag and take off higher.
Yesterday I wasnt here and I apologize for that ( My mother is fine and thanks you for all your well wishes), but when pullbacks come about in a healthy looking market, you look for low risk entries where you can place a stop if you are wrong.
GDX – again, note these bearish engulfings in 2012 had 2 day drop in 2012
This is what I had my eyes one , Gap & ( I show 9sma, I usually use the 10sma)
GDX JAN 14
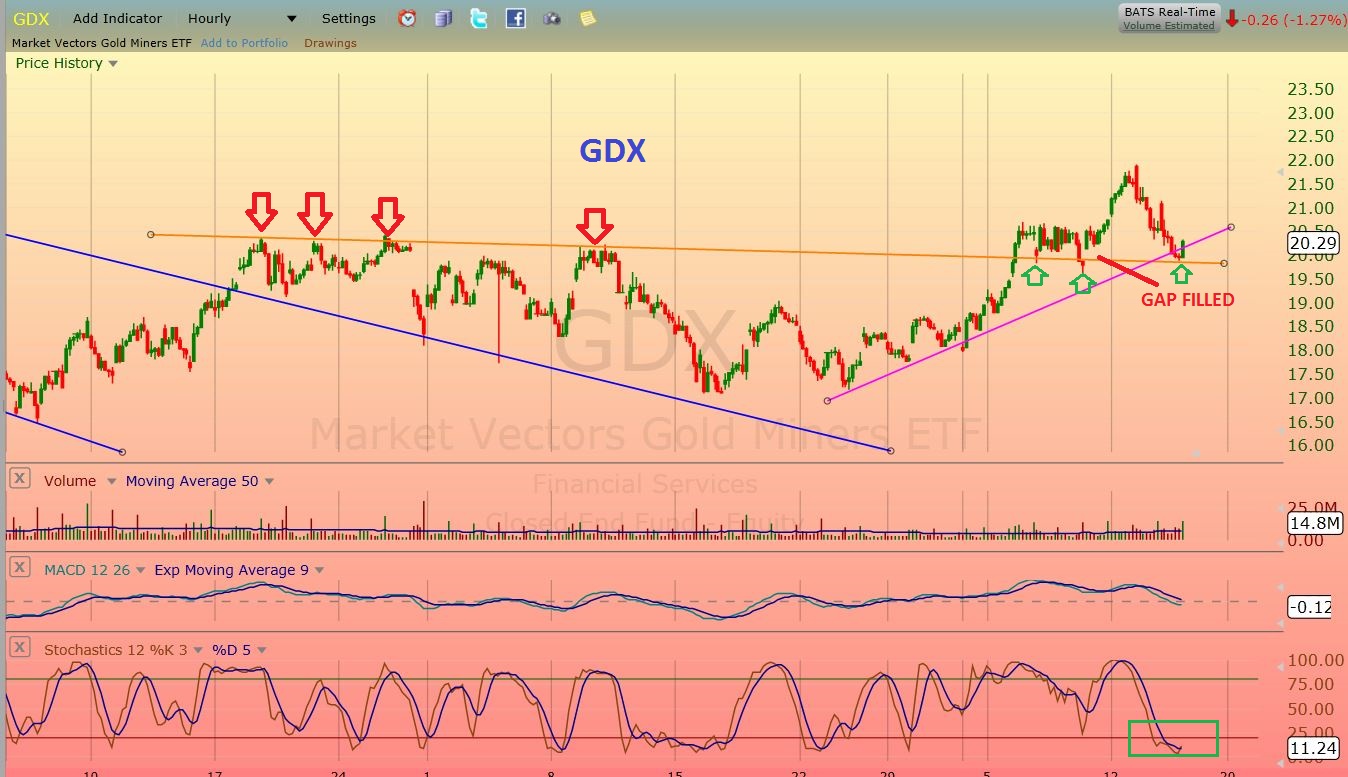
I’m going to zoom in and show you GDX HRLY / an intraday chart. Remove fear / emotions, and bankster bias and what do you see? Scary or normal? It was a low risk buy at the gap fill / organe support line – when the trend line recovered into the close.
GDXJ same time frame. Gap fill, trend line, BUY THAT REVERSAL
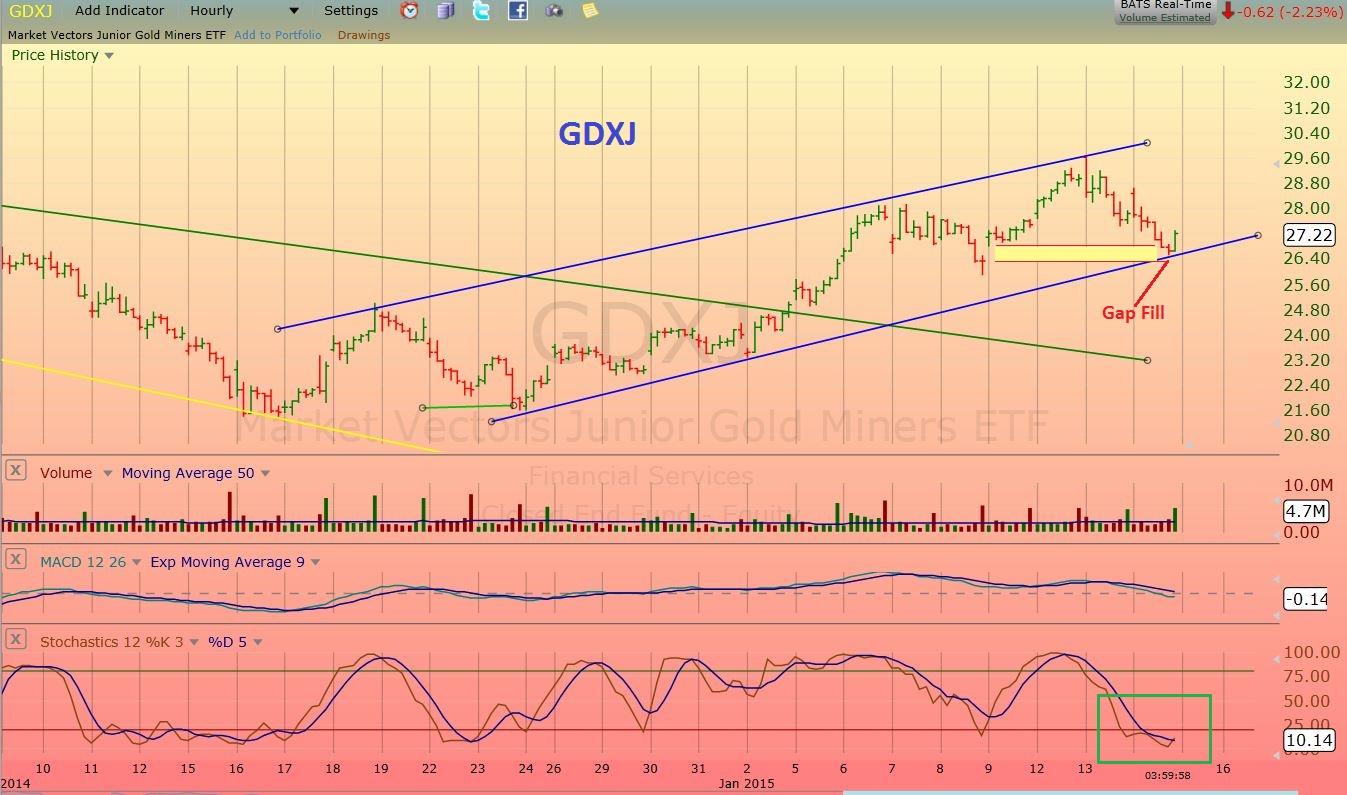
So all fear aside and just using charts in an unbiased manner, yesterday was a buy and your stop was a break down from there.
Some miners sold off nicely too and since cycles are a bit hazy for many, you have to use technical and just assume that pullbacks will come.
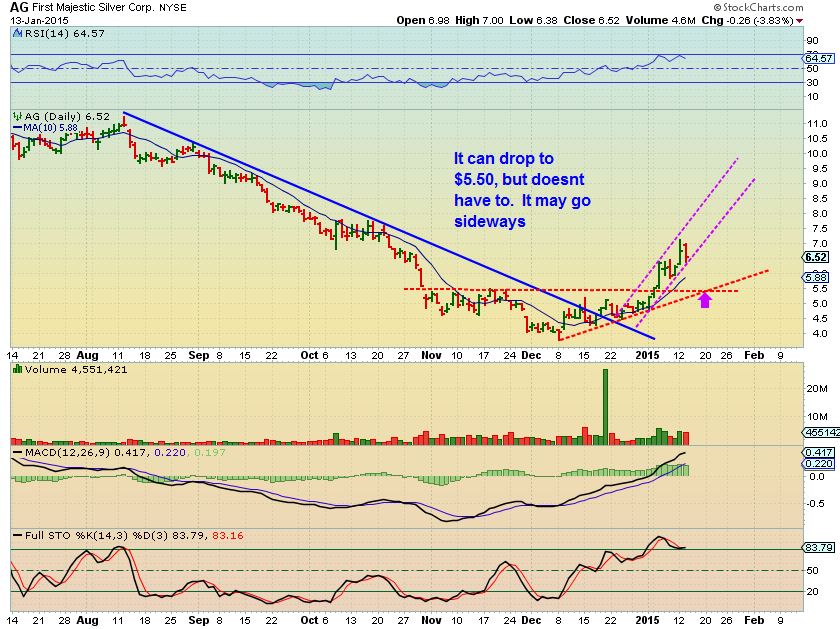
I bought AG around $4 and I actually got out of my AG position up below $7 (I actually Accidentally stopped out on a trailing stop , but it worked fine) and wanted to buy at $5.50. I dont think it’ll get there now, but I drew this for a reader who had asked about it Tuesday. Yesterday it tagged the 10sma and that may be all it drops too, not the horizontal support line. (I still own my SSRI ).
Going forward I think the trend is our friend in Miners. It is still a Buy The Dips time period , at LOW RISK AREAS. I’m not just trying to say BUY HERE and SELL HERE, I’m trying to teach you all to know how to buy and how to sell when charts indicate that the equitey is acting correctly. If you can buy on a down day realizing that these Miners are in up-trends (without giving into fear and bankster theories), you can make money. Yes there will be pullbacks along the way and some dips may be deeper, but use the charts to guide you and get out if they tell you to.
Some here did add on yesterdays did and told me that yesterday (before Golds pop). I think they deserve a little applaud & I hope that was you too.
As we move forward, not much has changed, normal girations id the metals and miners and SPX NASDAQ and DOW are sideways chop with a possible drop coming . Thanks for being here and I apologize for part of this post. It wasted valuable time and I hated posting that anyways , but its a repeat situation. Its a one time post here, I wont address it again. Some didnt need to read that , and some did need to see it. I like everyone here, Bulls and Bears , and we dont have to all be on the same page. Thats what makes a market. When EVERYONE is Bullish metals / Miners – We’re prob at a top. I will likely cover more of the SPX, QQQ, DOW tomorrow , but if they rally to the 50sma and lose steam, it may be a low risk short !!


Alex,
You communicate very well. Cycles are new to me and always learning….are the last 2 days of selling enough to qualify for a DCL in the miners and are we off to the races for another couple of weeks….or are we still expecting one next week with a still deeper pullback. Has that bearish candle on tues been negated with action this morning. I’m fully leveraged in SSRI…should I still back off here.
Basically are we expecting new highs here before another pull back. Thx
Hi Curtis,
Good question
I have been thinking about that myself and this is the tough part. If GOLD is only on day 8 of its cycle …Miners can possibly just trend higher in My opinion. THAT is what seems to have occurred in 2012 when Gold was stuck in a triangle formation. Miners didnt dip too deeply. At that time the risk was losing position, but its still scary if we get a selling day ( a strong one like that engulfing day) but I’ve been watching the 10sma for dips and maybe the 20 sma for a dcl. In 2008, GDX did dip to the 50sma, so its tricky here. If GOLD breaks out with Silver, They could just catch fire.
I posted this chart in the past. See the 10sma and the 20sma on the DCL
I’m very happy your mom is doing well. Such a relief I’m sure.
Thanks , yes she is actually home already. Thanks to everyone for the kind words.
Alex, I am so impressed with your analysis. I did panic out of some of my miner positions yesterday but still holding GDXJ and RIC. Lesson I just learned: look again at Alex’s charts before making an emotional decision. In time I’ll get the hang of it!
Hi Alan,
Well thanks , but let me say that it’s not easy. That engulfing candle Tuesday is usually a warning of further downside, but how much? Its scary to hold until the 10sma and then see it crash through into a dcl to the 20sma or 50sma. So getting out/ protecting profits is fine , especially if one got in at a higher price point. The tough part is re-buying at the gap fill, test of the 10sma yesterday. THIS was a key chart for me. Bearish Engulfing in 2012 was a 2 day selling event AND was was about day 15 on the second one – similar to now. Its tricky, everyone here is doing well.
I just noticed yet another huge gap on this move in GDX GDXJ on the 30 min. You think we fill first before moving making new highs?
If GOLD keeps breaking higher , it doesnt have to, and so its a tough call . Could go either way. It could fill later when the 50sma rises to that point and we dip down into a DCL, but even at that it doesnt have to fill. Believe it or not In 2008, there were 3 gaps open that never filled until this year!
Good job Alex on saying 1130 to 1260 was on the cards and why, day in day out.
Don’t let it go to your head… 😉
Thx Jonathan
It wont go to my head, because the markets have a way of humbling me on future trades, trust me. : )
Alex,
I’m sorry you feel like I was trying to undermine your analysis. That was not my intention at all. I too think gold has formed an intermediate bottom. There’s no question that it has. I was just pointing out the other day the bearish engulfing candle on miners as a possible sign of a daily cycle top. I dare say without the Swiss move today it would have without a doubt been a top. All I suggested was to trail a stop just in case. And BTW this is exactly how big institutions (I call them banksters) exit positions. They break a trend line or resistance level and then sell to technical traders that buy the breakout. The same goes for the downside to enter positions. The created a false breakdown and then buy what retail traders are selling.
Personally this market is too volatile for me and I’m going to wait and see if gold can make a higher intermediate high. Something it hasn’t done in almost 3 years. Once it does that then that would be the signal that something has changed and I would then buy aggressively at the next ICL. Let’s face it there is a lot of room between $1250 and $5000 (my minimum target for the gold bull), missing one intermediate cycle to make sure the bear is over isn’t that big a deal. Plus almost every ICL retraces 50-62% of the previous rally. So it’s not like the bull is just going to run away from us. There’s been too much long term damage for that to happen. It’s going to be a muti month and probably year or more process of repairing the charts. Heck it’s already been a year and a half.
FWIW gold is now getting late in it’s daily cycle and miners are lagging again. Maybe a tag of the 1280 resistance zone as a possible cycle top sometime next week and then a 50% retracement to a DCL. Reenter or add to positions at that DCL.
Again my sincere apologies.
Gary – You know I emailed you and said your ok in my book. I dont think you had bad intent at all. Its just that when you post , it was always when Gold was down and against my calls to buy the dips. So I get many emails saying ” So & so said banksters, have you even considered that?” ” So & so said Not to buy because the triangle chop…can you address that in your next post ?” etc etc Its was a bit too much.
I amswer every single email that I get, so Today was just a one time post to say that I’m spending too much time answering emails in sell offs. I do know how the big boys get into their positions with stop runs , I’ve covered it hear repeatedly, but you did call for a major top and leaving retail investors holding the bag. That caused fear / emotions, but its unfounded without follow through. Its best to watch the follow through and see if it is normal action/ reaction. They call it a Bull move because it Bucks a lot.
As for this being too volatile for you and trying to take a safer course of a higher intermediate high, I can respect that. Honestly I dont knw that it will, so I wanted to trade the charts (Bullish for now) to that point. Yes , there is a lot of room even between $2000 and $5000, but my acct is up 80% from Dec to now just using my technical analysis, and I am wanting to share that here. I’ve really tried to work hard to share my technique and help people to make some money, and ‘fear’ is the only thing that dissolves it all for a few. Thats ok too, just needed to post that I wont address it in emails anymore.
Apology accepted, but if it was an unintentional reaction, apology is not necessary. I appreciate your post here, and please take no offense, I really did try to handle it gently, but had to point out that we’re still moving along despite past warning posts by you not to buy.
Bulls & Bears….Its all good.
I see it a tad differently on the miners are lagging. Miners got way ahead of gold, so maybe the pause looked like they were lagging. They may be allowing gold to catch up, but still leading
Alex, I think you prepped us great. I posted yesterday on here that GDX was sitting on 10-day and was a buy, stop if breaks down. Went in New position about 2:30. Was to add SSRI today but didn’t want to chase this morning. Crazy with the Swiss Franc/SNB stuff. I mean you can’t know that kind of news so maybe a little luck involved. But gold was banging on 1241, was going to get through eventually. Nicely done while bears were out growling on Tues. I even grabbed a little pocket change to the downside while it was avail.
Interested in tomorrow’s report. WTI may be reversing here, not Sure ling energy or short the Qs. Hopefully charts will have answer!
Hey Cason,
Irs funny, but somehow it seems that important events line up with pivot points on charts. Its like someone knows something and it all lines up. I’ve seen it often. Glad you took advantage of the selling to buy.
IF i was thinking about Miners and cycles, I would agree that it is late in the cycle, but I have a hard time with that because in the past we have had 18 or 21 day cycle lows. Could that have been it like CURTIS mentioned below in his comment? Possible I guess, I also had drawn this sideways type move Jan 12 as another possibility, but who knows?. Just keeping an open mind to how this could play out.
Thanks for reply. Yes, I was basically playing for the 10 day touch, gap n’ go. Maybe we get that lockout now that we looked for a couple of months back. Such a big pop today that I have some pretty good cushion if we pull back, add for now. Keep us updated on cycles if it clears up in the future.
Hi Alex
Great to hear your Mom is doing well. I love your posts. I find lot of online Commenters are vague at best while yours are to the point and right on the money (eventhough I chickened out of GDX and GDXJ yesterday!)
I have a request to make and it may seem unreasonable for you and others but I find OHLC Charts very difficult to read as I have color recognition problems. Would it be possible to use Candlestick Charts in your reports?
Many thanks
Conrad, Thx ,I appreciate that.
HMM, tough one, I thought that the Candlesticks were full colored bodies and I have trouble getting a good read on them. I get a much better read on OHLC. I will try to consciously occasionally use both in the future, but I will say that some gaps dont show up on Candles that do on OHLC …thats another reason why I use them.
Thanks for the input. I’ll try
Hi Alex,
Here was my problem of adding to my Miners positions yesterday: most of the miners we are watching (AG,CDE,EGO,FSM,GORO) blew right thru there 9 day SMA’s then I started thinking hmmm maybe the low risk trade is wait for the touch of the 20 day SMA with a stop below the 50 day SMA ? Am I off base here?
Hi Ken, Great question.
No, that was reasonable, but I often look at a number of other factors too. trendlines , gaps ,etc that price may be dropping to. Personally I am seeing individual Miners l act separately.
look at RIC. It was strong , very strong, but seems weaker now. Is it? no, it has been consolidating sideways a lot. Now It just dropped down to its trendline & 50sma . RIC blew down fast, but today its up 17% and just recovered the 10sma,
That could be bullish
EGO kind of did the same, almost tagged the 50 & 20sma and now gapped higher. Tricky, thats why I have mentioned that sometimes you dont want to lose positions, you just cut leverage or skim some profits to buy lower
And what about today? Maybe that was a dcl for some ? AG & Ego are on the 10sma right now too.
Its tough, but the charts still look ok.
Thank you for your response. Gotcha. 🙂 I am certainly enjoying learning from you.
Staying with just the SMA’s for a moment: How do you handle a chart when the 50sma is Above the 9 and 20 SMA’s ? Is that a sign of weakness ?
Its a sign that there was a sell off, so yes, it was weak, but it could be in a recovery stage too. First the 9 sma will turn upward as price does , then the 20 will follow if price continues and then price will be forced to recover the 50 or die : ) .
Alex, Many Thanks for your time and analysis. Always enjoy reading your notes.
Following your charts, I would second buying on the 10sma up to and including March 2015.
Stay frosty
Hi Jay and thank you
I am currently looking at various individual Miners and some are really acting well. tagging those 10sma & holding their upward momentum ( A few others were scary like NGD and TC – so I’d buy a basket, not just one)
Even a semi – lagger like MUX. Dropped to the 20sma and looked bad, but was a 1 day event so far. Today the chart looks normal. IF we had a drop in the future it might just fill that gap, but on candlestick charts , it isnt a noticeable gap.
day 18 , could be a DCL for MUX? Or mid point dip?
Hi
Nice one. I was referring to gdx. I should have been more clear. That tagged the 10sma yesterday during last hour and bounced 40-50 cents off it.
Message to FRANK C
I keep trying to reply to your email and it gets rejected and sent back. Thx
Alex,
given your a-b c-d i now have a target of 24-25 on GDX before any retracement. 17-21.5 down to 19.5 up to 24, what do you think?
Marinho
Thats good work, but there are a few factors that determine an A-B-C’s validity. First it has to take out that ‘B’ point and it has to do so with strong volume. That ‘B’ point is also resistance going back to last June and Oct. Pull up an 8 month chart and you will see it . It will need some conviction to validate the C-D move .
Are you looking at the gap up, with volume, in june as B/C conviction?
I’m back again…. Thank-you for all you do ALEX!!!!
Yesterday I wrote:
a day ago
Alex…. how was your mom doing?
I thought sometimes about her and you.
See you D.V. tomorrow morning.
Trust you get some good sleep.
Thx Geurt
Hi Alex
Great to hear your Mom is doing well:)
Whats youre thought about ANV and the little drop after hours ? Best wishes
It looked good and was up 11% during the day and gave it all up after hrs. It could be filling that gap , but I dont see news on it. We’ll have to see how it opens. Watching the 10sma