Many Still Cant See It
Many still cant see it , lets zoom in for a minute

If you’re worried that the public will see this , dont. I have posted for 8 weeks my thoughts on a particular sector in extreme detail, and I still cant convince everybody of what I have been seeing, this Picture wont change anything for the public. So Lets discuss Various Markets …
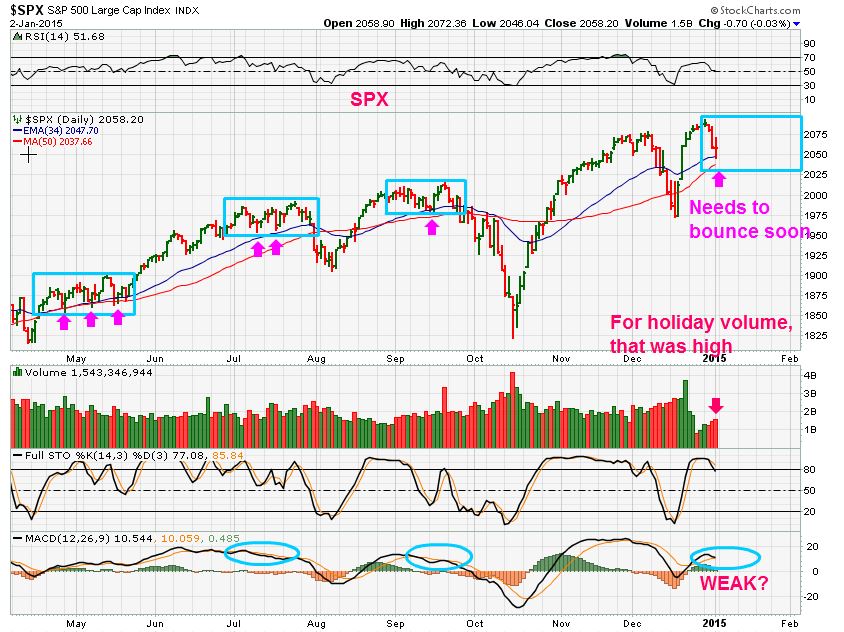
BRIEFLY – SPX, DJIA, NASDAQ have done as expected. They have fallen to fill a gap & dip below the 50sma. WHAT WILL HAPPEN NEXT? Will we rally from here? A bounce is due, Will we bounce & drop further or rally higher like in 2014? I prefer to watch how that bounce unfolds. I saw some stocks charts start to look ugly & broken, other charts are looking like good set ups. So what do I look for?
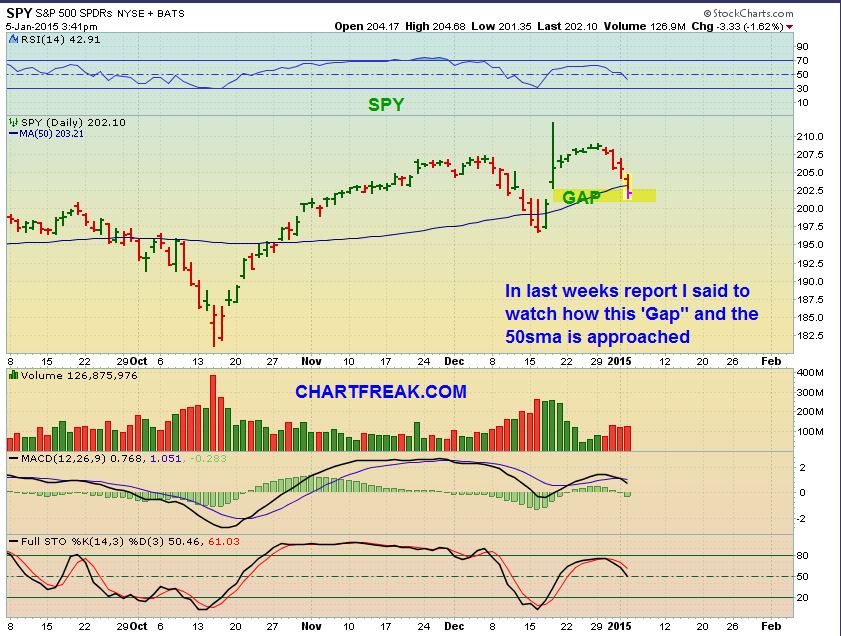
This was the SPY right before the close yesterday/ Broke 50sma & gap fill (As expected)
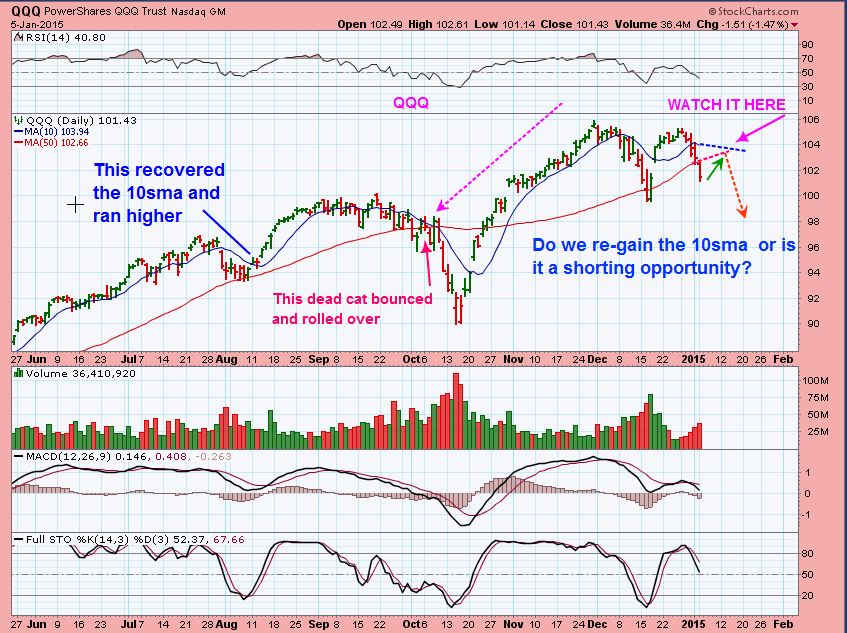
And QQQ. I think it looks weak, with a bounce & further weakness personally, but I want to see how this plays out if we get a bounce.
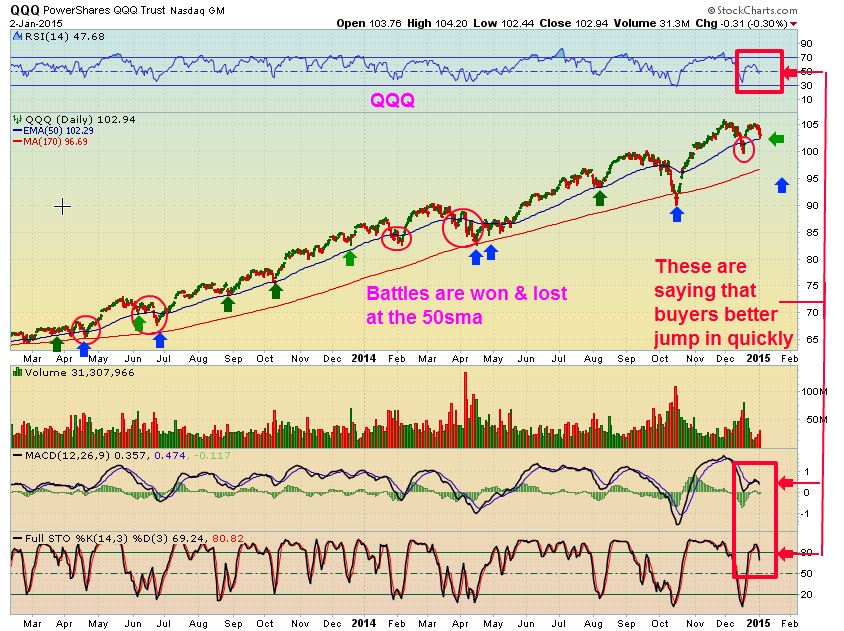
I pointed out this weekend that battles are won & lost here
It doesnt mean a HUGE crash, but history shows that in prior run ups….there were pauses , rallies , pauses , rallies for months at a time.
Reminder SPX sideways moves
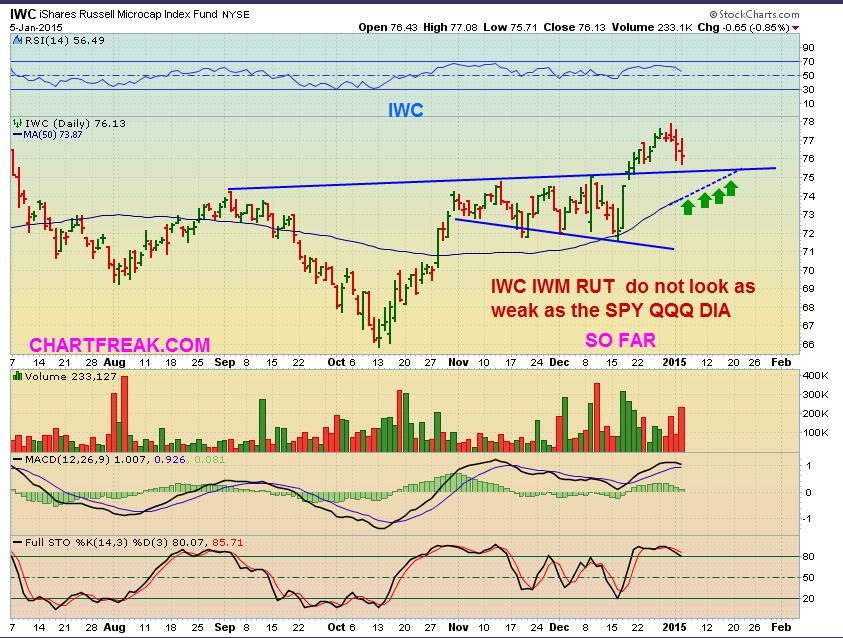
The reason I say this is that I still see IWM, IWC, RUT as progressive here. SO rotation could occur. Here is
IWC JAN 5– not ugly at all
I also said I see some stocks getting ugly, or at least selling off. Since SEPT look at TSLA / lower highs, lower lows
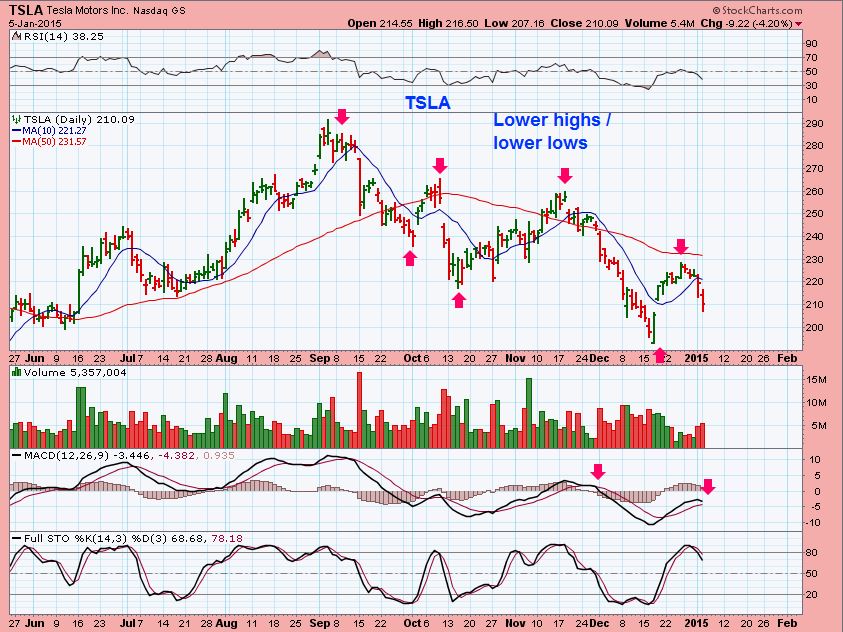
Its not the end necessarily, it ran from $25 to almost $300. Just time to consolidate. Look at AMZN, PCLN, and a few others. Amazing runs, but now lower highs.
But as I mentioned, I see many good set ups in the micro and small caps. I still think things need monitoring, since QQQ, SPY, DJIA looks weaker to me, but look at these and this is in the thick of the selling yesterday .
I never posted the first charts, because I was leery seeing weakness in SPY.QQQ, but these smaller caps are bullish.
CMCM Dec 26
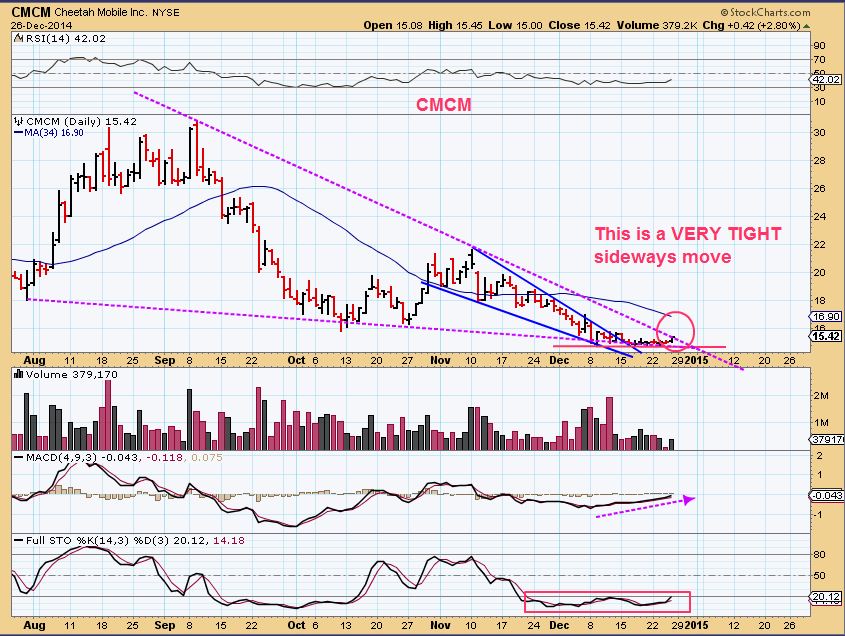
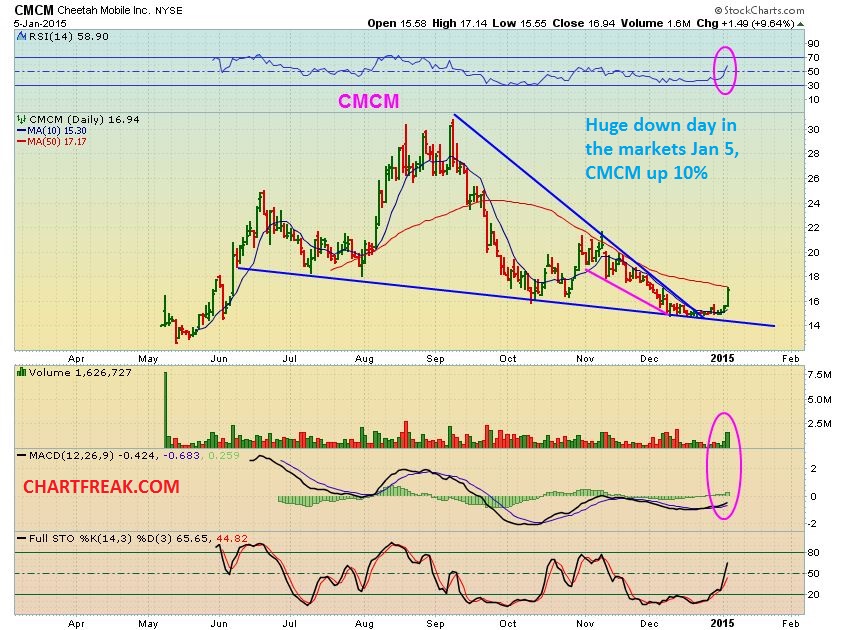
CMCM yesterday in the sell off
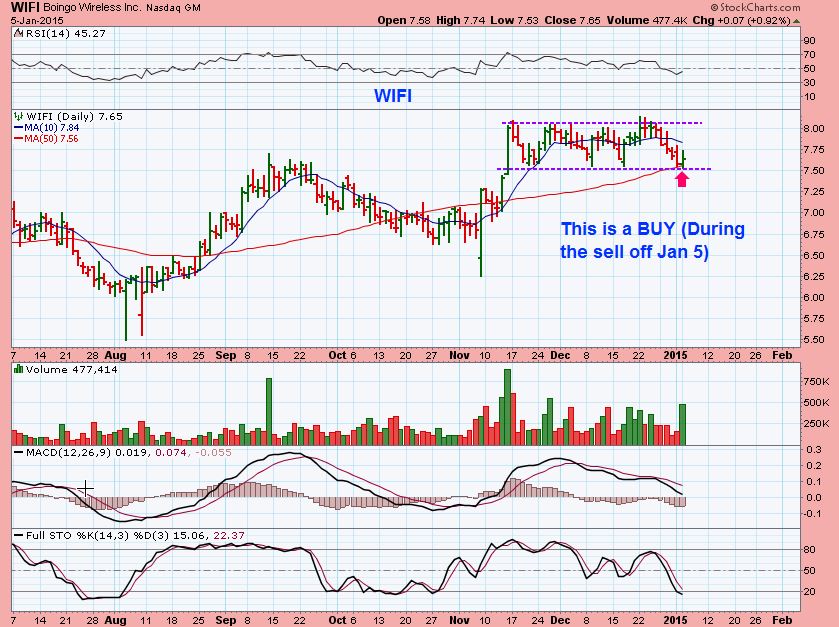
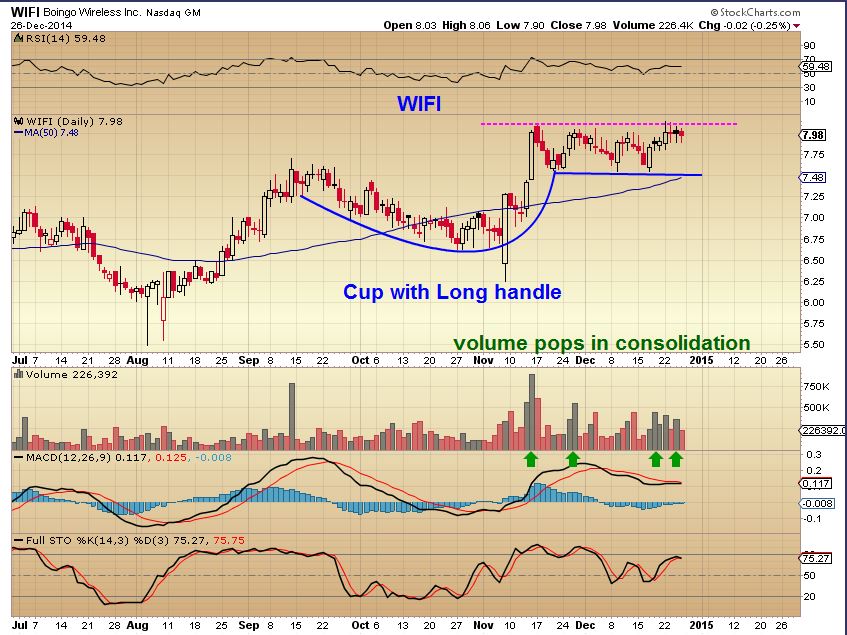
I posted WIFI DEC 26 as a nice set up. WIFI is actually a buy for those interested in the regular mkts.
CVM DEC 26
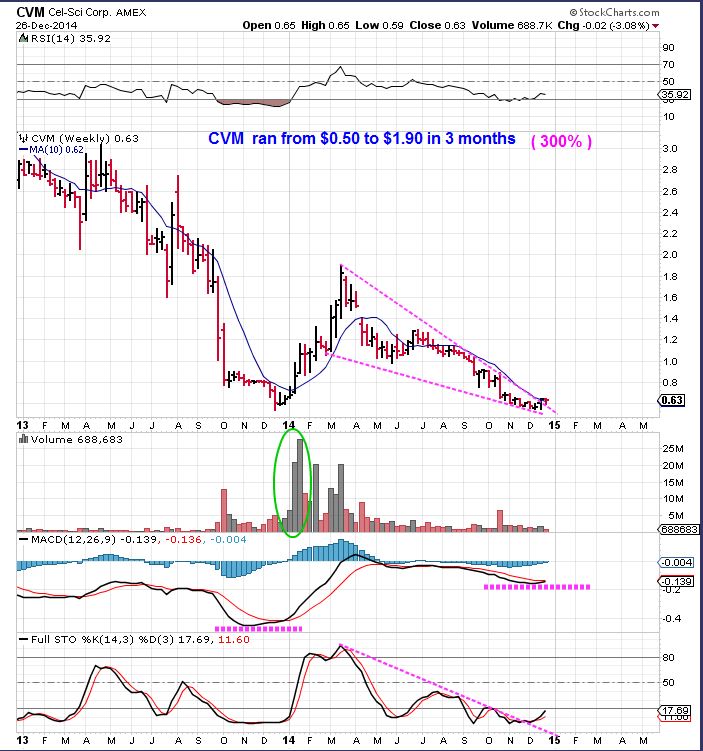
CVM JAN 5
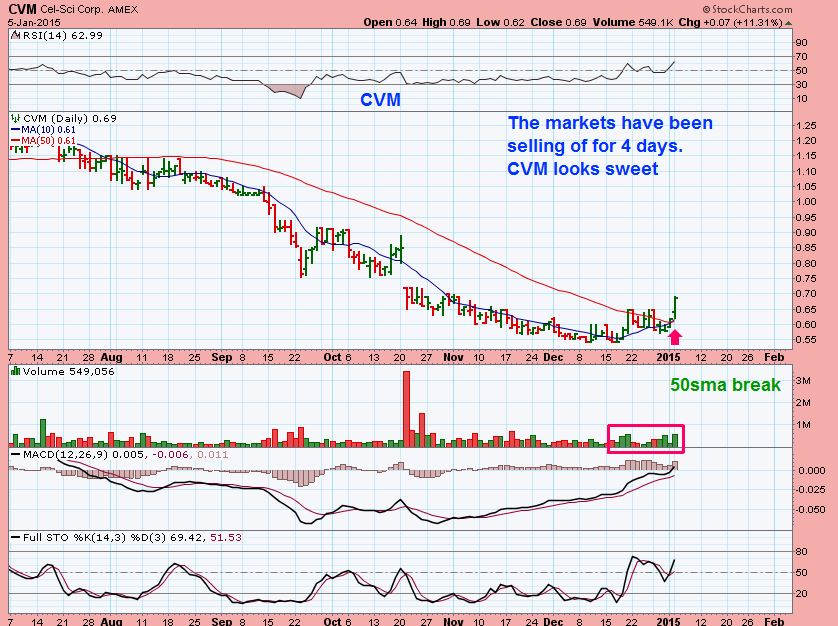
SO I am watching basically everything (VIX INCLUDED), and see opportunity possibly emerging in many SMALL CAP / MICRO CAPS , we will see how things play out there going forward and should have some nice trade set ups if I am correct.
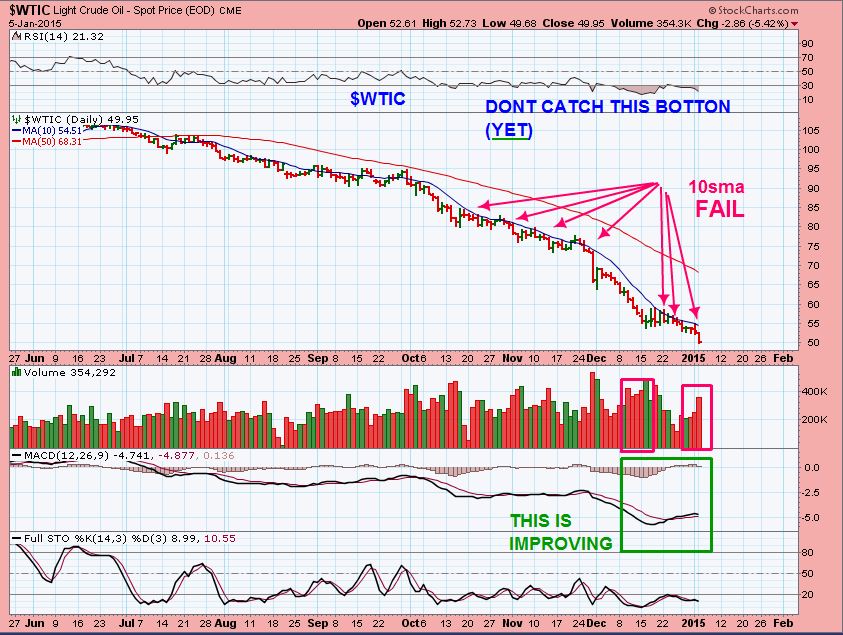
I believe anyone in ENERGY should have been stopped out with a tight stop. XLE broke down yesterday. OIL hit new lows. It “LOOKS” like it could turn up soon enough, but this is a falling knife and energy stocks that bounced nicely (WLL, GDP, EXXI, BAS, etc etc MIGHT DOUBLE BOTTOM and could be looked at then.
$WTIC
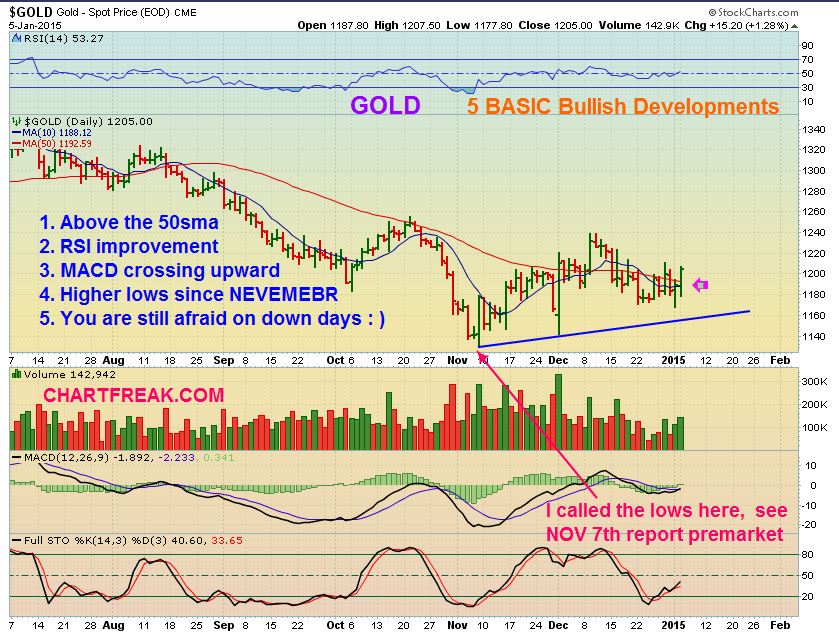
I have been correct with the Metals / Miners ( Many still have doubts, this is good)
GOLD DID bottom Nov 7, GDX Bottomed first.
I cant spend too much more time trying to convince people of that. Some people will miss the best part of the move out of the lows, and will likely jump in after it starts topping out and it looks really bullish. Like the theme of this report, I still see many in other blogs, forums , and newsletters confused and some are still shorting each move up. That is ok….THAT adds fuel to the fire and right now we are seeing Metals and miners building very constructive bases. Some have broken out already . We are still seeing “Fear” by those who ‘bought’ when Miners moved above the 50sma. I get emails asking me if “I should sell now” , or am I selling now?
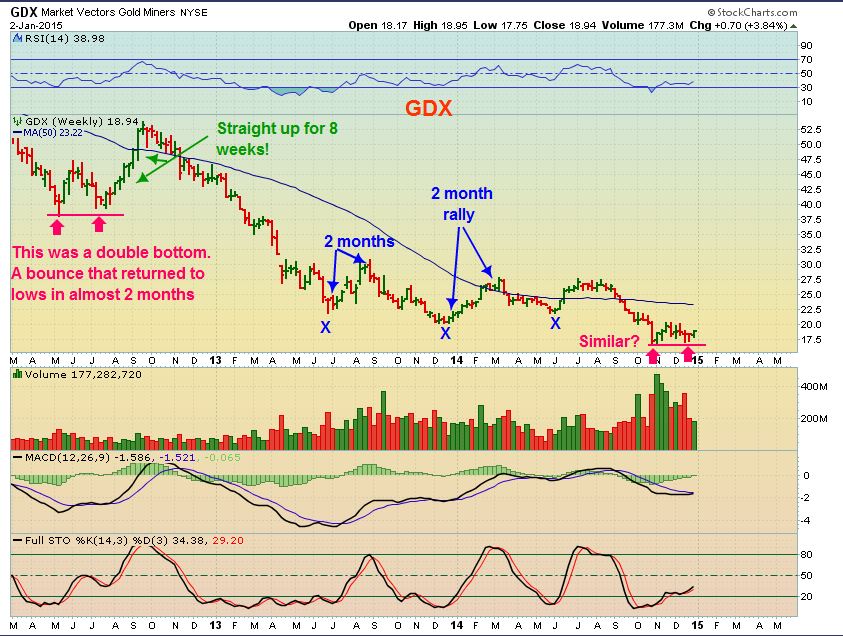
When you look at the charts (Thats what chartfreaks do) you see past ICL’s (meaningful lows) often rallied for 2 months , ( or 8 weeks) after breaking out of bases. The 2012 Rally was not very trade-able, it was straight up.
1. Doesnt our current double bottom base look like 2012?
2. Wasnt this where it just got going?
I am NOT saying do not sell. You are here to make money, if your position is up 10%? 20%? 30%? and you want to lock in gains, PLEASE DO. Trade around if you want. If you are in a stock that gets extended, sell it and buy a ‘lagger’ that is just breaking out. I will show some set ups now.
AUY by request. Lagging, but I think it looks explosive in my experience. HUGE base, break out & back test. A break above the 50sma could really get this going!
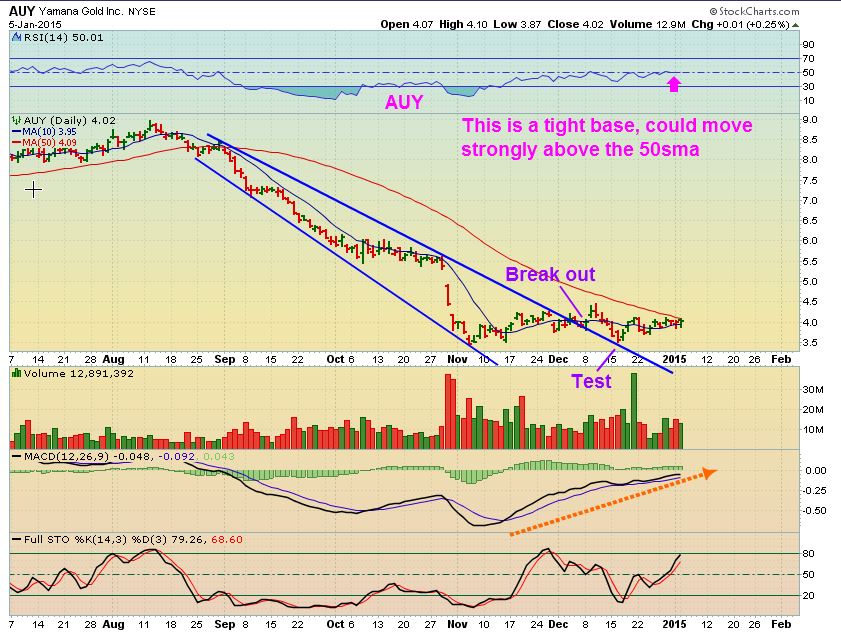
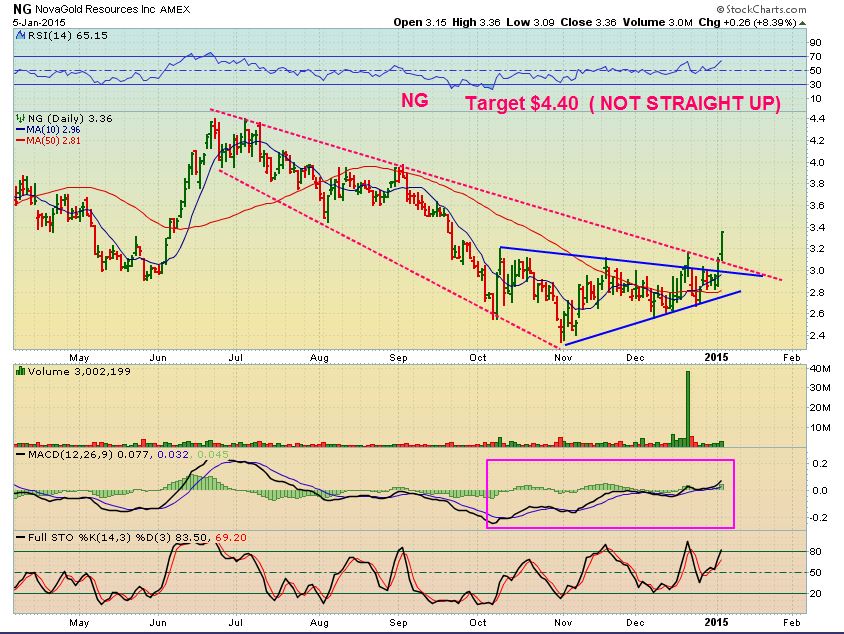
My point with AUY is shown in NG. It was ‘lagging” and frustrated some, but it was really BASING , it broke out yesterday & the day before.
I believe that this will run to $4.4, but buying now I cannot recommend unless you can buy & hold with draw-down and not panic. Why? This “MIGHT” test the red/blue lines. (you could buy that)
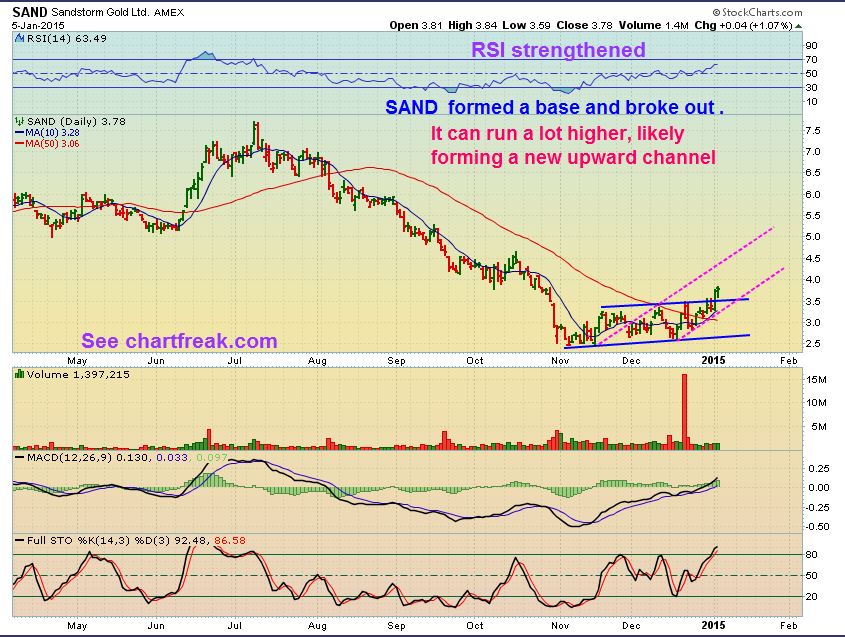
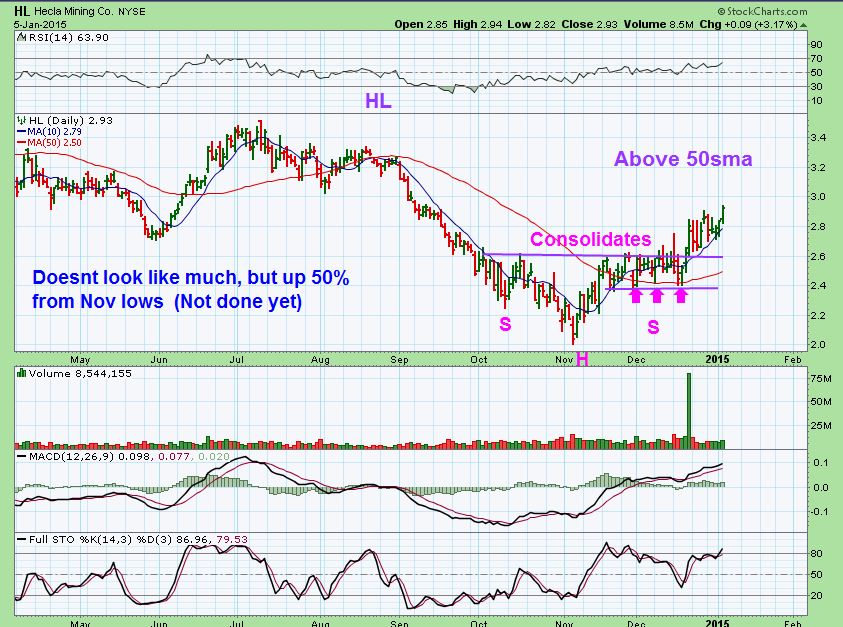
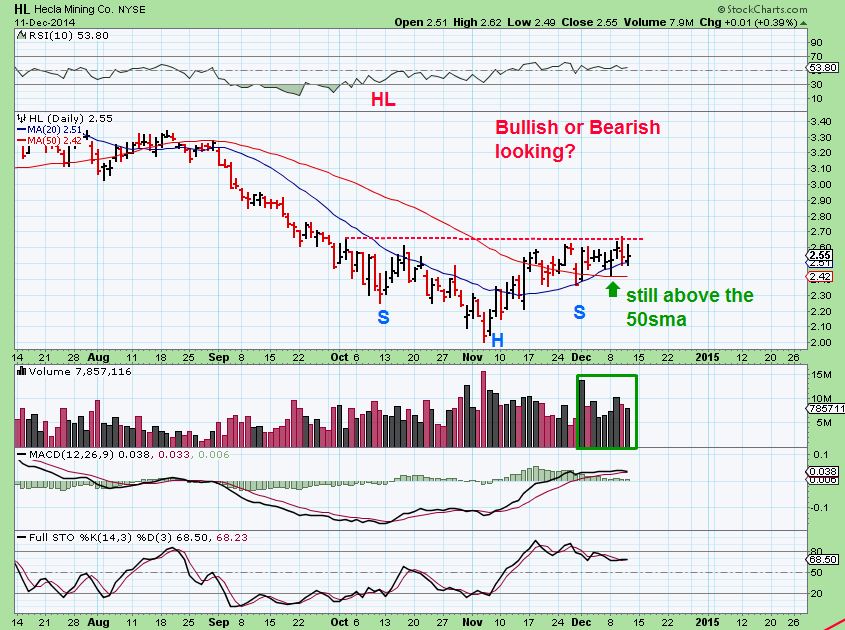
I pointed out the beautiful BASE in SAND, CDE, IAG, HL, etc for weeks. LOOK FOR BASES
HL JAN 5
Remember these? DEC 11 I pointed to that base….LOOK FOR CONSTRUCTIVE BASES
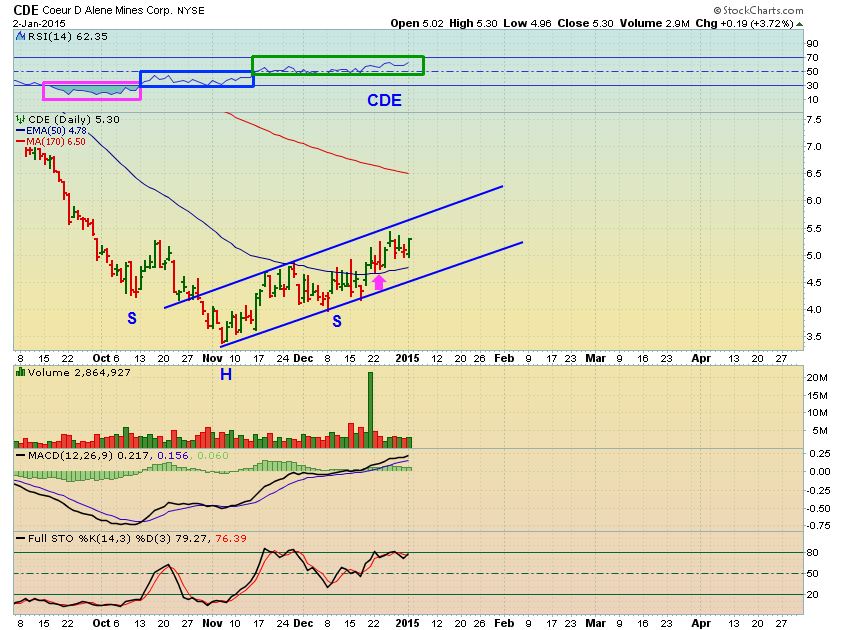
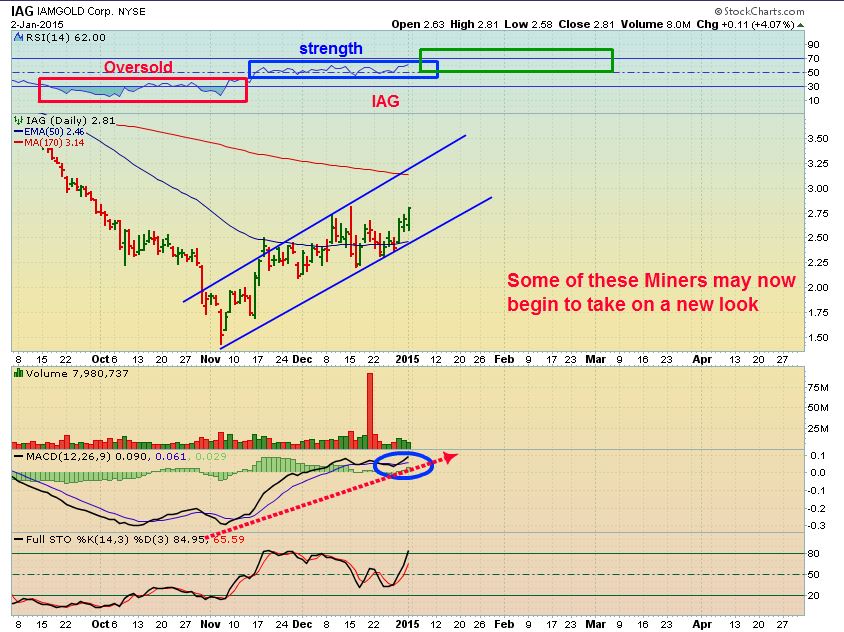
Posted these yesterday – notice that CDE & IAG bases turned into an uptrend . A channel. They “MIGHT” pause at the top of the channel and drop to the bottom (unless it just goes sideways). You can BUY IT at the bottom of that channel .
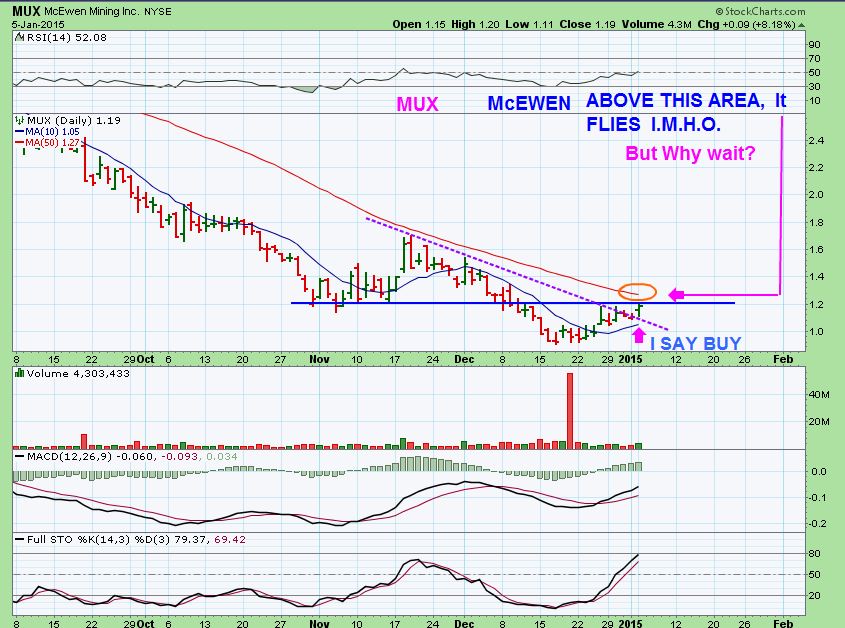
Lagger MUX doesnt look like it moved much, but it was up 8% yesterday and looks close to breaking out
Semi Lagger RBY
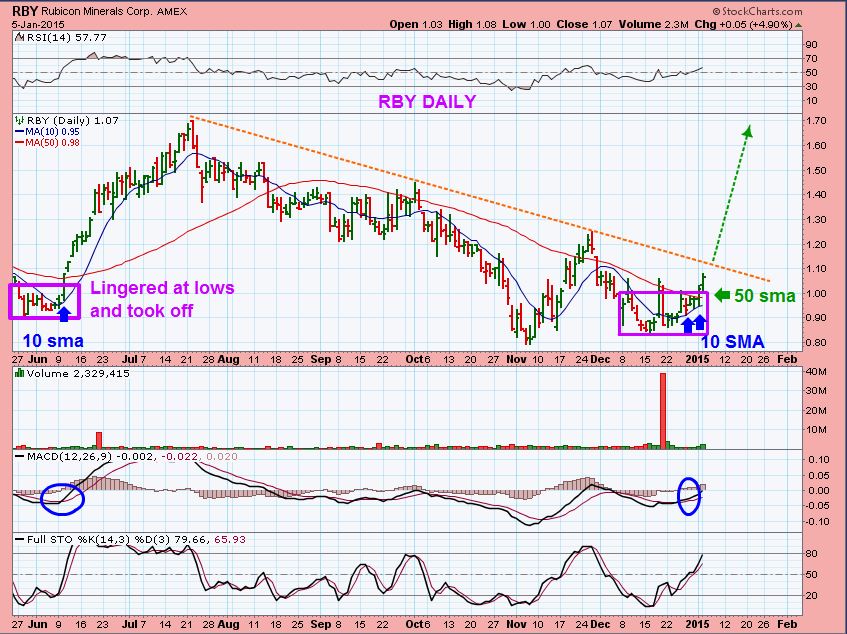
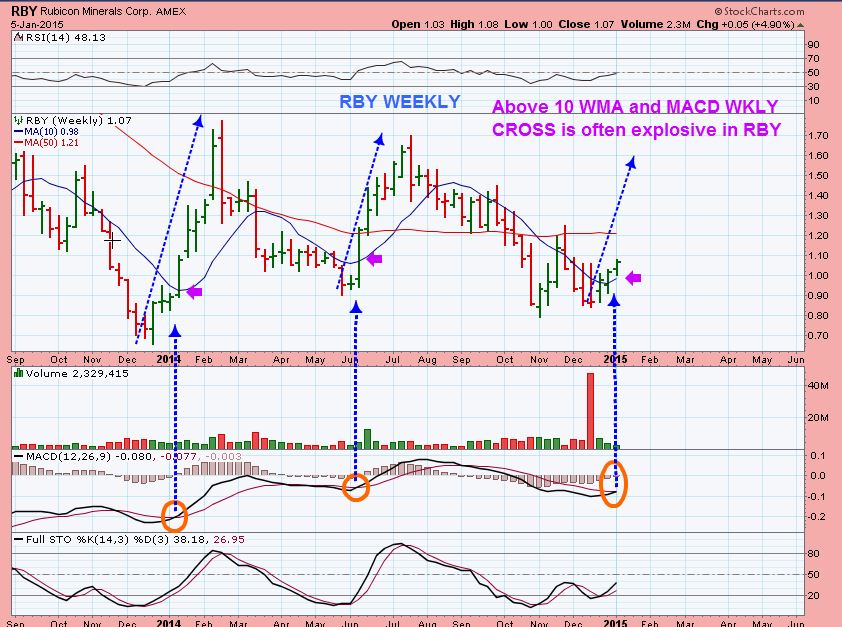
RBY WEEKLY _ in the past it ran swiftly, often green week after week
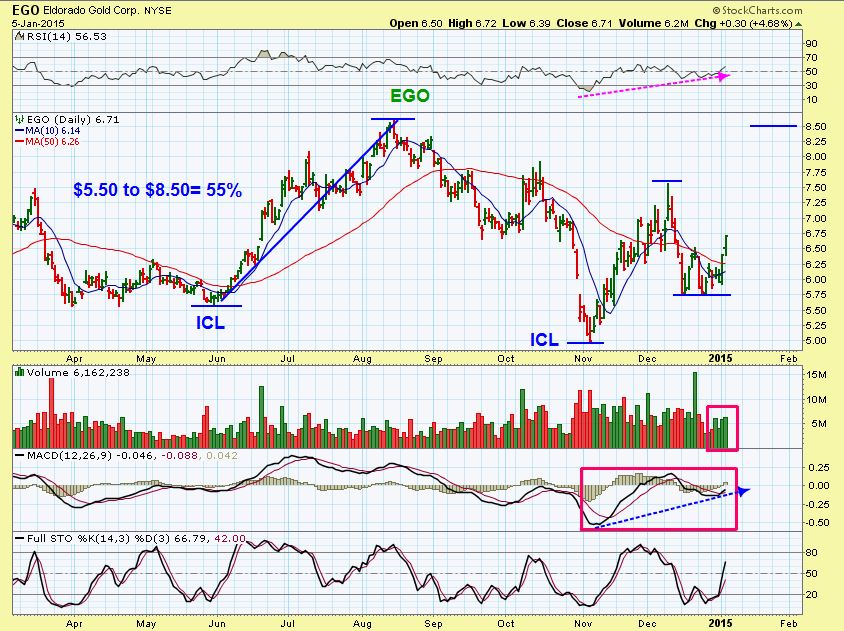
EGO was a buy above the 50sma , but has plenty more to go I.M.O.
YES- THERE WILL BE RED DAYS. NO , THESE WONT GO STRAIGHT UP, but look at the charts that I have been showing you. Scroll back up to HL, IAG, CDE...ARE THEY going straight up every single day ? No. Did they have RED days? Yes. Are they in an uptrend? yes. Build your confidence up by learning how they move. We could have weeks more of these moves . ( One caution: sometimes individual companies can have their own risk. Offering a secondary to raise money lowers a stocks price quickly, an earthquake in their mine, a flood, etc . Who can know? I cant worry about these things too much, or I would never invest. I buy a basket of stocks to spread the risk out . You can buy GDX/ GDXJ or GDX / GDXJ calls on a pullback, etc to minimize risk ) . Also , MINING companies may benefit from low energy costs in their quarterly earnings report, and this could be a bullish bonus too.
I will be watching the moves in the VIX, SPX, QQQ, DJIA, IWC, IWM, RUT etc too, because if the miners rally ends in say 3, 4,5,8 weeks time?? We may have some nice trade set ups to move to in the Small Caps and micro Caps. Thanks for being here !
~ALEX


Alex…thanks so much for the AUY chart! I was about to ditch them this morning but instead added at open and then BAM! If I didn’t know better I’d swear you had an invisible hand in these things. hahaha
Hey Deshy,
I’m glad that you asked before selling. Thats a strong base. Happy to provide the chart and even happier that it popped right after you bought it! WOO HOO! ; )
I made my subscription price back on the very first day you posted!! Thanks to you! Hope your hard work leaves you time to make trades for yourself.
Thanks Wishfulthinking- Man I love to hear that!
It’s taken a lot of time to try to gather charts & show ‘reasons why’ & hopefully build up readers confidence in what this move could prove to be, but it’s been a lot of joy too. There is a good/ friendly group of readers here.
So now I hope some that didnt feel very confident early on can buy some bases / break outs above the 50sma & make some decent profits!
Good morning Alex.
When I look to WIFI, I see in the charts the RSI and MACD pointing down, does this matter?
Thank-you for your help.
It is turning sour now.
Notice that yesterday it had a pretty strong reversal on the 50sma , also with the mkts 0n a day of sell off, today it broke below the 50sma.
The picture has changed, Not good right now
They say the first week or so of trading in the new year is indicative of what will follow on that year. I sure hope so. Should be coming into some resistance in a bit and things may rest or react back some but you never know.
Hey Carl, Good day here for sure , good couple of days actually.
The only thing that goes against that is that last yr (wkly chart) GDX was green the first 3 weeks of Jan. and that didnt help much last yr. I like what I see here, but will be cautious in a few weeks.
Could GDX and GDXJ take some pullback tomorrow, after couple days good run? or is it just skyrocket rest of the week? Took some profits with JNUG, now Im mad that I sold too early 😀
There is a possibility ( No one knows for sure) that these get a combination of short covering and buyers and run right to the 200sma. GDX looks like it could get there in 2 more days, but it also could pause. Once there, it could go sideways and break through, or drop down and be a possible buy opportunity , but again…cant tell here what it will do.
If I had sold and felt that I might be jumping back in ‘chasing it’…or wanted to wait for a possible pullback, I would grab a miner just breaking out & take my chances on a run up there, then switch back to JNUG if a pullback does come.. Here is a chart of GDX explaining what I am seeing ‘possible’
It worked for AUY today
Thanks Alex! After I sold JNUGT I bought RBY, and thought that if we see pullback tomorrow I buy JNUG again. So maybe Im learning something here! Altough RBX hasnt moved very much since I bought.
RBY is a good set up, pushing on the down trend line – it may be next to go.
GORO also was, I bought that on the break today
Hi Alex, sorry to be a little late today, I was busy on other stuff earlier. I just wanted to say that I think today’s report is probably the best you have done on the miners, especially all the charts showing basing and breakouts.
Also, considering the juniors actually made a lower low, would you accept a double bottom as a valid pattern for the miners? On that basis GDX has a target of at least $24 which would take it above 50dma.
Thank You Castelmere,
I have been wanting to do a list of charts for a while now. I hve been showing the ones that bottomed first (IAG, CDE, HL, etc ) repeatedly so that as the readers here see how thy run, they’ll recognize those bases and break outs on the next batch and get involved. “AG” for ex is up 15% right now. WOW!
GDX is above the 50sma , do you mean the 200SMA? And yes, a double bottom in Miners with large divergences is what we’re seeing. MACD at that second low was strong.
Hi Alex,
Sorry, yes, 200dma.
If the pattern on GDX is a double bottom, then the neckline was broken today and the pattern confirmed.
alex,
very good job in detailing the miners and i am thankful for your superb charting. i really need charts on miners, so i am glad you are doing that. My question is in the market though, do you see a rebound soon? thanks
Thanks Marinho.
At this point, it looks a little sickly weak. A bounce here might turn out to be a shorting opportunity, IF we get a bounce.
In my report here today right above the QQQ chart , I wrote “,
I think it looks weak, with a bounce & further weakness
personally, but I want to see how this plays out if we get a bounce.”
The weakness has been evident to me. and again PCLN, GOOG, MSFT, TSLA, ( now even possibly AAPL) other former flyers have been making lower lows, not recovering. Funds may be selling.
Short question Alex, what do you think of EDR? (Endeavour silver)
How looks the chart? Thanks.
Yes, it is trying to push above the 50sma. Once it does, I think it’ll do as AG did when it pushed above its 50sma.
Alex- really great call and impressive analysis. I was long jan calls and today I sold them and bought feb to position for a larger move without fearing the wiggles.
Thank You RM,
I hope Ur Jan calls were gainers : – )
In CYCLES, you can get a pullback around 1/2 way up (1/2 cycle low) but sometimes its just a sideways consolidation (See the June 15 area in the MAY 2014 run up into June top for example) , but the next push up will out do that.
I will discuss it in tomorrows report.
Can’t wait, as I’ve been comparing to January. However that april to june accumulative period, although less volatile then this november to present, may better reflect what we’re heading into now.
hmmm