
Not Much Has Changed
This week is usually a lighter volume / traders going on vacation – holiday week of trading. Not much has changed from Fridays report. Things really have to play out further to confirm our expectations or to change them. In other words…not much has changed. We experienced another peoriod of selling similar to what we had in Oct. Many twondered if the Sell off would end the year ugly and then suddenly , right on time …
QQQ wkly
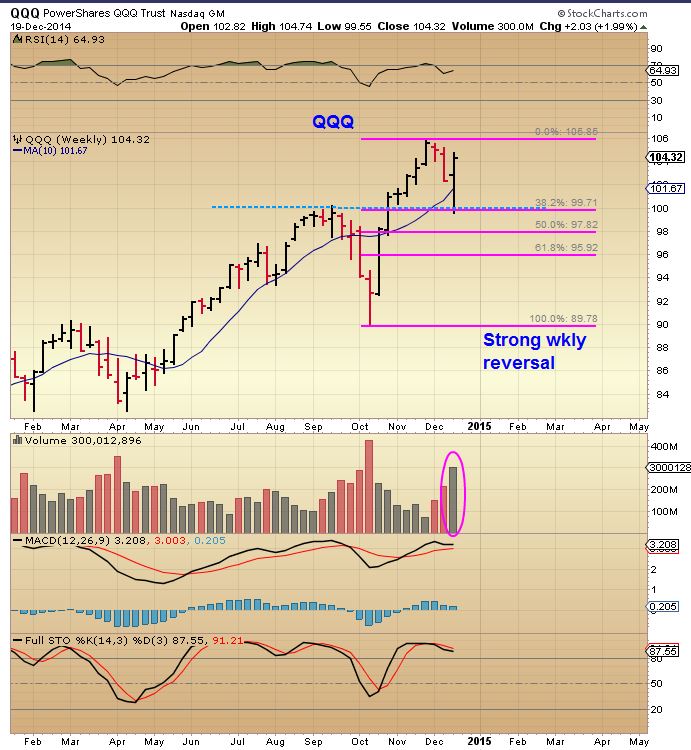
Its a strong reversal on a weekly basis and take a look at the next chart…
AUDIO http://www.screencast.com/t/EOKGZDYyGZQE
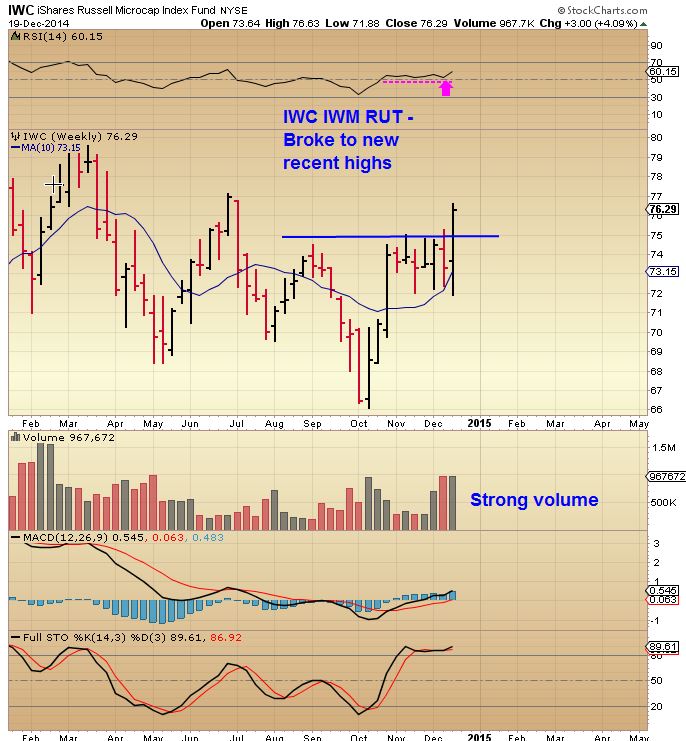
While the SPX , DJIA, and even the very strong NASDAQ hasnt hit new recent highs, the IWC, IWM, RUT are breaking to new recent highs , so the markets remain in that “Buy The Dip” mode
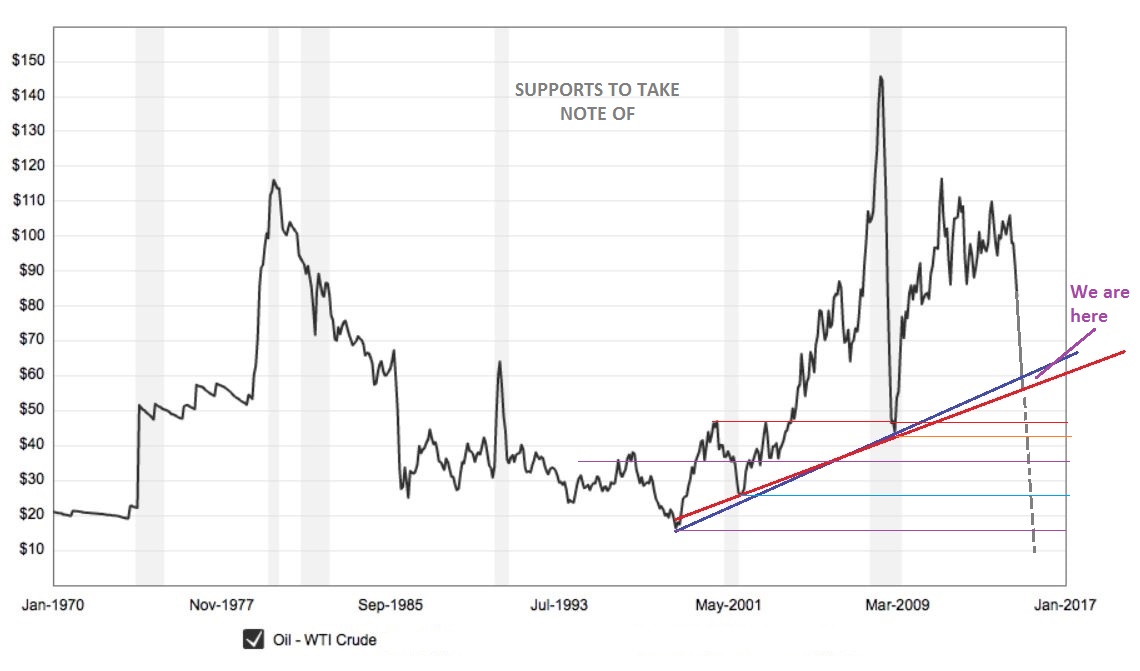
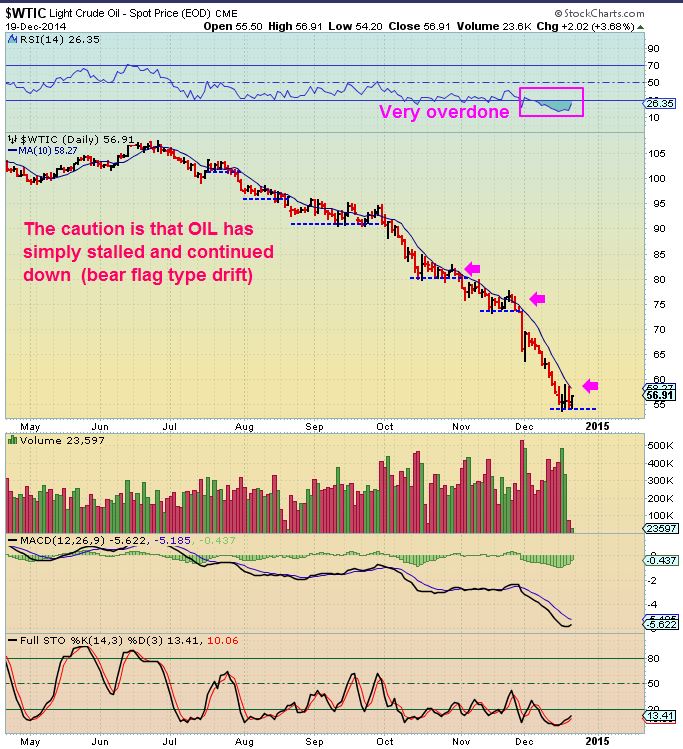
I mentioned that OIL is due for a bottom. I posted a couple of long term OIL charts like the one below, and we are seeing a pause in the selling.
CAN I BE SURE that the selling will not resume? I cant , but the XLE and many energy stocks have had some nice bounce back moves
$WTIC WKLY reversal type candle
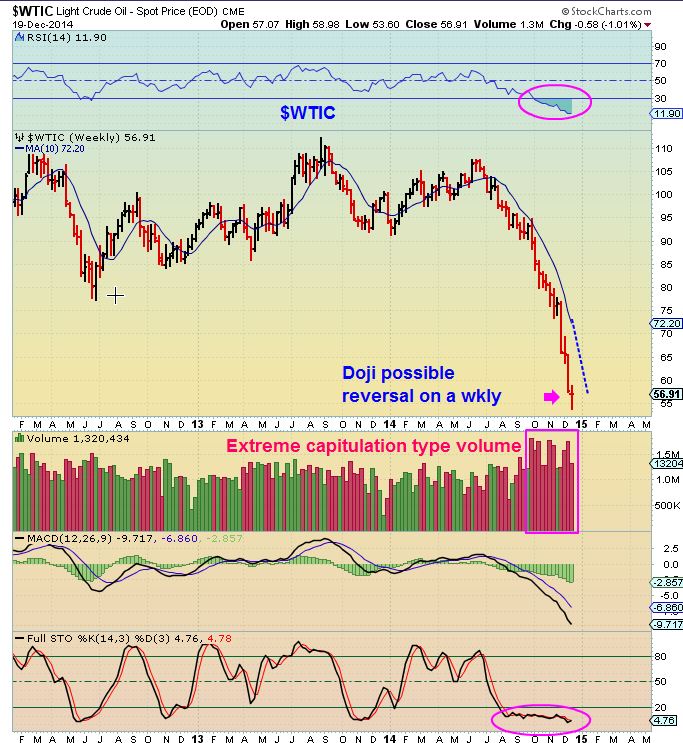
WTIC DAILY – EXTREMELY overdone, but has gone sideways in the past . Look for a convincing close over the 10 or 20sma
I have mentioned many energy stocks in the past such as GDP, EXXI, BAS, WG, WRES
They have bounced nicely . Look at NBR , this company provides offshore platform work over and drilling rigs , and MUCH MORE in this area.
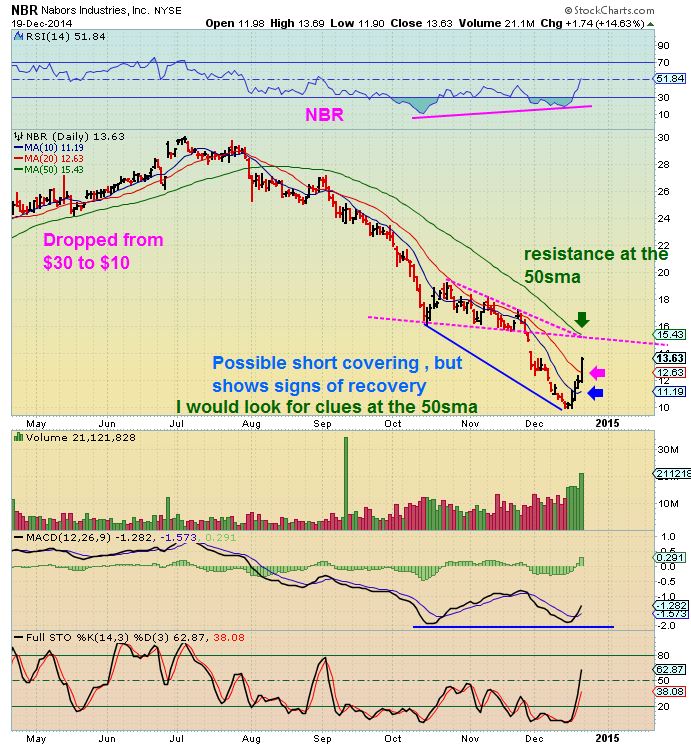
SO some are asking, are these bargains still? My answer is that when first mentioned here, they were great ‘trades’ off of lows. Some have almost doubled, some are up 50%, but at this point we can have that situation where we get a v-shaped bottom or a double bottom. With a possible double bottom or even a ‘higher low’ double bottom, you risk draw down if you enter here.
Look at BAS as an example:
BAS
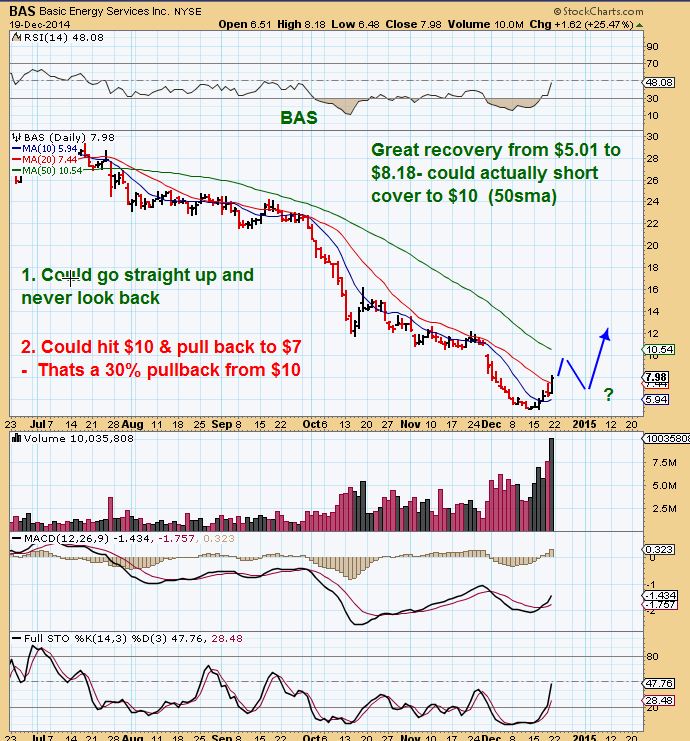
My feelings on this area are that after this recent run up (yes it could run away and continue) it is riskier to enter here and not allow a pullback to see how it reacts going forward. Some who insist that the risk is worth it because they feel that price will run away and not look back, just enter as it rises above a moving average and use a tighter stop. BAS you could’ve entered here above the 20sma, and you use a stop to protect downside surprise.
GOLD & MINERS– Nothing has changed (Except some Miners got hit hard and with no news. GPL, RBY for example , took a hit and I cant explain it)
Here is what I continue to see . The $USD . I mentioned in a prior report that I expect the dollar will roll over this time. A healthy pullback, not the death strike. I posted this
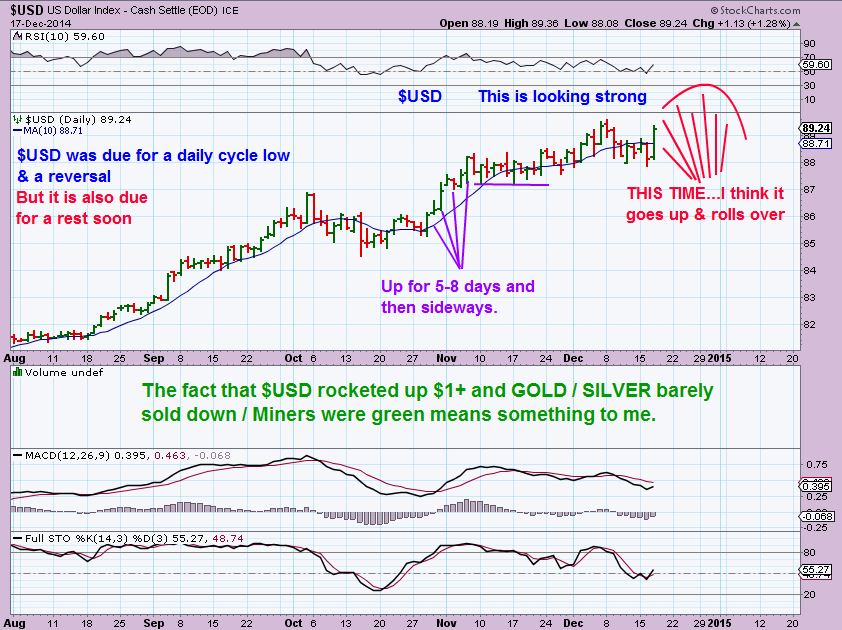
Notice that when the DOLLAR ran up recently (And its at new highs) GOLD was ot adversely accepted. Lately it would’ve made sens if the $USD was at new highs, Gold would be at new lows. See chart below-
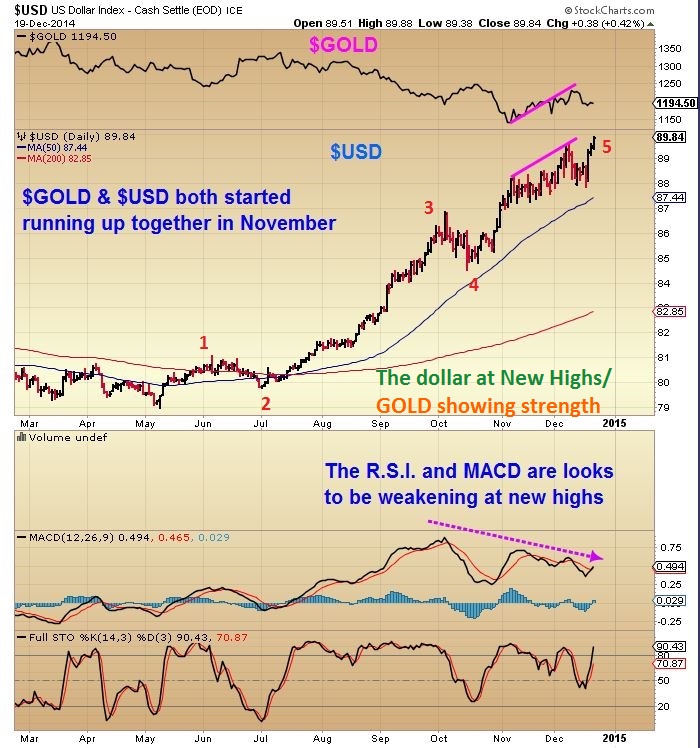
So if the dollar is going to rest and GOLD is showing signs of that , if it does roll over for a bit, GOLD/MINERS should get that 2nd daily cycle run higher.
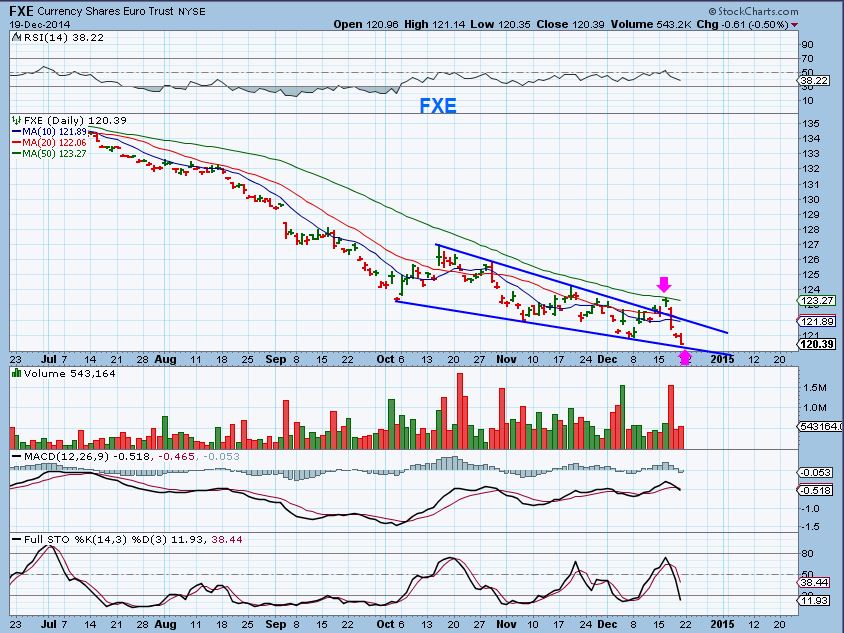
Before this became a pay service, I pointed out just how oversold the EURO was. I mentioned that it could drop to $120, and the FXE would drop to 120, but then both should move higher. I thought that this would push the dollar down. Here was my euro chart in case you missed it then.
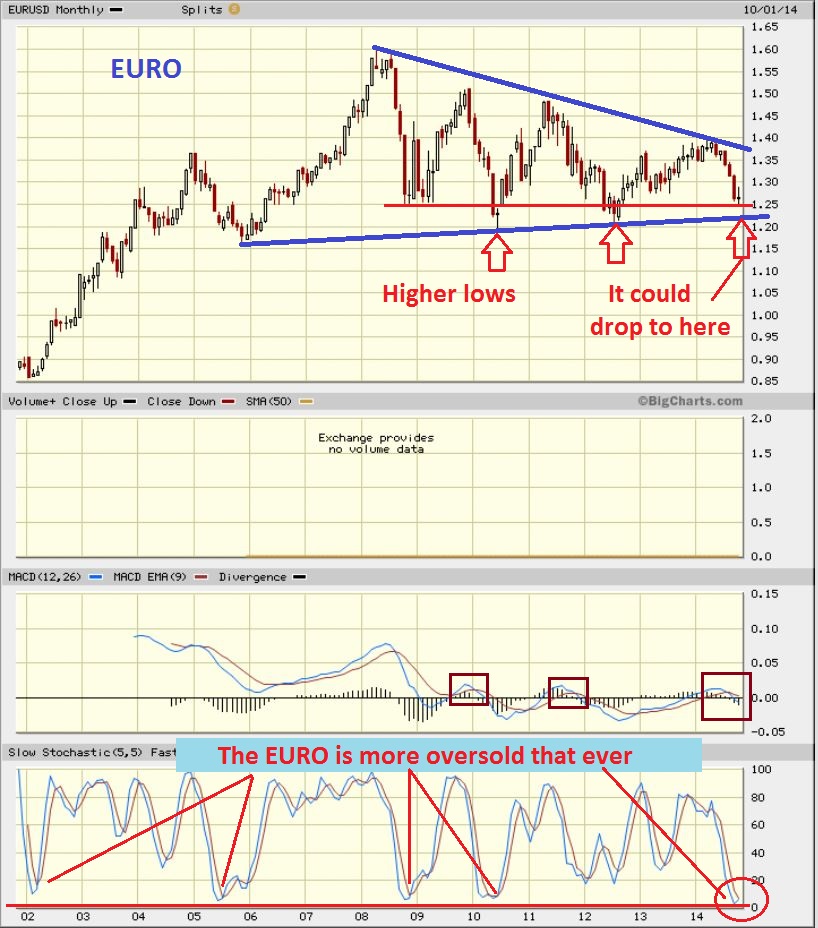
I expected a break out from a wedge in the euro , but I mentioned that It could drop & fill a gap below first. Well, we got the break out first, but it was a false break out & THEN we dropped and filled that gap. SO maybe now we get the real break out higher soon? The dollar would turn lower and again, Metals could rally.
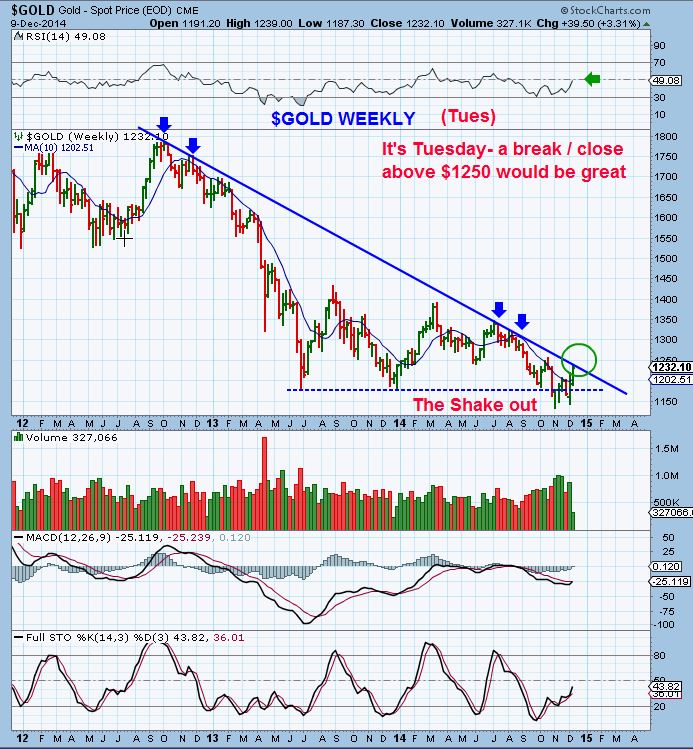
People are beginning to worry that gold is dropping, drifting. I posted this DEC 9, and it is exactly what you see now.
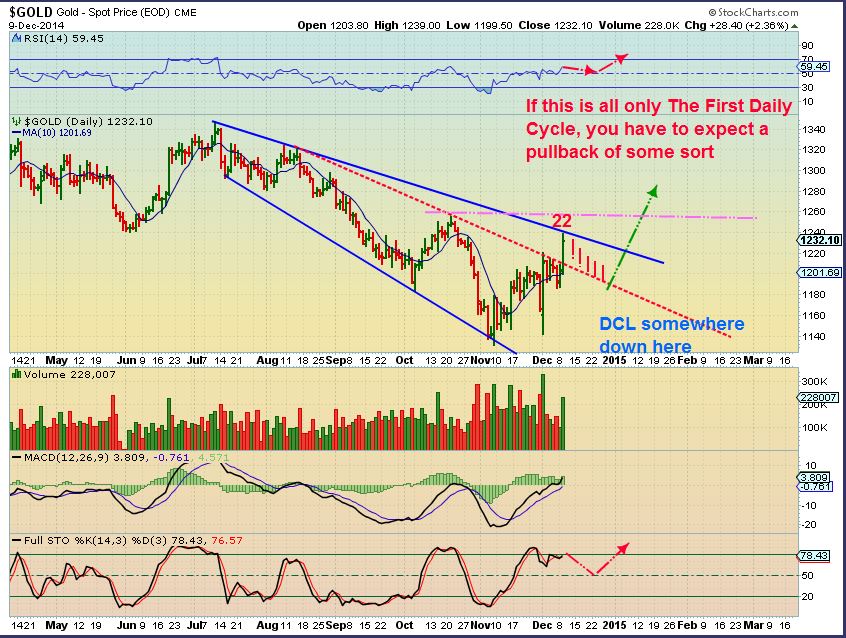
Things in Metals and Miners cycle wise are still fine I.M.O.
The dollar is at new highs and GOLD didnt get slammed down. Timing wise, we would like to see GOLD rally higher, again from DEC 9 I pointed out what I’d like to see as confirmation on a weekly chart . This chart is NOT damaged in any way .
MINERS and the high volume at the end of Friday. If you re-read my report that day , I had mentioned that on triple witching (or quad witching ) high volumes show up at the end of the day. DO I understand it completely enough to explain it? No- It hasnt become a significant factor in the past. As someone who studies volumes , I do not like to see high volume reversals at tops, they usually cause follow through and further selling as though buying has peaked .
However, I have on occasion seen evidence of an attempted stop run at the top, where holders SELL at the break to new highs taking profit. Volume is sellers taking profit at a break of new highs, but then buyers actually step in and buy these shares, holding price close to those highs . The stop run at the top doesnt work because price isnt allowed to fall. Again, The sellers shares are scooped up & this is bullish – showing high demand even at highs.
Was that the case Friday? I cant tell because of triple witching options expiration and possible re allocation of funds , etc …but notice this.
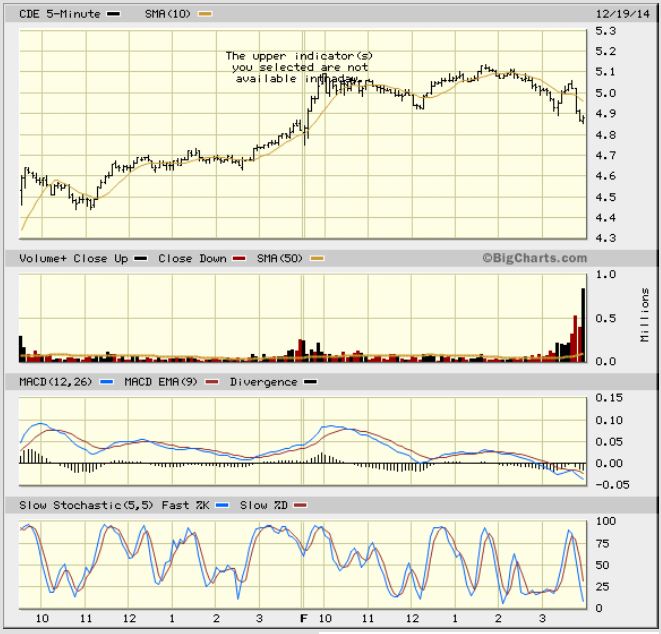
CDE 5 minute Volume of almost 1 million and price moved 2 cents?
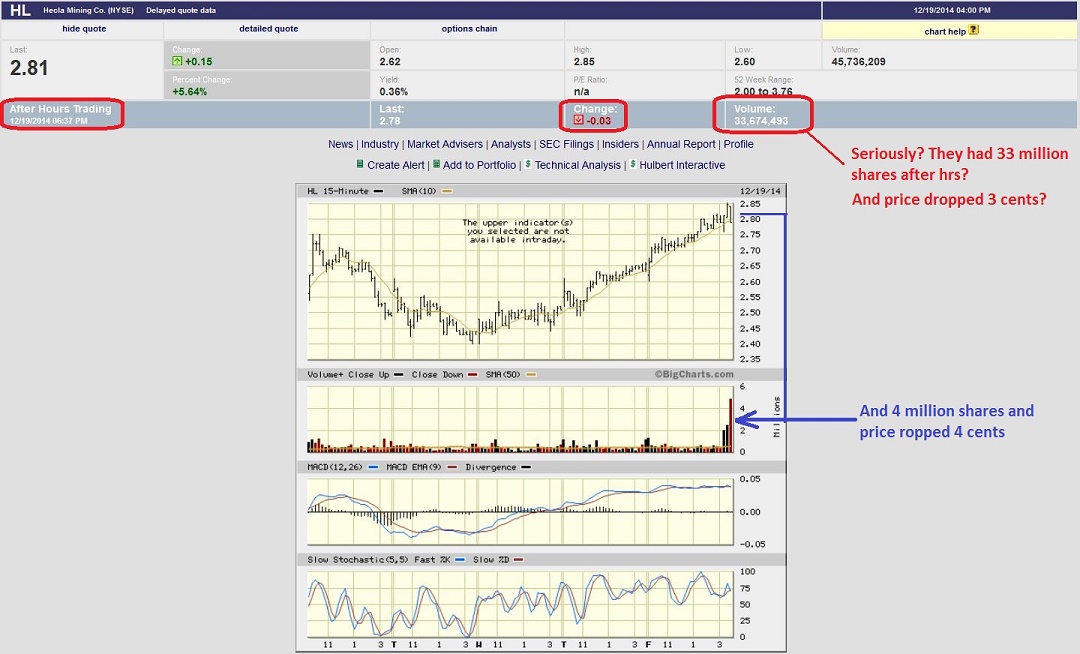
HL – same thing. HUGE almost unreal volume after hrs and it dropped 3 cents?
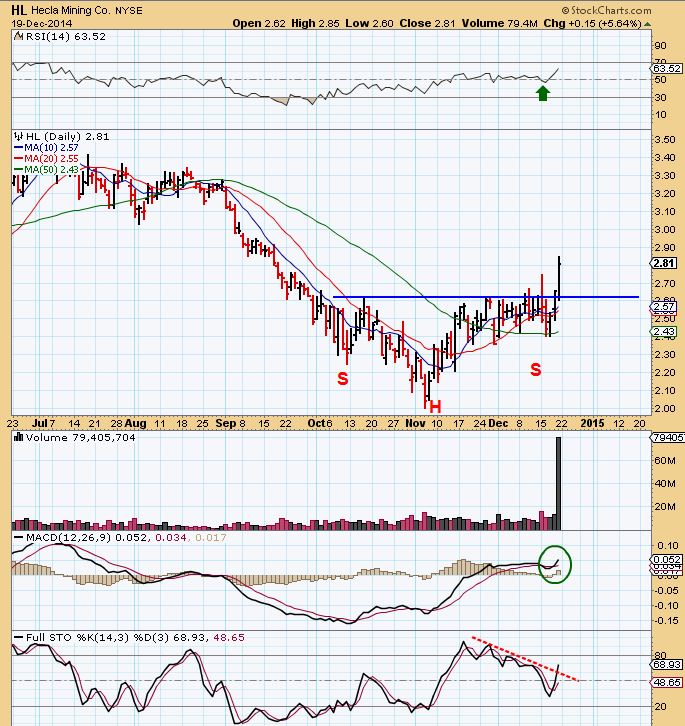
SO at this point, I loked into it further this weekend and The volume has a bullish slant if anything. It would show as a high volume break out in many cases.
There is NOTHING bearish about this chart , even if it pulls back today if it stays above the break out
Some miners stocks broke down (GPL, RBY , ) – I cant find news on them, so possibly Funds have left them to buy others? I wouldnt double down or buy them as rock bottom prices, I would look for a few stronger looking ones and I’d have a basket to minimize risk. I expect another leg up and at this point nothing has changed, as seen from the above report.
This is a holiday week, shortened and usually really light volume because traders are going on vacation ( I said that in November and we had extremely high volume the day after Thanksgiving, so we will have to see how this play out). Basically nothing has changed in my outlook. Thanks for checking in and we’ll just have to see how things continue to unfold. Miners have lead the way up at this point, a slight pullback wouldnt scare me either. Best wishes!

Can you please spend time doing a thorough analysis of NatGas.
Plenty of people had been talking about winter cold and seasonality being strong for Natgas. I have listened in on stocktwits to some natgas guys that were bullish , but honestly I havent liked the looks of it from my view and have just stayed away. I couldnt say that it was definitely going to fall as it has, but it didnt look as good as others were seeing.
Also as far as people claiming seasonality…2011 into 2012 NATGAS fell fast into April lows. 2013.
Nov 2012 to Jan 2013 NATGAS fell to lows also,
I’ll look into it , I have not been able to post charts in the comments section lately. I might try in a minute if you want to check back.
See if this chart attaches . I will try to look closer and see if I see anything to report tomorrow.
Any Damage done on the spike down now ?
I’m sorry Jay, there are few things down today. Spike down in what specifically? Thx
Just in case you mean metals or miners. What I am watching :
No damage yet. We wanted GOLD to break to a slightly new low and reverse & start a new daily cycle. That has happened (except we still need the reversal).
Miners like GDX look similar to the first daily cycle ( We dont want a break down in Miners to new lows, since it appears they already put in their Daily cycle low. )
Thanks, Yes I was referring to GOLD/Miners
Would like to get into AG…wait to see if it get’s to the 10ma? or what is a more likely target on this pullback?
Hi Curtis
There’s a chance that it goes lower. A trendline & 20 sma are below . While AG , HL, CDE and a few others still look fine , I’m watching the selling in GOLD / Miners too and just want to make sure that if it escalates in any way, we dont break prior lows. GDXJ down 5 % – so With that in mind you might want to wait for a reversal before buying?
Since GDXJ made a new low last week, likely retest in region of $21.40?
This is now getting ‘uncomfortable’, because the break down in GDXJ and recovery was encouraging. A swing low formed in Miners at these lows and a swing is formed when the price goes higher than that candles highs. Today price is dipping below the recovery. day .
How much of this is tax-loss madness do you reckon?
It is notable though, that the COTs are opposite of December last year, when a Jan/Feb rally ensued.
This time round could mean a drop.
The C.O.T. for GOLD matched last MAY JUNE ICL (lows) when GOLD bottomed in Nov . The C.O.T. It isnt as high as it was when GOLD topped in July, but thats rather irrelevant at this point. It is higher enough to matter I suppose.
Have things changed now regarding the miners? – doesn’t look good again.
Hi CarlN
Looking at Miners , I had drawn this chart for GDX. The new daily cycle should have started and should NOT be undercut. It is getting uncomfortable seeing the miners dip down to the daily cycle low, because it was in the right ‘timing’ for that low to occur. A dip below that DCL would be day 32 (still possible) but also may be a failed 2nd daily cycle in miners. A failed daily cycle would have a lot of time to continue down.
This needs to be watched closely. Its not as comfortable back down at these lows.