
Weekend Update
Another week has come and gone, lets do a review and see what it may tell us we might expect going into the next week of trading.
That was a fast week of selling in the $SPX , wasn’t it? : )
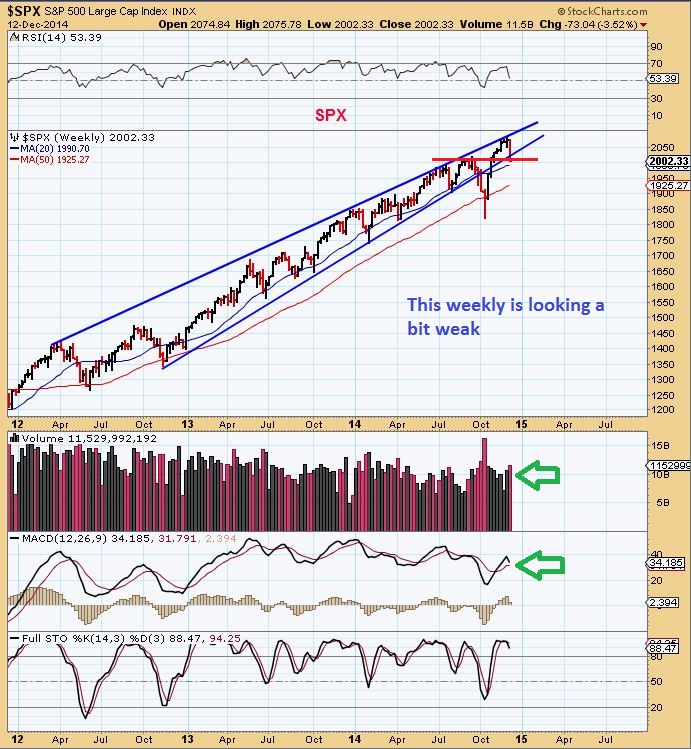
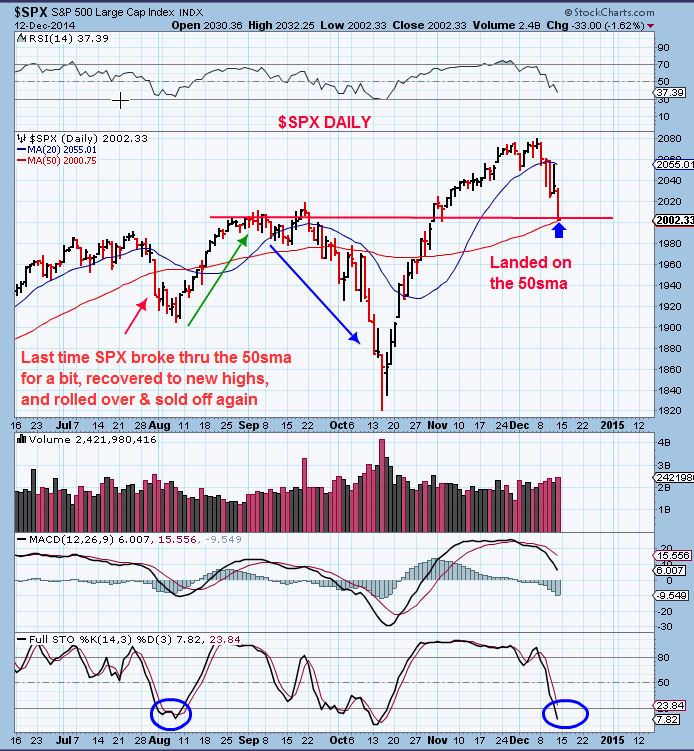
I had pointed out the first area of support last week and we already arrived there Friday…
Last week was fast and heavy selling for 1 week , but notice how it also happened in July & then reversed the following week .
Should we expect a similar ?
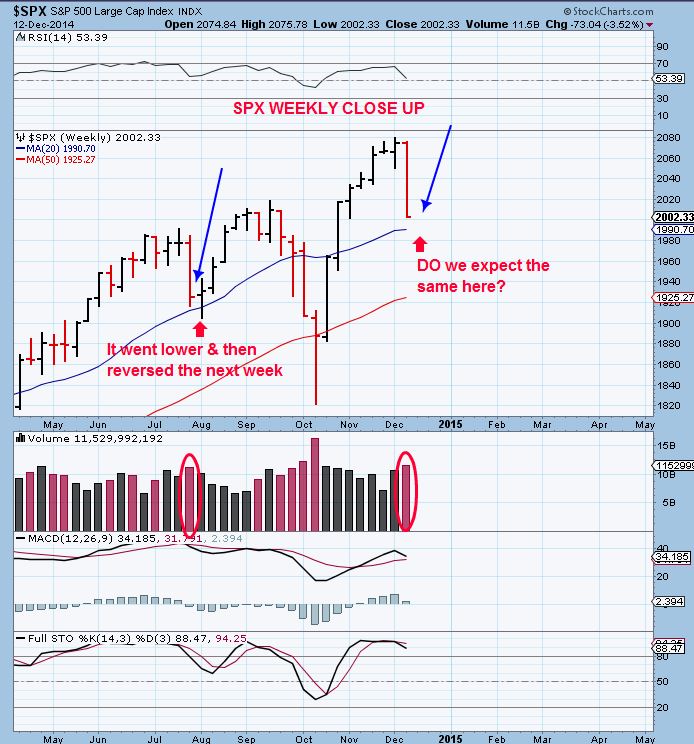
MAYBE / MAYBE NOT
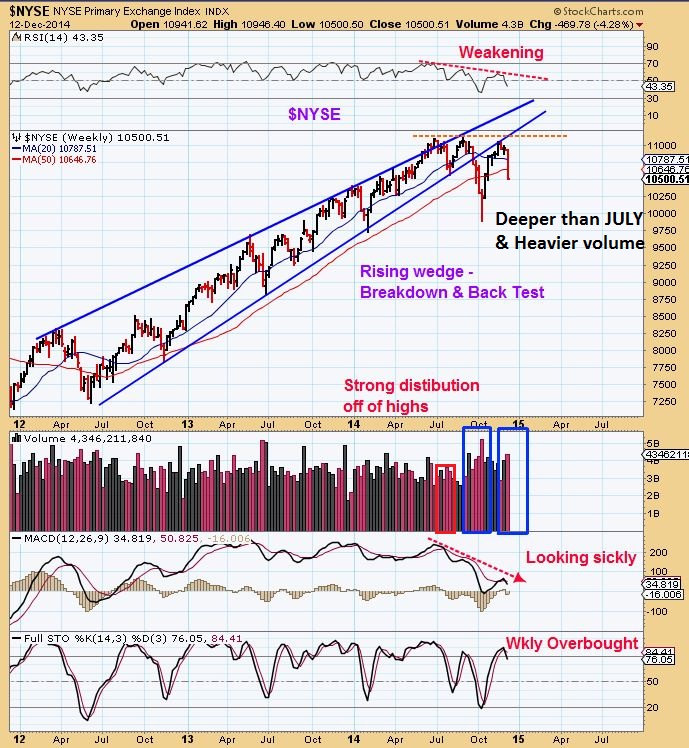
The reason I am cautious is because of what I see in the $NYSE.
Weakness in many areas (MACD for EX) & last weeks selling was also worse than in it’s July’s sell off. It looks like a break down from a wedge and a ‘backtest / failure’ to boot.
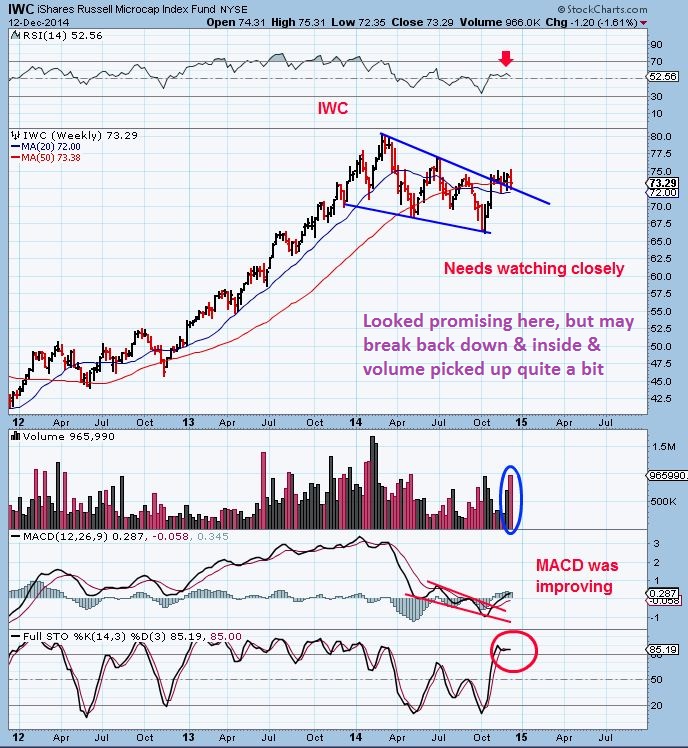
IWC recently broke above a possible bullish flag that I had pointed out, but the heavy volume sell off last week threatens this recovery too.
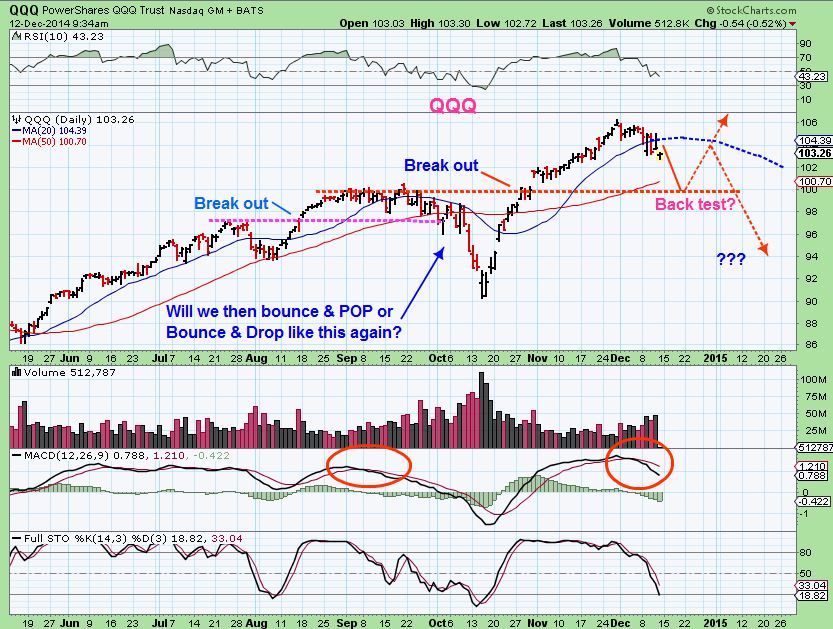
The NASDAQ has performed the best and this Dec 12 chart actually remains valid, but the markets do need to be watched closely, even if we get a bounce.
IF I WAS ASKED to post a possible long position other than MINERS, could I?
Yes. In fact , I was asked to do so, so I will with this warning.
The set ups look good here, USE STOPS – I leave it up to you to sell small gains from a POP? Ride with a trailing stop? Etc, but SELL if it drops for a loss
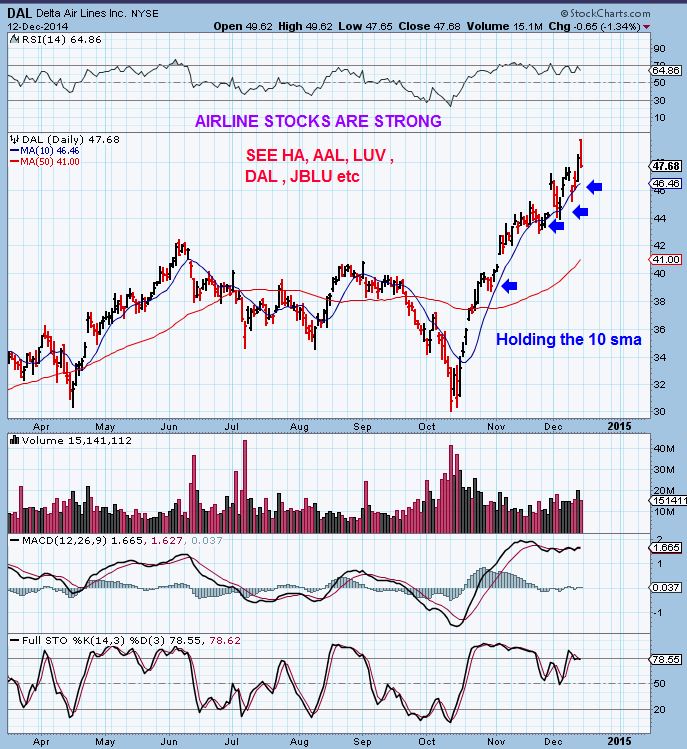
The best looking stocks ( benefiting from low gas price) are airlines. They are barely selling off , just dropping now towards their 10sma! So buying a pullback in DAL, LUV, HA, JBLUE , AAL, SKYW and so on is so far paying off. The weekly 10wma may be a buy target. So far the 10sma is holding up price even with the sell off. Here is one example:
DGLY – I showed this chart recently, possibly to buy the pullback
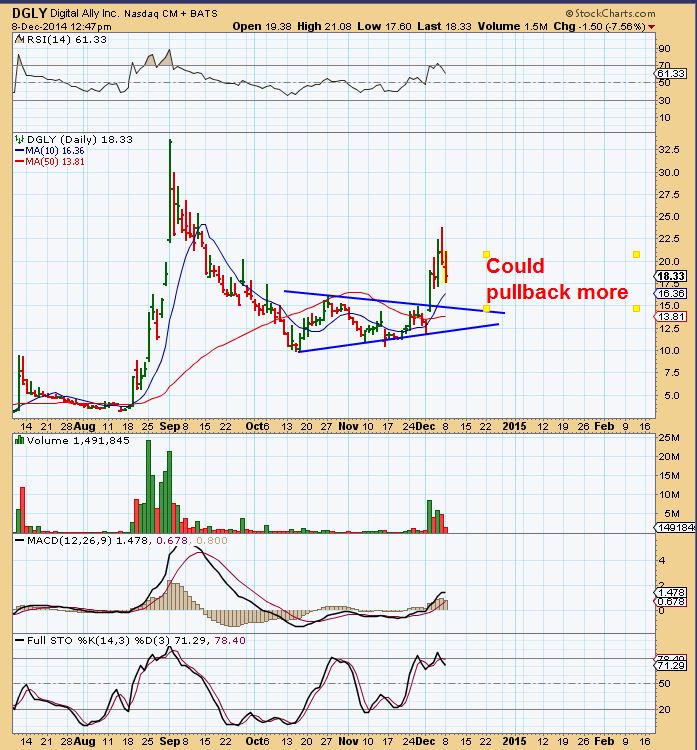
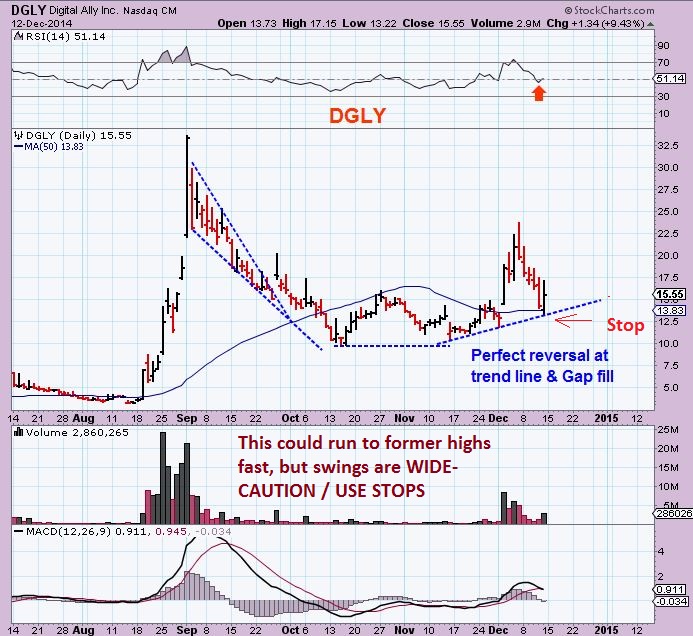
We just had a nice , pretty much perfect gap fill / trend-line reversal. It still could be bought when you consider the potential upside IF THE NASDAQ doesn’t crash down.
Also I mentioned JRJC is trending higher. I showed this .
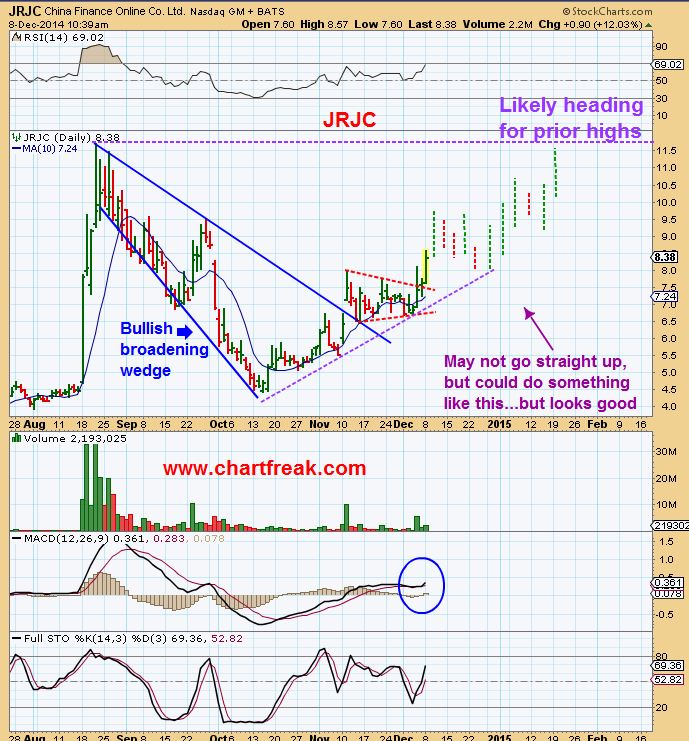
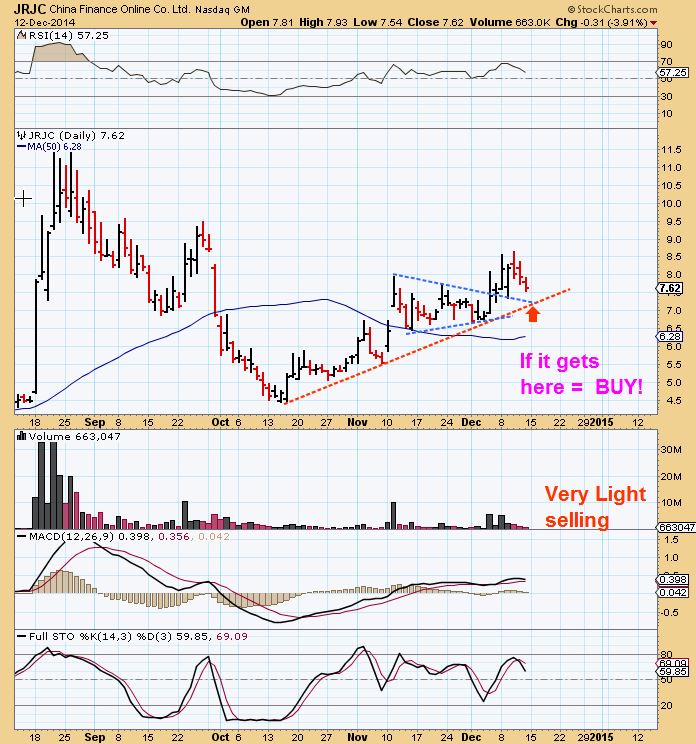
JRJC is ALMOST at a likely support & BUY spot. It wasn’t hit hard during the selling, very light volume.
Tough call for a stop with the 50sma so far below. Your stop would have to be slightly below your entry / below that trend line. If it falls to the 50sma –you are out, because it’s important to save principle. If the markets sell off hard, this could drop with the rest of them.
SO the markets will need to be watched next week. I have no idea of knowing if we sell off further and reverse on FED WEDNESDAY?
Bounce Monday, Tuesday & Wednesday and start another leg down after FED WED? CYCLES indicate that another new high should be possible- time will tell.
SPX DAILY is a tad oversold & Landed on support & the 50sma, but it broke further in JULY before recovering.
MOVING ON.
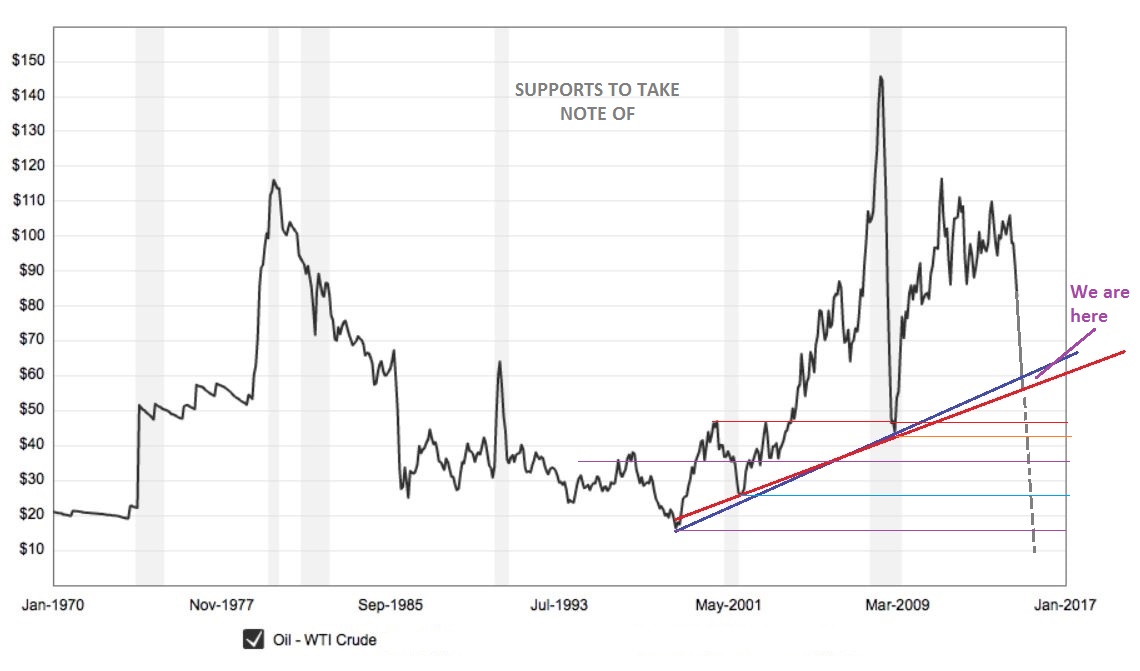
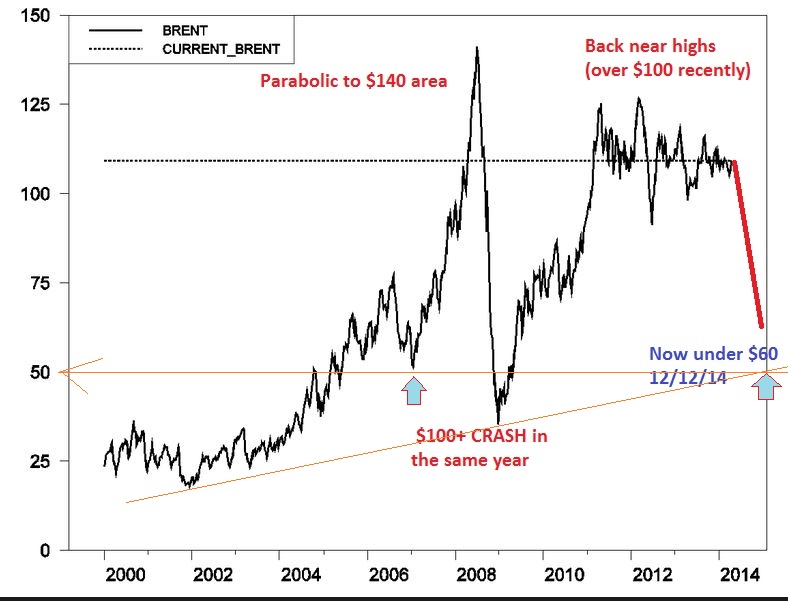
Did you know OIL was caught up in a steep sell off? Oh yes, below $60 now! It is near support in a few areas, I actually expect AT LEAST a bounce very soon, but you can see from measuring the 2008 sell off, OIL can just C-R-A-S-H! These are basic charts I threw together. I dont plan on recommending buying any oil stocks, but I think some of these will short cover and bounce Very Strongly. I cant recommend that risk to readers here. Emotions get difficult in crashes & bounces.
AND ON TO THE METALS/MINERS
I have said almost all that I can say . I can show a few more aspects of where they are now and then Time will reveal the rest.
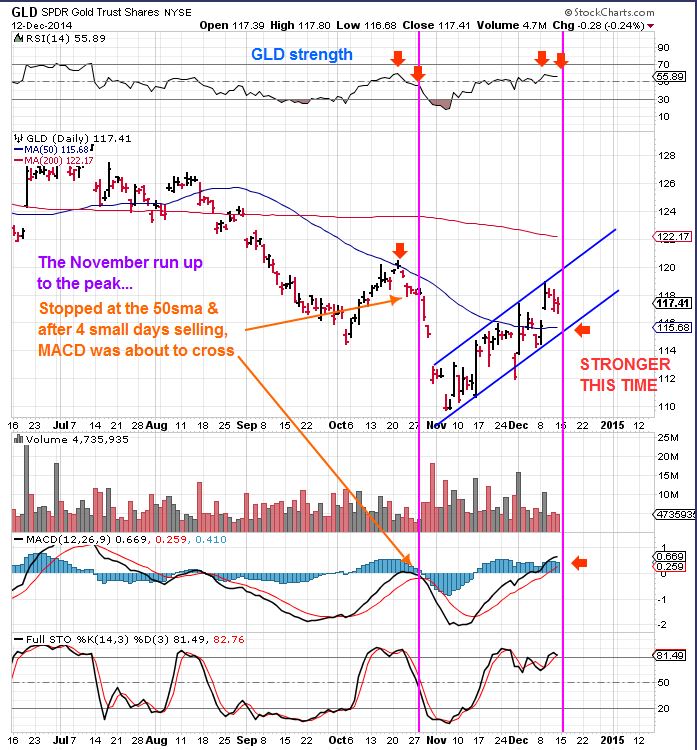
In Nov, Gold ran up and looked good, but then rolled over. Could this be the same , or are there differences?
GLD – Lets compare to the November Run up.
1. That four day dip in November off the top turned the RSI down and MACD crossed already.
2. Recent 4 days dip shows strength in those areas
3. Rejected at the 50sma
GDX IN 2013 bottomed in 29 days after a trend line break
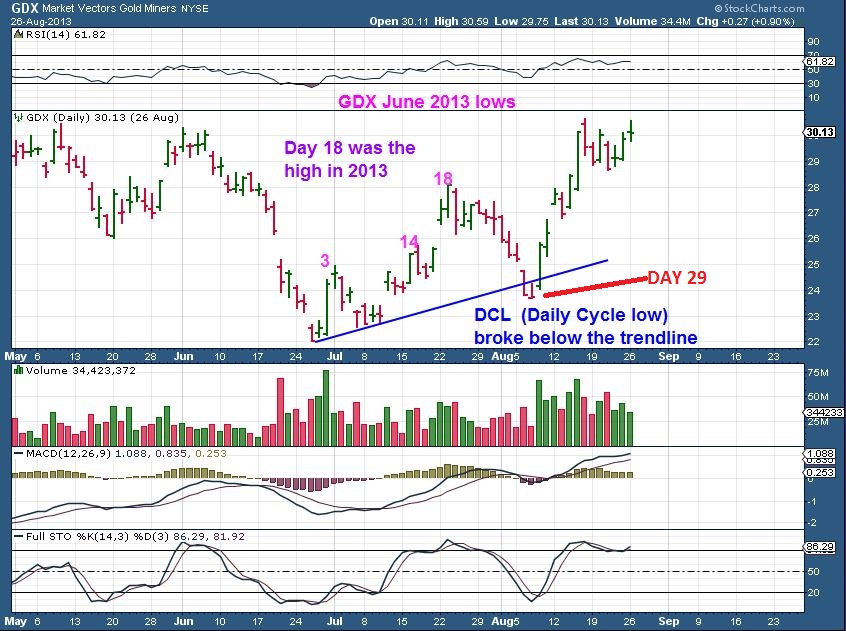
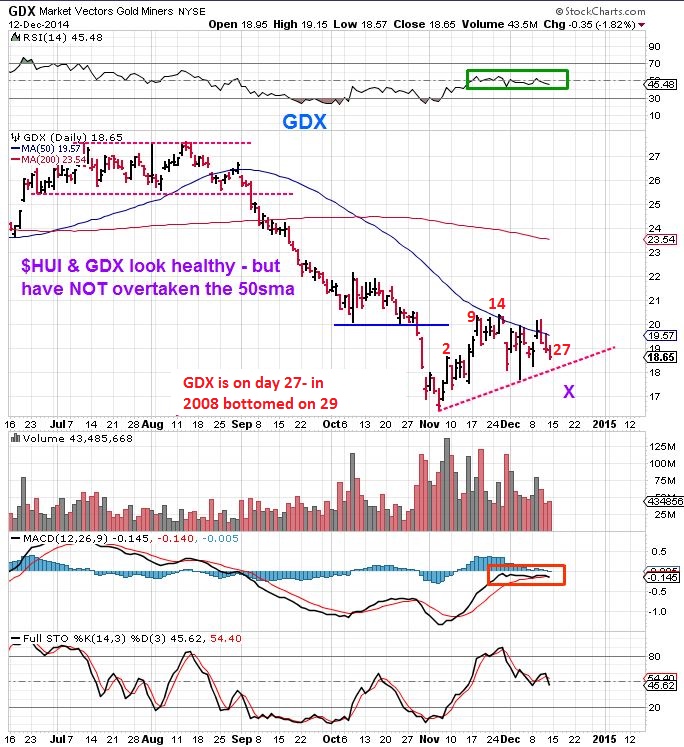
GDX is now on day 27 – Day 29 falls on FED WEDNESDAY ( interesting anyways)
I wanted to look at GDX 2008 lows for 2 reasons.
It had a strong reversal like GDX now, and then it broke those lows, but also dropped to almost touch the lower bollinger Band. This is similar to what we see in the GDX now.
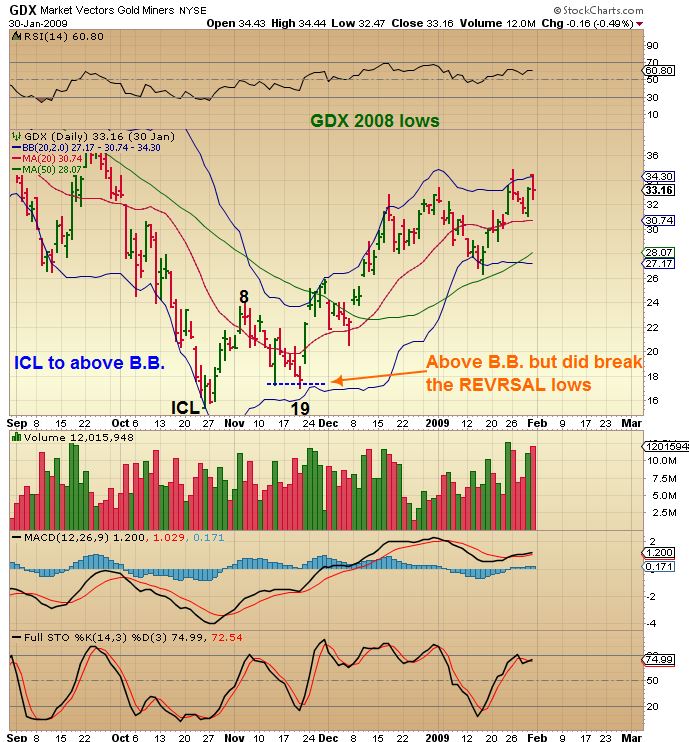
Notice above that GDX in 2008 did NOT break Oct 2008 lows.
“GDXJ IS WEAKER Than GDX ” (I am hearing that a lot, and it is true. Why are Juniors weaker and did that happen in 2008 lows? Well, GDX was in existence in 2008, but GDXJ was not, so I decided to just look at some “Juniors” of that time and see if they appeared weaker than GDX? My own basket of juniors showed they were much weaker until the recovery gained legs. Notice…
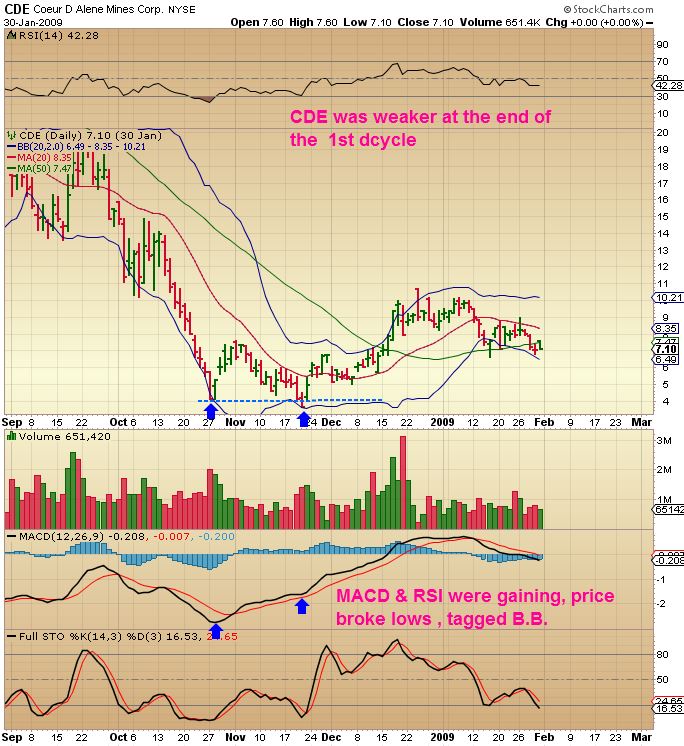
CDE 2008 – ACTUALLY BROKE THE OCT LOWS, then recovered.
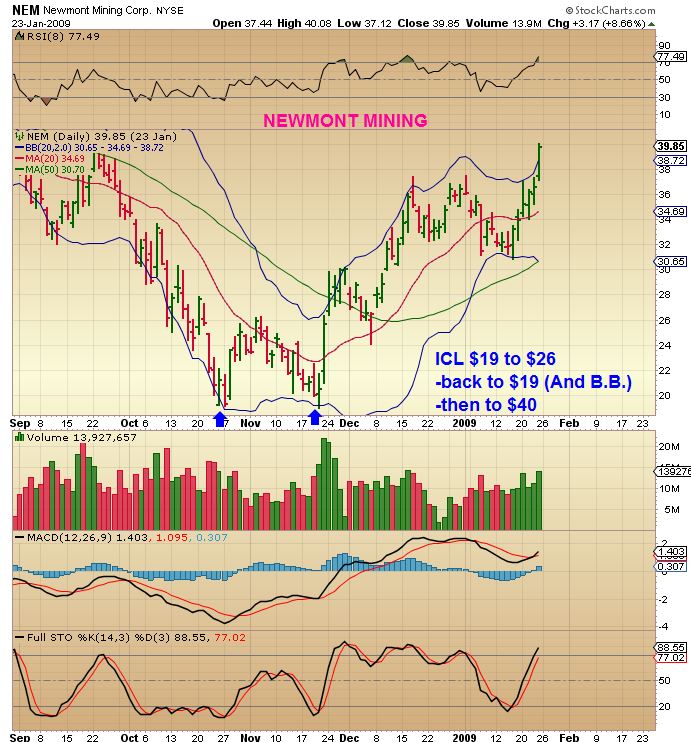
NEM broke OCT lows and tagged its lower Bollinger band, remember that GDX did not.
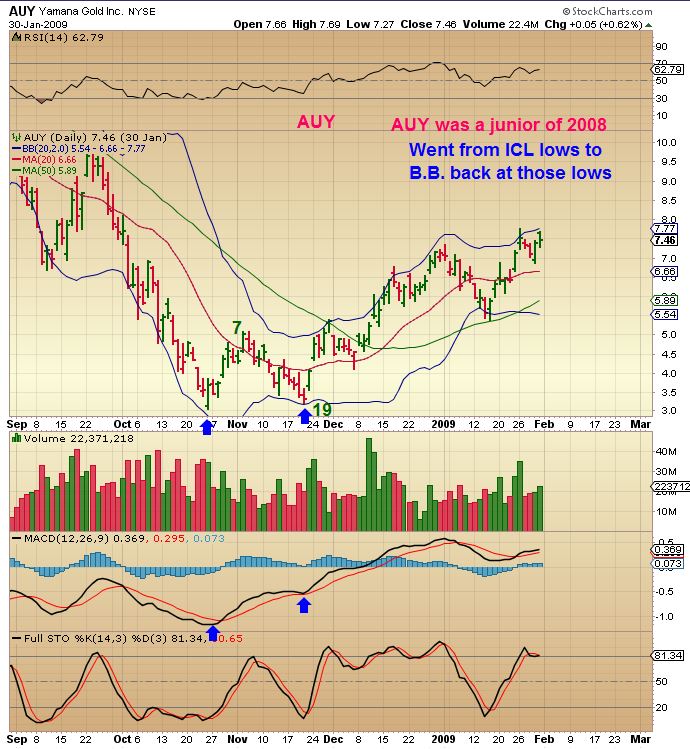
AUY was a junior then and almost broke lows and also tagged the lower Bollinger Band.
THIS looks like GDXJ now, therefore There IS precedence that a mix of MINERS dipped much lower in 2008 lows too.
I wanted to show something that I also noticed in the above stocks . When I checked Stocks at the 2008 lows, for many in the second daily cycle, the 20sma crossed above the 50sma. see the above charts.
Right now we have some stocks that have already done this too. SOME Miners are currently showing this type of strength (As I have mentioned before). SO I will just show you
CDE NOW (Read the writing on the chart)
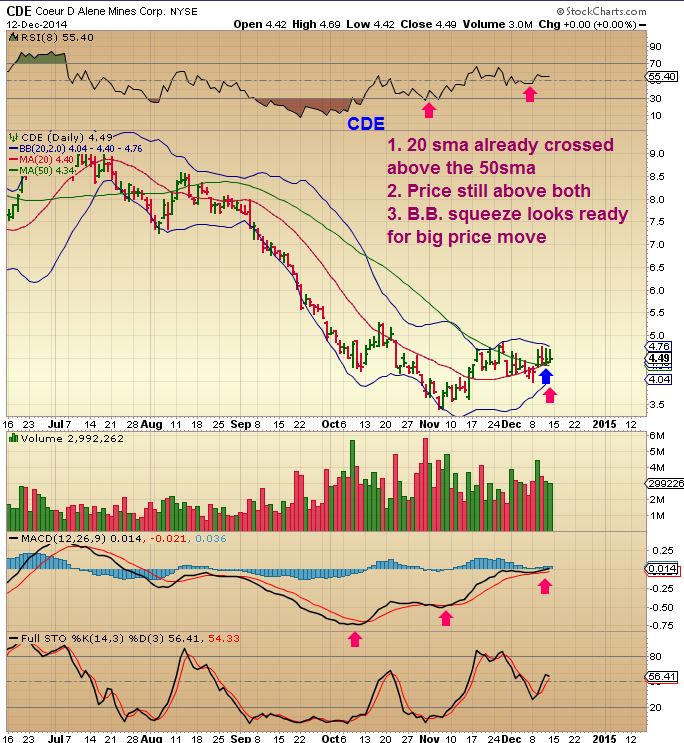
SO again, I cant say after this review that something is out of place. People were worried at the lows of 2008 too. Nothing looked right. In the deep sell off of 2008, GDX looked like it does now, almost at its lower Bollinger Band. Gold acted similarly. GDXJ did not exist, but when I looked at some Junior Miners then, there were some that actually broke below the ICL (Meaningful ) lows and recovered. They tagged their lower B.Band , while GDX didn’t. I see this happening now and GOLD has acted strongly.
Those are your market reports as of Dec 12. We have FED WEDNESDAY this week, so get your helmets ready? Best wishes!
~ALEX

Maybe first a fill of that gap on GLD to make a R H&S albeit rather sloppy before going higher?
The gap is in line with the 20sma, and just about filled on the gap down today. I’m wondering if its going to just be some back & forth, no real direction until Fed Wednesday.
The commercial shorts are starting to pile up again.
Last time at these levels was March & July/Aug 2014.
Could mean a bit rocky ahead!