Exercising Patience
In some situations, patience just doesn’t just come naturally. We need to train ourselves to be patient. Here at Chartfreak, while looking at a few nice trade set ups here and there, we’ve really been waiting patiently for…
AUDIO HERE http://www.screencast.com/t/Jj452kB3
a nice directional move in Miners to take positions in. As traders and investors , it can be difficult to wait patently for an ideal low risk set up, “Lets see some action!” is how we feel. You can see from the above picture, however, that patience CAN be learned and I must say that the readers here have done a good job of it. Question is : “Is there going to just be more waiting or are we closer to a move that may actually be a sustained move in one direction?” Lets look at a few “interesting” charts and see what we might find …
When I awoke this morning , The Shanghai was down 5% , Hang Seng down 500 pts. Futures here aren’t too bad, but Lets look at our markets quickly.
QQQ Did you notice that the Q’s broke their 10sma for the first time since the Oct Lows? We are due for a pullback, even a healthy one to the 50sma.
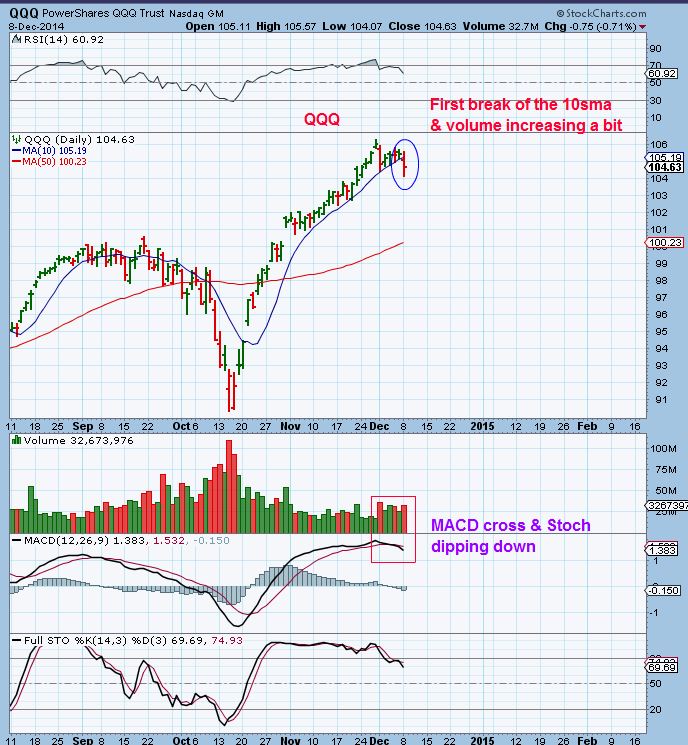
The MACD & RSI showed signs of weakening too. While this can always recover, take notice of this ….
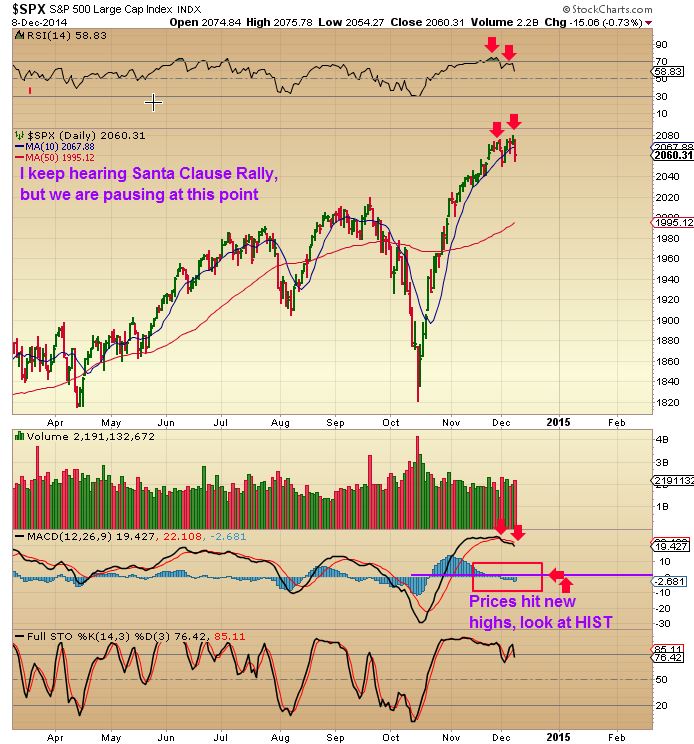
$SPX – The RSI had a lower high & the MACD was breaking down too , while price was making new highs. These are starting to look toppy again. Maybe just a healthy pullback, but why is this interesting to us?
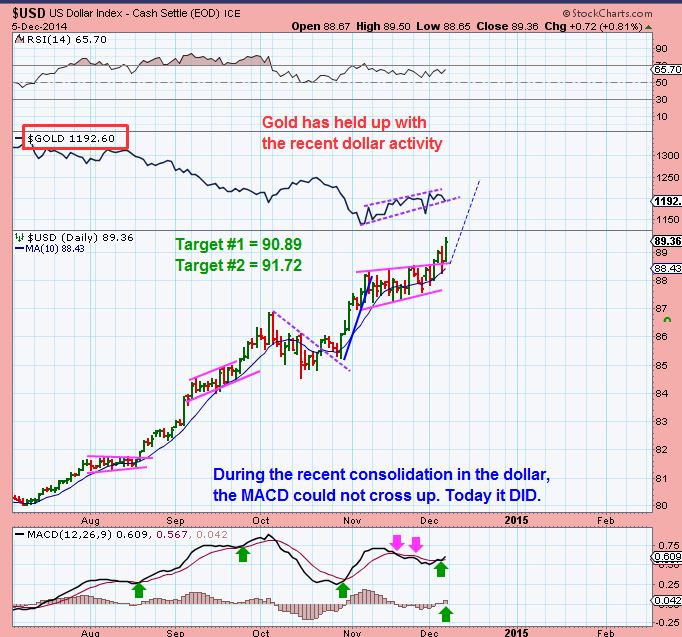
As the Dollar rises, so have the markets and GOLD / MINERS have dropped. Recently I pointed out that while The Dollar was consolidating and climbing, GOLD was not selling off. This chart highlighted that.
Yesterday the Dollar dropped , $SPX & the QQQ dropped, and Gold POPPED along with The Miners. If the $USD and the markets are going to pullback for a bit (QQQ & SPX to the 50sma for example?) , Metals could have a nice run higher, and that is what I have expected anyways. Miners tend to be great as %-Gainers, so we want to be prepared for a reversal. Yesterday was a nice reversal intra-day, but that doesn’t necessarily mean it is a meaningful reversal that I am waiting for. Lets examine things a little closer.
KEEPING IN MIND that the safer entry will be above the 50sma, thats not so far away. When I look at the charts using Technical Analysis (Ignoring cycle counts which may be a little hazy right now) it appears that GOLD & MINERS are coiling around the 50sma and they usually do this before a drop or a Pop over it. The set up looks more like we are preparing for a POP Over the 50sma , and if the Dollar & general markets pullback, we may just see that happen.
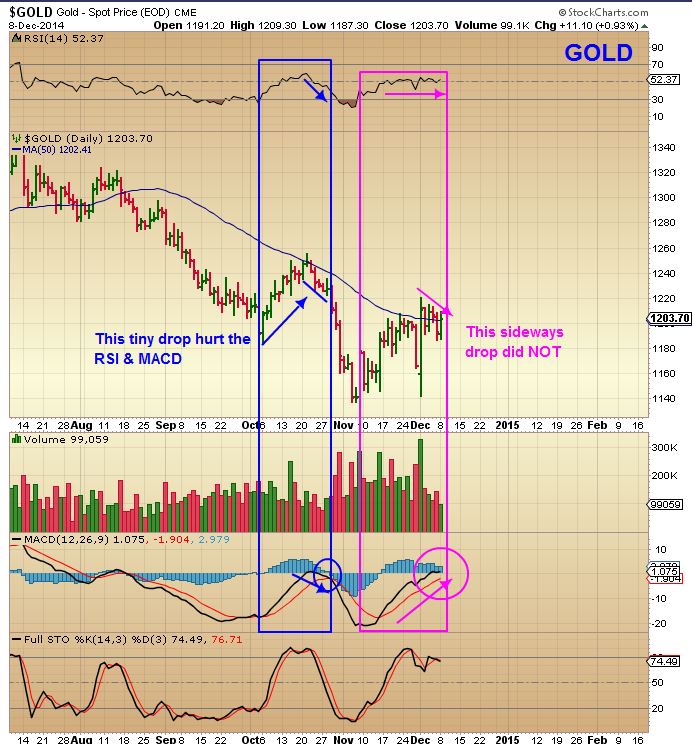
GOLD is holding up very well internally and was coiling under that 50sma, but POPPED back over it with yesterdays reversal . Notice the difference between the recent sideways to down consolidation vs the last sideways to down consolidation in the RSI & MACD. Signs of strength.
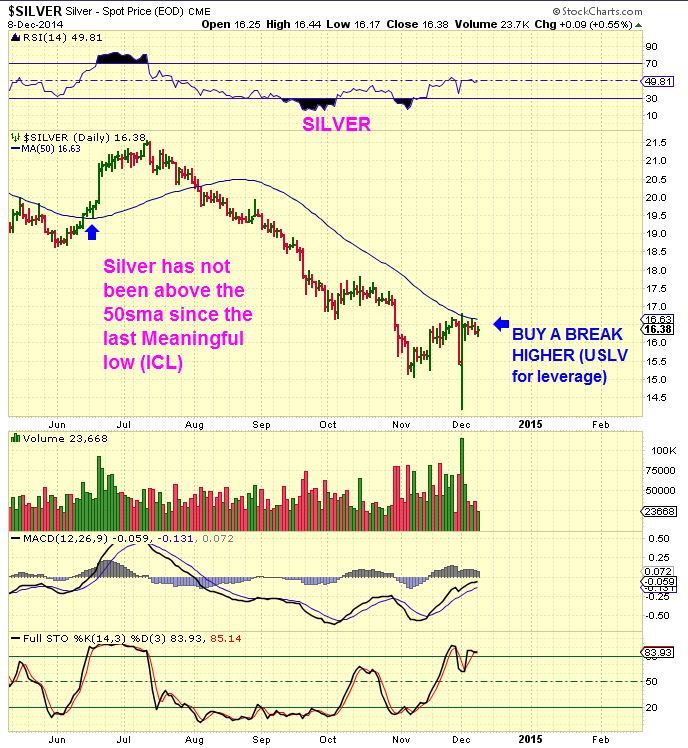
Cycle counts seem unclear to me, because I know some of the cycle experts are Not counting the Swiss Referendum Vote as a possible New Daily Cycle. I am thinking that it could be. Why? For SILVER it was an ICL type move (Those meaningful Lows that are left behind as the lows. Look at SILVER. It hasnt broken above the 50sma since June 2014, but looks ready to after a slam down low. Sure, it can drift down , but if thats THE LOWS then we are only on day 4 or 5 for Silver and it is pushing that 50sma too.
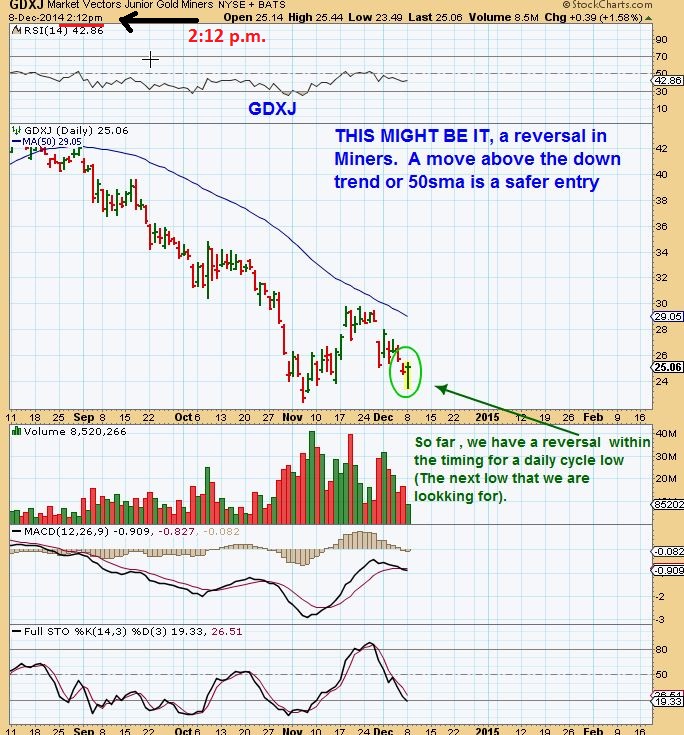
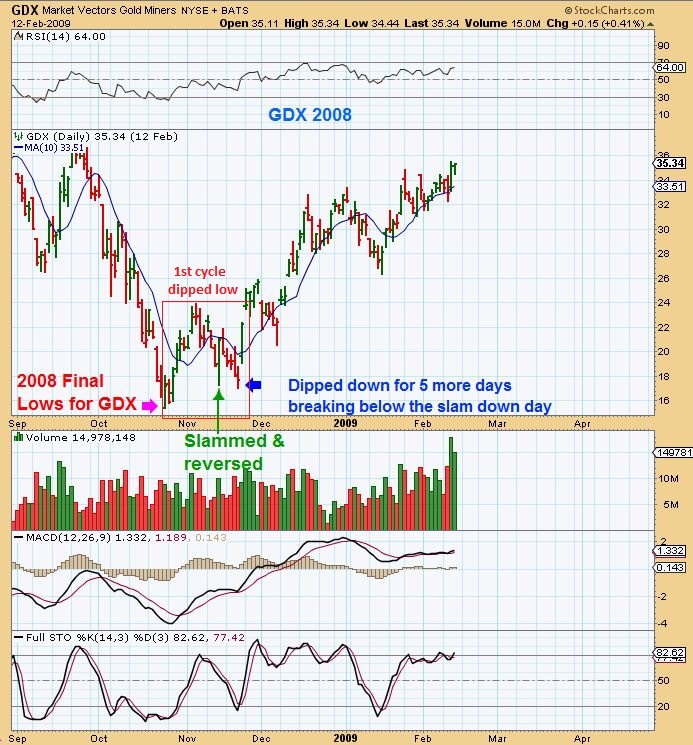
My Mid Day report yesterday was written because I was getting emails from a few that were nervous about GDX/GDXJ getting too close to prior lows and I was asked…” Doesnt that weakness make you nervous?” My answer was NO and I tried to show 2008 vs now as being similar. While I was writing Miners reversed higher. Here is
GDXJ mid day .
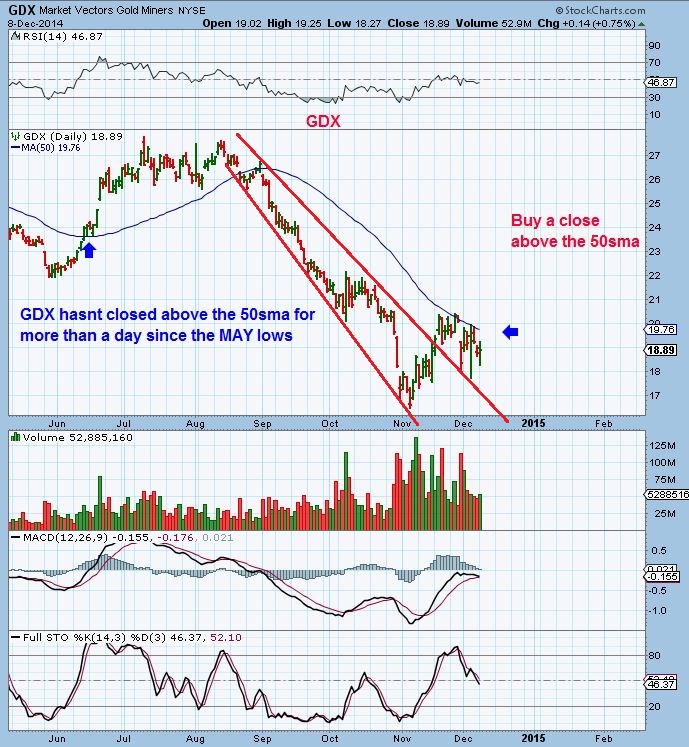
GDX tagged that downtrend line a couple of times
Doesnt the recent dip look very much like the 2008 lows? Short too- Almost exactly 1 month long from ICL to DCL.
SO here is another reason why I think we clould be close to a reversal that will move higher.
1. We have been selling off
2. People are nervous
3. Yet look at these Miners (Keeping in mind that SILVER just put in a slam Reversal )
SSRI (Silver stock) Looks strong , like a bull flag – re-gained the 50sma so far too
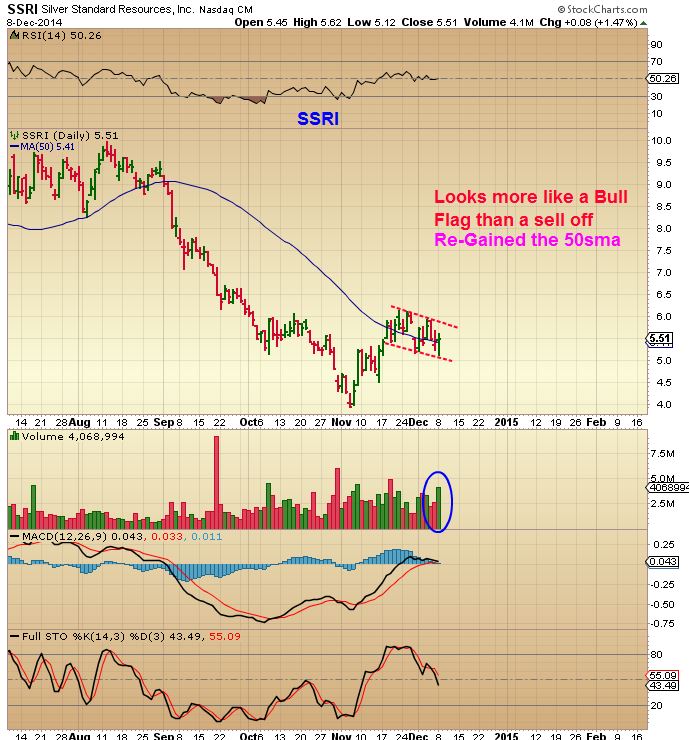
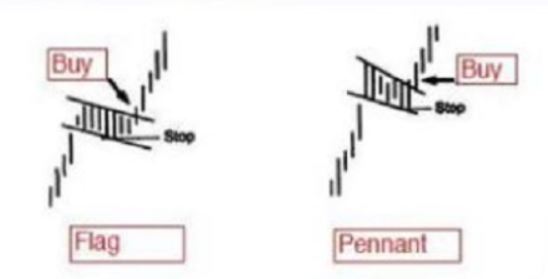
by the way – BULL FLAGS are bought on a break out, stop below the flags low .
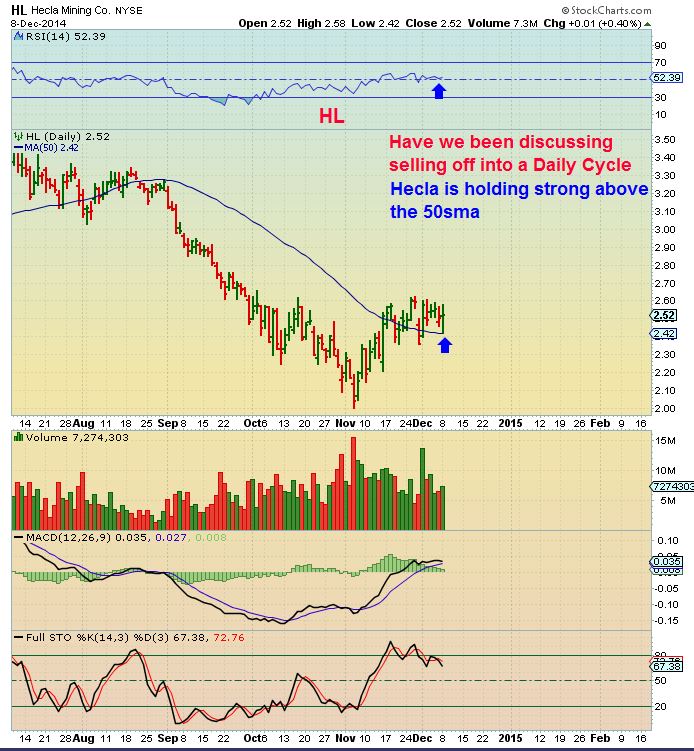
HL another Silver stock that’s currently;y above the 50sma , RSI above 50%
If GDX & GDXJ was making you nervous with recent selling, IAG could’ve given you confidence.
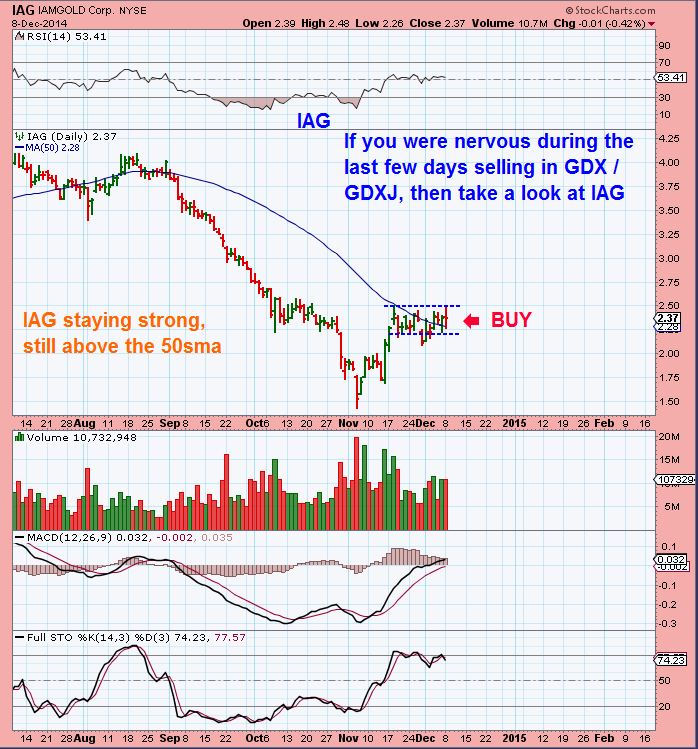
A safer BUY is above 50sma as I stated before, so Why did I say that I was buying yesterday if a confirmed reversal wasnt in? For my own trading, It is years of experience , I am in front of a screen and I can sell if the trade goes against me for example,and confidence that the lows are pretty close. IN ADDITION: Lets look at things another way. Consolidations at lows ( risk : reward wise) . I have been confident in the ICL (meaningful Lows) being in since Nov 7 in Gold, so I LOOK for opportunities.
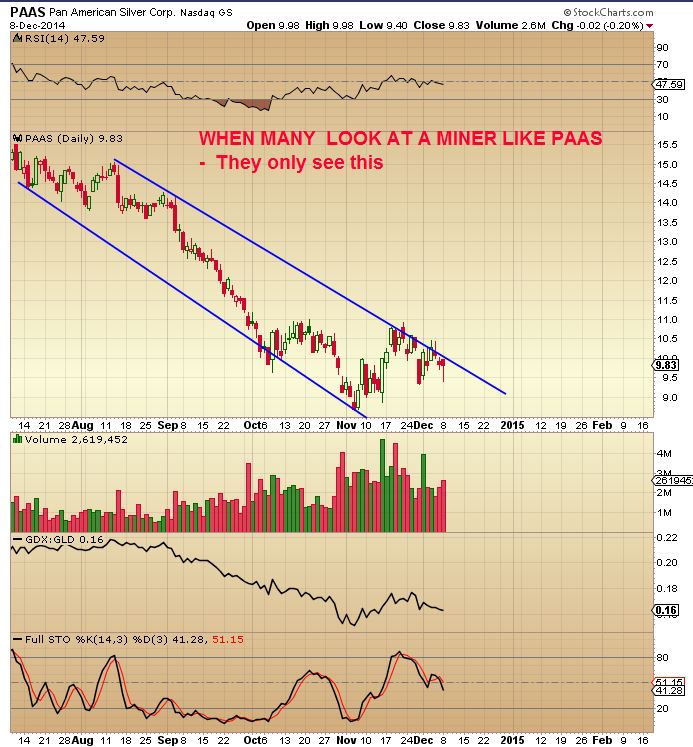
Take PAAS for example: Many see it like this.
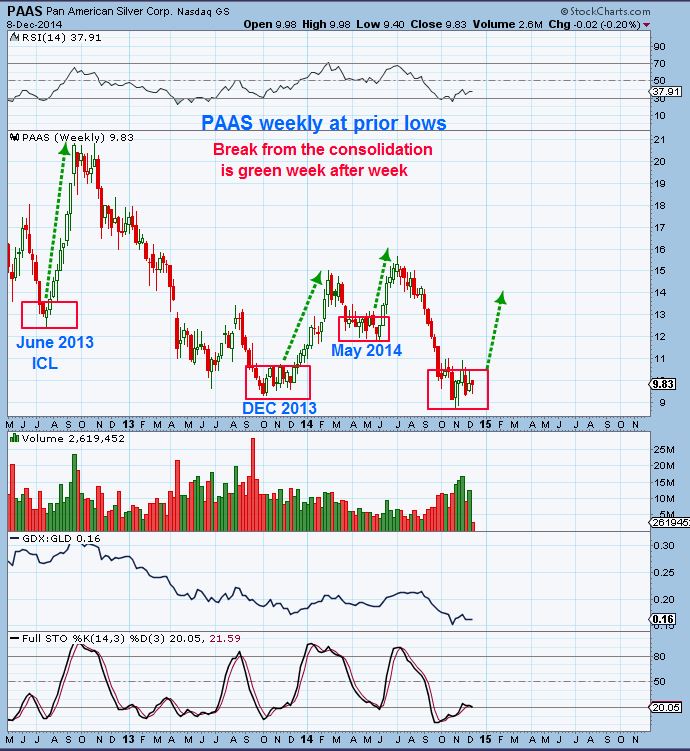
If that meaningful low is in, it could be viewed with prior ICL/ meaningful Lows in mind. You see consolidations and then a launch higher for weeks. So buying the consolidation area near its lows can be done with a stop below that area. You begin accumulating IF the ICL is in.
SO I currently see many stocks like PAAS this way. SO I dont wait to get above the 50sma at all times. It is more risky, but experience has had me in this situation before.
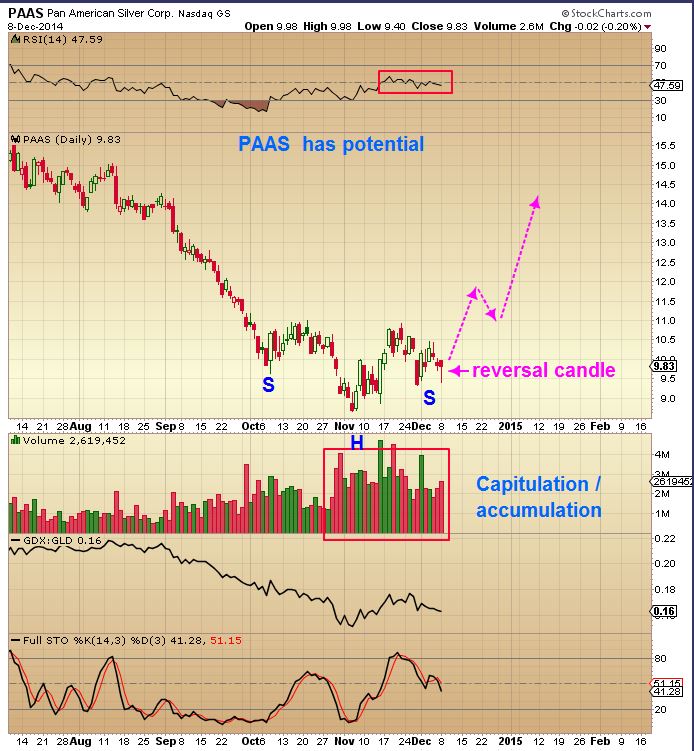
So some of these stocks have shown nice resistance to the selling. Possibly being accumulated for the next run up. I still feel that the lows are in from Early November, we saw our initial run up and then it takes a rest. As it dips down we look for signs of life, we look for signs of accumulation, signs of strength. I am seeing that now. The above stocks look ready to buy from a purely technical analysis view and you would put your stops below the flag . Cycles analysts wait for a strong reversal and often follow through, even a break above the 50sma. It is safer to wait for GDX to get above the 50sma , because it hasnt been above there since after the last Meaningful lows (ICL). I mentioned that I started buying yesterday again (Adding to positions) .
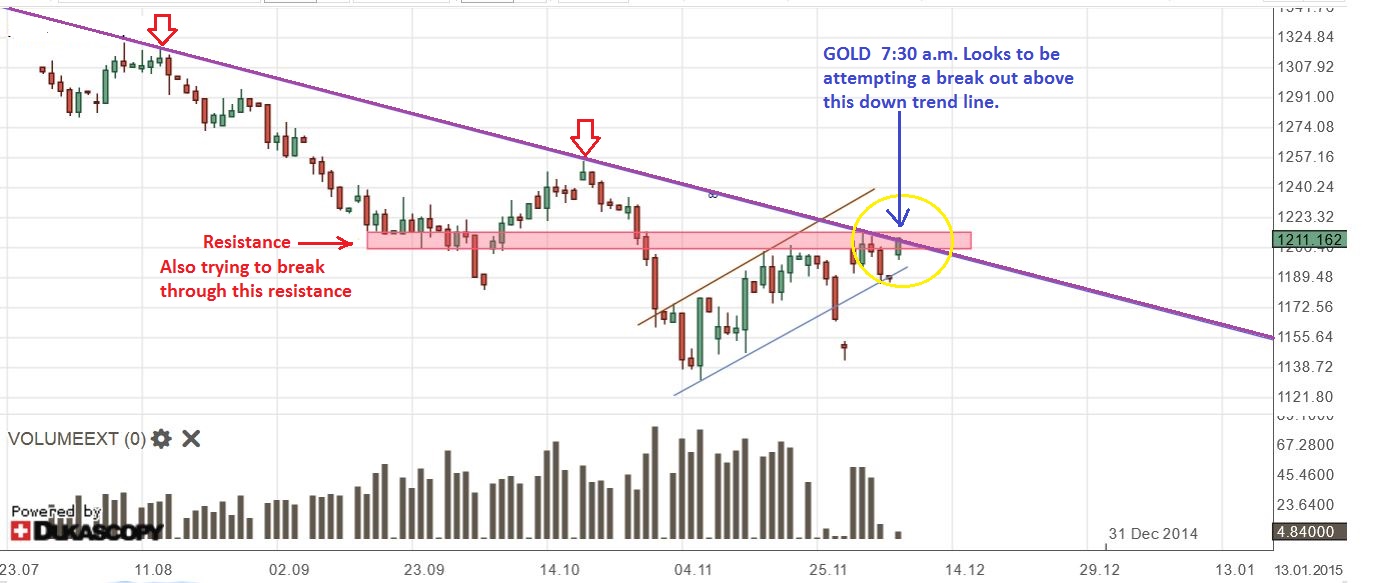
I just checked GOLD. It is trying to break free here, so if it does break out near $1220 it is above this downtrend line. I would start buying either the miners above or your favorites . The stronger ones still prove to be RIC, RGLD, FNV, etc, but if you know this sector, you know that when MINERS run, they run fast after a sell off. Good %-Gainers. ( Even the dogs like ANV went up 100% off its lows in Early Nov after selling off steeply) – I still recommend sticking to the more stable/ better known companies.
This is GOLD as of 7:30 A.M. Eastern time.


knocked it out of the park today chartfreak… great audio. especially liked how u compare/contrasted how u view TA – patterns & setups great job. Thanks muchly…:-)
Thank You Heidi, I appreciate your pointing that out and I’m glad it helps. Seriously ….the waiting is the hardest part! It was all lining up , but day after day after day its drips down like that water torture : ) not easy to wait, but I think we are there now . NICE move in MANY miners!
Looks like we’re pretty close to breaking out those long term G&S downtrend lines again (even closer with todays prices).
Hope it can stick this time.
It should happen, not sure when
I’d be more than happy if the 50 dMA for GDXJ can drop down even nearer its recent downtrend line (27, or lower would be nice) for added safety.
I don’t think price is going to hang around down there that long for that to happen though.
We “Might” pop up here and then pullback a bit, that will allow time for the 50sma to drift lower & then it should start to turn upward as we rally higher from a Daily Cycle low. Time will tell- I guess.
Chartfreak…..do we have a target for Gold and Silver on this run? or how long should this run for in this cycle, before a meaningful pull back? Thx
Very good question Curtis, and…… is it wise ALEX to sell a bit just before the close?
I’m not selling here , We could go higher before dropping again ( even if this POP is just the end of the 1st Daily Cycle) .
To take a profit is your choice, and its not bad to lock in some gains.
Hi Curtis, That is the 1 million dollar question and I’ll tell you why. CYCLE WISE- this “Could’ be the end of the first daily cycle. A pop to new highs and then a drop down into the DCL. The good news is that even if thats the case, this is a very bullish sign for the next daily cycle.
As noted in my report though, there is a chance that the SWISS VOTE slam down was the end of that first Daily cycle and this would be follow through upside to a second daily cycle. SO with cycles Its a tough read. When I look at 2008, we had the same type event & it was tough to read cycle wise (For me anyways)
See my attached chart of GOLD 2008. It had a STRONG POP at the ned of the cycle, then fell back into the real DCL.
I need to study more & put it in the next report. There is no way to tell right here and now if we just run from here (In a 2nd daily cycle) or POP & drop back. like 2008.
Good morning ALEX. First thanks for all what you do for us. (me)
How looks XLE? Is it time to buy a little bit of XLE?
B.T.W. I don’t know if you follow this ETF?
THANKS !!!
Thank You Geurt-
I do follow it. I will say that OIL and Energy have both been crushed enough that they are due for a bounce , and it might be a decent short covering rally, but the way it acted on the second leg down tells me that its just a trade and its not entirely a safe trade. I expected a softer leg down the second time, but OIL dragged the energy sector down fairly strongly. I DO Expect a rally, but it needs constant watching. It needs more time, the weekly chart of XLE doesnt say double bottom yet, it says “I might pull a reversal or I might go lower..its only Tuesday”.
Needs a bit more time for me
Keep us informed ALEX how XLE developed.
Thanks……
What will you be looking for in order to determine whether we have seen the bottom in gold or whether there are lower lows to come? Kindest regards.
Takes time, you have to watch it unfold
Following up…As I look through the gold charts for the past 50 years or so they seem to have an eight year cycle low pattern. That would put the low in gold somewhere between 2015-17 in case it should show up either early or late. Previous low was 2008 and the low before that was 2000. I appreciate this info is nothing new to you:)
Hi Mark,
I have seen that & noted it too. I have a theory that could lead to higher prices in harmony with that…I will put it in tomorrows report since it’ll take time to do charts.
Short answer, YES we could dip down to $1000 after a few nice short covering rallies, but this shake out has been very impressive to me, I have to see how it plays out. Thanks for asking about those 8 yr lows, Many may have the same question. I will adress a possibility (Bear and Bull) tomorrow.
Alex,
I think you might be having some web site issues. The only way for me to find this blog is to use the email link. If I go to chartfreak.com I can’t find it. Also I tried to ask a question from the support link last week, still no response.
Thanks
Hi Harry
This premium reports are under the tab “Exclusive Strategies”. I guess it should say “PREMIUM REPORTS” on that tab, but I didnt set it up & I am not able to change that right now. I hope that helps, and can you try re-sending your last question to both me & support if you dont mind? I will address it if I can , and forward it if not, Thank You
Alex,
i had to daytrade all day to get some positions back and come out ahead. it would have been much easier to keep in. To me gold 1230 is just below the trendline and so i am unsure what to do here. I bought a lot and sold a lot, but increased my positions nonetheless. The bad thing was 7k shares of ANV, which did a PP at $1, lost 3+ plus k on that. gained on the PAAS and SSRI that i had not close. lesson is keep sitting on the p[ositions since I cannot trade every little sqiggle
Yeah, that ANV deal was a bummer for many .
Deshy… could drop a bit more
Thanks for the great charts Alex. I know we’re focused on PMs right now but any thoughts on potash? I think you had mentioned some names earlier–are they still good? Thinking POT in particular or MOS…
Hey Deshy,
They actually dont look bad now. They pulled back a bit ,but still above the 50sma. The only bad part is they broke out of a downtrend and MIGHT test it. They dont have to though. If I were looking to buy, I’d wait a bot
Thanks Alex! So far the best part of this service for me is when you post charts I actually learn tons of info even if not investing! Great stuff.
THX DESHY, much appreciated