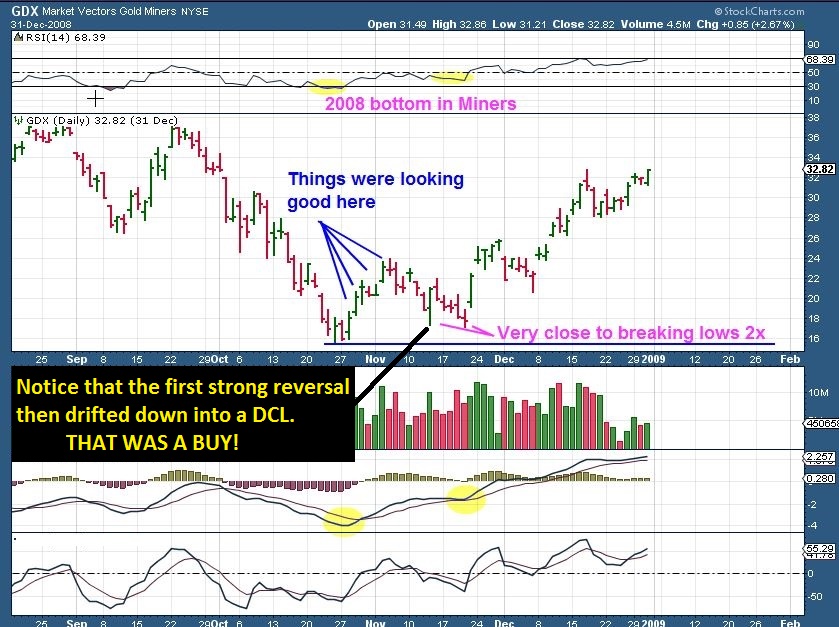
Today I wanted to mention a couple of observations in the Metals markets and the Dollar. Also – you may want to re-read yesterdays report, it came out late in the day and really not much has changed. I am still trying to figure out if that HUGE move by GOLD & SILVER Monday indicates the end of a short first daily cycle , and the start of a new one? If so GOLD would likely POP higher soon (Jobs report? ) Or, As mentioned, was that strong slam down & reversal just putting in a daily cycle high and now we drift down to a daily cycle low. THIS chart was posted to show that idea in GDX 2008 lows.
You want to be in for the second leg up
Some have stated that the recent surge in the DOLLAR (And it continues overnight) shows extremely bullish conditions and they fear that GOLD will crumble as the Dollar plows higher.
I agree that it looks that way, but let me take this time to share a couple of immediate observations with that situation.
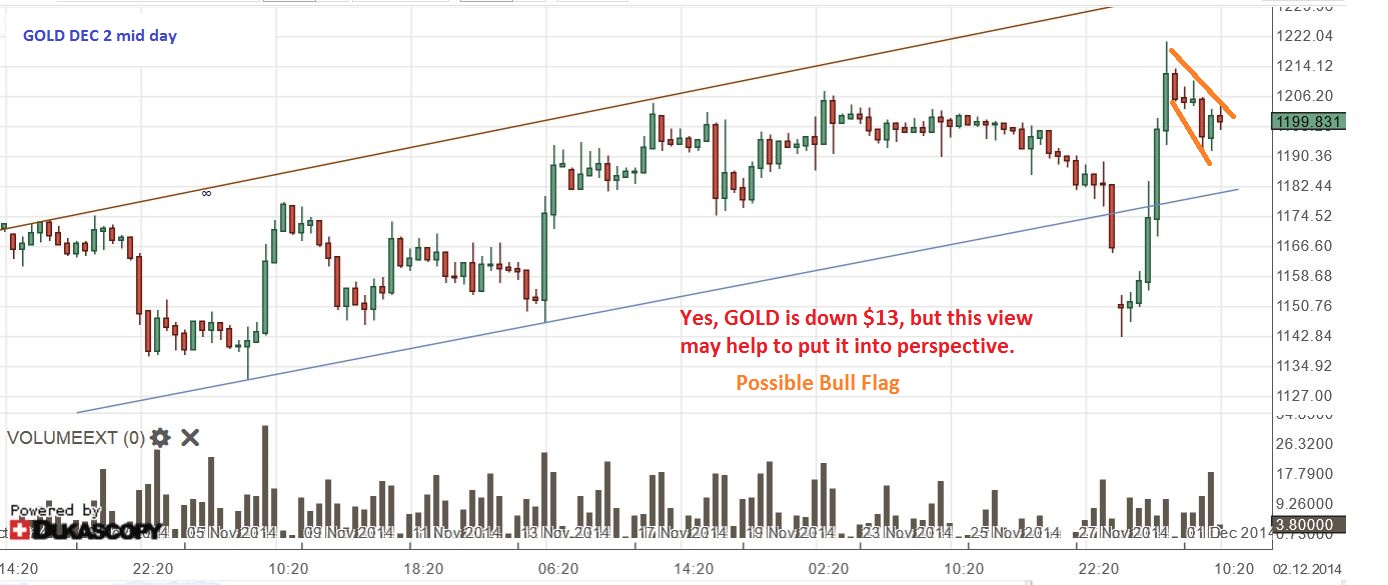
Yestarday I showed the potential flag pattern in GOLD mid afternoon. The dollar was already breaking to new highs, but…
1. Observation #1 THE DOLLAR WASN’T GETTING CRUSHED, it drifted lower
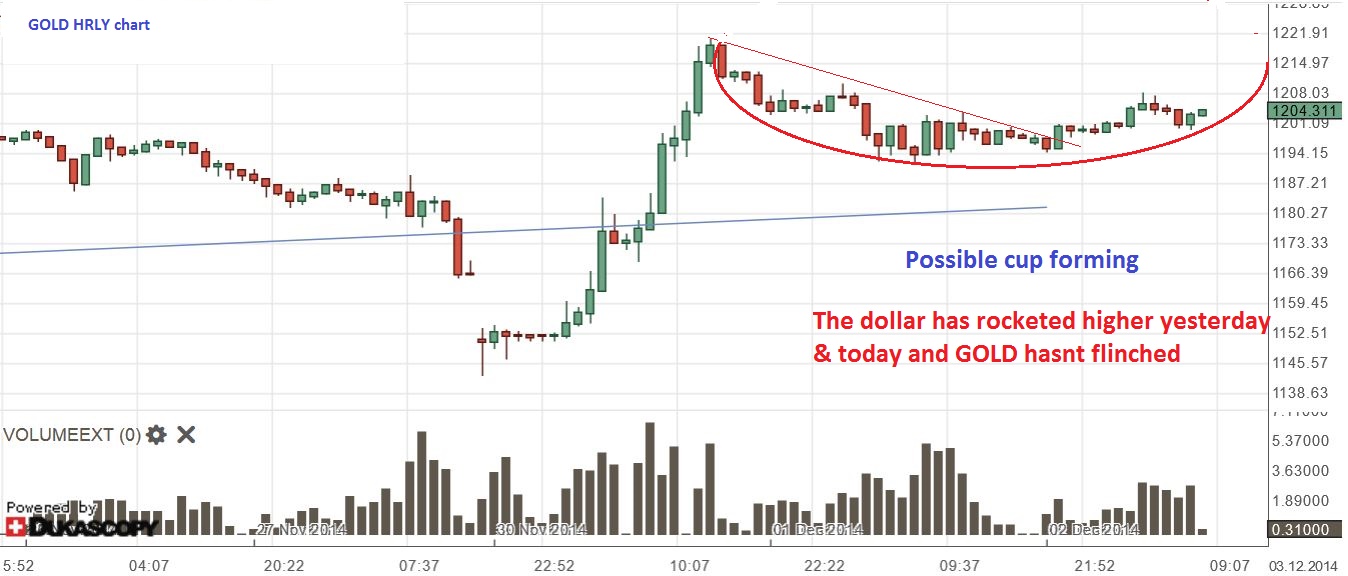
2. The dollar hit new highs overnight in another strong surge ($88.90) , but again …GOLD is holding steady,this is it at 7:30 as I write
Concerns about the dollars “ENDLESS RISE” are understandable, but you keep hearing me say that I see evidence that it is in more of a topping process. NOT COMPLETELY, but it shows signs of a pause, pullback, etc and THAT could cause the 2nd leg up in Gold/Silver/Miners. I showed other dollar charts that are bullish for the dollar, but still show that it could pullback. I will include one below as a repeat reminder and THEN – let me show you ANOTHER interesting observation to try to build confidence that what we are seeing may not be SUPER DOLLAR BULLISH and detrimental to GOLD.
Reminder CHART showing possible dollar path. We are AT FORMER HIGHS even with last nights surge (Click to open) target 85
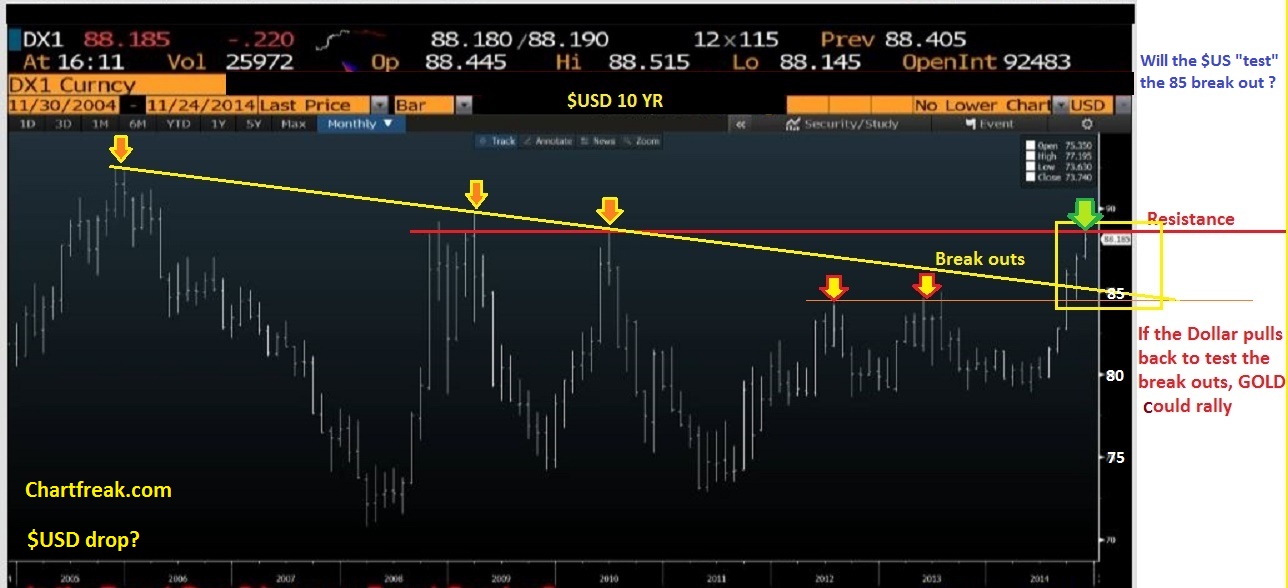
SO let me show you this with the dollar. THOSE FORMER HIGHS shown in the above chart. Lets zoom back at 2010, because THAT is where I think the dollar could turn down, and last night we went there.
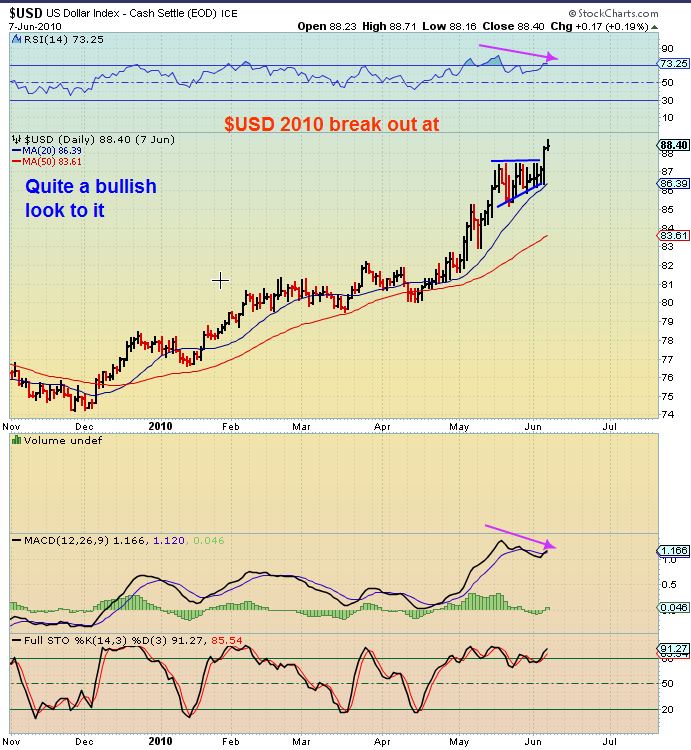
This was the 2010 run up for the $USD. (VERY similar to now…extremely strong run up & breaking to new highs, but MACD & RSI lacked strength and momentum) Notice that price was $88.40 , but tagged $88.80. we are also at that price now. )
THIS was the DOLLAR at yesterdays close. Extremely strong run up, and breaking to new highs (But Gold is now ignoring it)
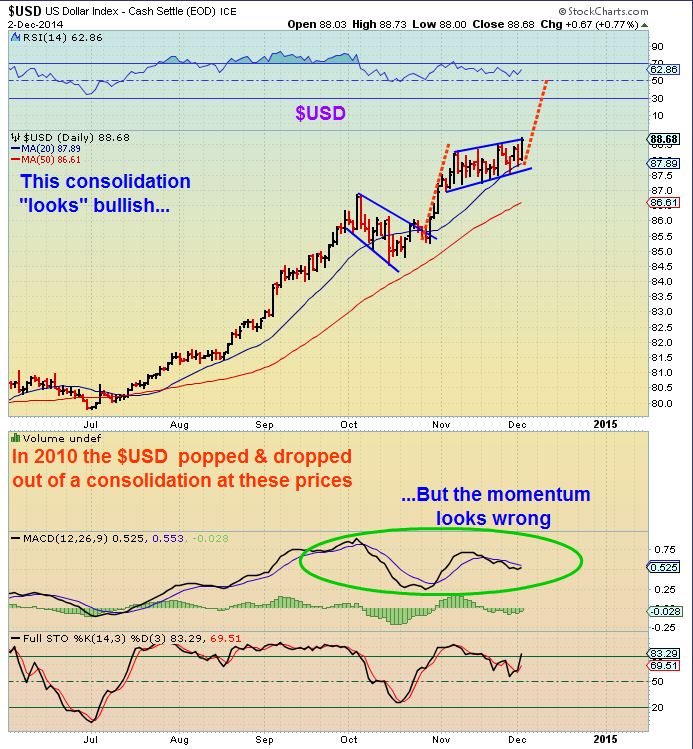
Is GOLD ignoring the Dollar break out , because it is hitting 2010 resistance and thats where the DOLLAR failed too?
This is that 2010 Dollar break out to new highs $88.80
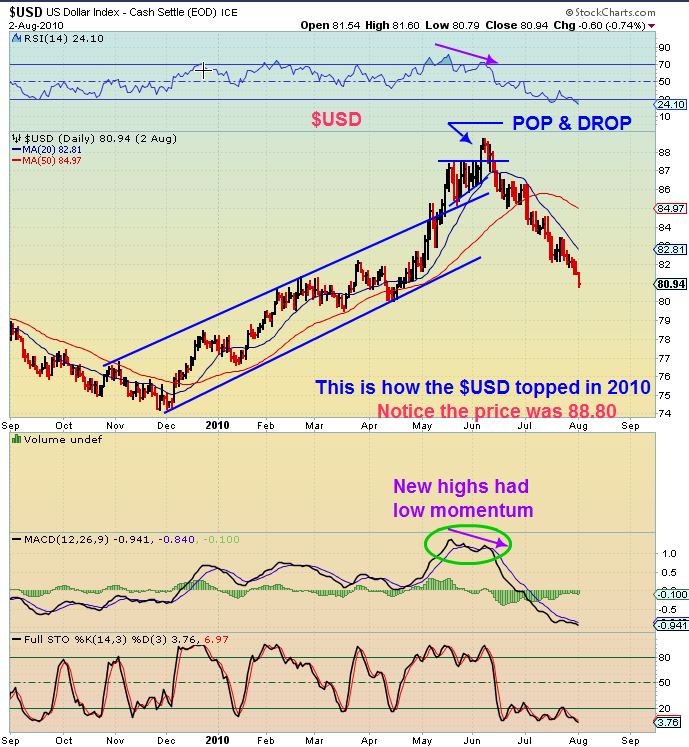
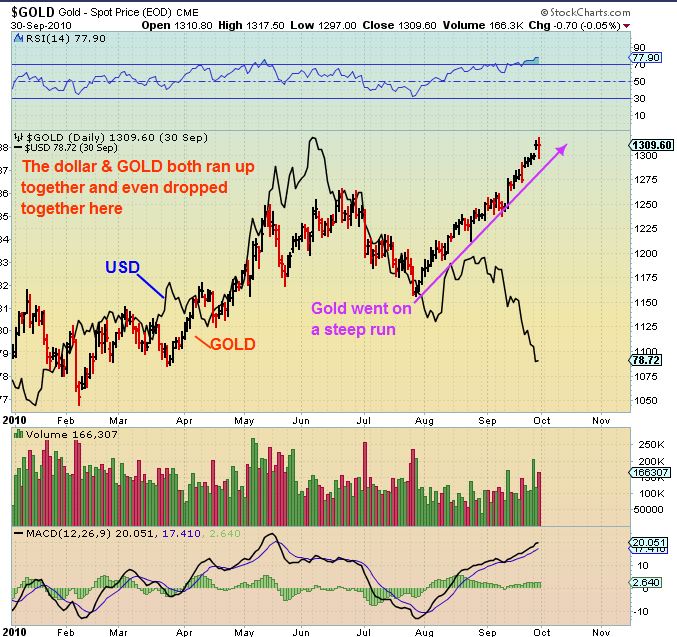
Well, I MUST ADD that even though the $USD had such a strong run in 2010, GOLD was also in a strong uptrend, so they ran up together for a bit. It was different circumstances …HOWEVER, When the USD topped at $88.80 – and began to drop that year, GOLD TOOK OFF.
Again the situation is different because GOLD was in an uptrend, but the dip in the dollar now would likely fit perfectly with Cycle timing for the LOW in GOLD and a 2nd DCYCLE. We WANT to have confidence to BUY soon if not already in.
This was GOLD in 2010 (Again circumstances were different, but my point is…The STRONG unbeatable Dollar topped at $88.80)
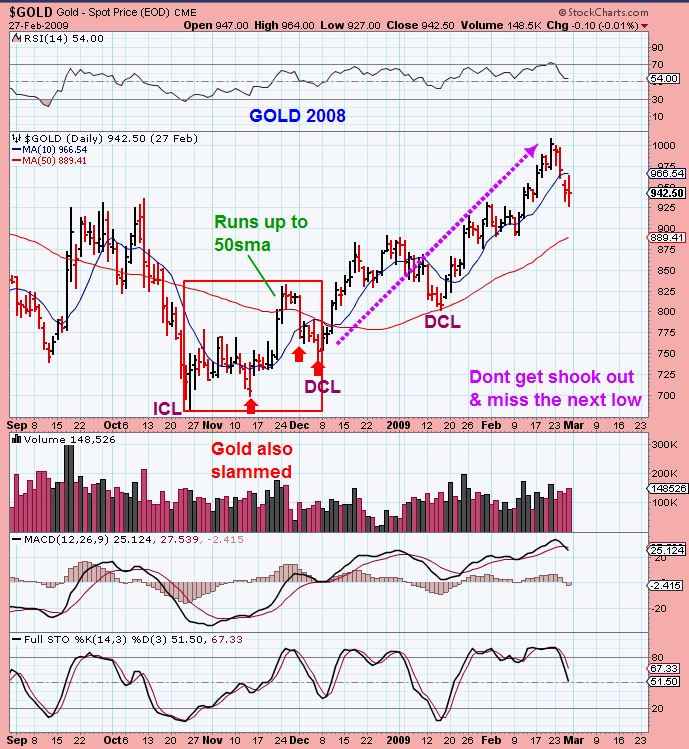
I also want to show you GOLD in the 2008 when it was putting in some major lows. That first ICL was sloppy and scary. It too had a drop to almost break the ICL (lows) of OCt 2008, then it also SURGED higher (like we did Monday). It broke above the 50sma (like we did Monday) , it then dipped below the 50sma a bit (like we did yesterday) leading to a Daily Cycle Low. Now the 2nd Daily Cycle would start and again…YOU WANT TO BE CONFIDENT ENOUGH TO BUY THAT, that is why I am reviewing this again. The red square is where we are now …the run up should be coming, and if the dolllar dips..that may be some nice fuel for the fire.
I said that I would likely post some nice set ups today, but as I was going through the MINERS, some are ‘UGLY’ and some are’ improving’. They kind of look like the above chart of GOLD in 2008 with dips and surges at this point. They are likely shaking out the weak hands and in an accumulation phase here at the ICL stage. , so I cant show those charts and say THIS is a great set up here. They need a little more time to set up apparently. I THINK THEY WILL LEAD AND MAY SET UP NICELY EVEN AS EARLY AS TODAY. I DO want to say this… Some ask about a core, thus the picture in the opening header.
CHOOSE CAREFULLY. Some Juniors look much weaker than other juniors or majors. IF you own an “EXPLORER” and they dont have good cash flow , they run the risk of bankruptcy at these levels. Thats a given and that has always been the case, but yesterday a friend of mine (Thanks Rob) sent me a link showing that WLT energy (Coal stock that was recovering) got slammed as it announces bankruptcy. I owned that only a month ago. It was recovering nicely and I owned WLT, ANR, BTU. They were just trades along with many of the ENERGY stocks that were bottoming. I owned many energy stocks too ,but had sold out to focus on the Possible ICL appearing in GOLD/SILVER. When OIL kept dropping and then OPEC made a decsion affecting surplus and excess oil on the markets, ENERGY & OIL got Killed, they all got killed . Now some may head for bankruptcy too, while others recover. That MAY have been a capitulation type low for them, but some may struggle to recover. MY POINT – Look for quality Miners/ Juniors.
I want to release this now , its a reminder that I think we are close to another leg up in Metals and miners, a BETTER leg up. The 2nd Daily cyle after sell off can be where shorts must again cover and this time BUYERS step in seeing a bottom has formed from Early Nov to now. GOLD is in that CUP formation as I finish and it looks to be rising a bit. I would watch MINERS for signs of taking the lead out of lows and I will report if I see anything special. Maybe tomorrow morning I will see flowers growing in the field. ANY NEW SIGNS OF LIFE SPROUTING.

Sometimes its time to take a trade, sometimes its time for patience to allow the trade to come to you. To set up properly. I am looking for the opportunities and will post when I see something setting up favorably. Thanks for being here!
~ALEX
BULLISH 
 I Think Its Time
Scroll to top
With the volatility that we have, where would you put a stop on GDX ?
I’m sorry this took so long, I’ve been replying to emails and such most of the morning. .
I would need to know where you bought it? I am thinking that we either go higher from here and just had a dcl (very short 1st daily cycle, so maybe less likely) or if you look at the last chart in this report (GOLD 2008) we get that same type sideays down into a dcl, then a 2nd Daily cycle that runs nicely.
IF you think that way, maybe you wouldn’t want to get stopped out, but we MIGHT do as I mentioned in this chart as we enter a DCL. Thats rather deep, so if you’re heavy, take some off? Or set a stop below your buy point?
Do you think Alex I should buy some hedges for this week Friday?
See the chart below, we may (MAYBE ) Dip down to a double bottom type daily cycle low. You COULD hedge, but it we break upside I would close them in case we had a short 1st daily cycle and just run higher.
SO FAR looks like we may eventually dip down, because volume is rather light up today
Dear ALEX….. You said: “The 2nd Daily cyle after sell off can be where shorts must again cover and this time BUYERS step in seeing a bottom has formed from Early Nov to now”.
My question: Did we get already the 2nd Daily cycle sell off?
Thanks so much for your great help.
As mentioned in the report…it isnt clear yet. We may dip down further to a DCL if it is not yet in place from that slam down day Friday/Monday , but it’ll be higher than Nov lows.
SIDENOTE: I did have trouble viewing yesterdays comments, so I had to wait and answer them today. If anyone wrote one and thought I was ignoring them, apologies. I just had trouble with the commenting section. Its all fixed now & I went back and answered yesterdays comments too. THX
I’m considering this as a possible HCl and or a DCL in place +/- employment storyline. Either way this next IC rise might be more surprising than 2010, especially as 4th qtr. margins begin to leak out from the miners from this 4th qtr. drop in oil. How might that effect your chart below?
thebeek, always the nerve wracked bull 🙂
I’m sorry, the question isnt quite clear enough that I know what you are directly asking me? The charts will be affected….in one way or another?