Tuesday March 17th
.
I used this chart of The SPX to show that I have divided our ’rounding top’ into 2 medium size daily cycles. THe first dcl on day 38 and now our lowest low is on day 37. IS THIS THE DCL? …
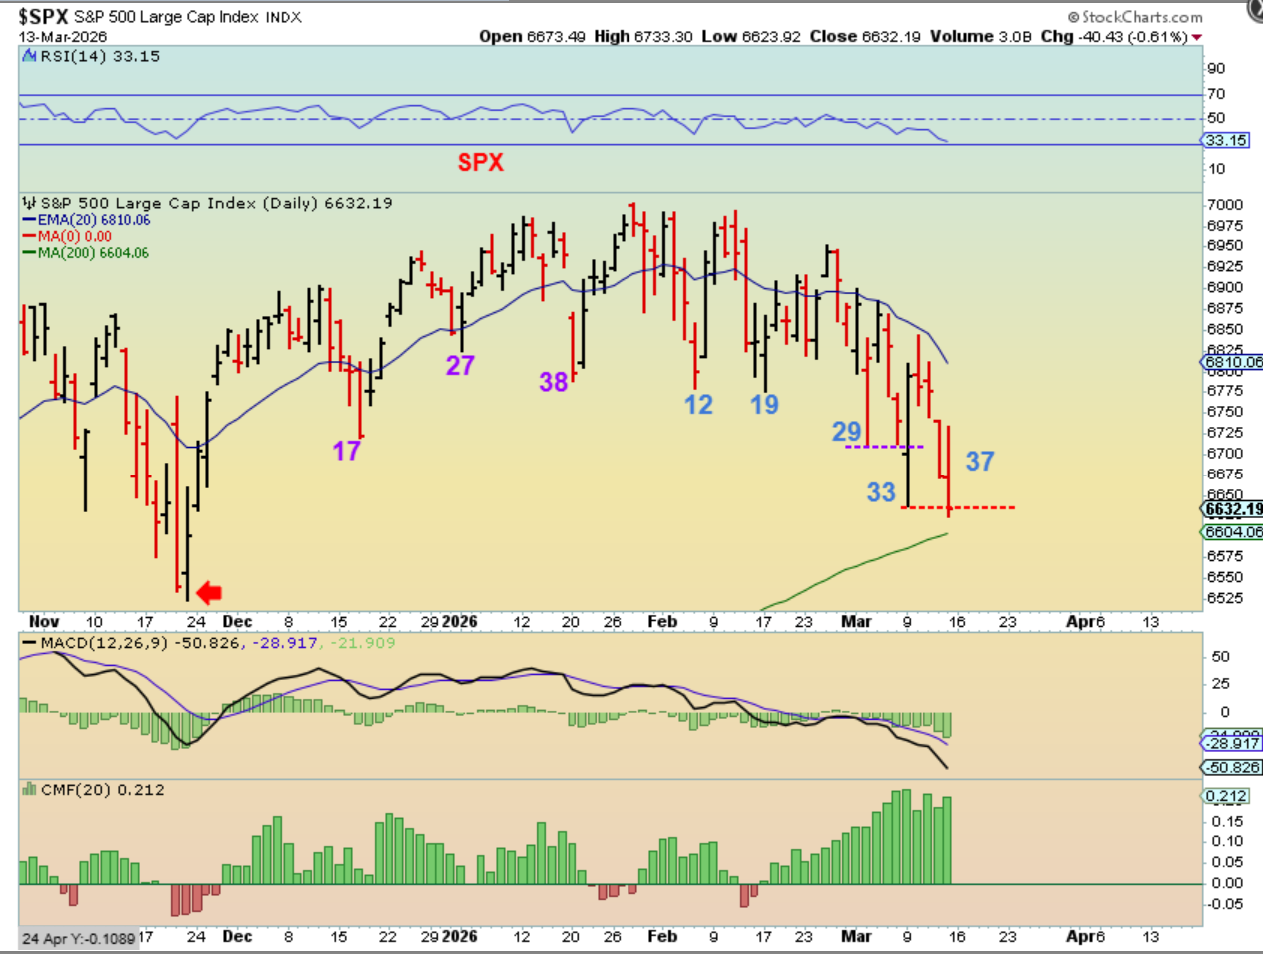
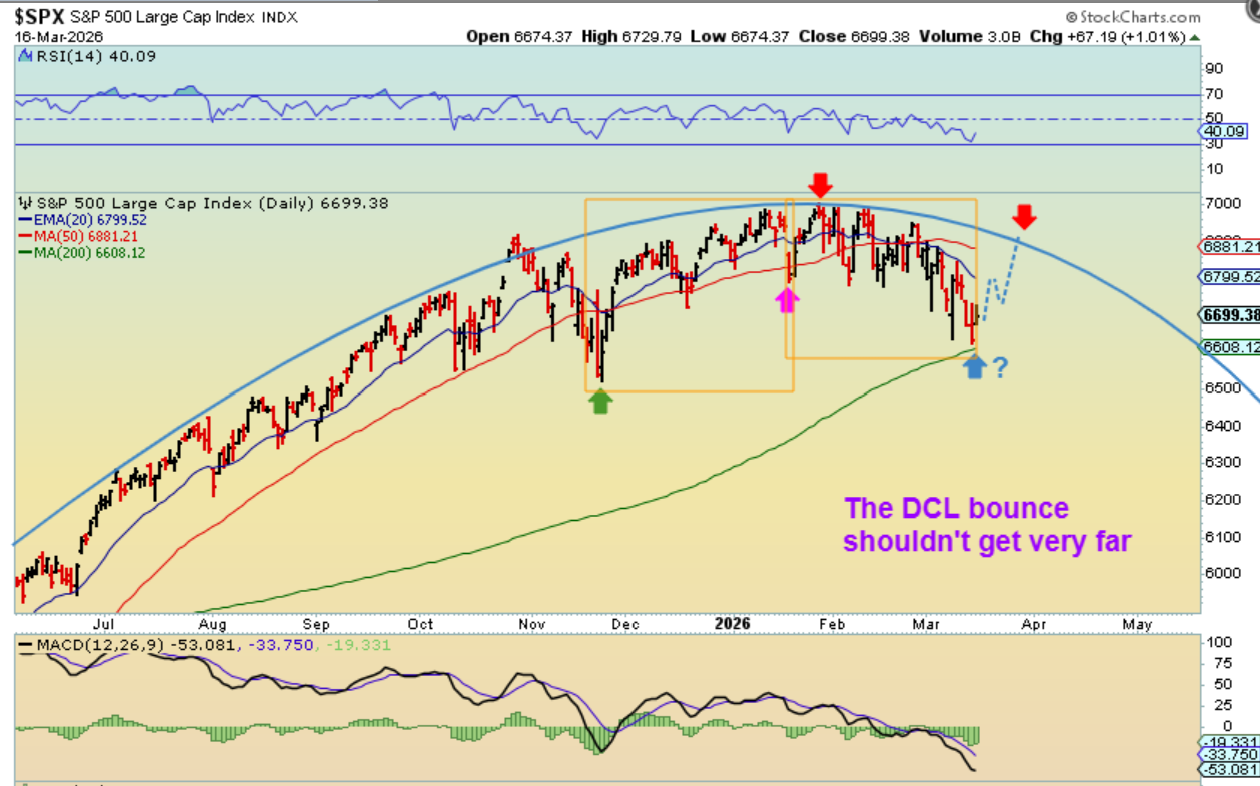
SPX – We do have that day 37 low and a bounce. We are within the timing for a dcl to form, but it can also drag a little longer, especially when weakness and world events have caused those reversals to reverse lower again. We’ll see this week if the current low can stick the landing. According to rules or guidelines of ‘cycles’, we would now expect this next daily cycle to become L.T., since the 2nd one peaked on day 6. This bounce out of a dcl can also top possibly within 7-10 days. See the chart.
.
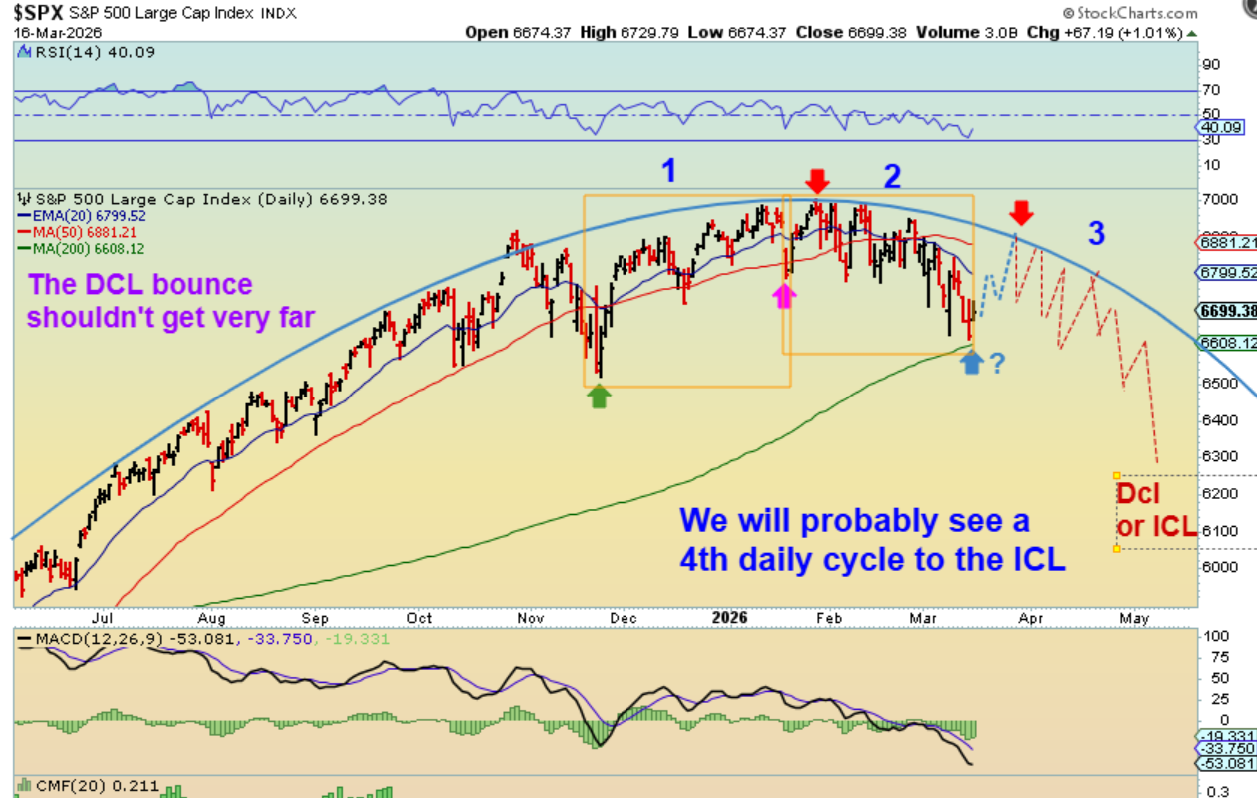
SPX – So I’ll just draw an idea of how that may look here. 3 daily cycles to an ICL? It’s possible. Why? Well, it usually runs 6 months, but we’ve seen 4, 5, 6, and even 7 months for an intermediate cycle, so the drop may bring us into April (month 4) or May (month 5). IT MIGHT DEPEND ON THE WAR AND OTHER FACTORS before we flush this market out.
.
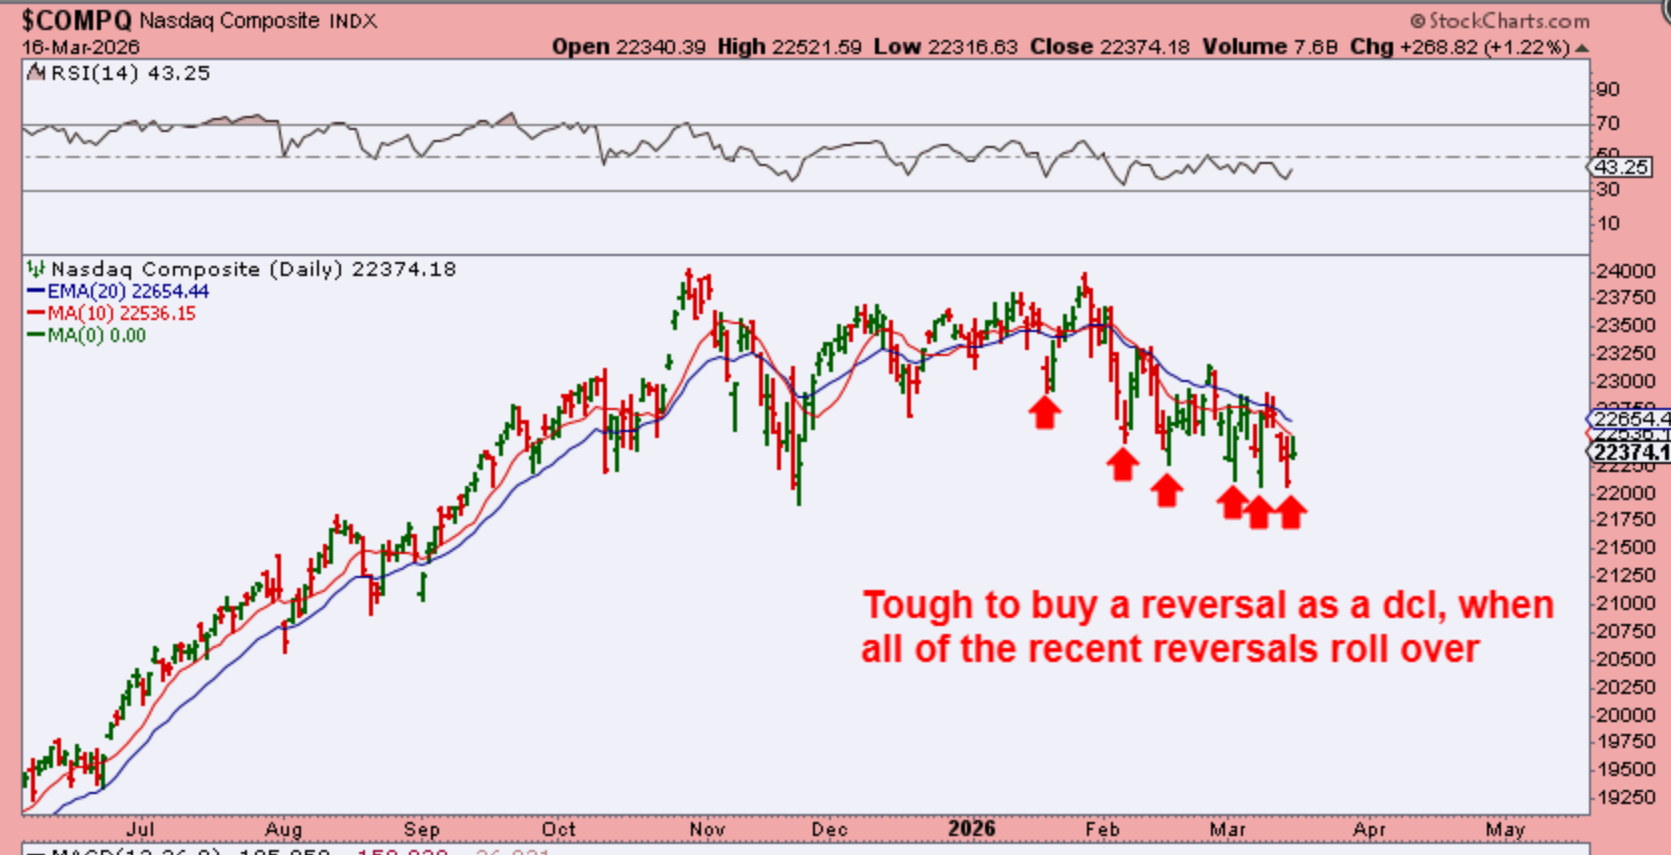
NASDAQ – It is very hard to catch the dcl under these conditions when each drop bounces and then drops again, but we are due for a dcl, and some stocks do look to be holding up OK so far too, so we should be very close.
.
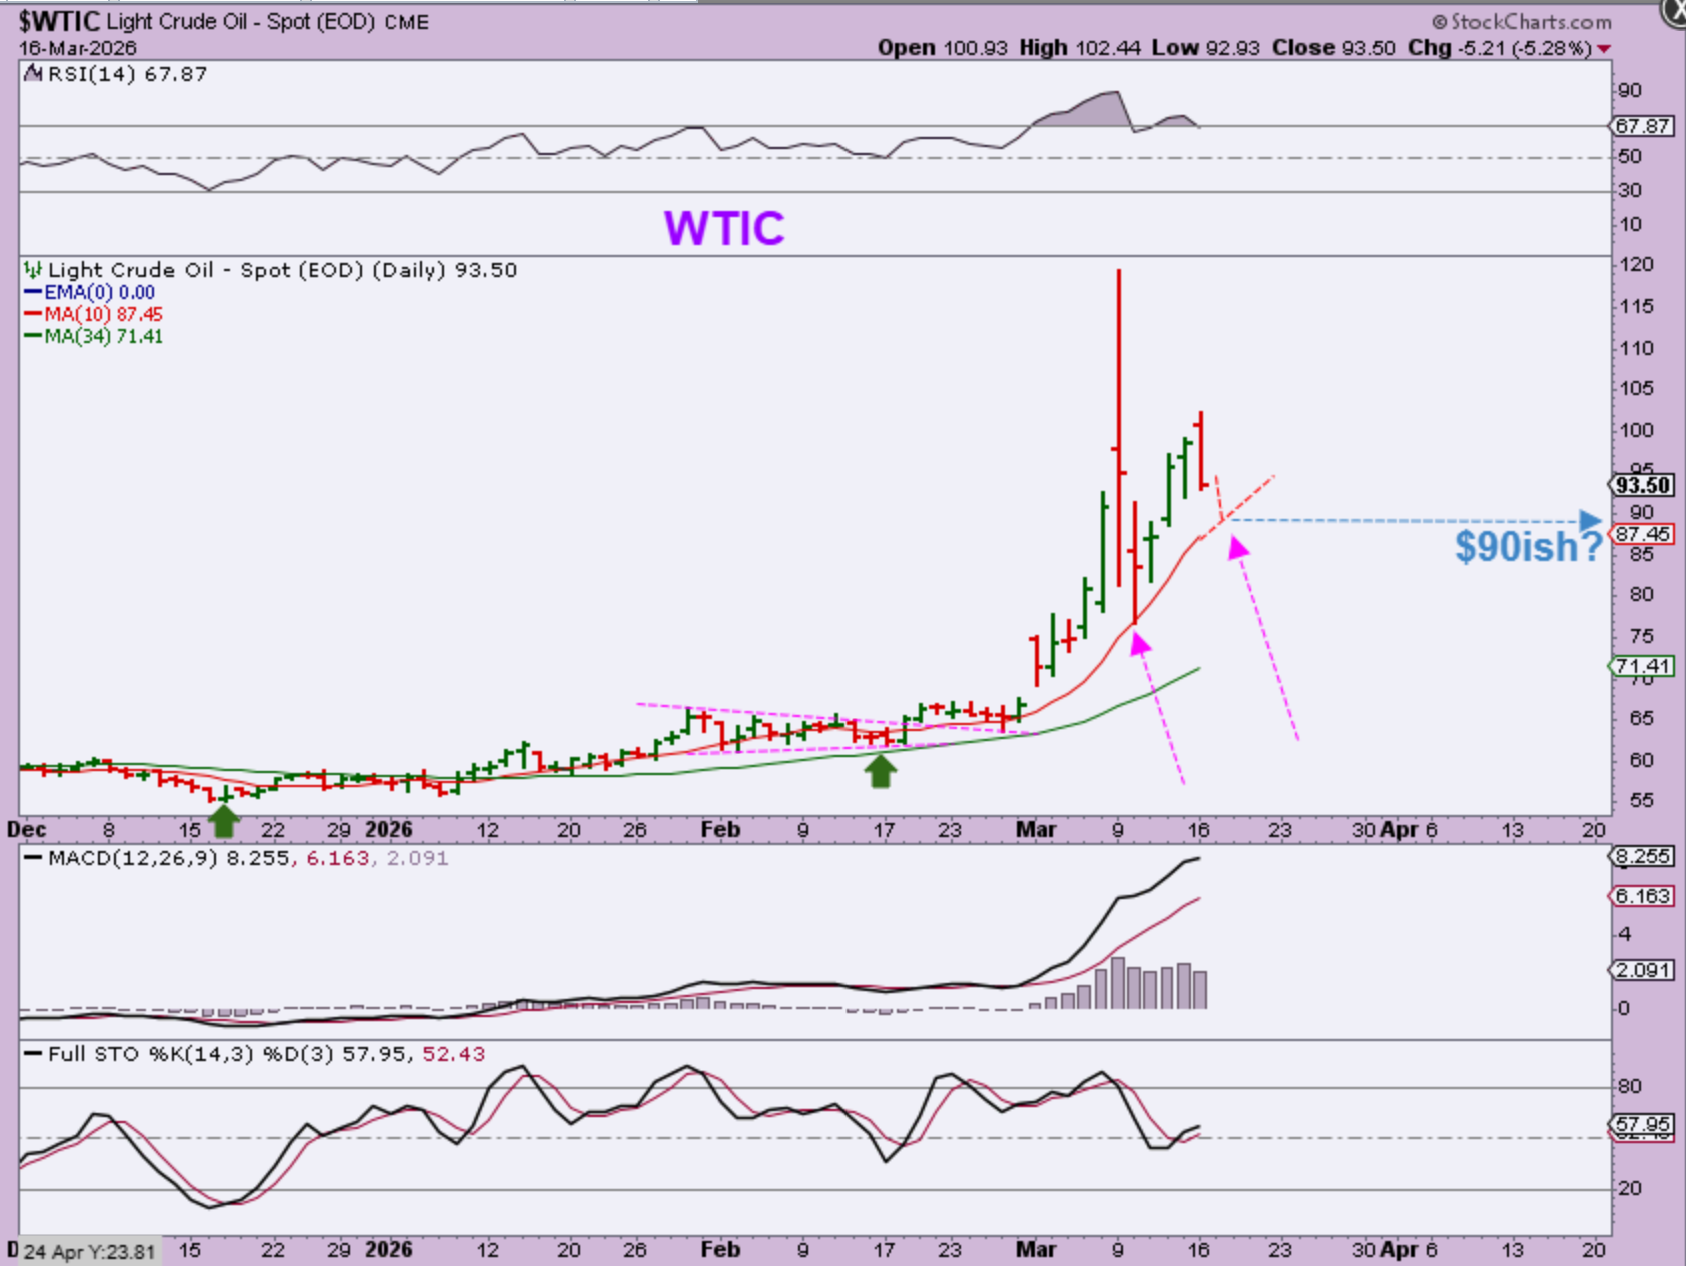
WTIC gapped open on Sunday night, but then sold off, closing down 5%. If it drops to the 10sma again, we will see Oil around $90 and then it could bounce again. There should still be a lot of ‘time’ left in this daily cycle. It is being reported that ‘hundreds of millions of barrels’ of Oil will be released from the strategic reserves later this week and that MIGHT cause follow through lower. I was reading that “Dozens of countries have agreed to release a record amount of oil from their emergency reserves to try to tackle supply shortages and soaring prices.”
.
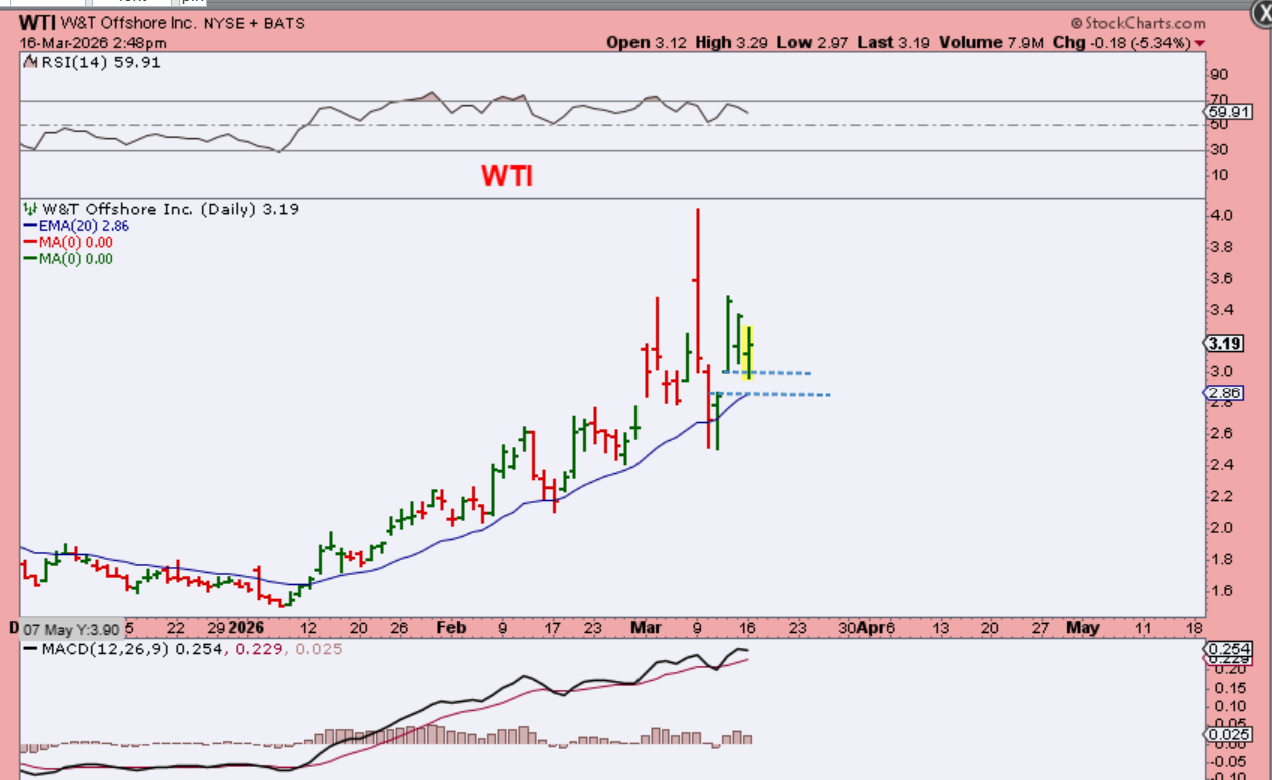
WTI – I’m not sure why the last 2 candles came out green, but we’ve had 2 days of selling and now it may be trying to fill that gap. One more down day may do that.
.
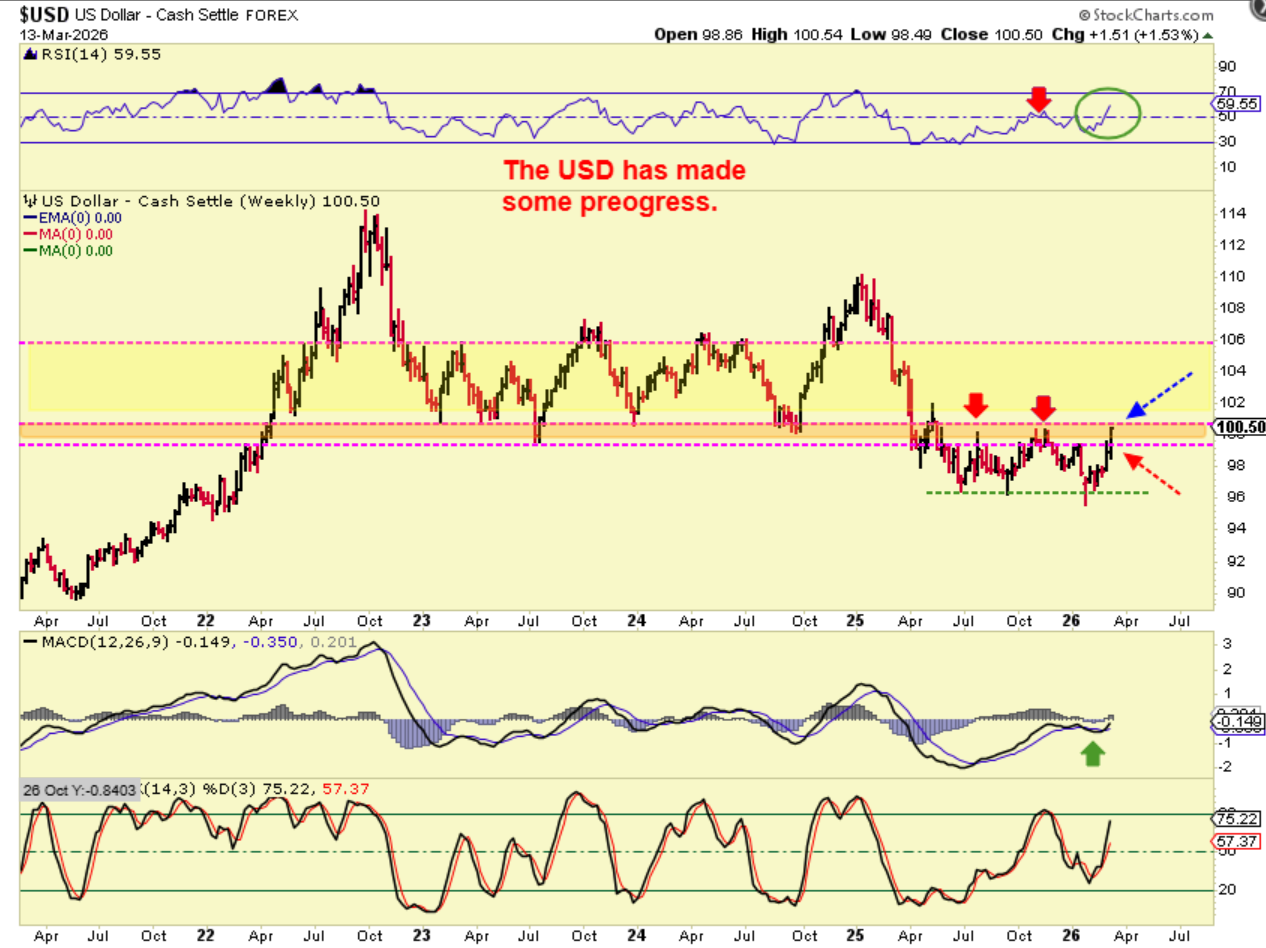
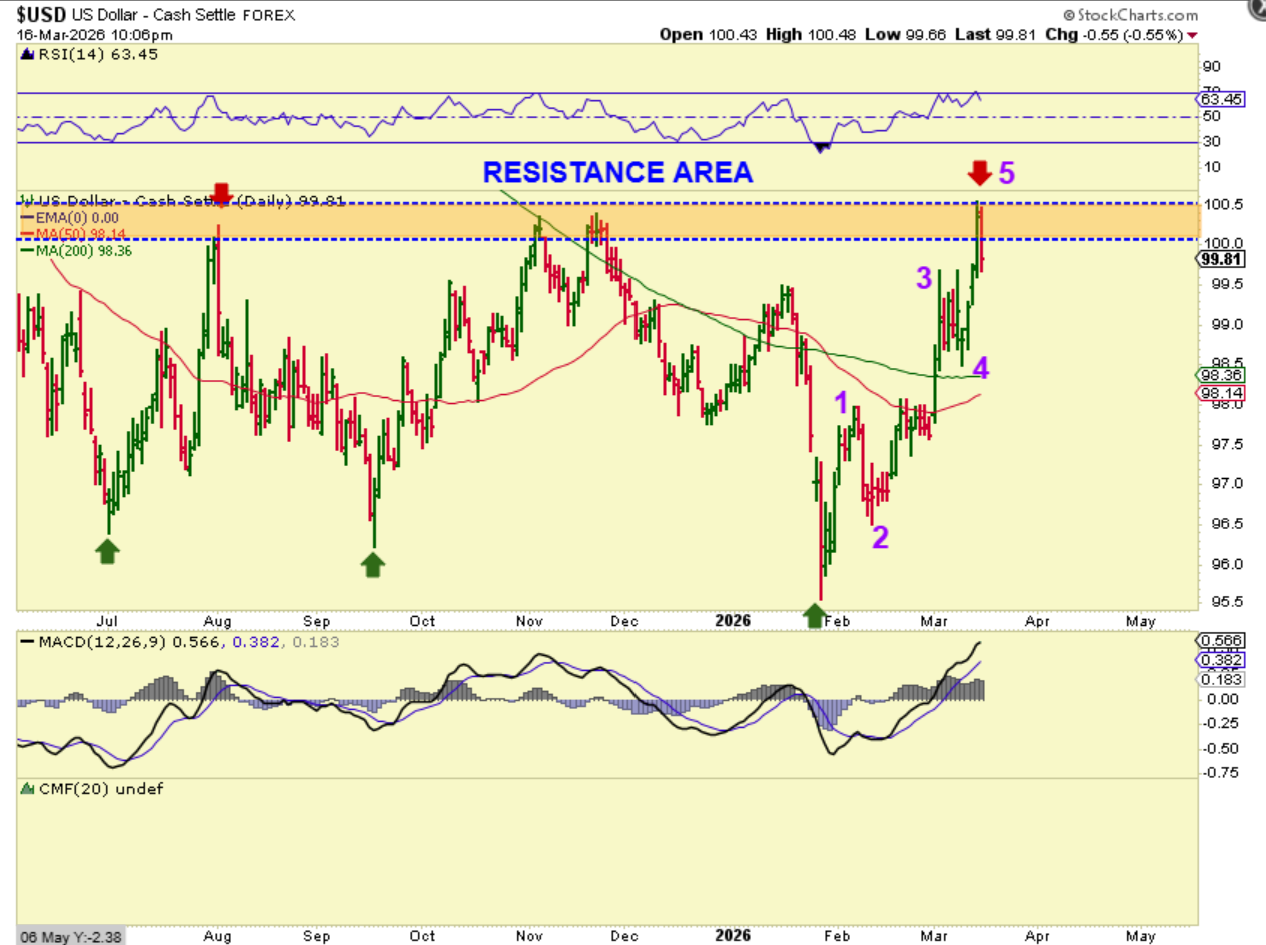
THIS CHART IS FROM THE WEEKEND REPORT: I’ve been discussing resistance levels and how that can cause a USD dip.
.
THE USD made it through my first area of resistance and is at the next line. THIS could cause the USD to ‘pause, chop, and drop’ a little. If it does, Gold could chop and pop higher, and it IS due for a dcl.
.
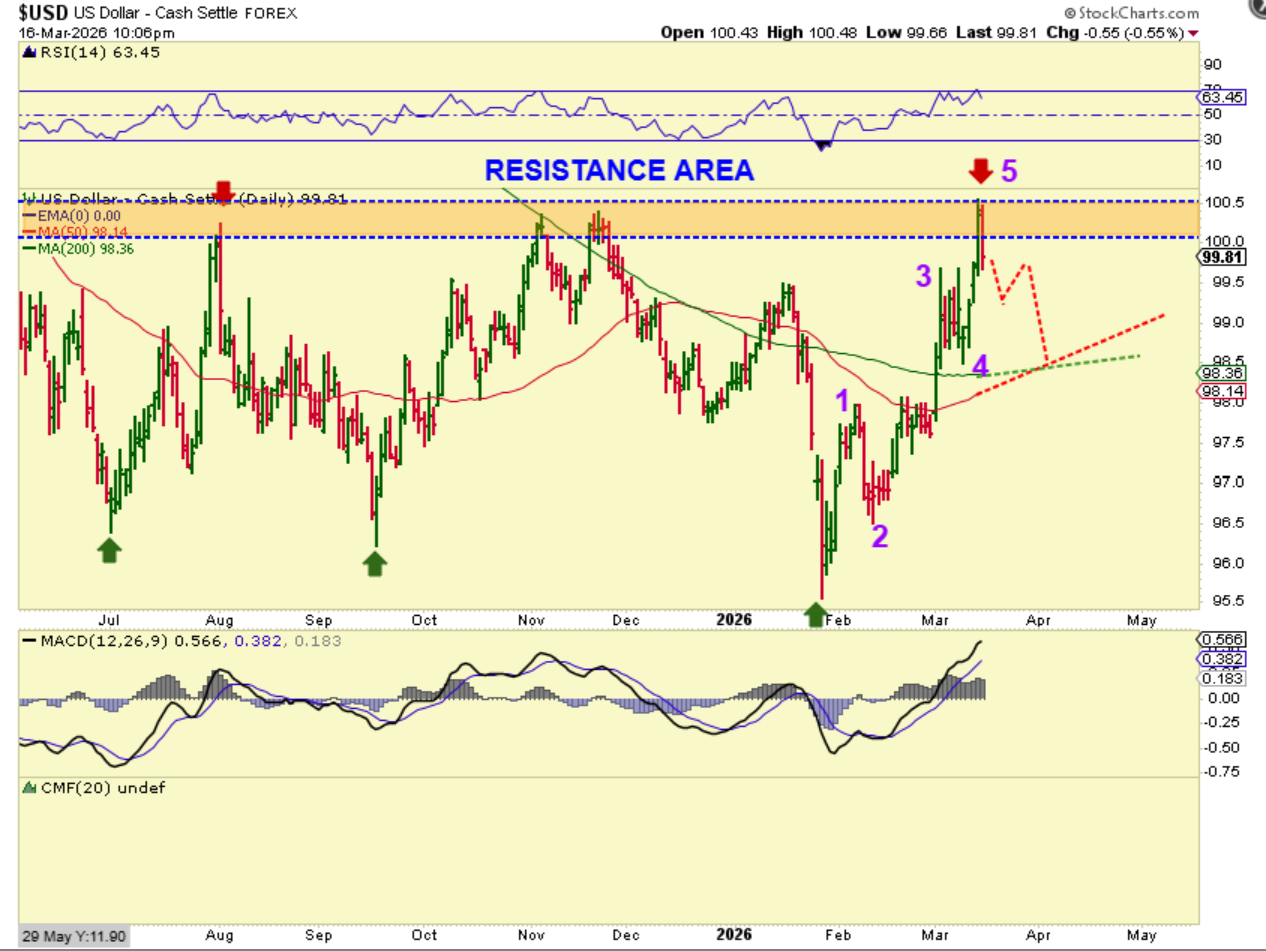
THE USD did drop away from that resistance area on Monday. I’m seeing 5 waves up, so we might get an a-b-c drop from here.
.
USD – An a-b-c drop might look something like this. This would be a drop to the 200sma.
.
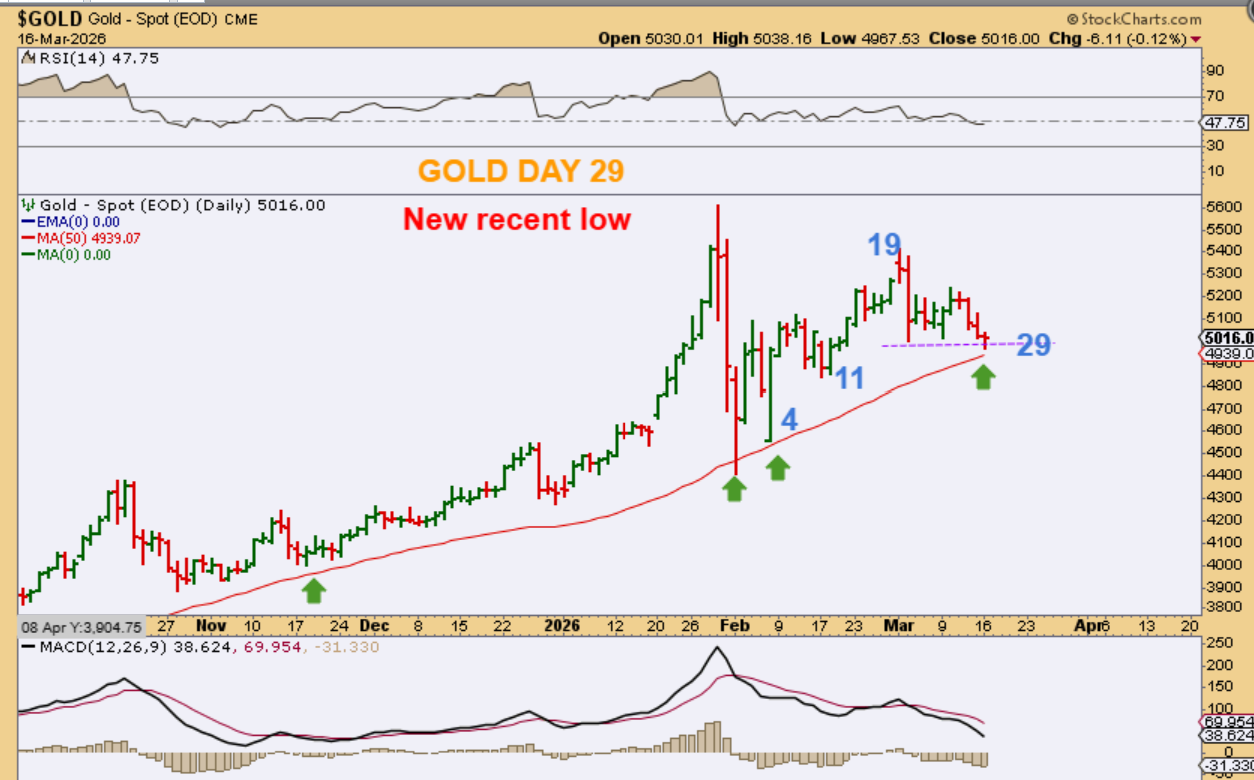
GOLD didn’t POP with the USD drop, but that is ok. We needed a lower low first to give us a dcl, and this might be where a dcl forms. This is day 29. It also might tag the 50sma on day 30, right? We’ll see, but we should be close to a dcl in Gold.
.
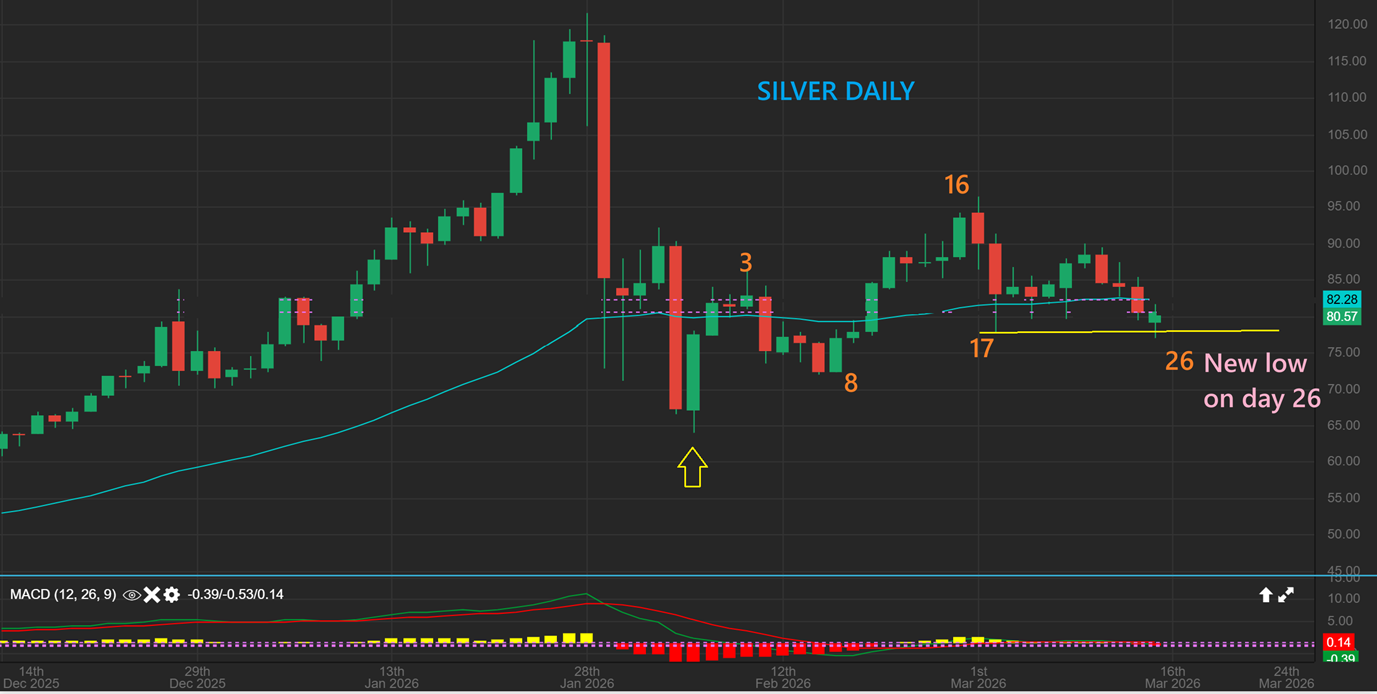
SILVER also gave us a new low on day 26. That is fine, but it is earlier than normal. If the USD starts to pull back and Gold and Silver both move higher, they’d be in ‘Sync’ and we could have a dcl as early as day 26.
.
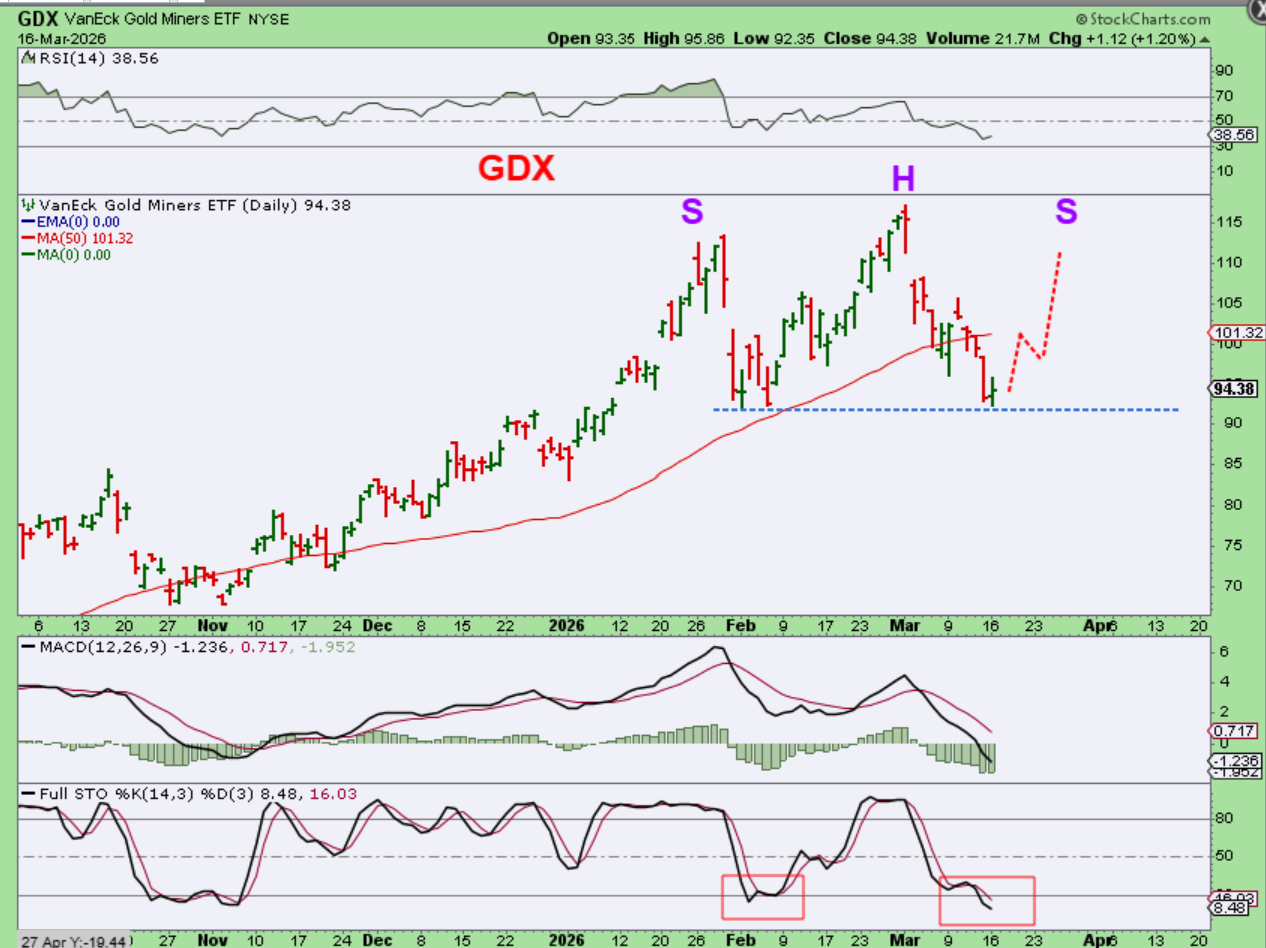
GDX should also put in a bounce, and I mentioned in the weekend report that it may give us a H&S, so that is something to watch for. I mentioned this because the Miners sold off fast and almost even broke below the February low, so they are undergoing selling after each rally now.
.
So we still have some choppiness, and it is hard to know exactly when a low (or a dcl in this case) develops, but we are within the timing for a dcl in both the General Markets and the Precious Metals. When that dcl develops we can get a bounce for 7-10 days in the General Markets, so that is a week or 2 of trading (5 trading days per week). Gold and silver would begin the second daily cycle and that could chop higher for the same amount of time or longer, we’ll just have to wait and see on that one. That chart of Silver in 2011 showed that after the blow off top slam down, it chopped around higher for 2 months. Oil is also bullish and can chop higher or lower, depending on the Iran war and the blockage of Oils delivery. Releasing Oil from the U.S. & the world reserves may allow the price to drop, we’ll have to wait and see on that one.
.
Finally I am going to keep mentioning this: Right now we know that the markets are choppy and consolidating and in a state of ‘uncertainty’ and ‘heightened concern’. It is very hard to make gains trading in this kind of a market. For the ‘buy and hold’ group, you just ride it out and so far the drops haven’t been very bad. Traders need to
1. Keep position size small
2. Sit on the sidelines and do some homework.
Homework for me is to watch which stocks or sectors are holding up better than others. Are there stocks still near the highs? They will pull back mildly when the ICL comes, and they will recover more quickly. That is how I treated RKLB, LMND, MU, TSEM, AAOI, RR, (Robotics, Quants, Nukes, Energy) as stocks and sectors that recovered quickly after last years ICL drop. When you were able to buy those low, they doubled and tripled. We can do that again. Let me show you an example here.
.
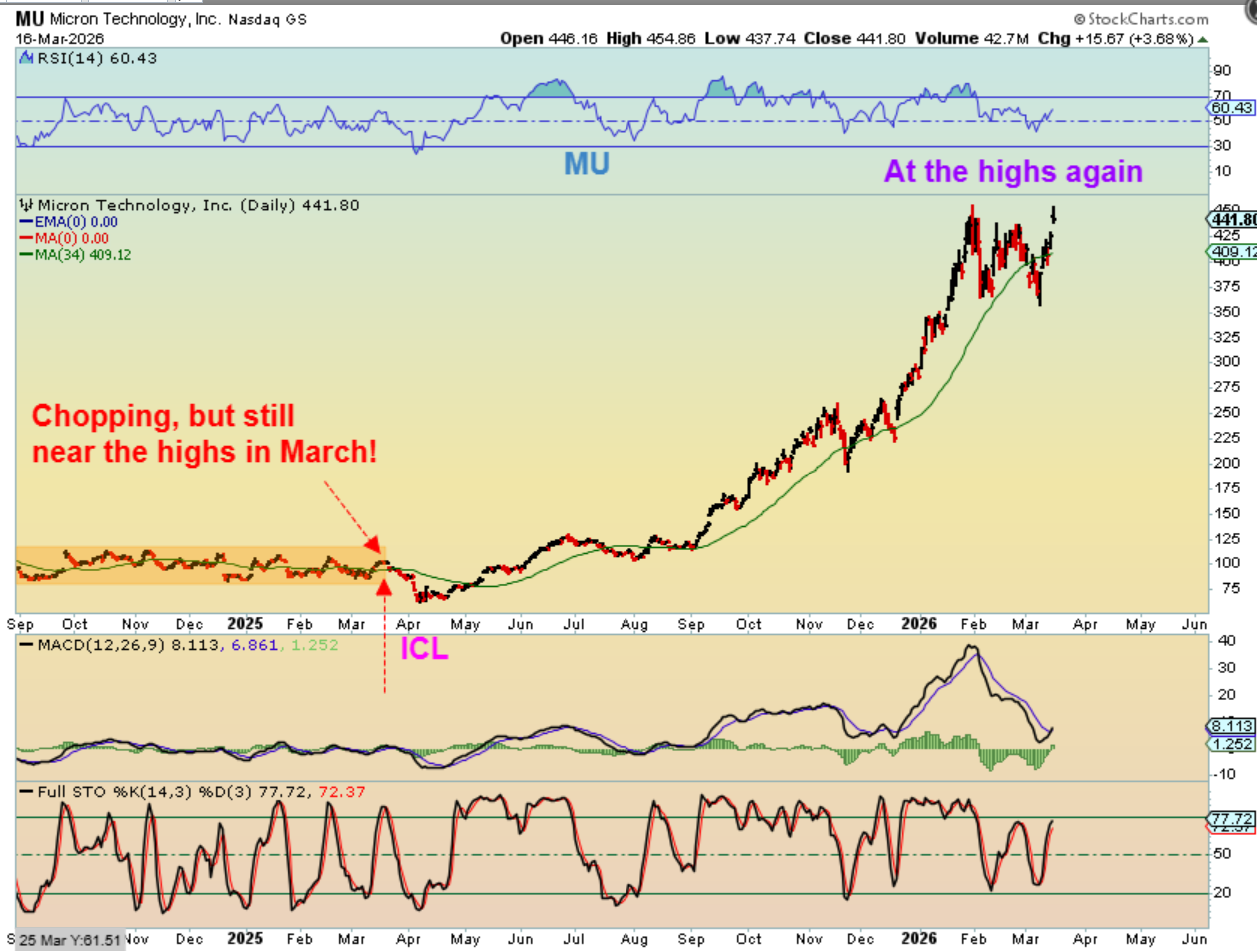
MU was a buy at the last ICL, because it was only choppy and sideways in Jan through March. It really only sold off at the end of the intermediate cycle in April. Notice how MU dropped into the April ICL, but was near the highs 1 month earlier. Look what happened after April. MU and TSEM are at their highs again now too. A drop to say $300 at the ICL in April or May could possibly see it run to $600 and $900 after an ICL. Right now some drone stocks and Rare Earth, Semiconductor and other stocks are still holding up well.
.
For traders, ‘CASH is still a position’ or keep the trades small after a dcl develops, and looking for stocks that are holding up well in the chop can pay off later, when we see the 3rd or 4th daily cycle drop a little deeper. You also can ‘Short’ a bounce at the dcl, maybe 7 – 10 days later, but the recent choppiness has made that difficult. It may be easier in the next daily cycle. Bitcoin is below. Enjoy your Tuesday markets.
.
~ALEX
.
BITCOIN broke above the 50sma and this is what I expected. IT was able to break higher in January too, but then it should run out of time and drop again. My weekend report discussed interesting developments with Bitcoin, and I’ll repeat that thought as time goes on, but this sector should lead to a strong buy in 2026. AND…
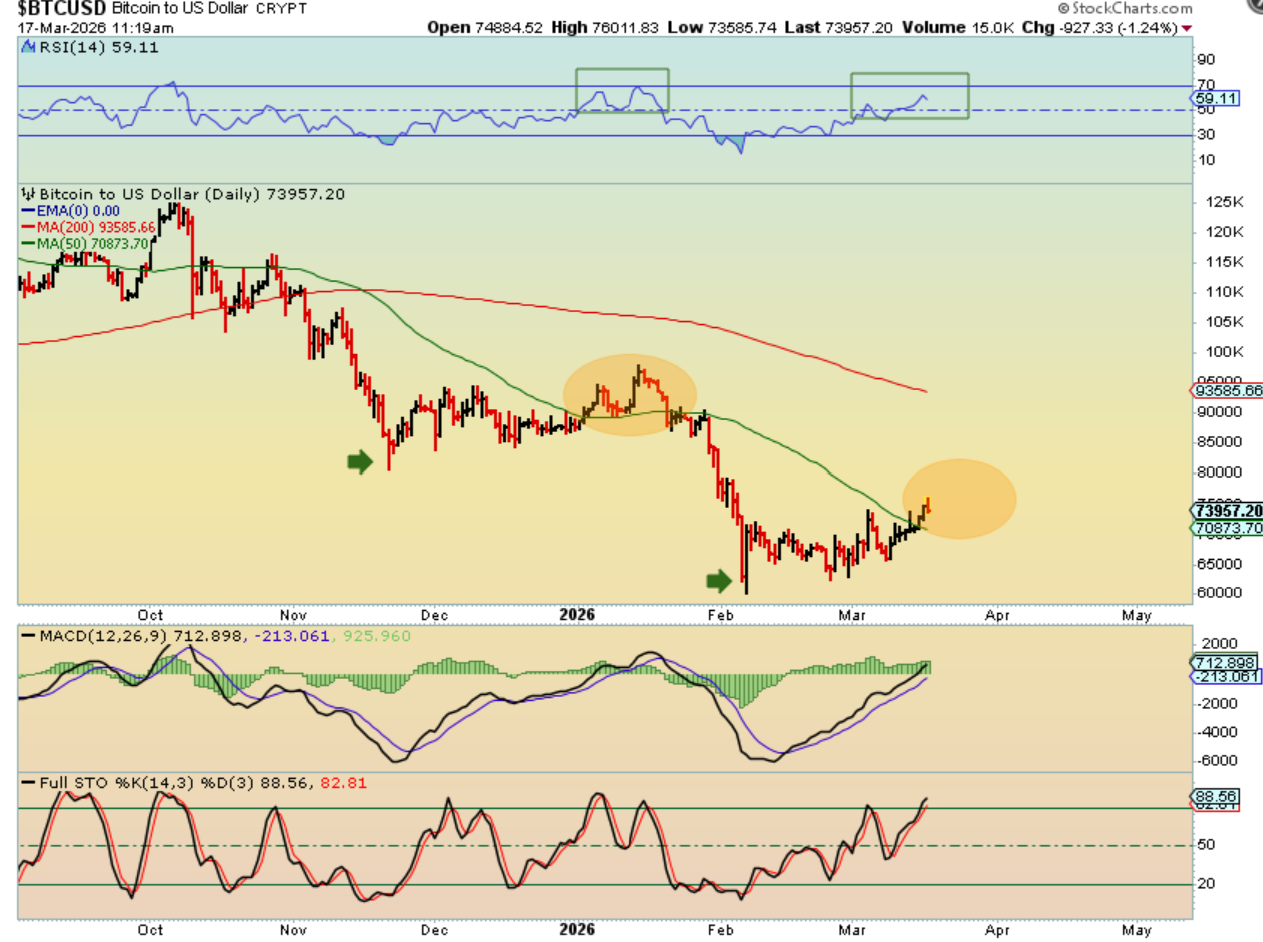
In the ABOVE chart, you see that Bitcoin fell from $125,000 to $60,0000.
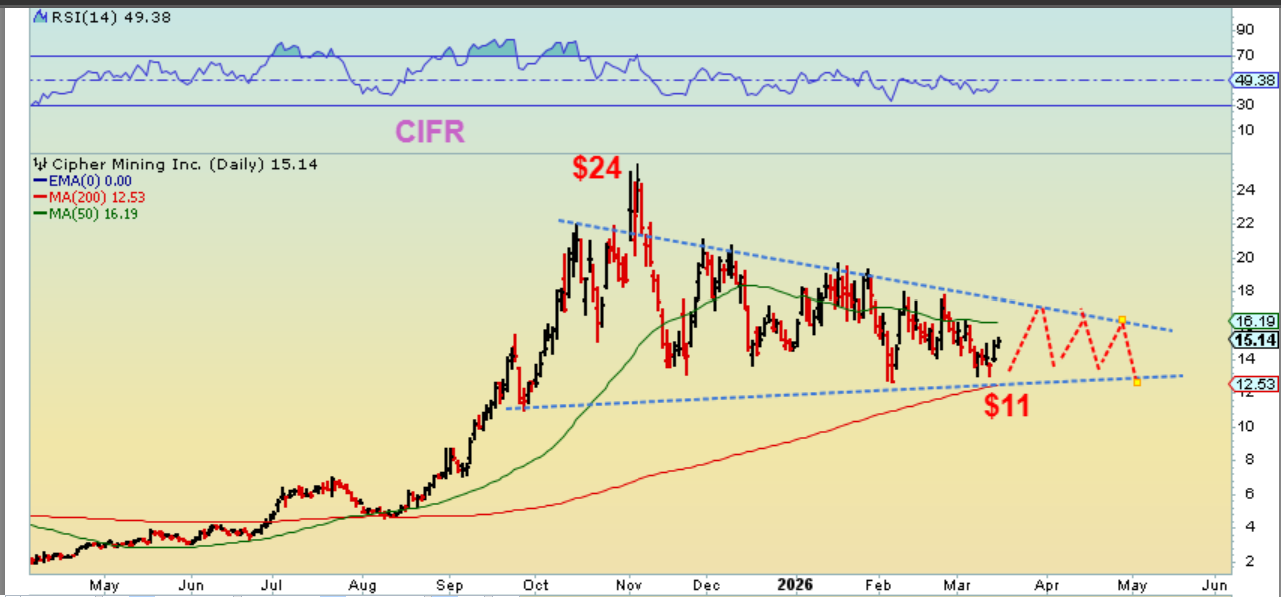
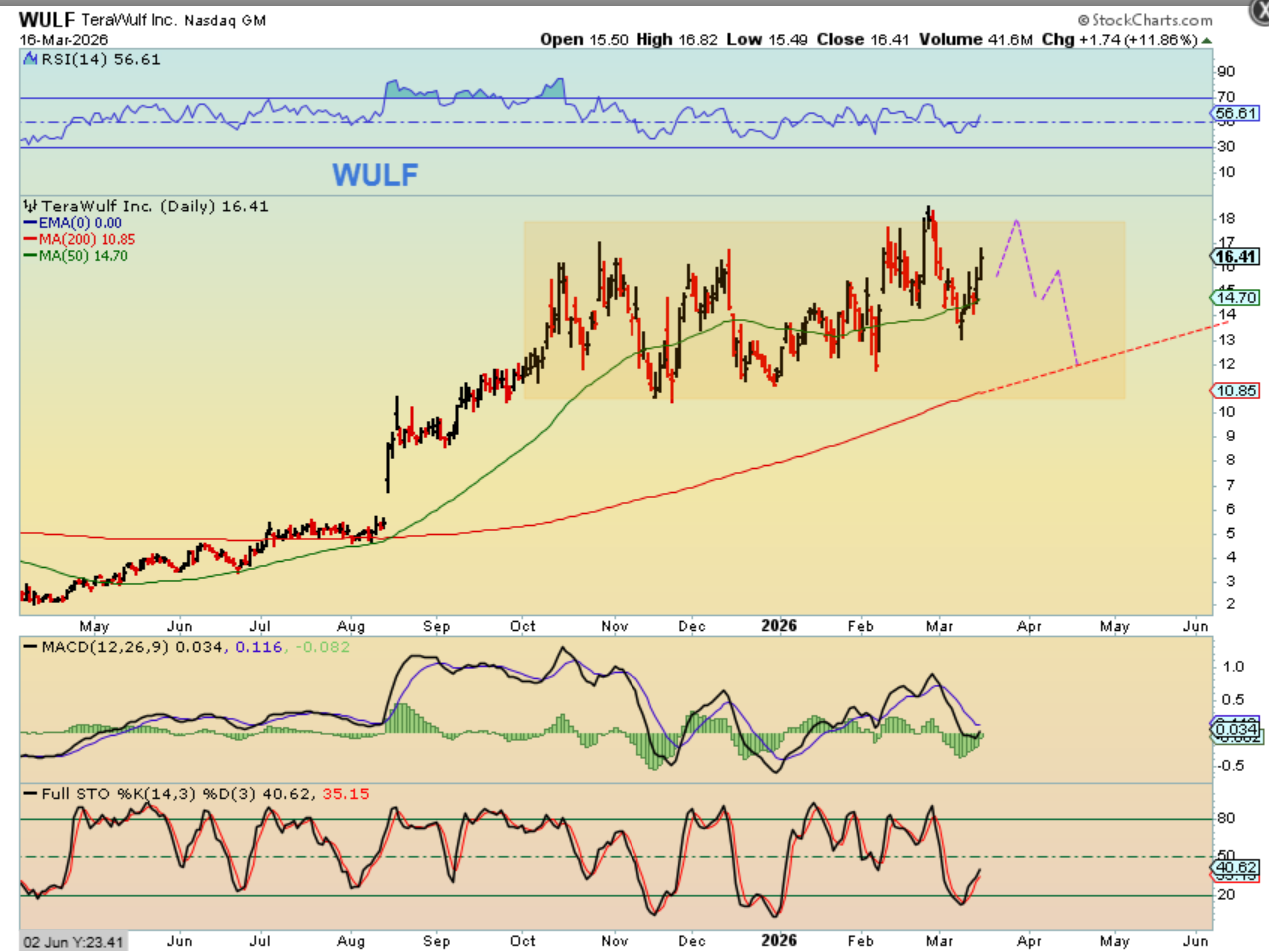
When I said to look for stocks holding up better in the General Markets, that applies here too. I am not buying in this sector, but I want to watch WULF, CIFR, IREN, HUT, etc during Bitcoins drop roughly from $120,000 to $60,000. When Bitcoin bottoms, these may only pull back a little, and could offer very good gains again. WULF IS NOT FAR FROM THE HIGHS, for example.
.
CIFR did get cut in half, but it was one of those crypto stocks that ran from under $2 to $24! This is a bullish consolidation as Bitcoin dropped, so keep an eye on these. It could drop under $10 and then run to $80 or more on the next run. 2026 will offer a great buying opportunity in this sector.