.
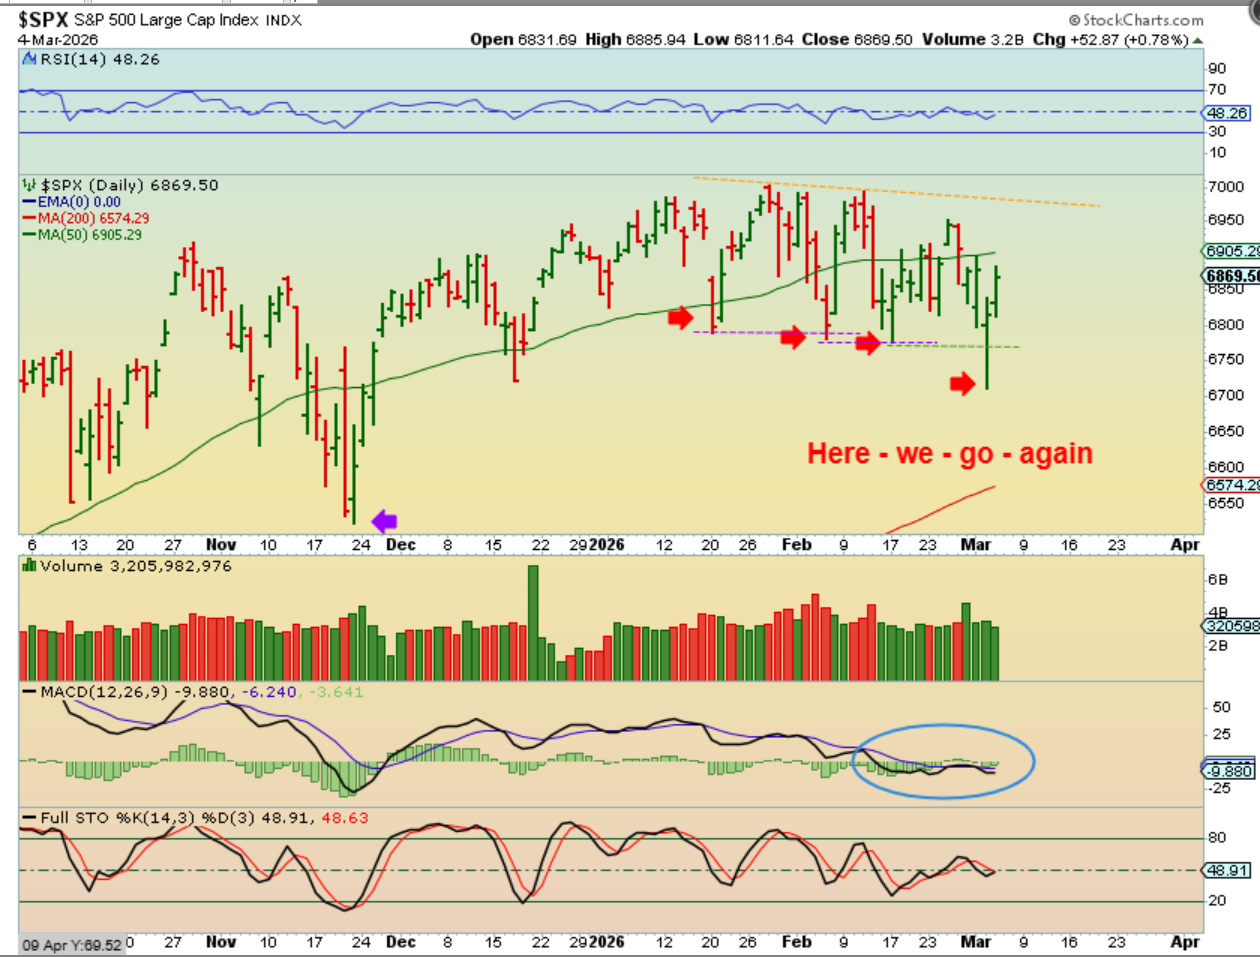
SPX – What can I say? Every time a low is taken out, we get a solid bounce, but then SOMETHING causes it to sell off again. Let’s look at the NASDAQ…
.
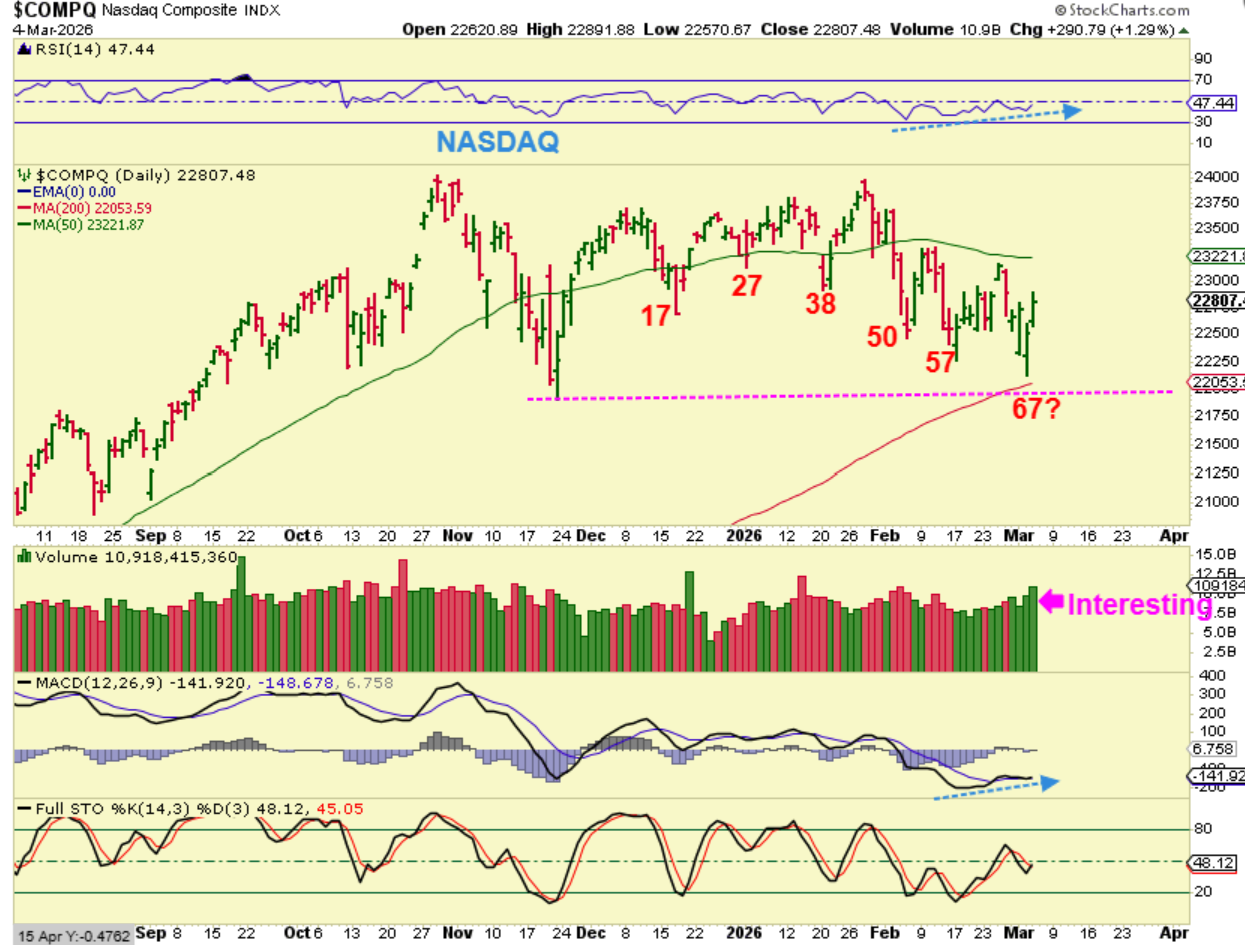
THE NASDAQ is interesting because there seems to be a little hope.
1. I am starting to see divergence in the MACD and RSI with the new lows at day 67.
2. Also, we saw good volume buying on Wednesdays and price was never red.
Using ‘technical analysis’, I would say that I really like what I see. Using ‘Cycles’, however, it would seem like a stretch that we have a 67 day long first daily cycle, but since it didn’t break the ICL at this point, it cannot be completely ruled out.
.
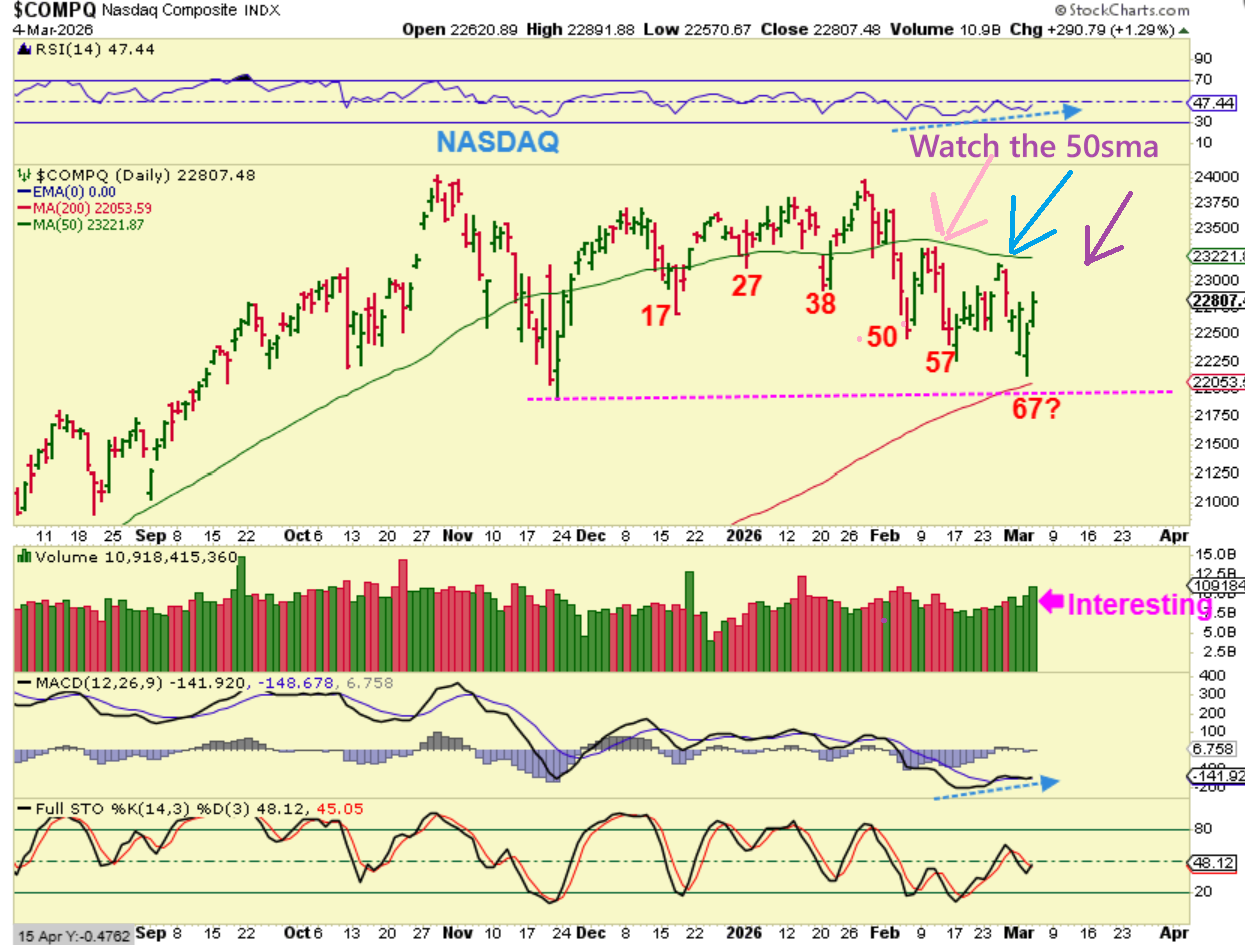
So the next step is to watch the 50sma. Let’s just see if this can get back above the 50sma, because it couldn’t even reach the 50sma on the last 2 attempts. If it breaks above the 50sma now, that would be higher high and show us some strength. It would appear to be becoming bullish.
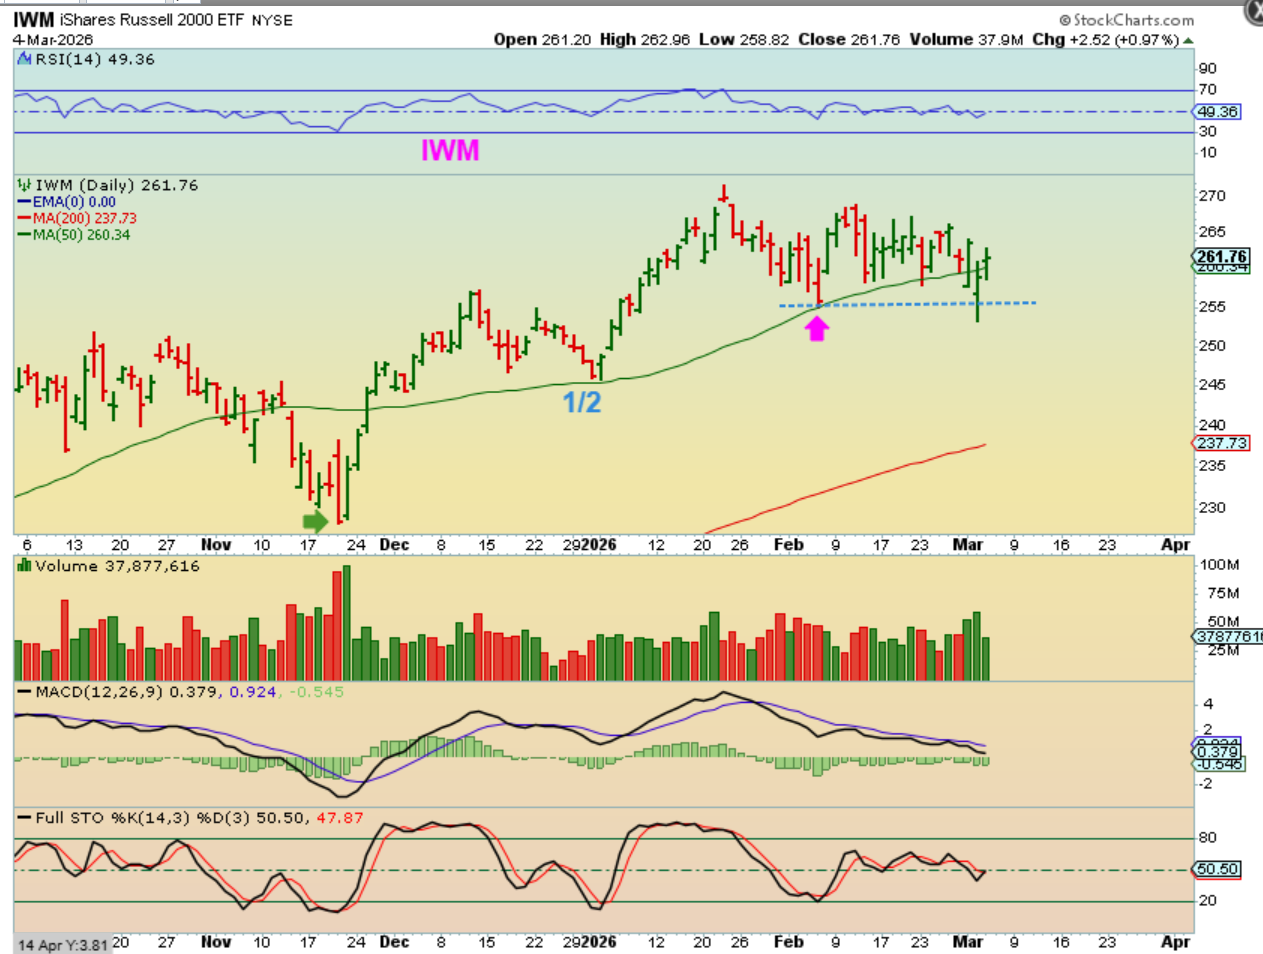
THE IWM also broke below what should have been a dcl in Feb. That is a failure, but if it rallies to new highs, the dcl shifts and becomes Tuesdays low instead. Why?
Well, this may seem ‘unlikely’ that a dcl comes in this late in a daily cycle, and it usually is, but this chop is being caused by VERY uncommon circumstances, like War starting in Iran, inflation fears, The US administration arresting the leader of Venezuela. The US President talking about taking over Cuba, or Greenland, etc, etc. These are NOT normal times, and this choppy indecision is not ‘normal’ either.
.
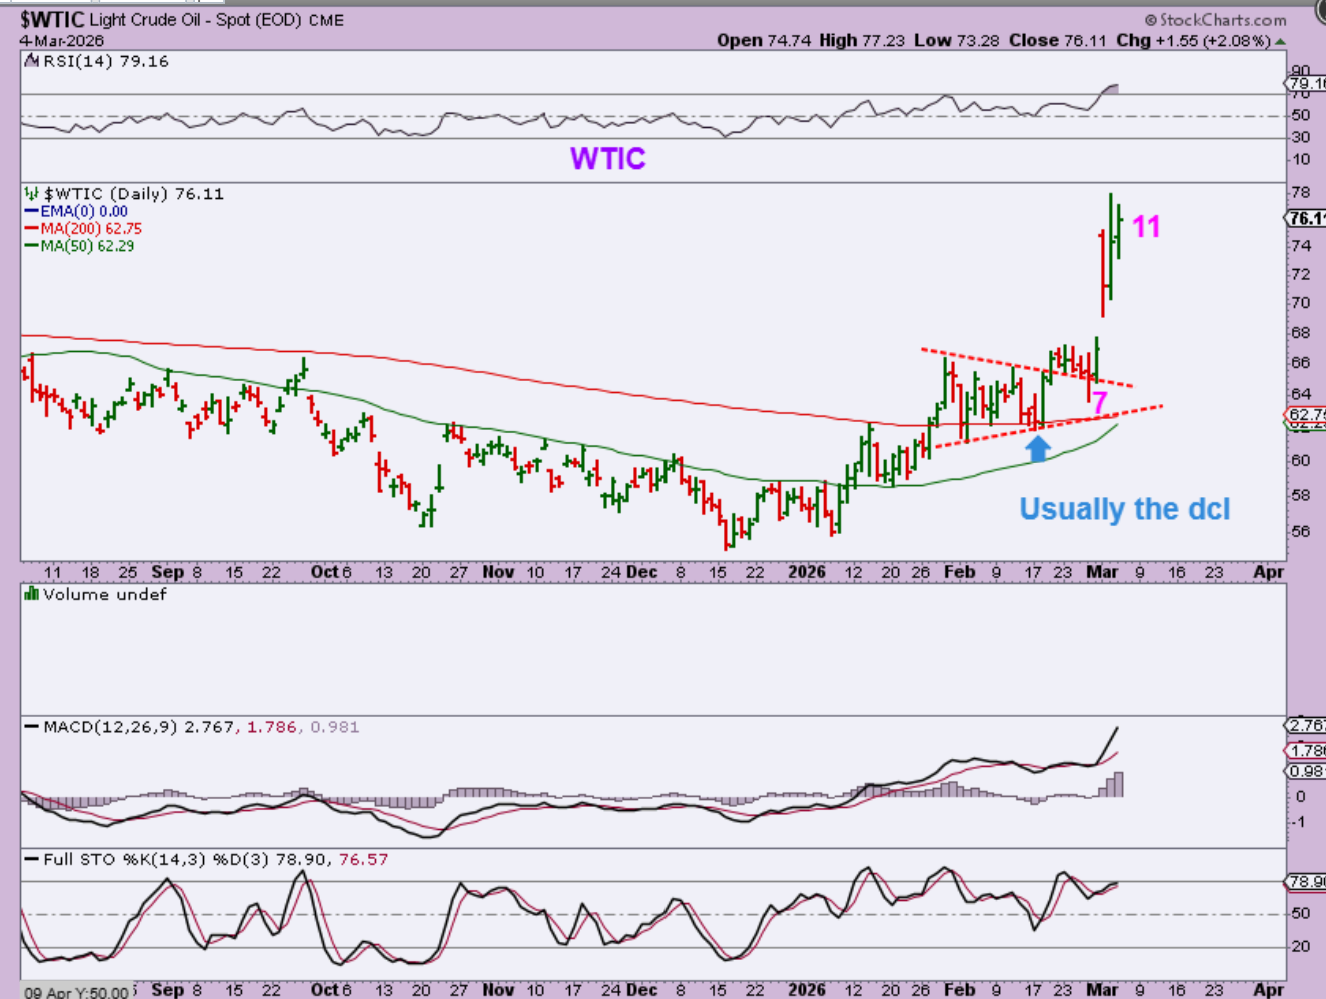
WTIC – Oil does seem to have a dcl in place inside of the triangle or on what I marked as ‘day 7’. If that dcl formed as the last tag inside of the triangle, then yesterday it moved higher on day 11
.
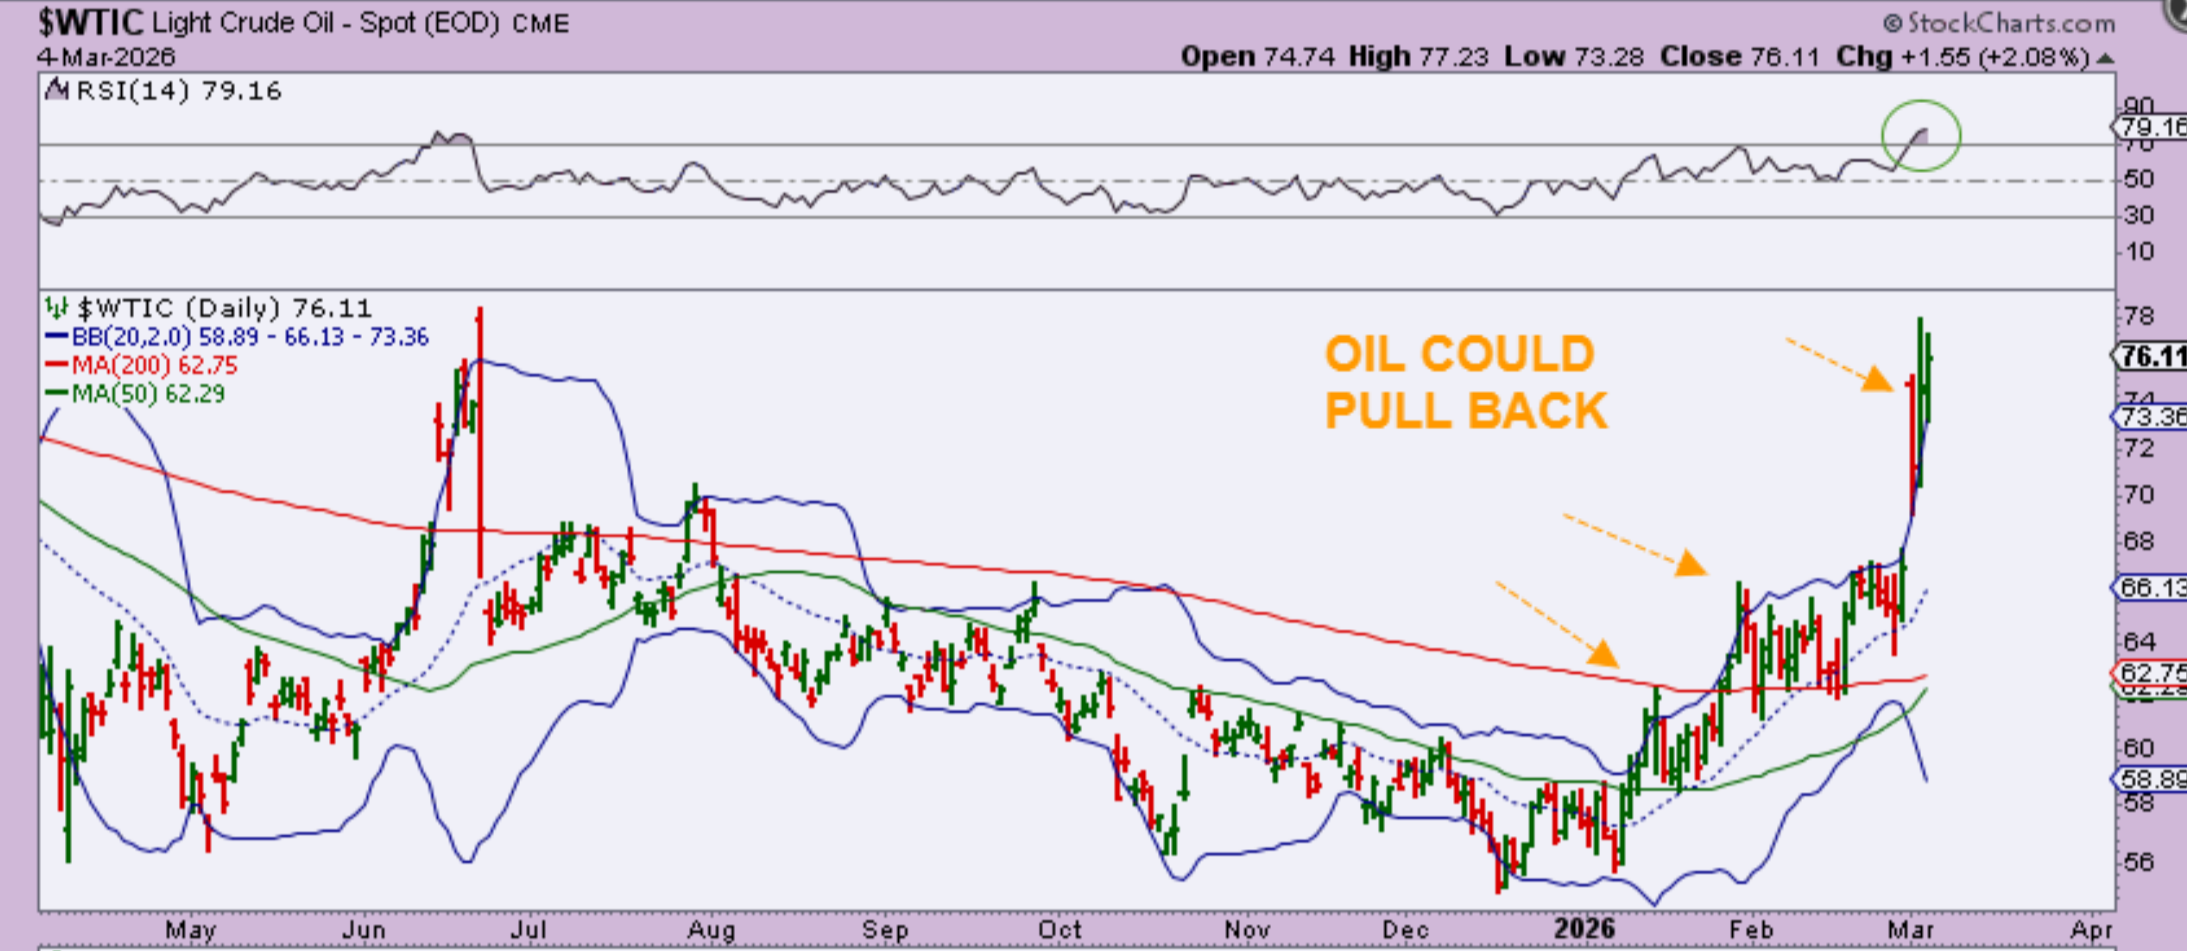
WTIC – It would not surprise me to see Oil stall and flag sideways or pullback, since it is well above the Bollinger Bands
.
YESTERDAY I SAID:
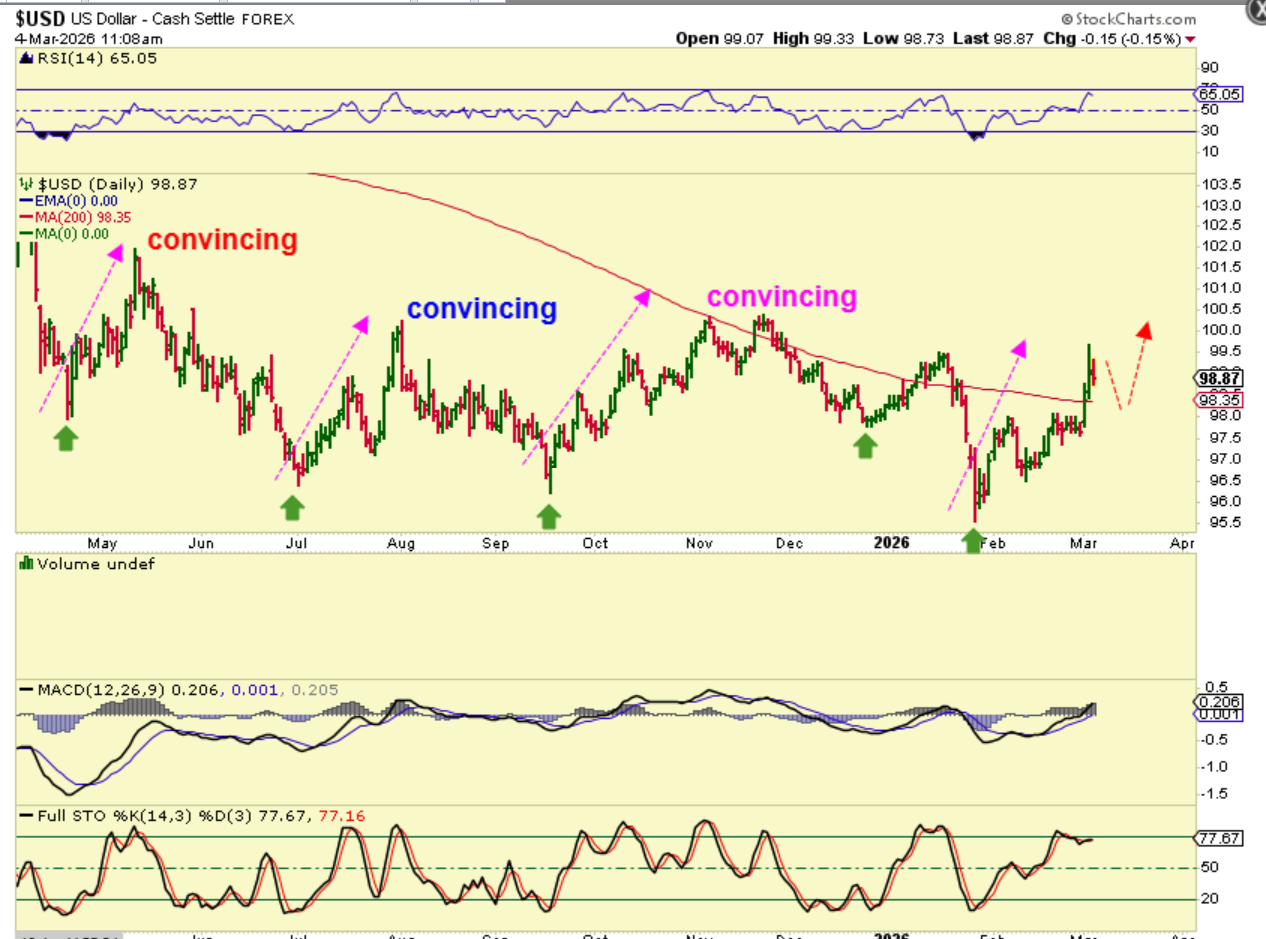
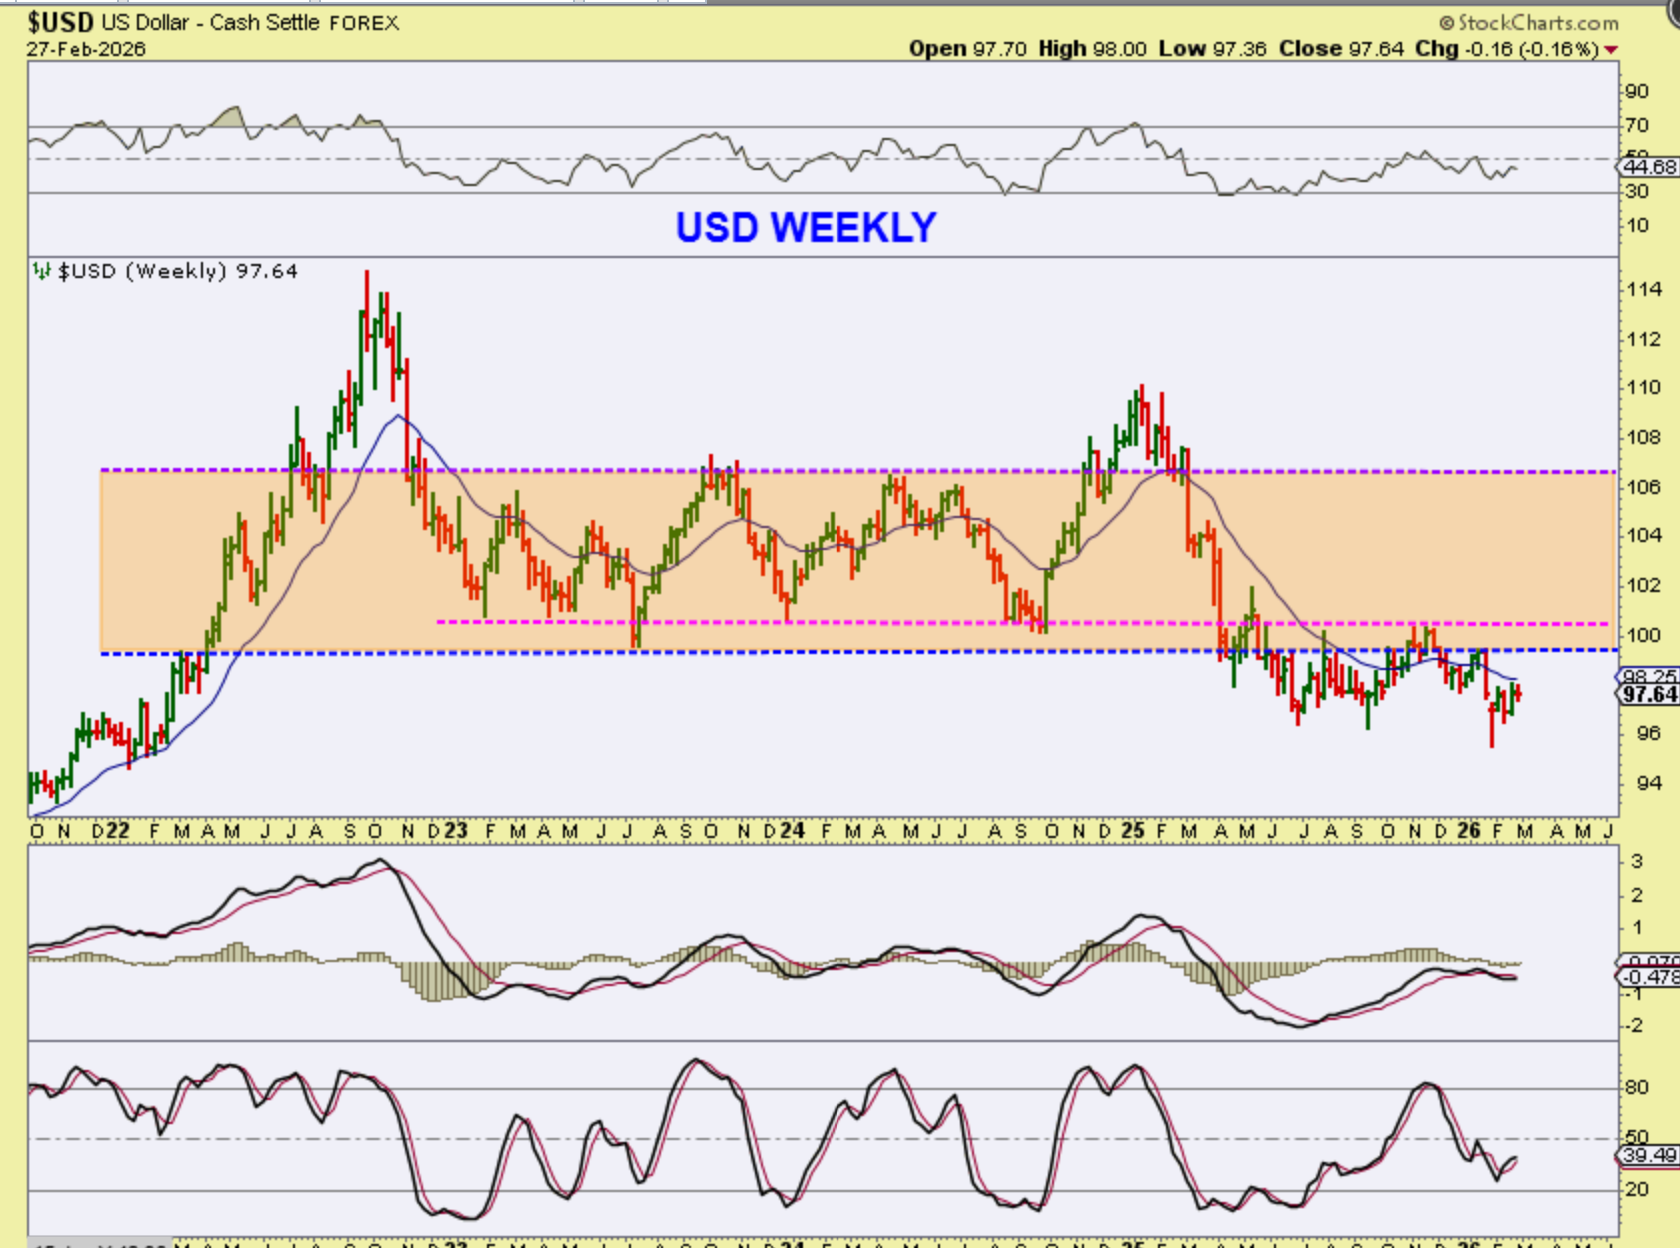
No doubt about it, The USD is putting in a convincing move here. That said, we have seen many convincing moves with the USD (see the chart please), and I drew a possible dip to the 200sma as a dcl.
.
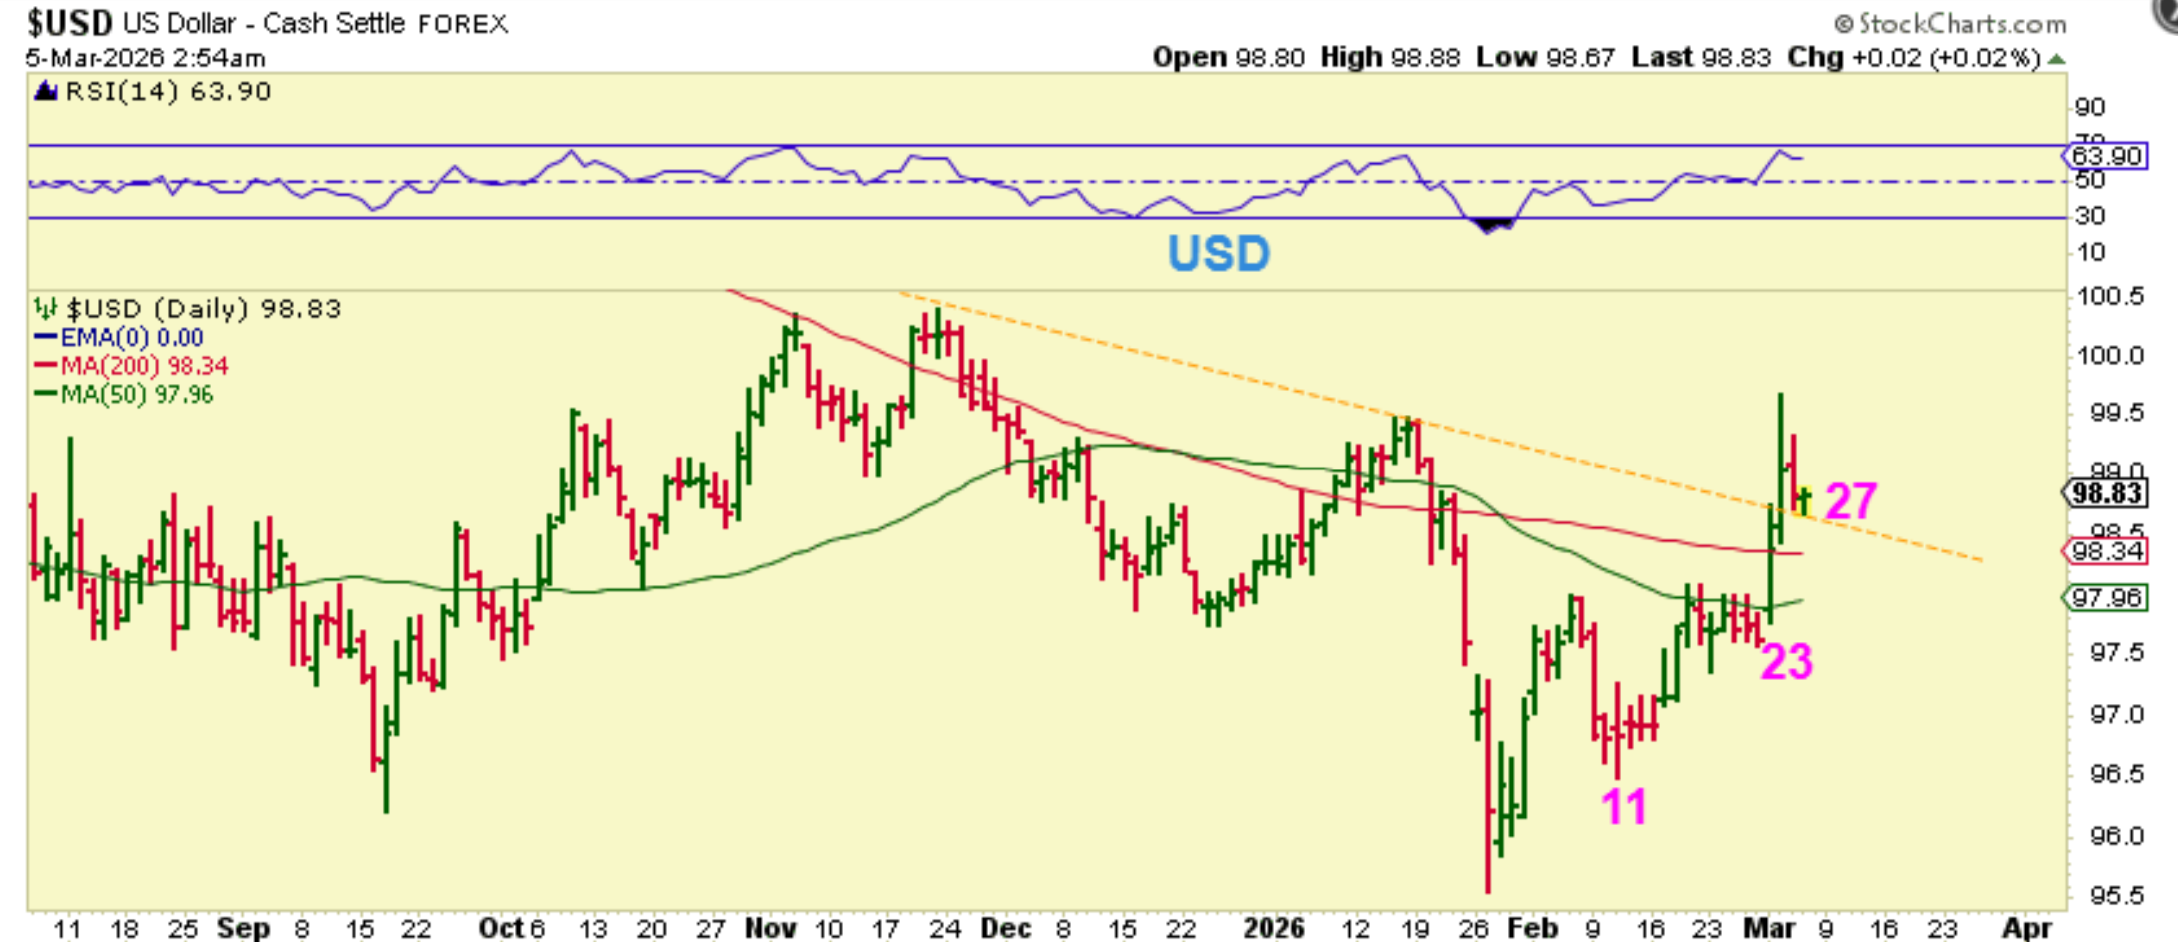
The USD stalled on day 27 and landed on a trendline as a possible back-test, and it may ride down that trendline to put in a dcl. This might be putting in a dcl here and then make a run higher, and I say that because…
.
The USD – I said in our weekend report that the USD could run up higher and test resistance (Purple and Magenta lines). It is at that point that we’ll see if it has strength to start a recovery or not.
.
Yesterday I mentioned this about cycle timing:
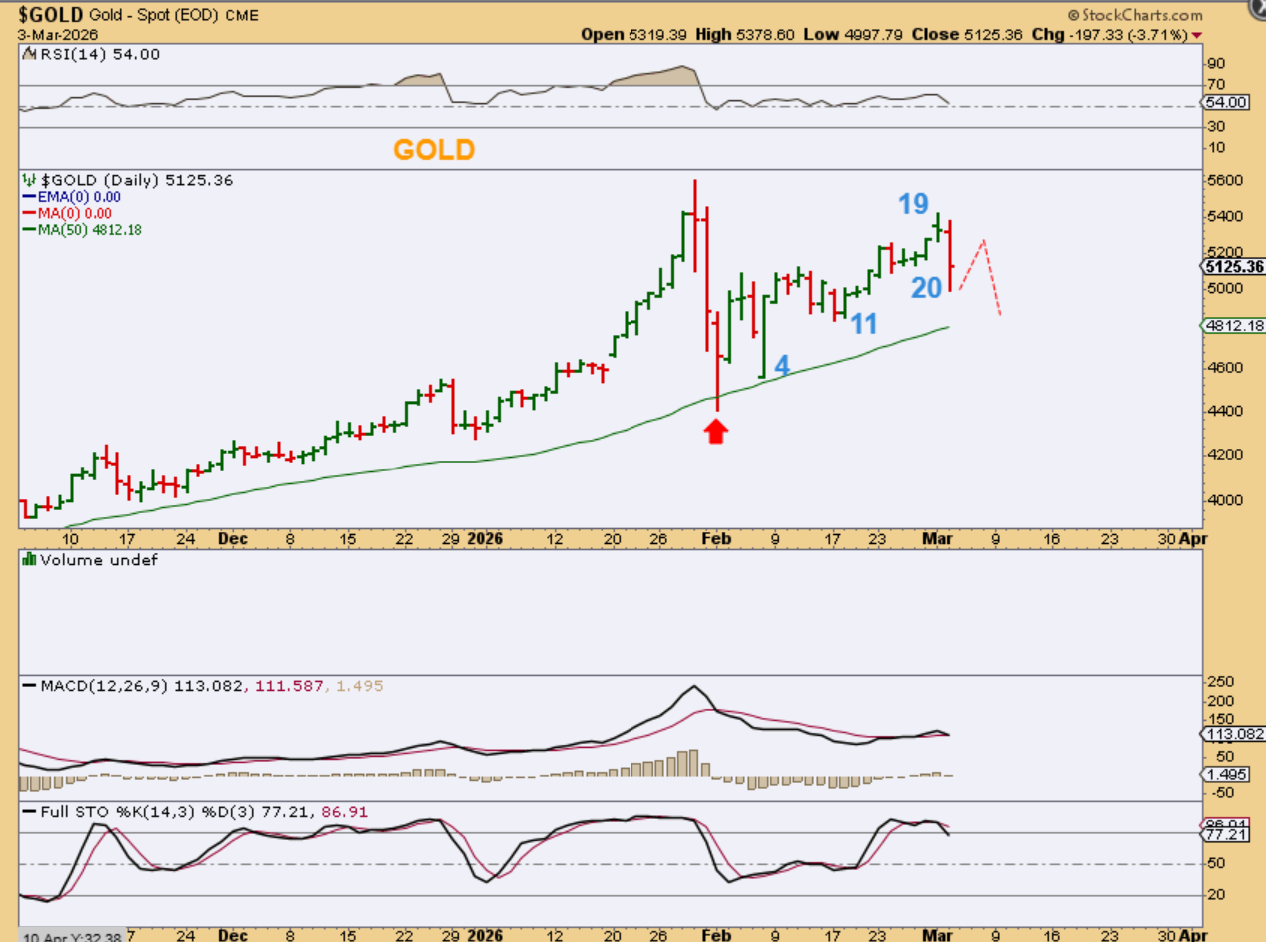
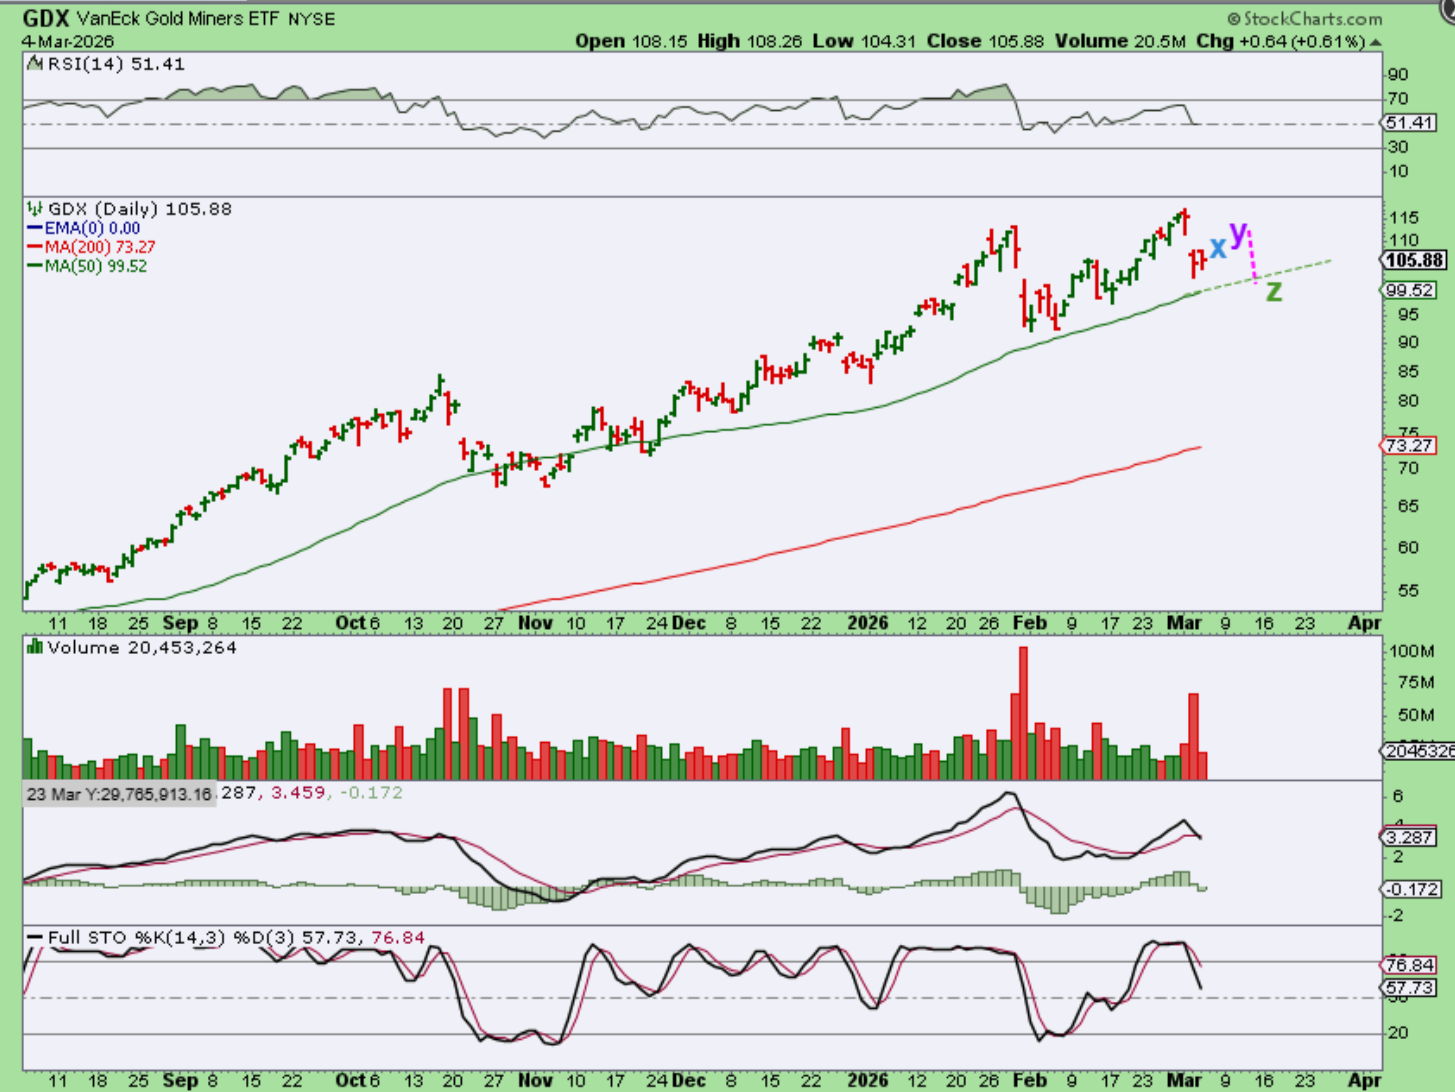
GOLD was on day 20 yesterday, so that drop is not unexpected, but the size of it was. I was mentioning that we could start to form a handle at anytime on what looked to be a cup forming. I still think that Gold could bounce and drop again with that dcl due. I drew a possible path.
.
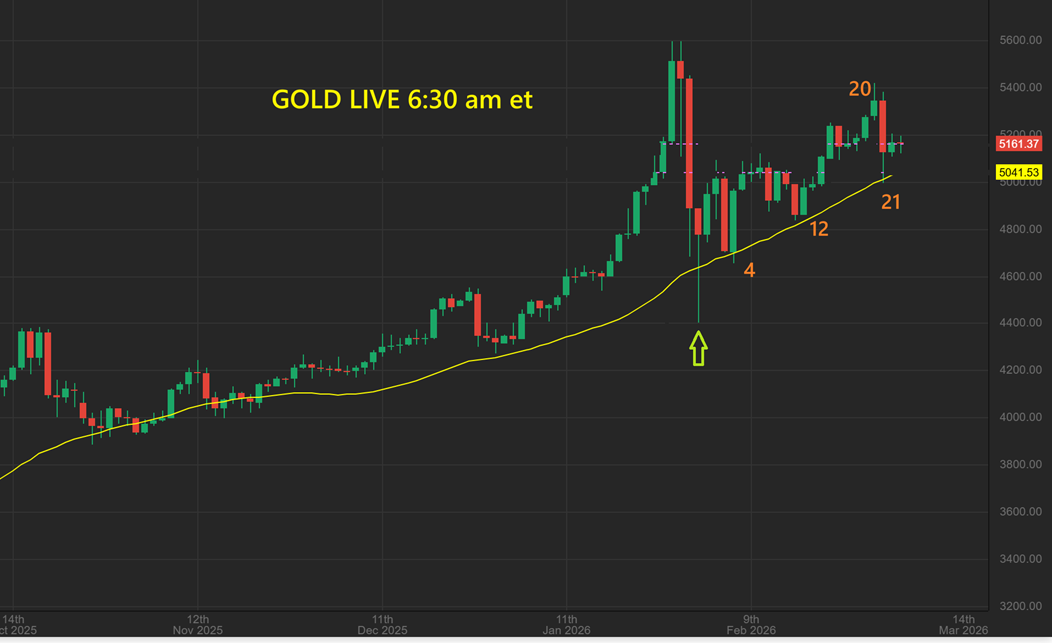
GOLD LIVE 6:30 am ET– I get a different count using spot Gold, but we have a day 21 low. I used the 34 sma and Gold does seem to find support here, so we may be seeing a dcl on day 21, or as seen on the ABOVE chart, we could bounce and drop 1 more time to a dcl near day 25 or so.
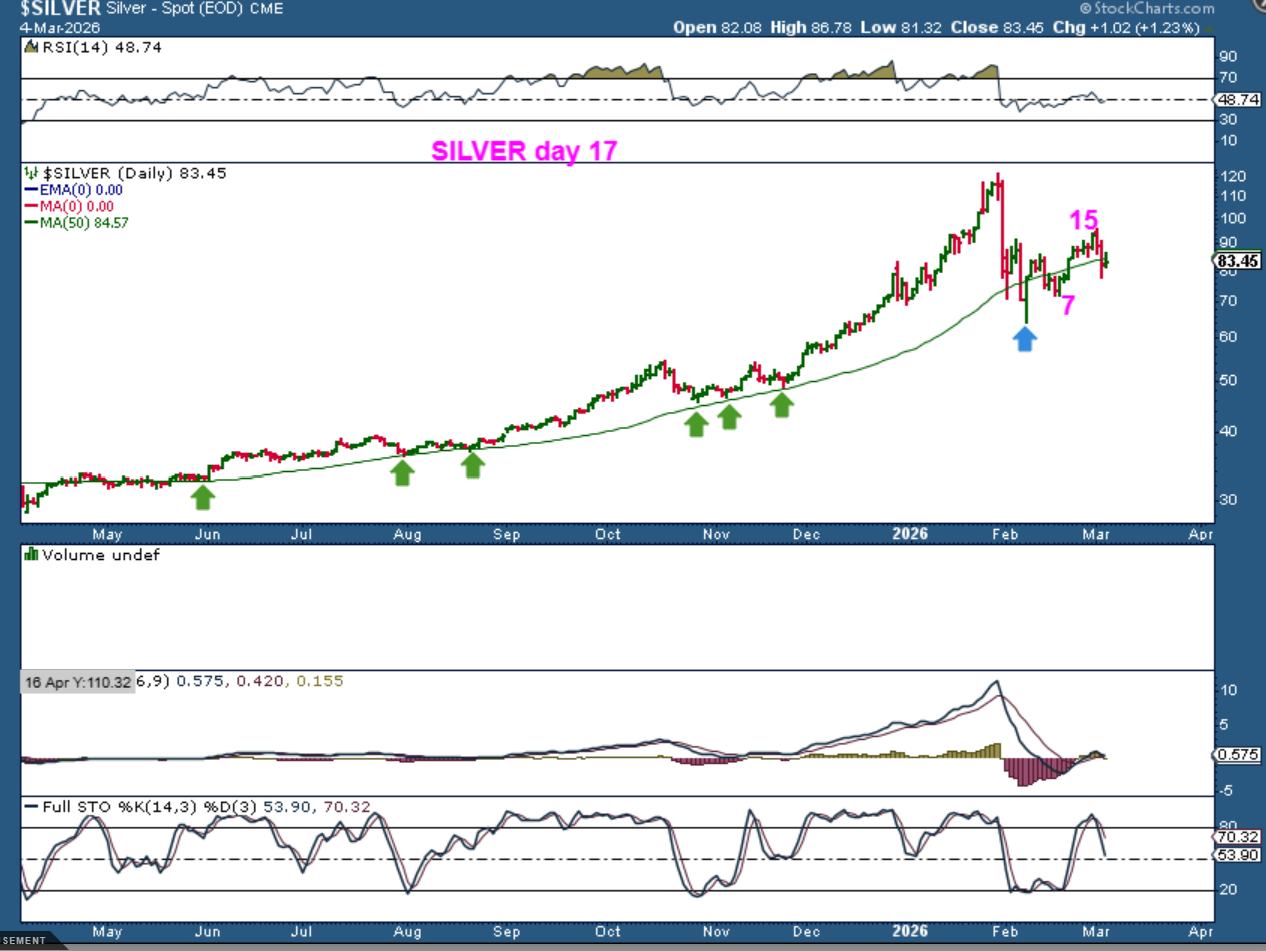
SILVER DAILY bottomed after Gold so it was only on day 17 on Wednesday. That means that we should expect a dcl ahead, even though we may bounce here first. The recent crash was the first time that Silver lost the 50sma in almost a year, and we are below that 50sma now too.
THE GDX ETF or Miners follow Gold and we could see a bounce similar to something drawn here and then a drop into a dcl.
.
The choppiness in the General Markets has continued and breaking to new lower lows continues to be a sign of weakness. At this point we are looking to see if we can get any signs of strength and continuation higher, rather than another drop to a lower low. This data at 8:30 a.m. may or may not help, right?
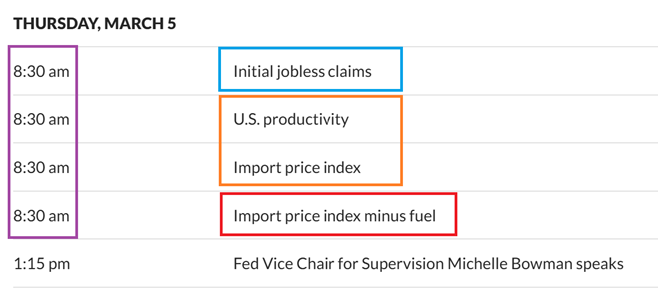
Oil could stall since it is outside of the Bollinger Bands and Gold and Silver are bouncing, but they may still have a dcl ahead too. I would love to see the data help the general markets to move higher and push price back above the 50sma, time is quickly running out for that to happen. So far we have seen lower lows and if that continues it is a very negative situation for March and possibly part of April. I’m going to cover this in detail in the weekend report. Enjoy your Thursday trading. 🙂
.
~ALEX
.
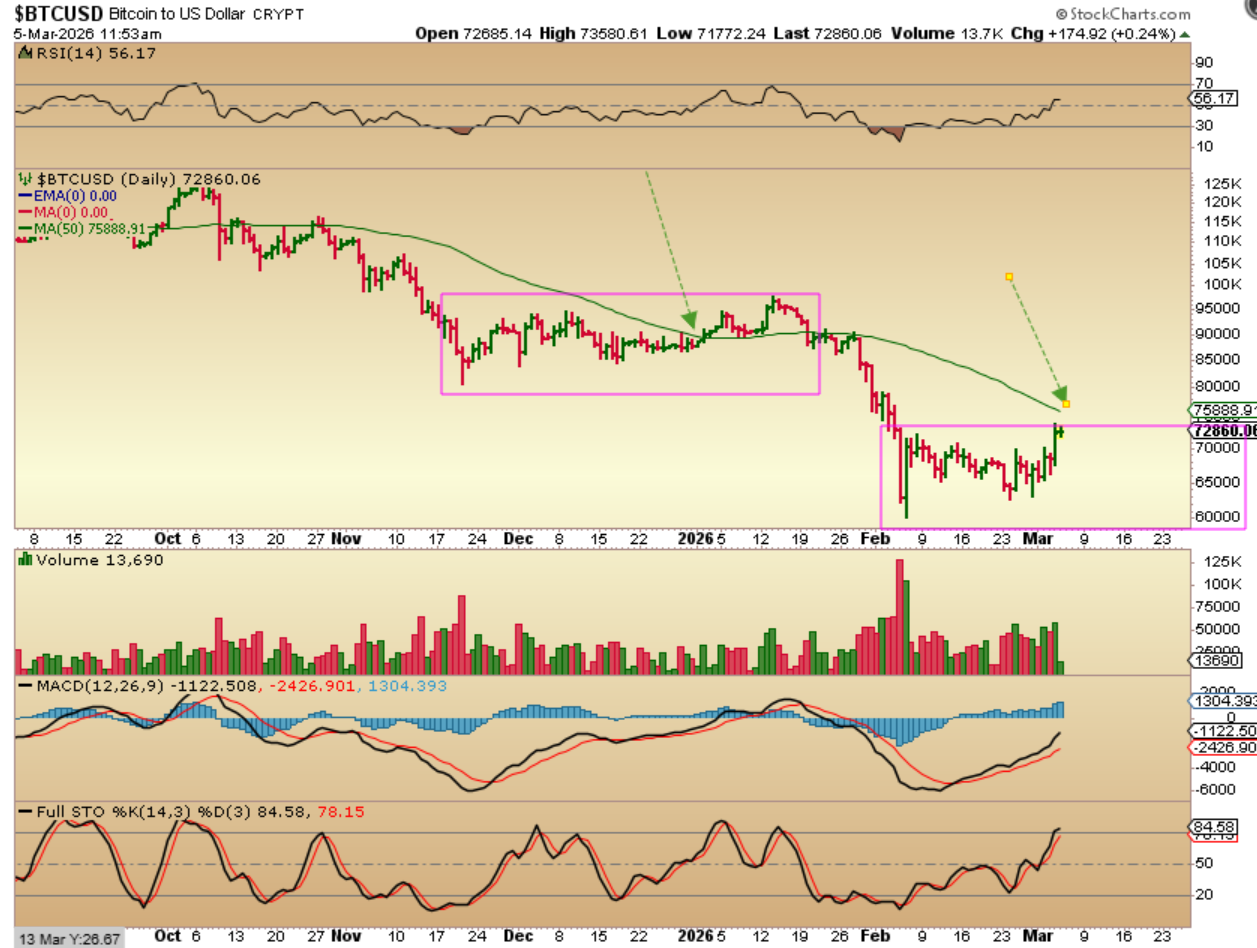
BITCOIN has still followed the path that it did on the last daily cycle. It chopped sideways for weeks and then it was able to finally get above the 50sma, before a steeper sell off followed later. Bitcoin looks ready to try to break above that 50sma. It may or may not be able to do that with current market conditions.
Wednesday March 4th – Feels Like This 
 Friday March 6th
Scroll to top