.
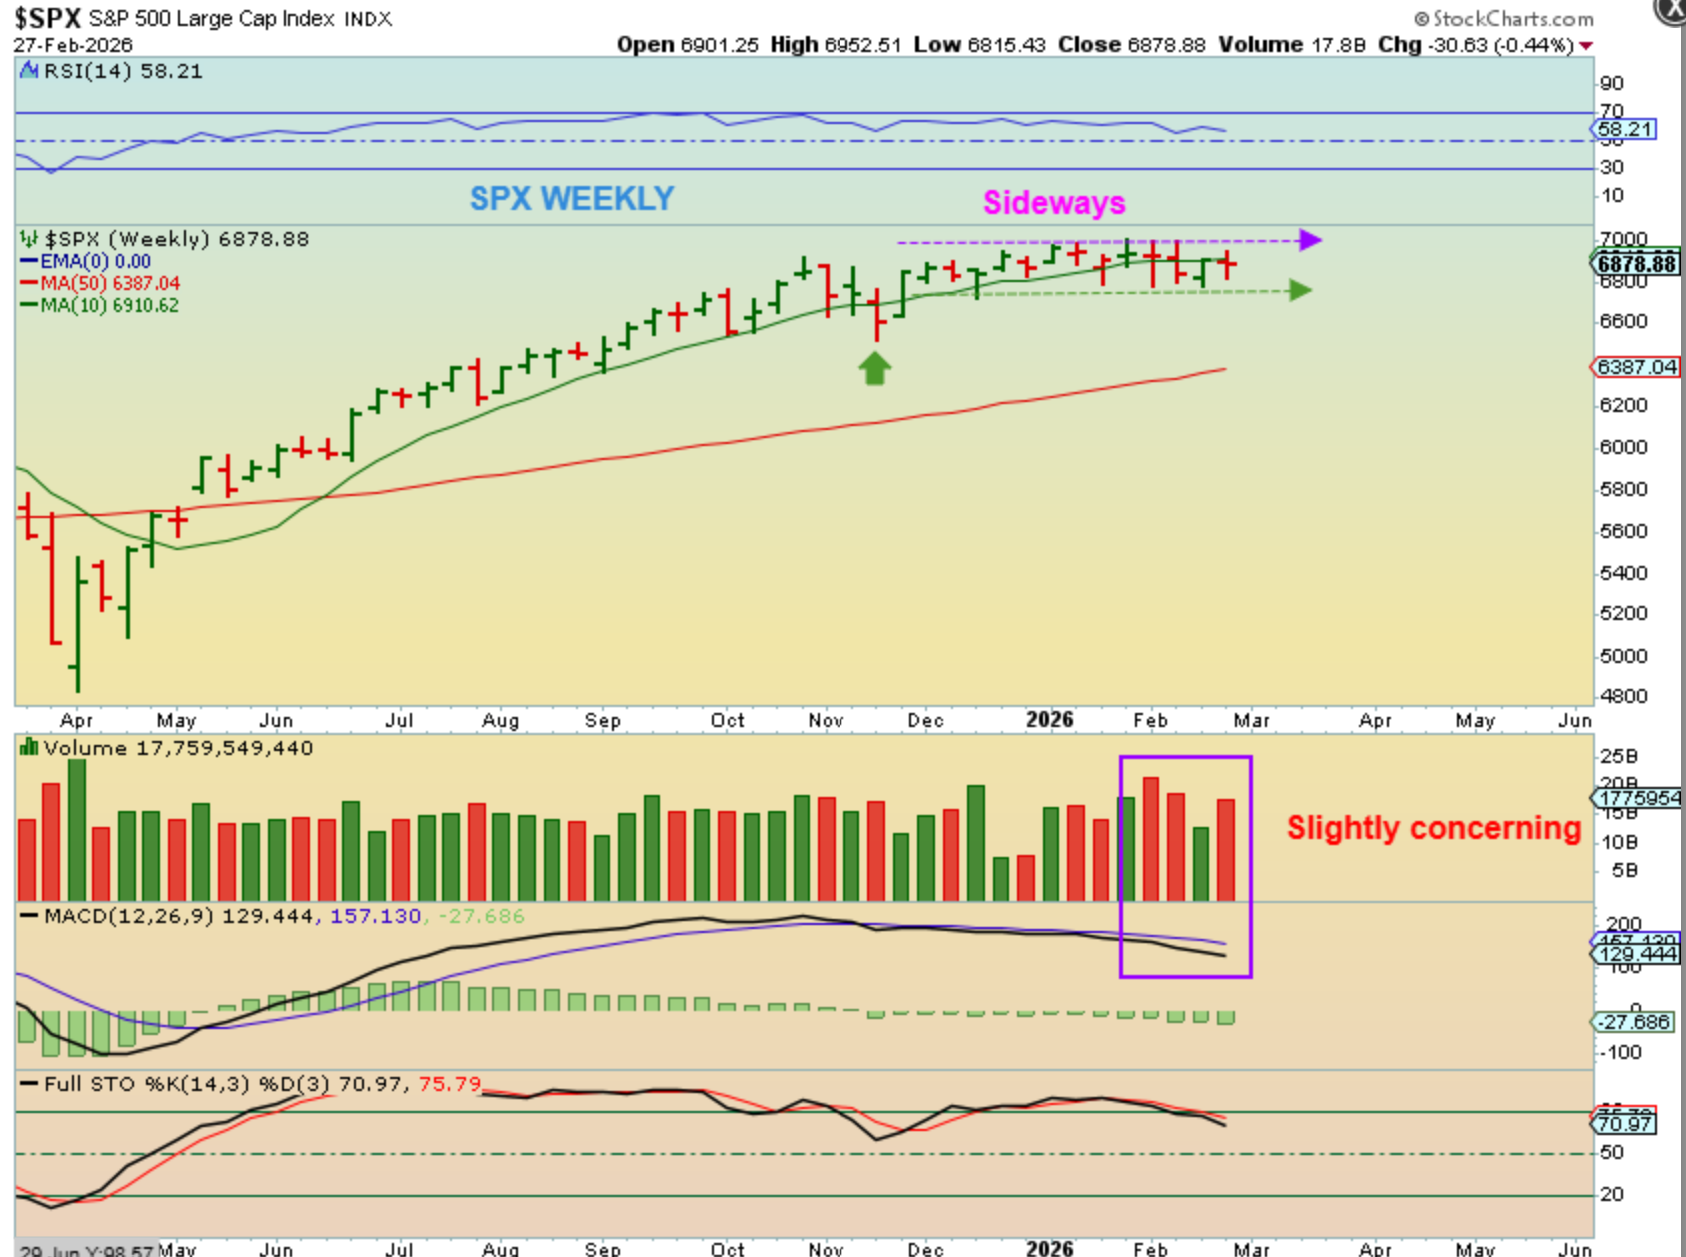
SPX – I find this slightly concerning because as we travel sideways, the red volumes are increasing. This can be a sign of ‘distribution’ with ‘strong hands selling into weak hands’ or in other words, smart money unloading / profit taking to the new traders. We simply need a push to new highs in this second daily cycle to help to alleviate those concerns.
.
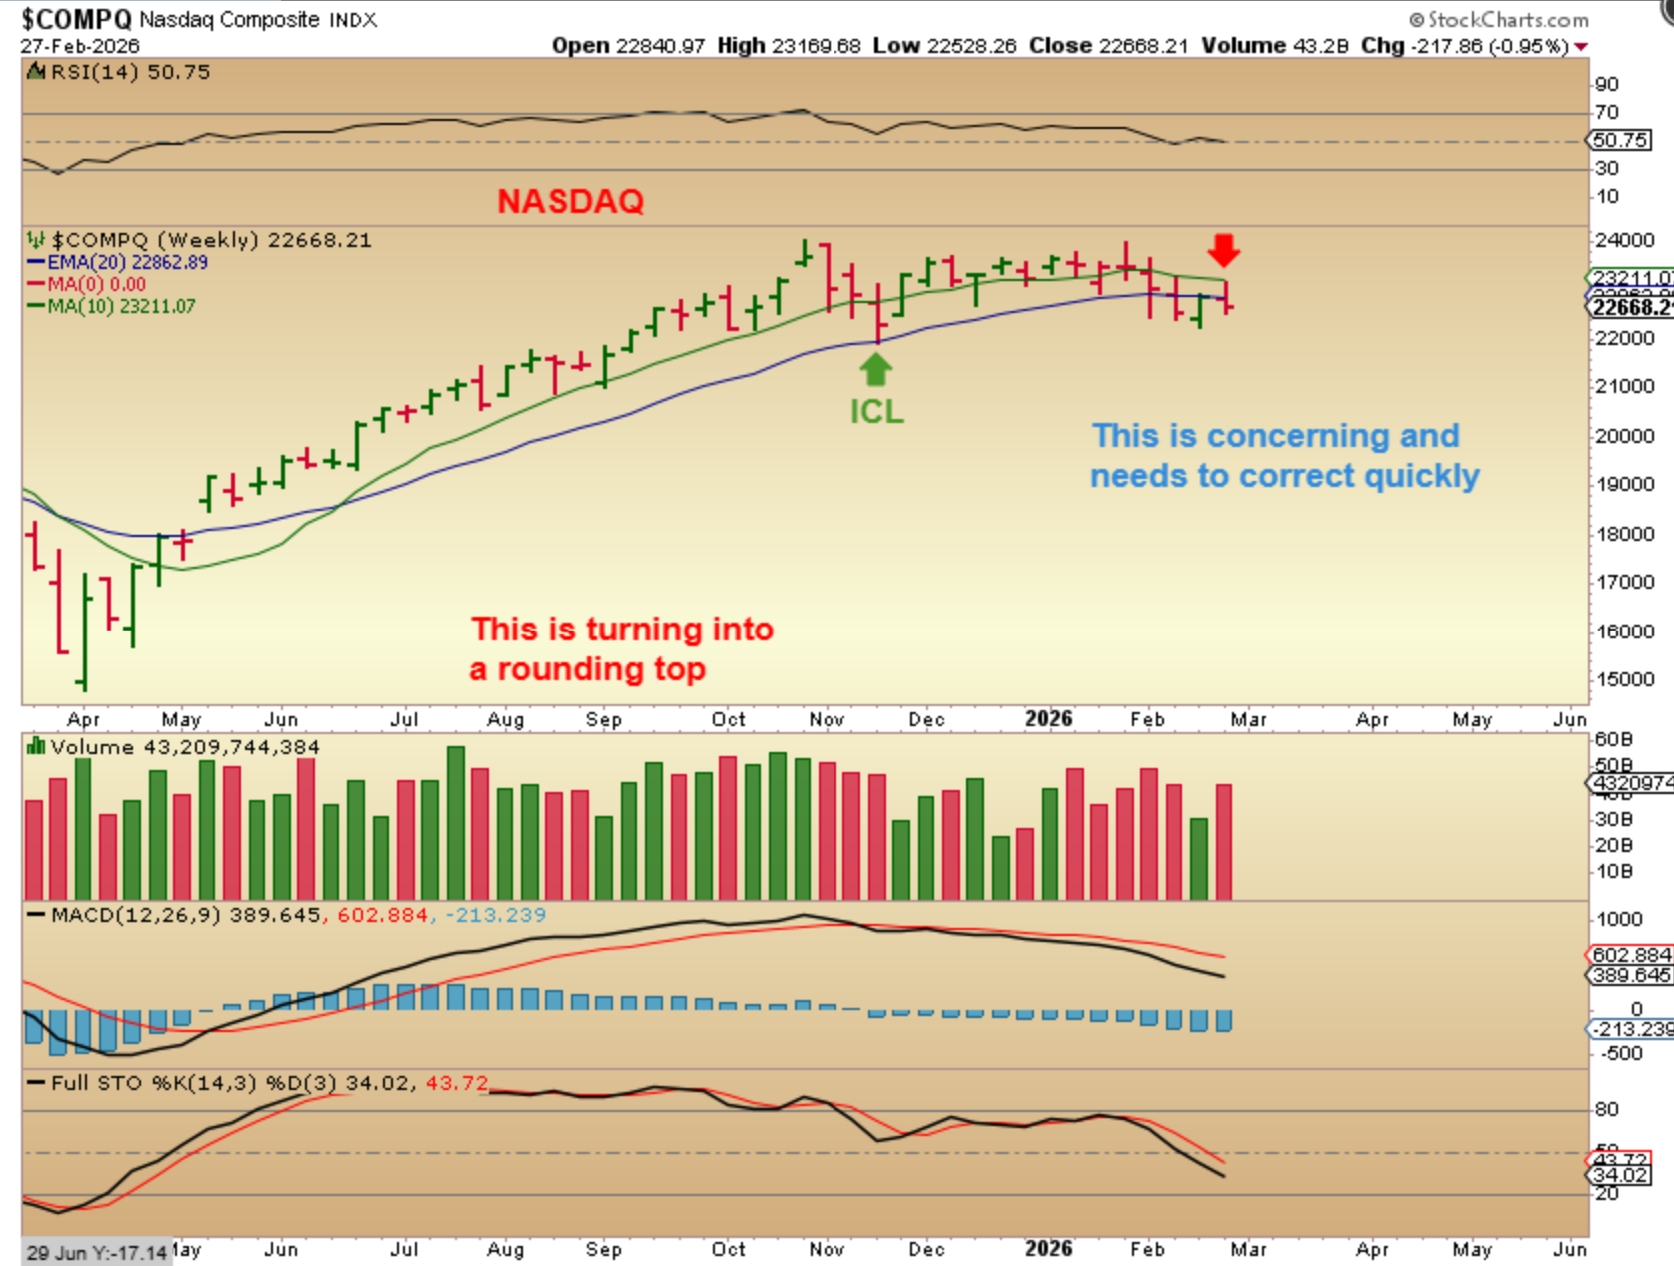
The WEEKLY NASDAQ is worse because
1. Price dropped down uncomfortably close to the ICL.
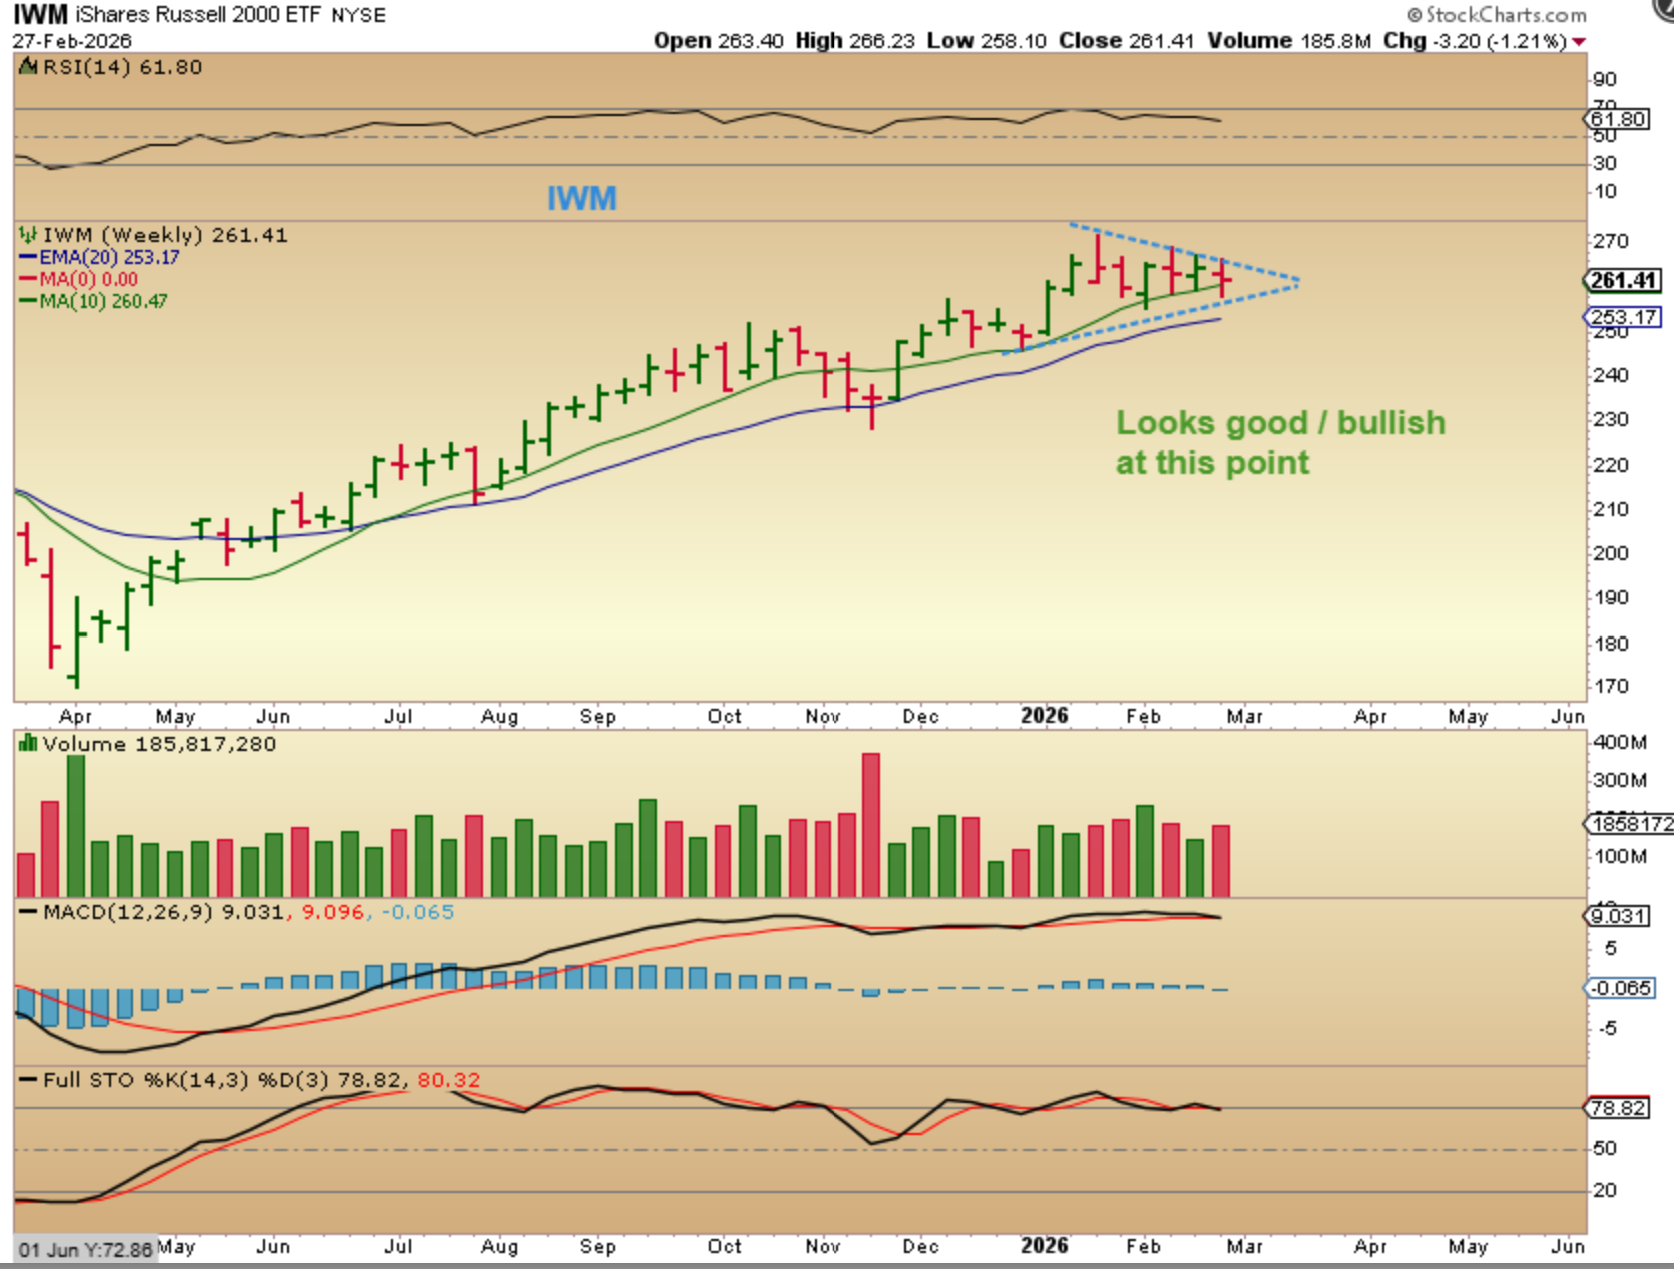
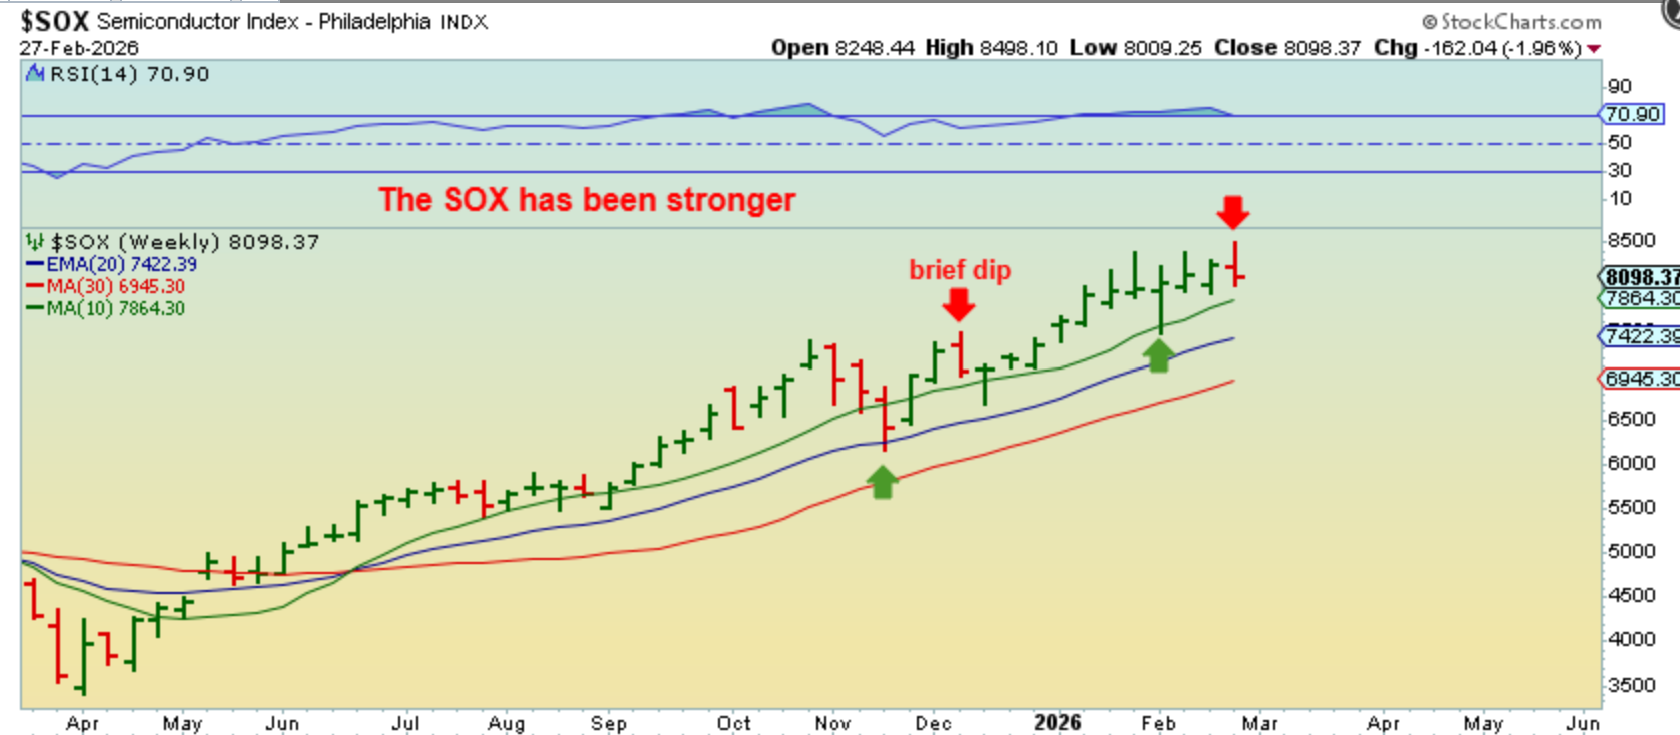
2. Then I see that the ICL sell off found support at the 20-week ema, and now price closed under that 20-week ema for 3 weeks. This too needs to break higher sooner than later to give us a strong 2nd daily cycle. The good news? IWM and SOX still look bullish.
.
IWM has formed a triangle and that can lead to a bull run higher in the 2nd daily cycle.
.
THE SOX has been strong, and it actually reached new all-time highs last week! So even though it does occasionally have a drop that lasts for a week or 2, and it dropped last week, it has recovered quickly in the past.
.
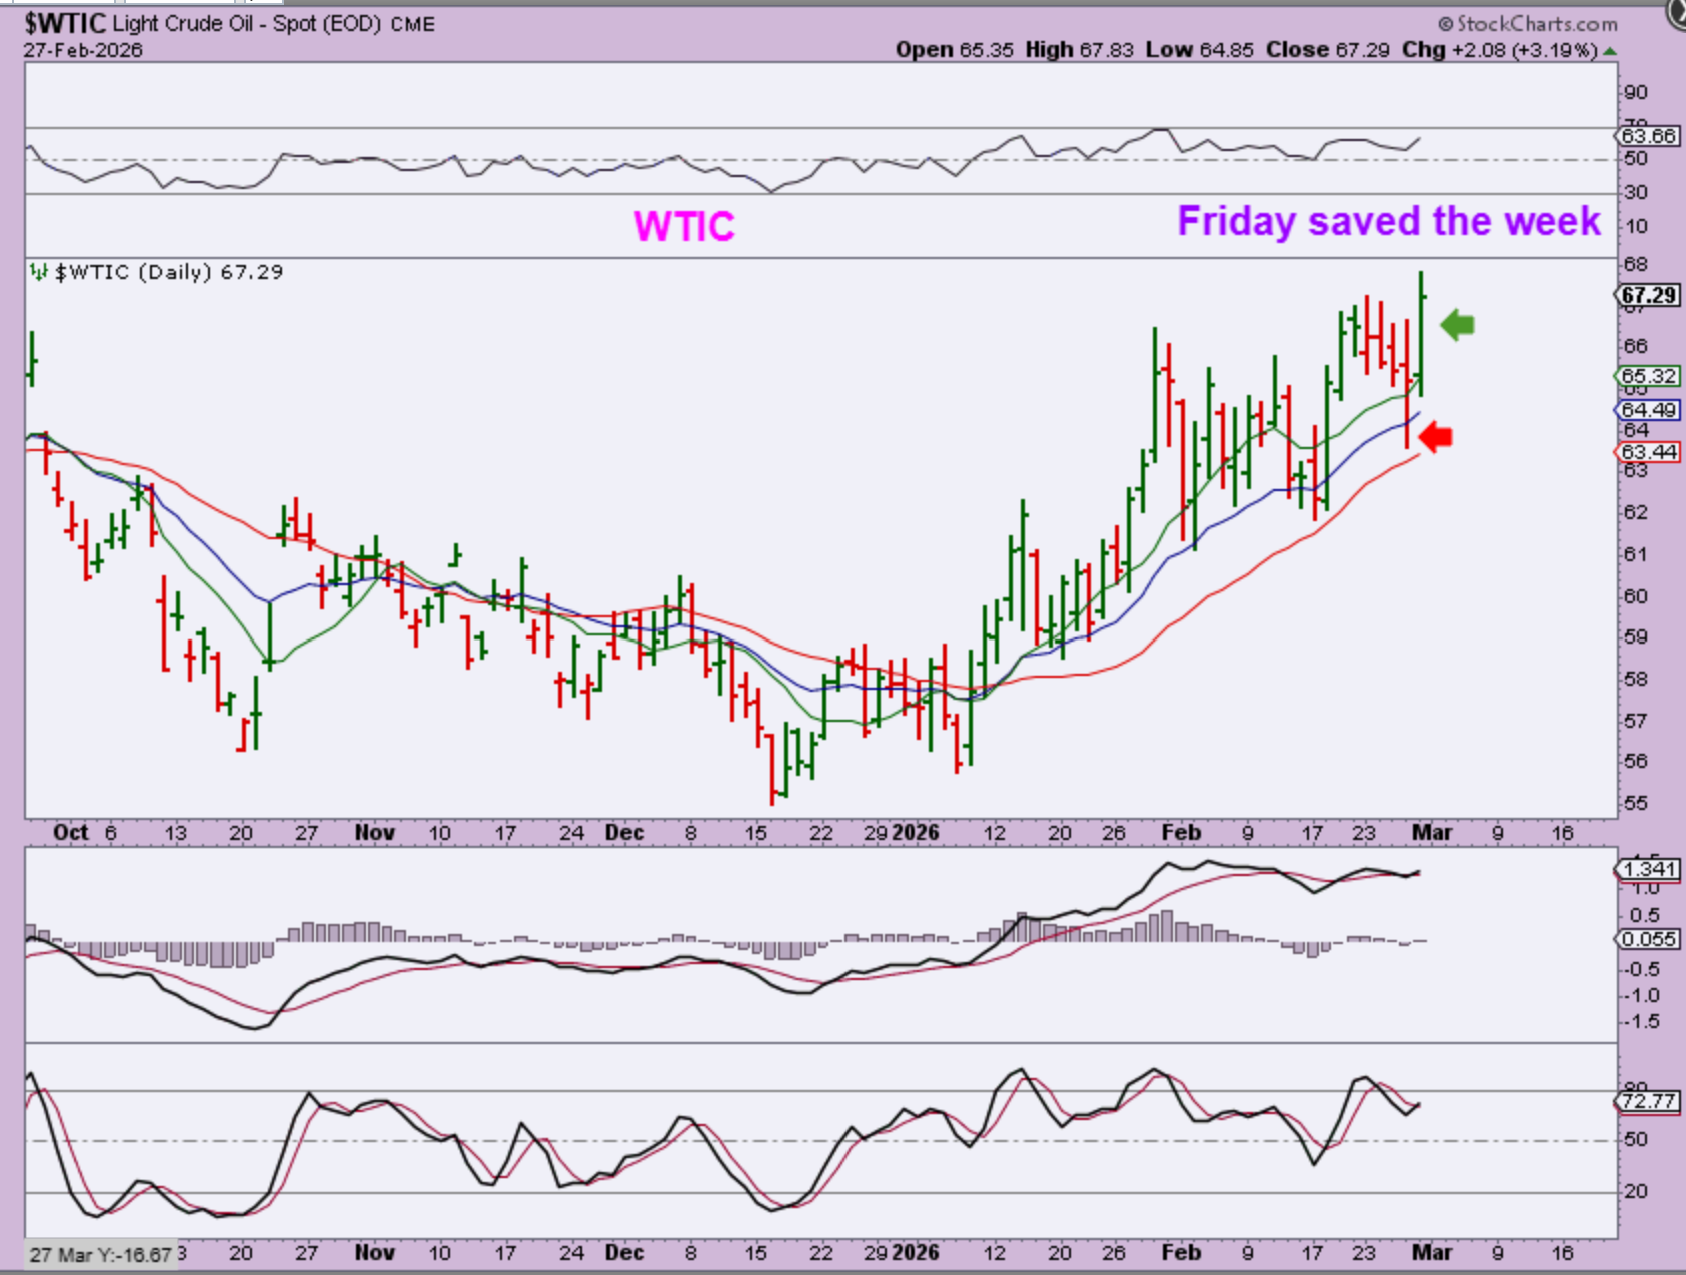
WTIC – Oil was chopping & dropping all week, right down to the red 30sma again. It reversed into a Doji Thursday and suddenly on Friday it surged 3%. This 3% pop on Friday…
.
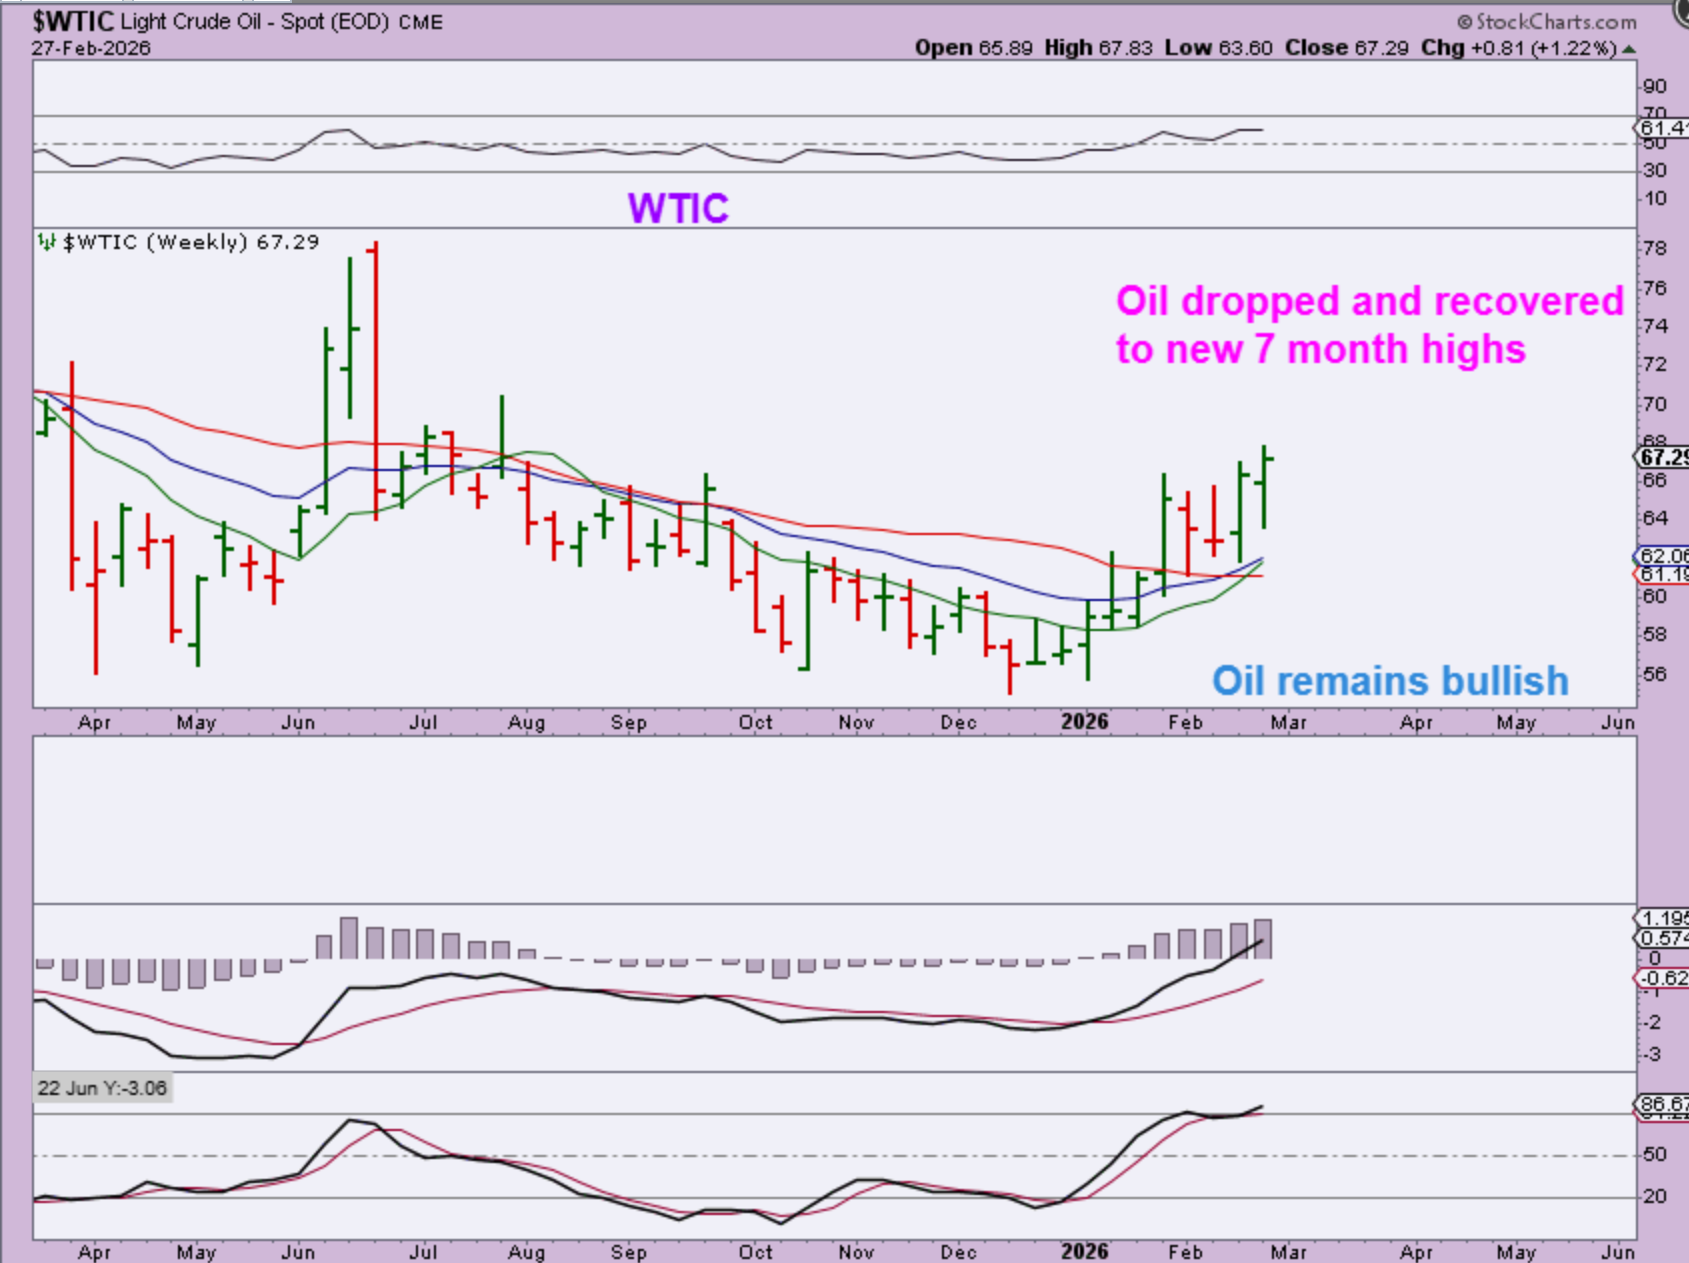
That 3% surge on Friday saved the day for THE WTIC WEEKLY CHART. This chart looks great at new 7 month highs and that is certainly Bullish.
.
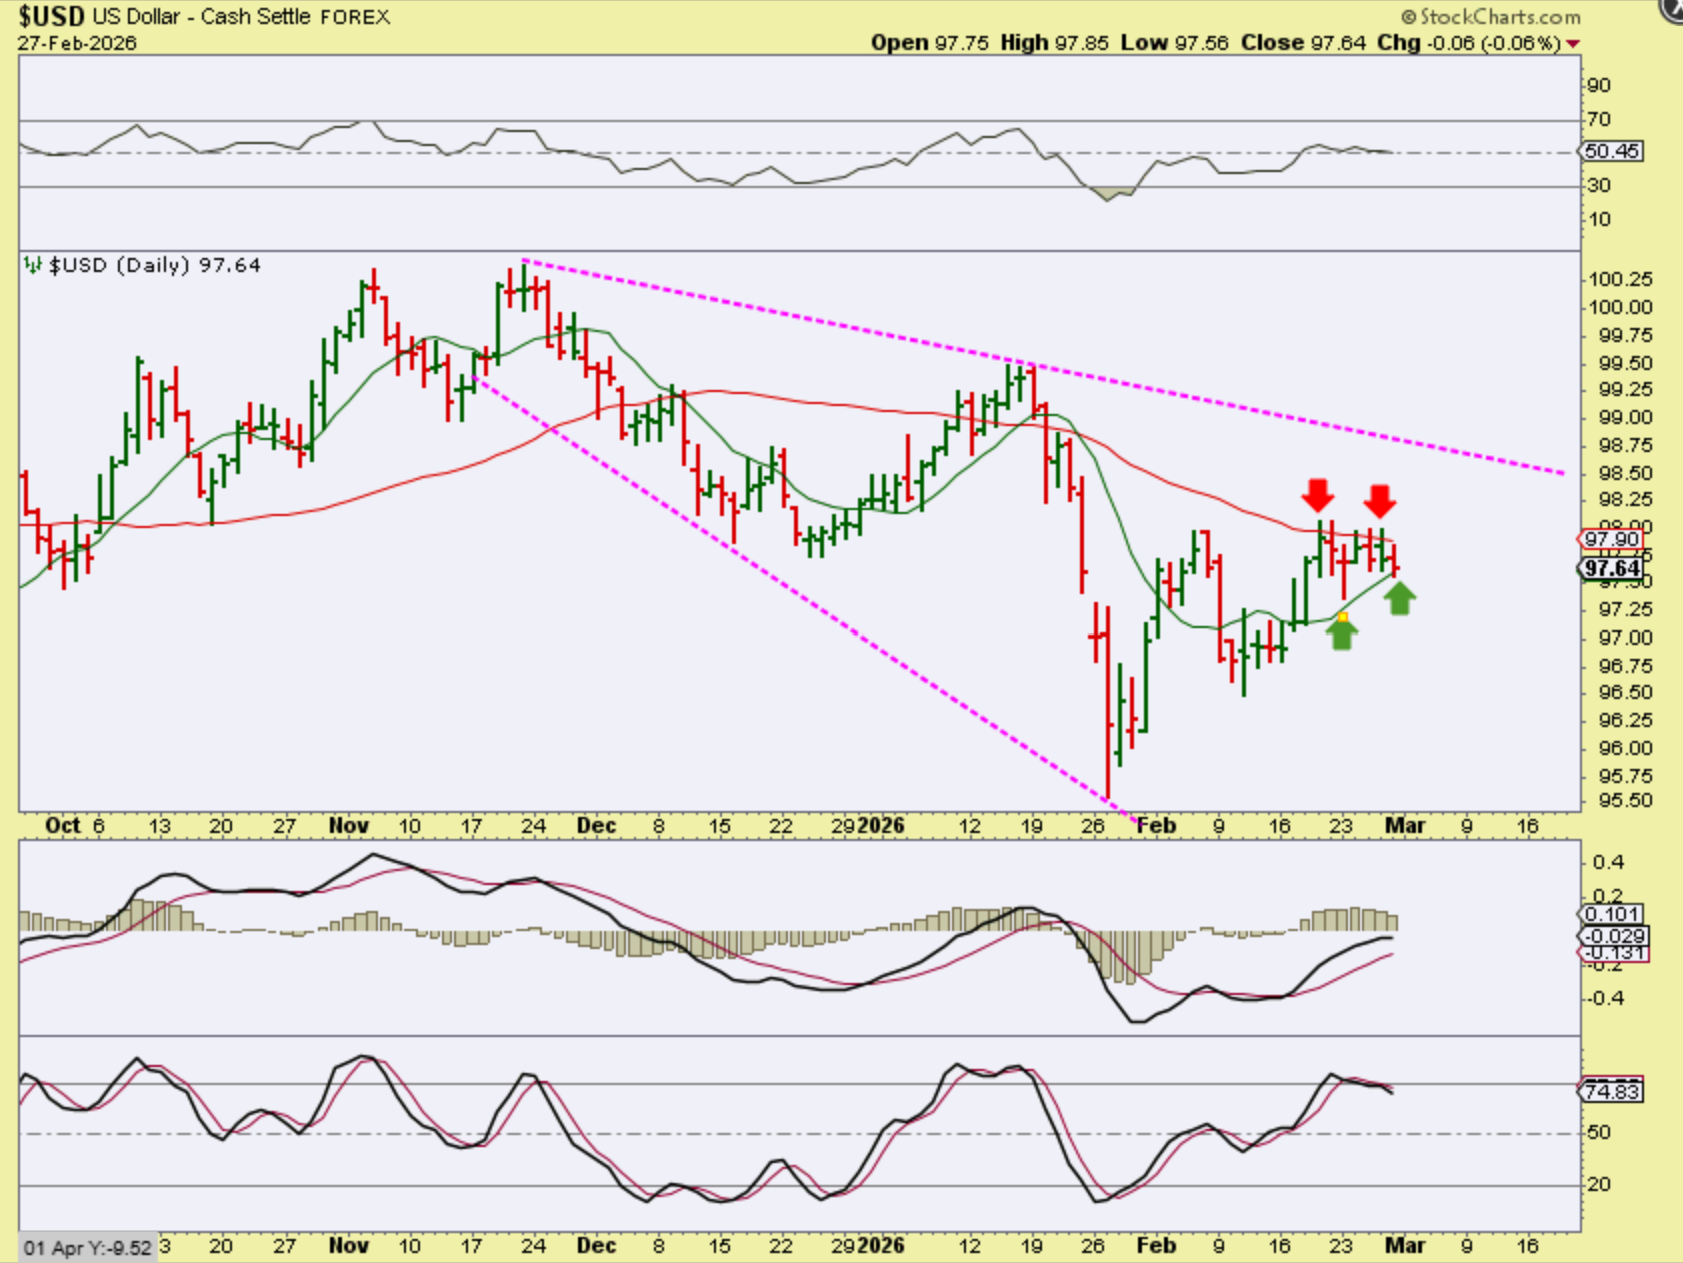
USD DAILY – Day 23. The USD is still trapped under the 50sma, but it may be building some energy to run up to the downtrend line and then dip into a dcl. I’ve been thinking that this is an ICL, A low that will last for months, but if it isn’t an IICL? Then it’s a failed daily cycle that will roll over.
.
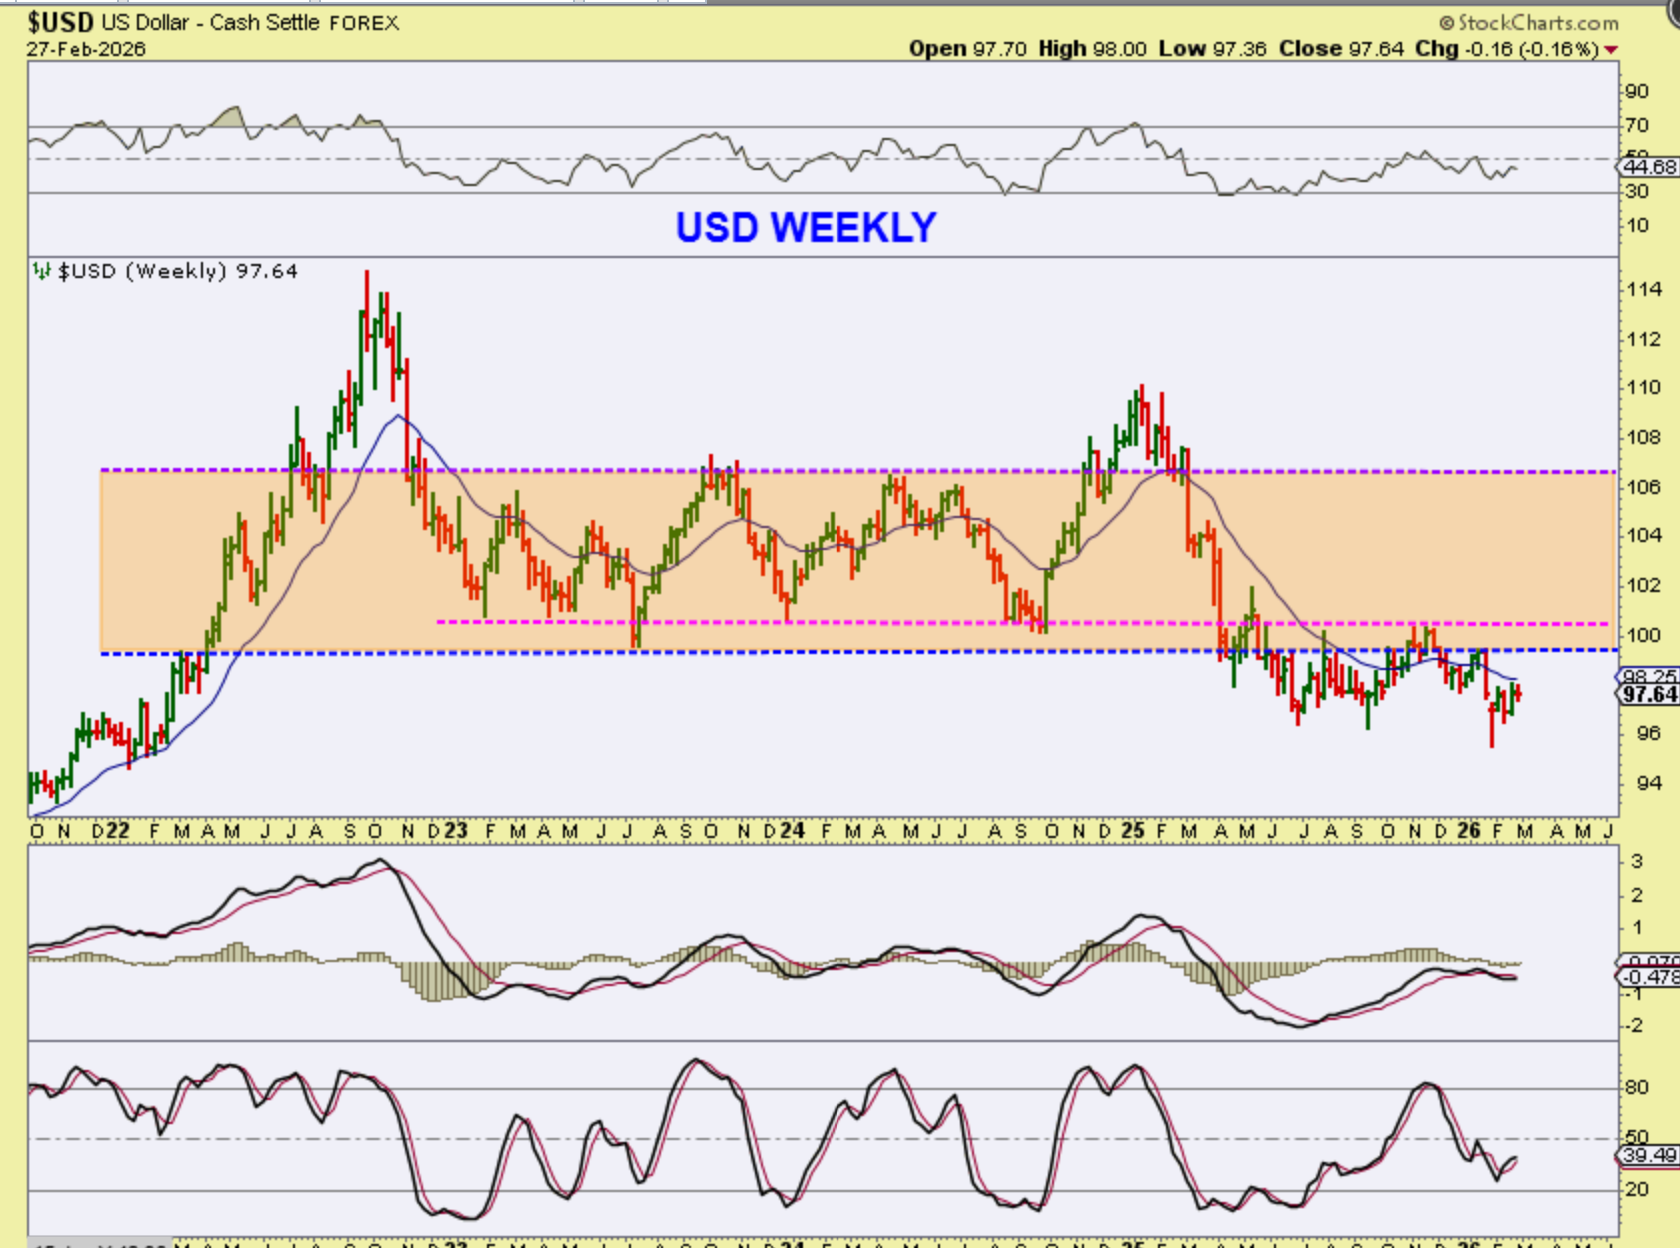
THE WEEKLY USD CHART still has resistance here and stronger resistance overhead with the purple and magenta lines. Again, if this is an ICL, the USD should get to resistance of the Purple / Magenta line. If it isn’t an ICL, it could roll over soon.
.
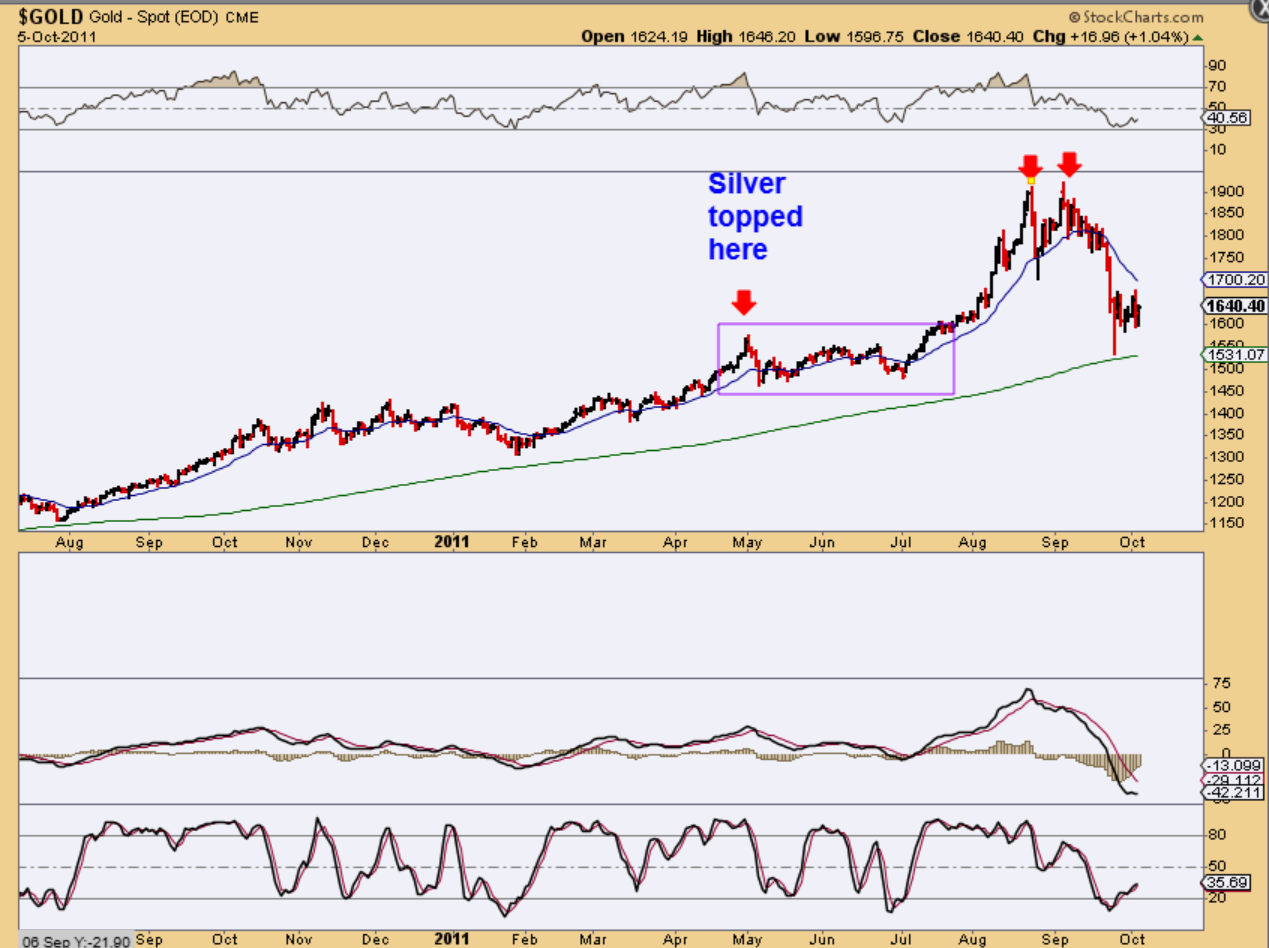
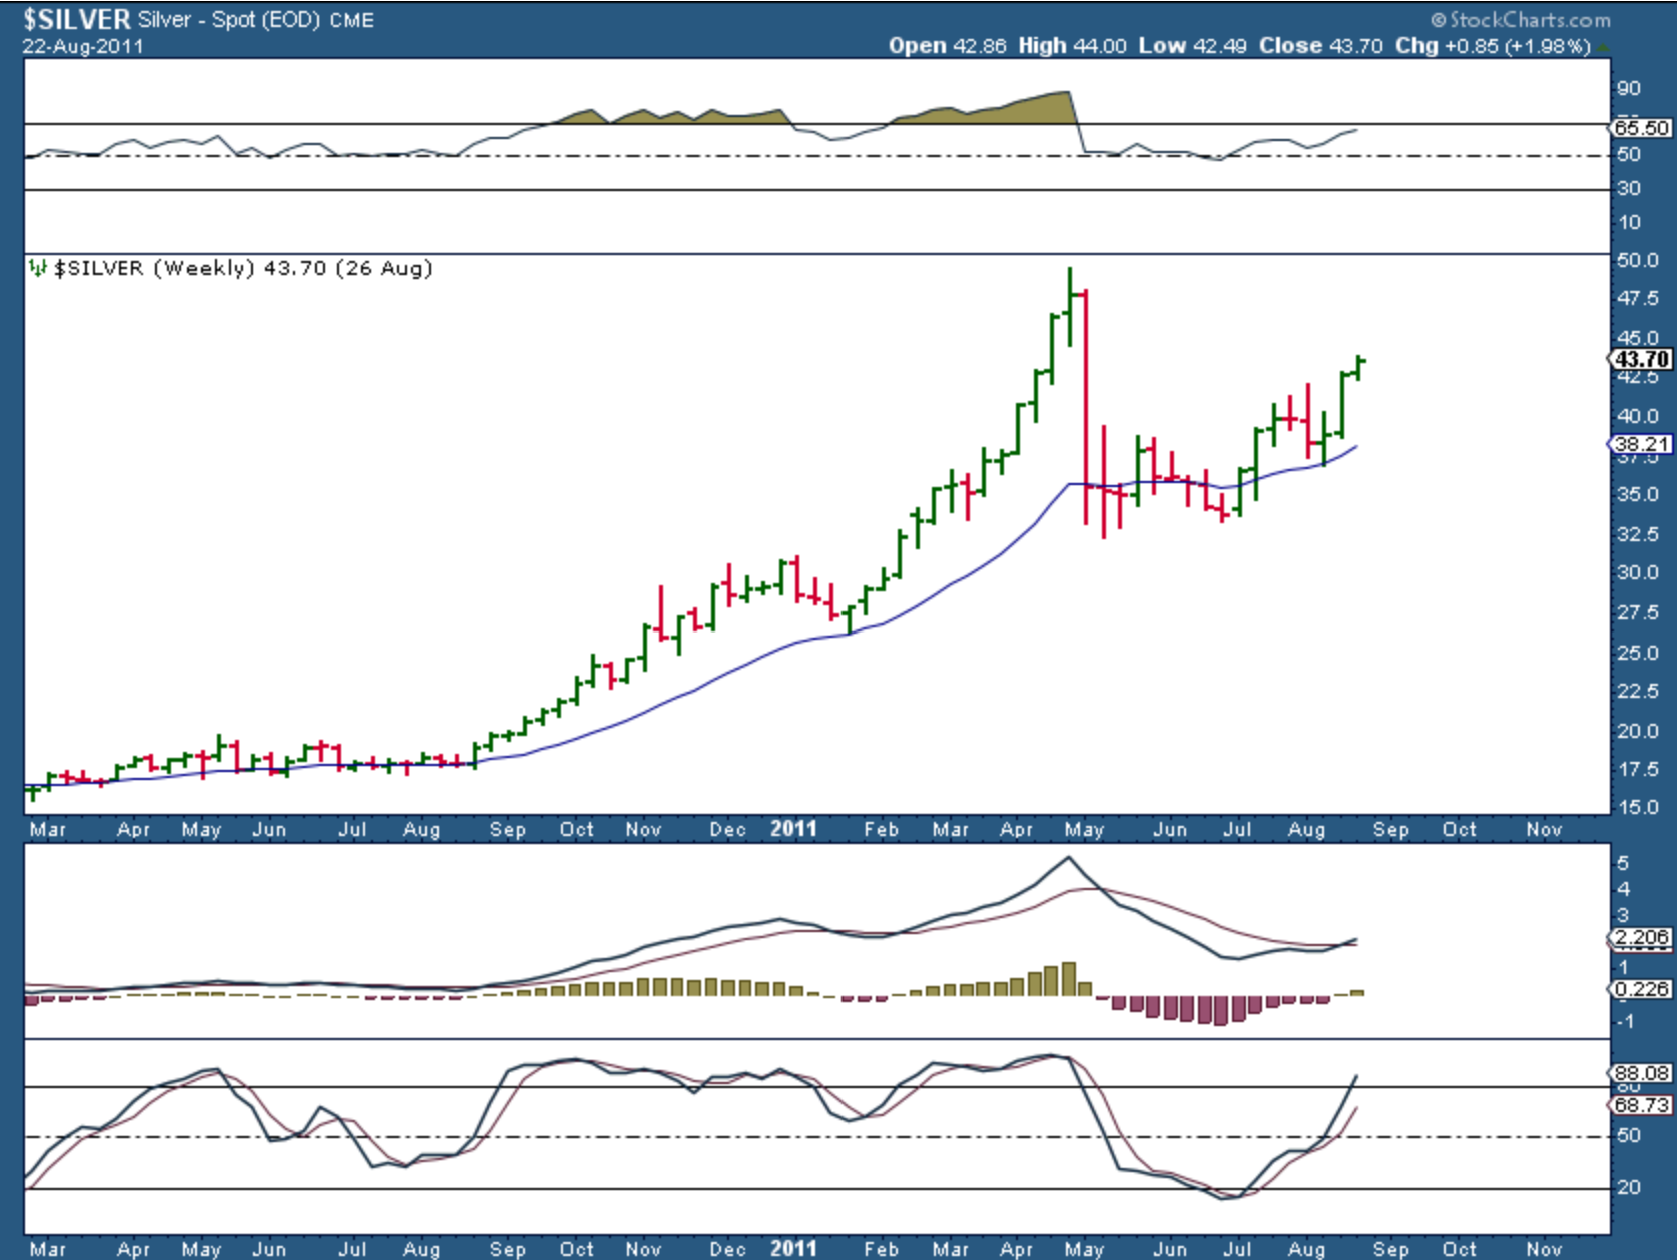
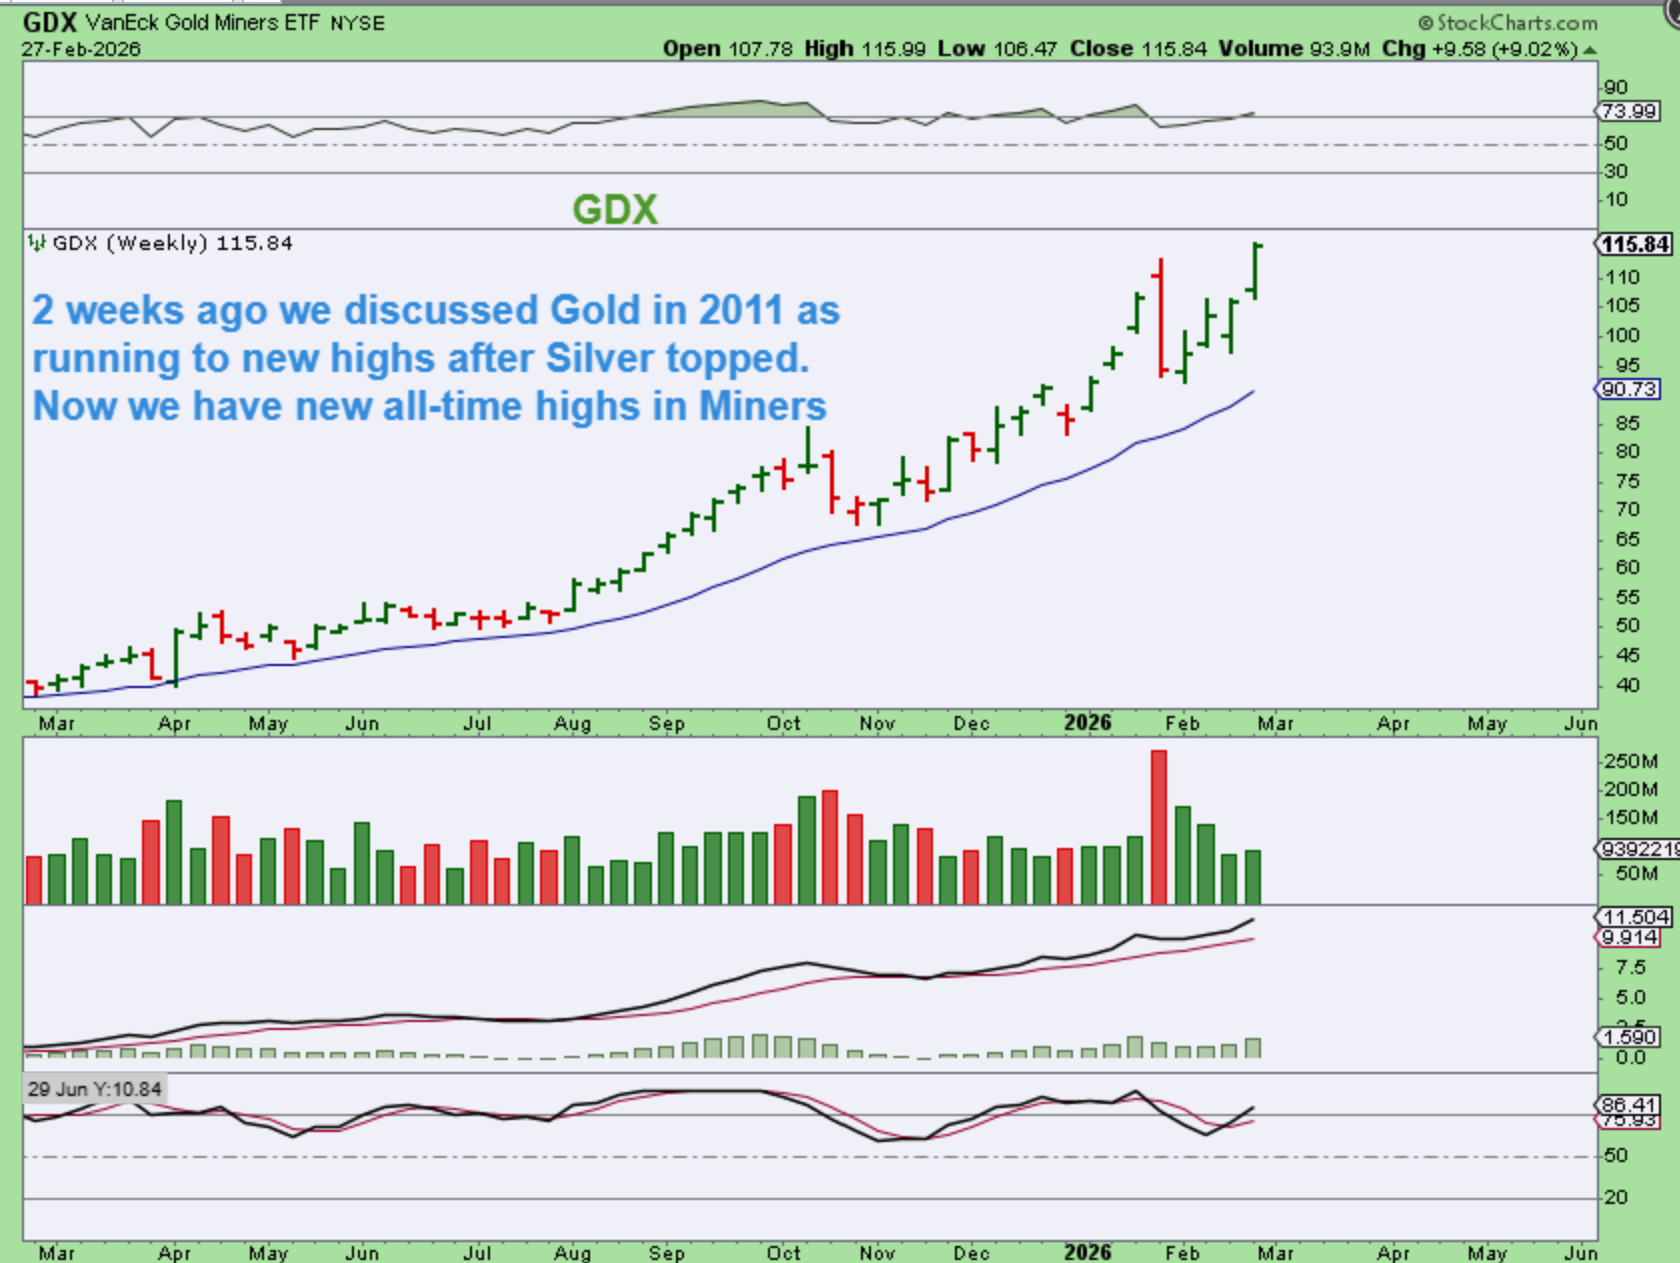
Reminder: Weeks ago I discussed how in 2011 Silver peaked in May, but Gold ‘peaked’ 4 months later. So with that, Gold could make another run to new highs over time.
.
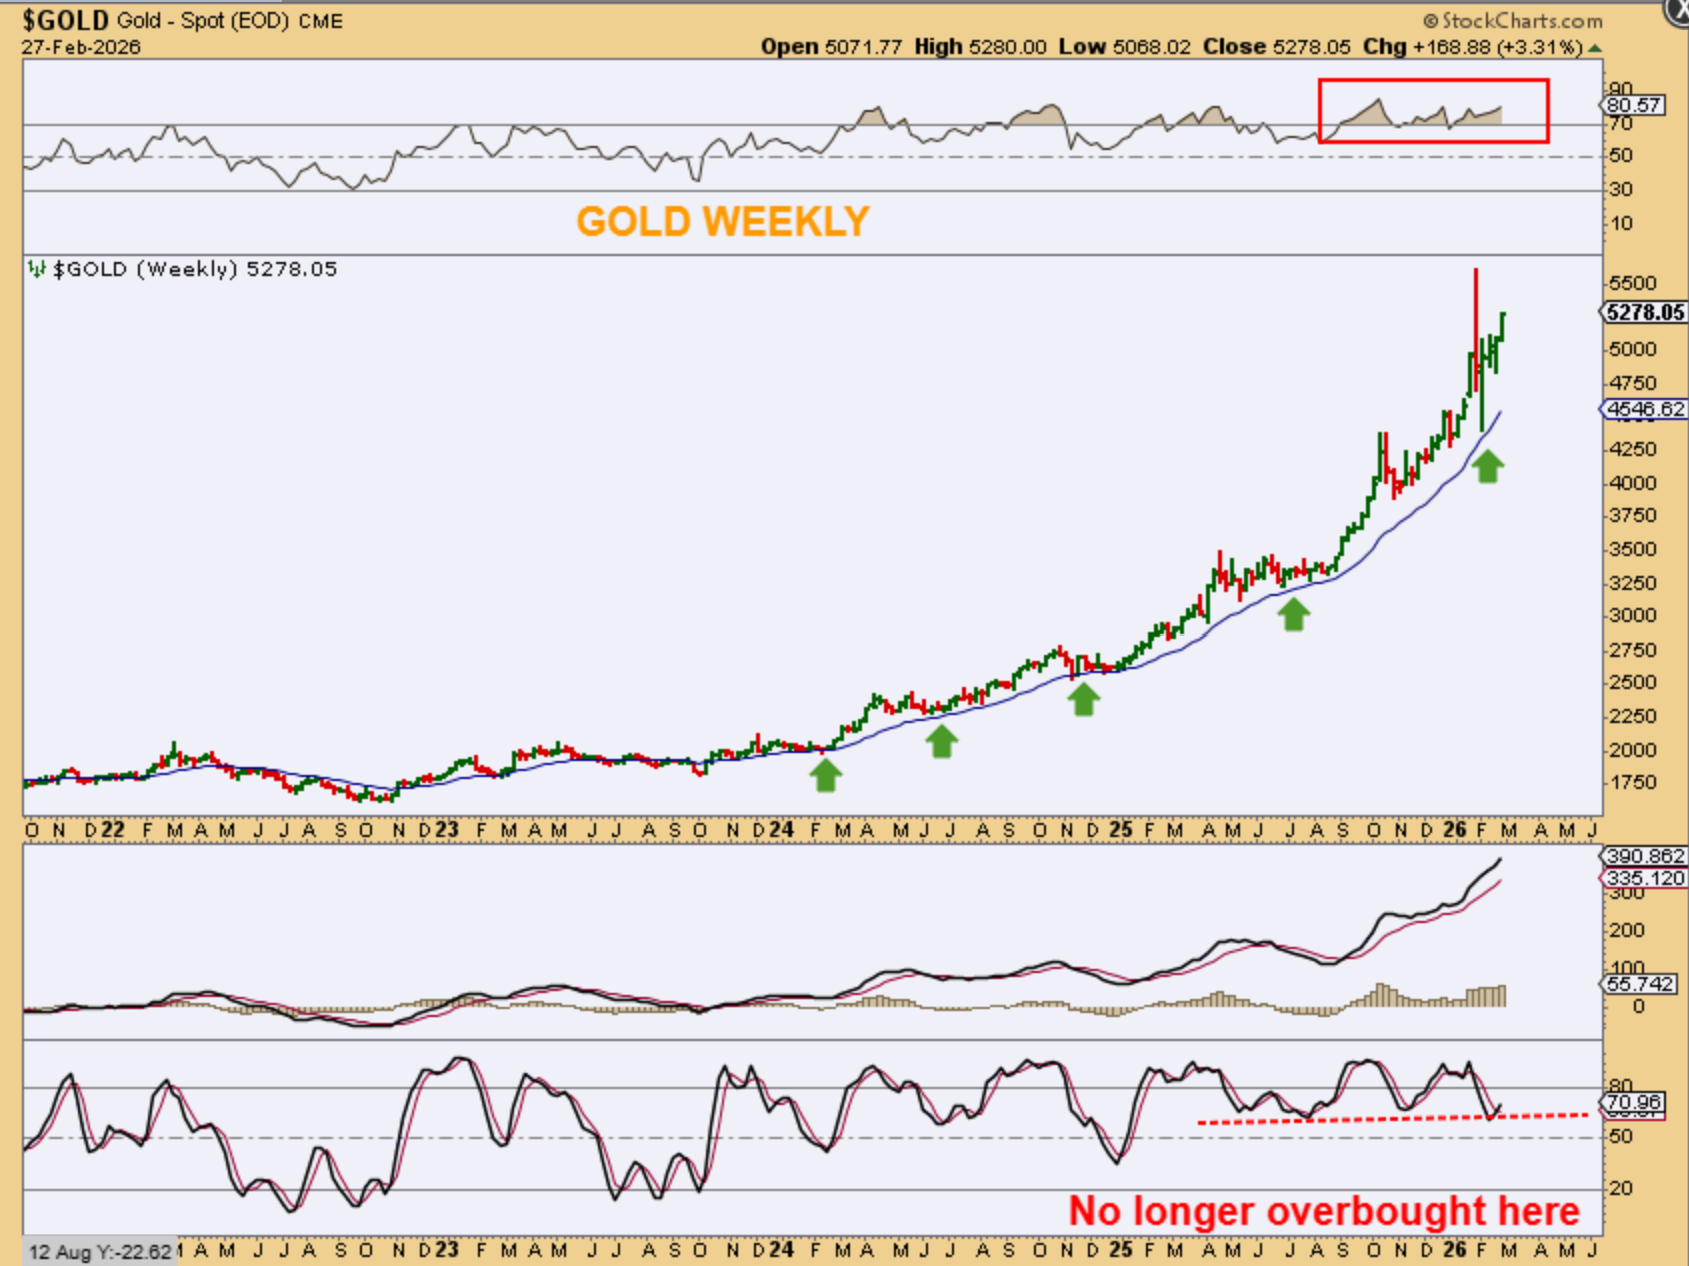
GOLD WEEKLY – We now have 4 candles higher out of that slam down low. I did expect a bit more consolidation or chop before reaching the all-time highs, and we do see it on daily charts, but the weekly chart does not show that. Now take a look at the stochastics.
.
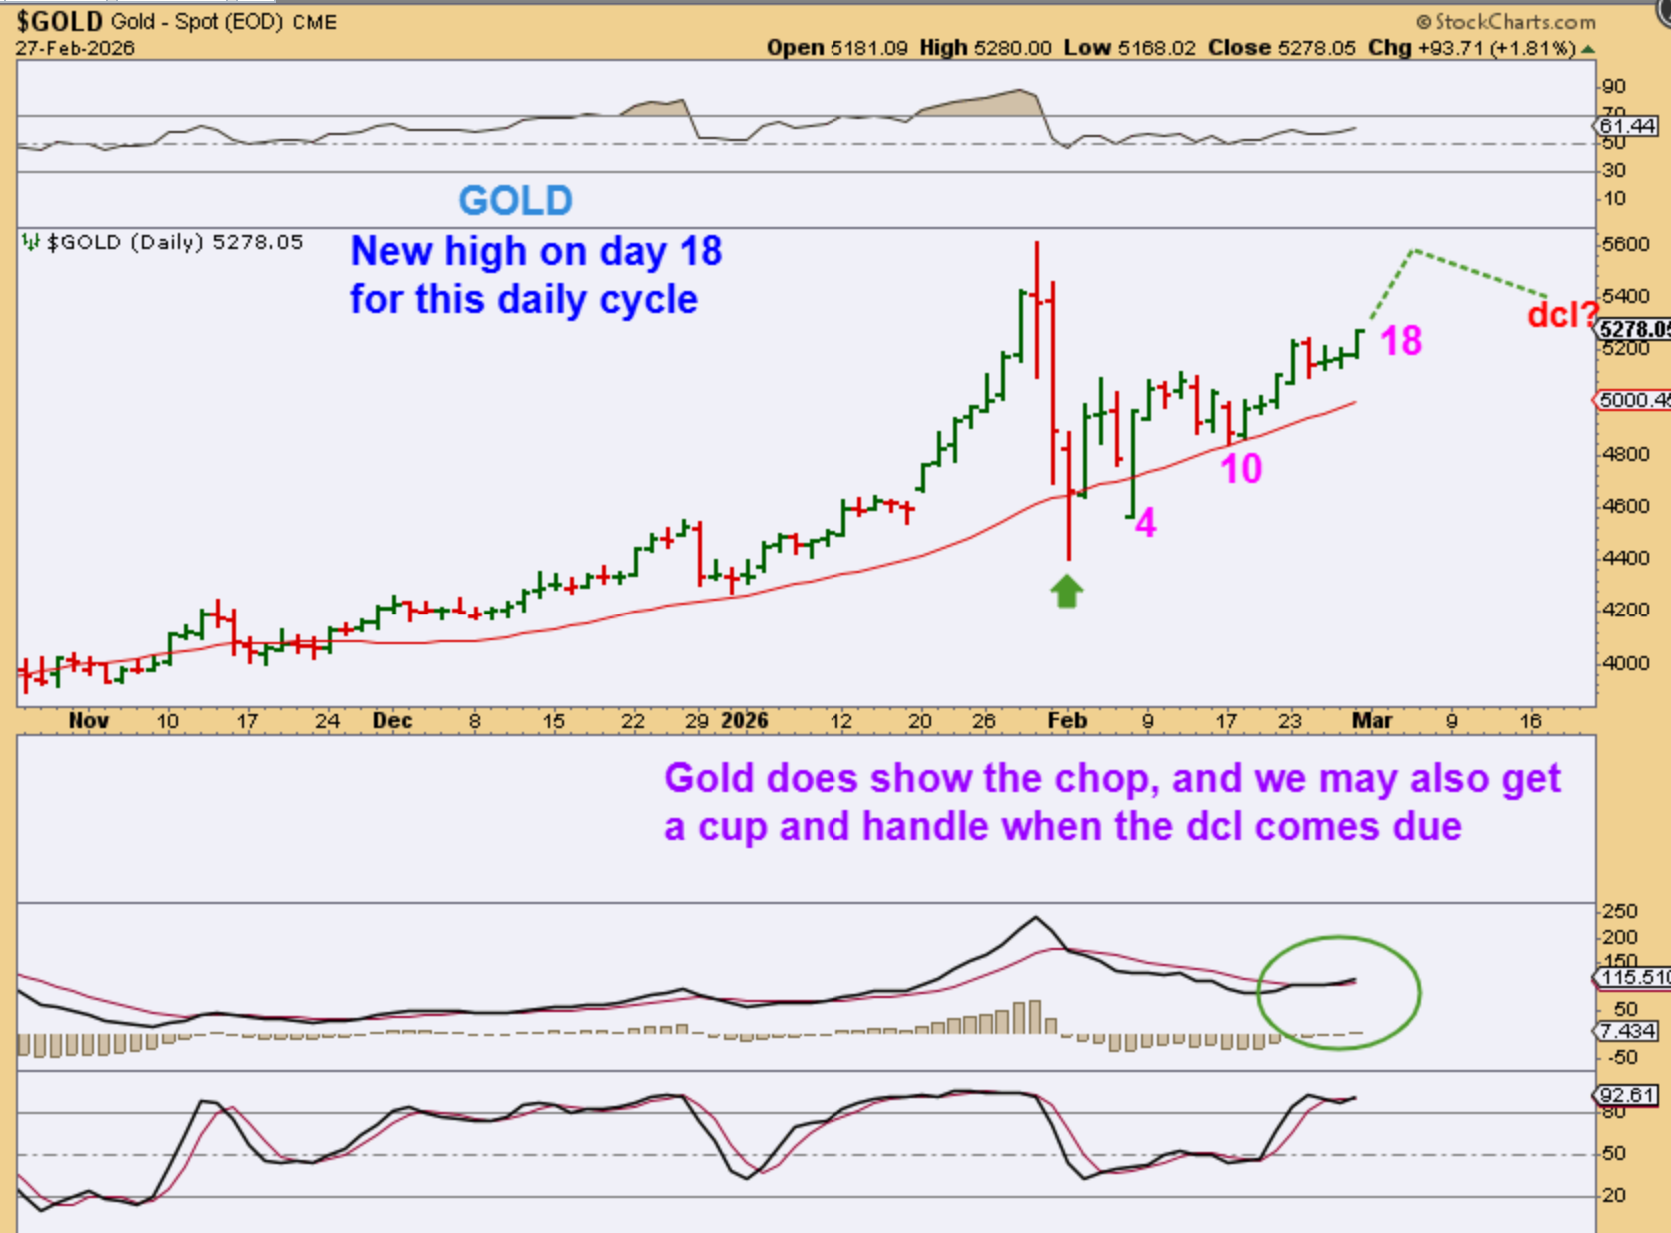
GOLD DAILY– If Gold doesn’t start getting choppy Monday or Tuesday, then I would imagine that we could see a run to the highs into day 20 and then a dip down into a dcl, based on the current cycle count. This will be R.T. too.
.
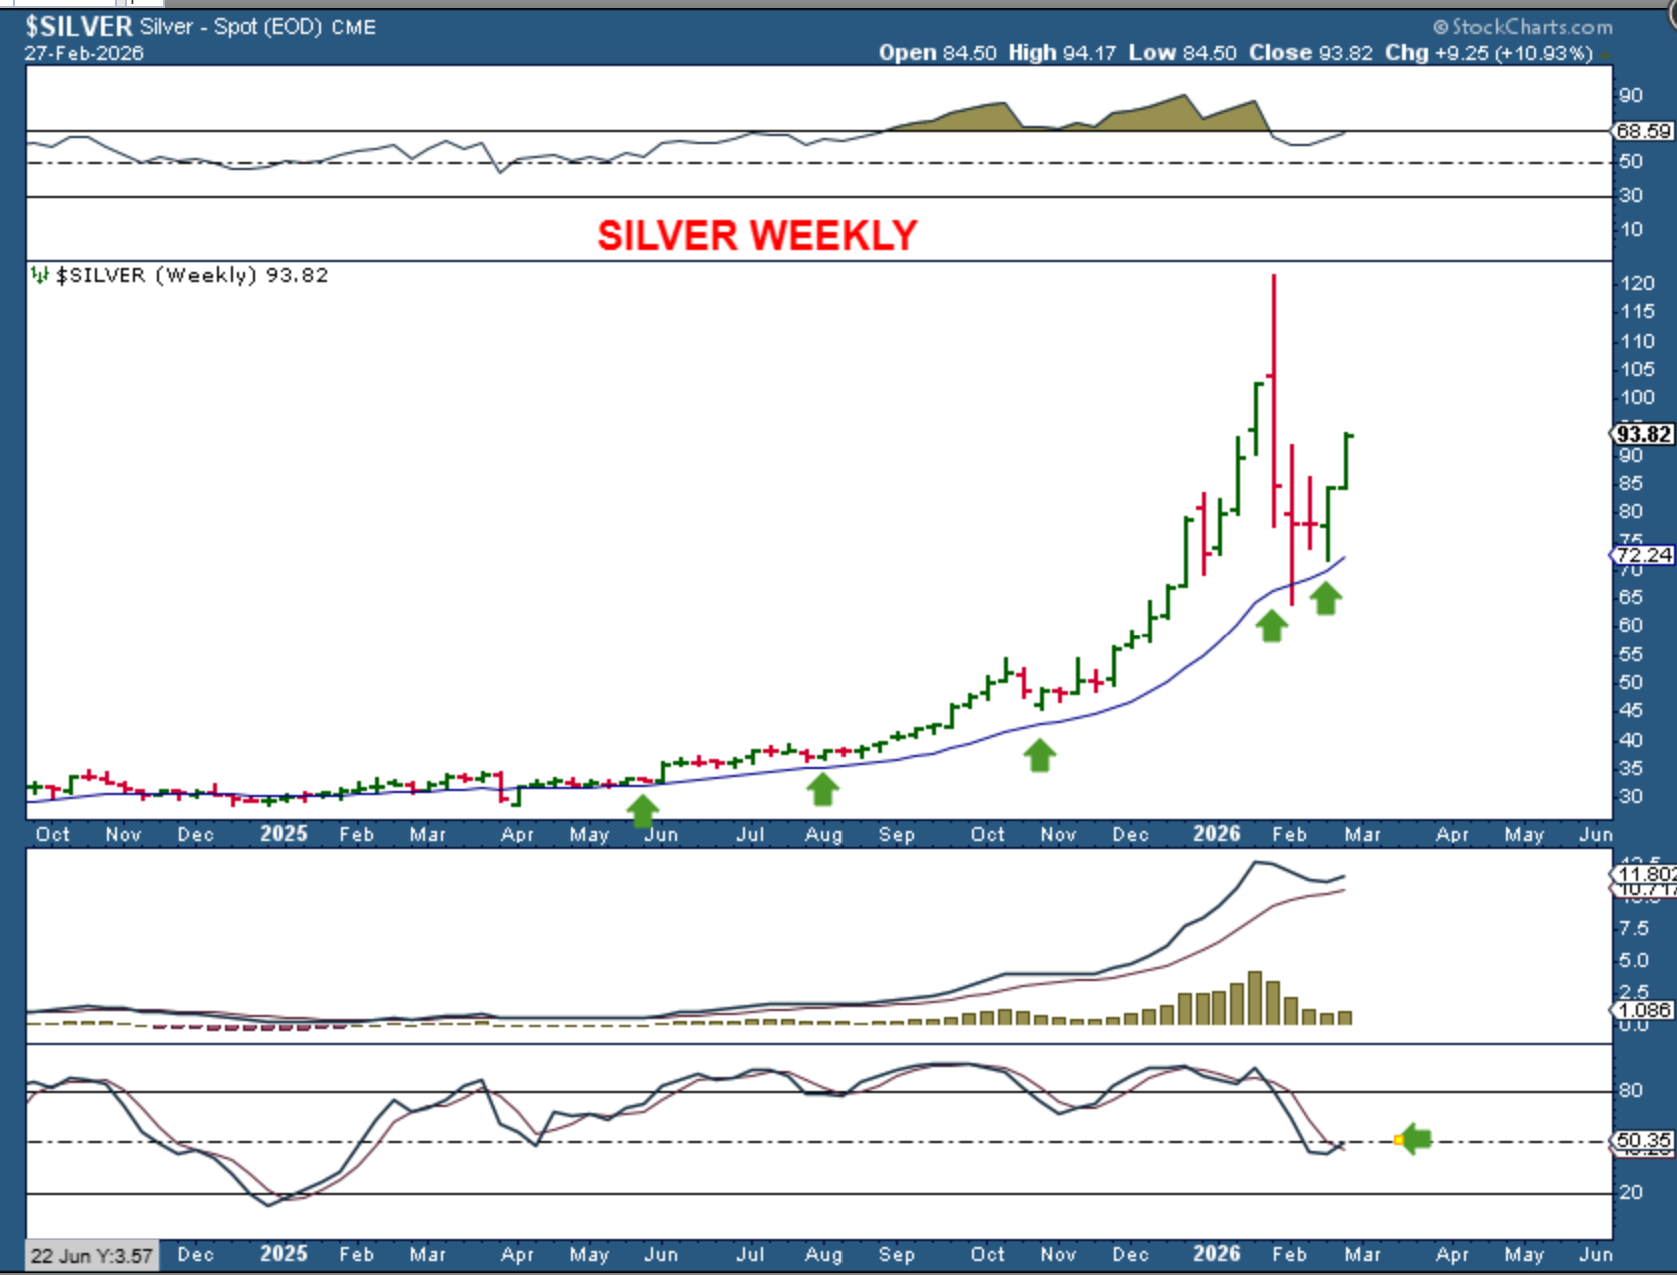
SILVER started to move recently too, putting in 2 strong 10% weeks. It fell from $120 to $60 and is now around $94. It bottomed After Gold, so it can run further too. We do have ‘time’ after an ICL to allow price to move…
.
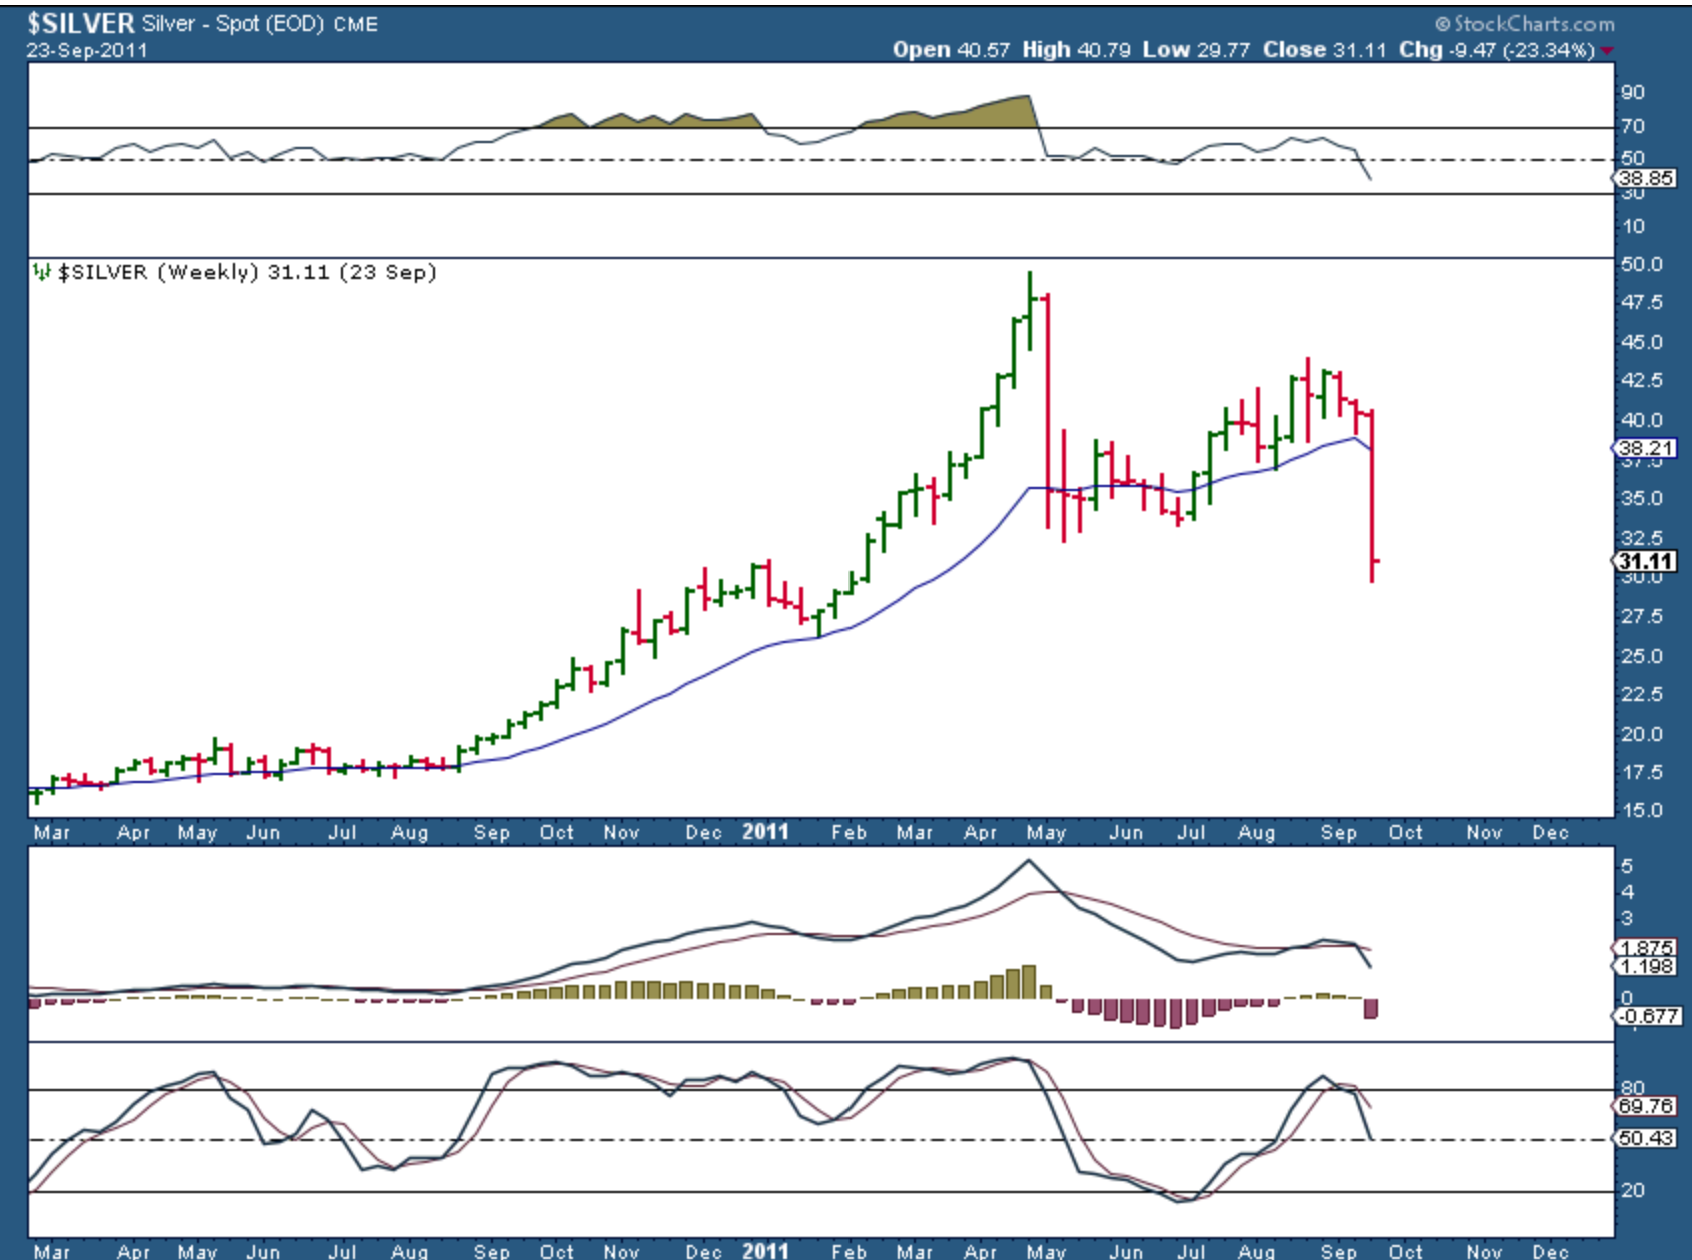
SILVER 2011 – This is the weekly chart for Silver 2011. You can see that after the crash, it did have strong weeks, but it got choppy and went sideways for weeks too. Silver looked ready to make it back to new highs, and this was a very convincing bounce, right?…
.
SILVER 2011– It helps to see how convincing that bounce was, because it ended like this. After the low was in place, it took months (2.5 daily cycles) before it crashed again, so we should have ‘time’ in both Gold and Silver.
.
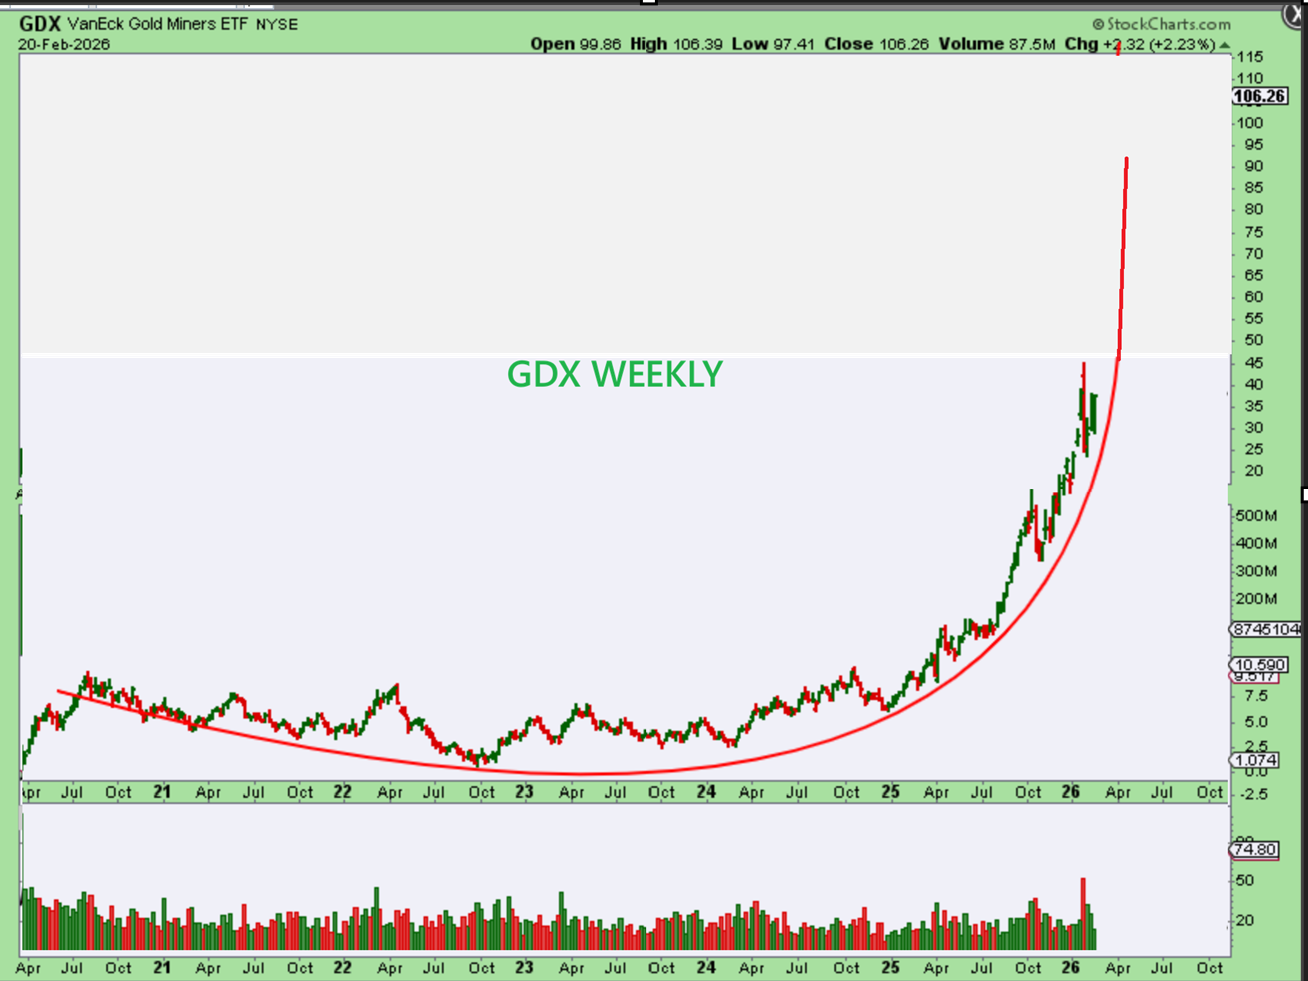
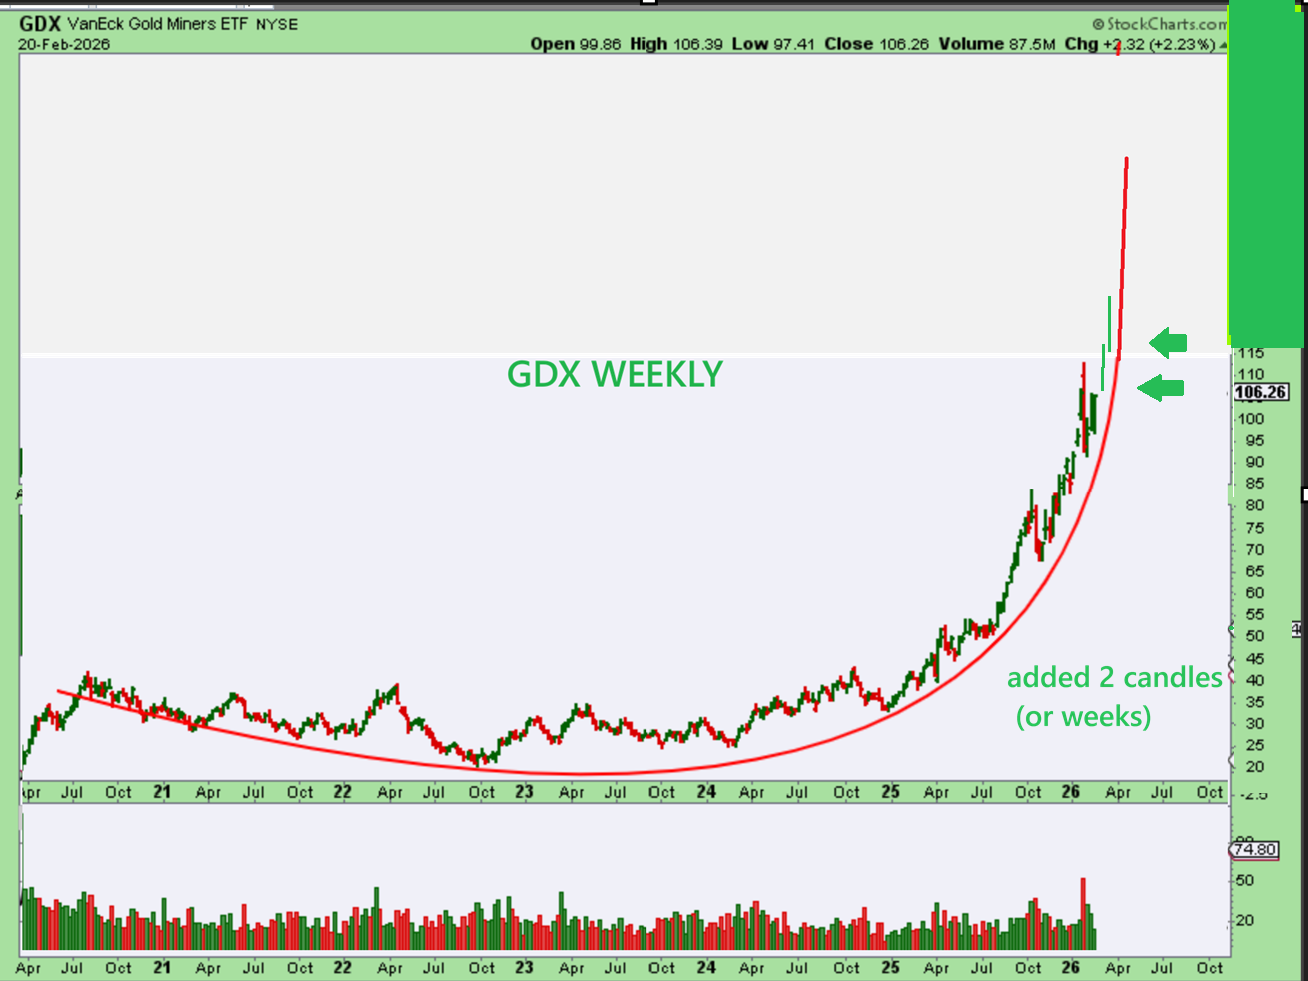
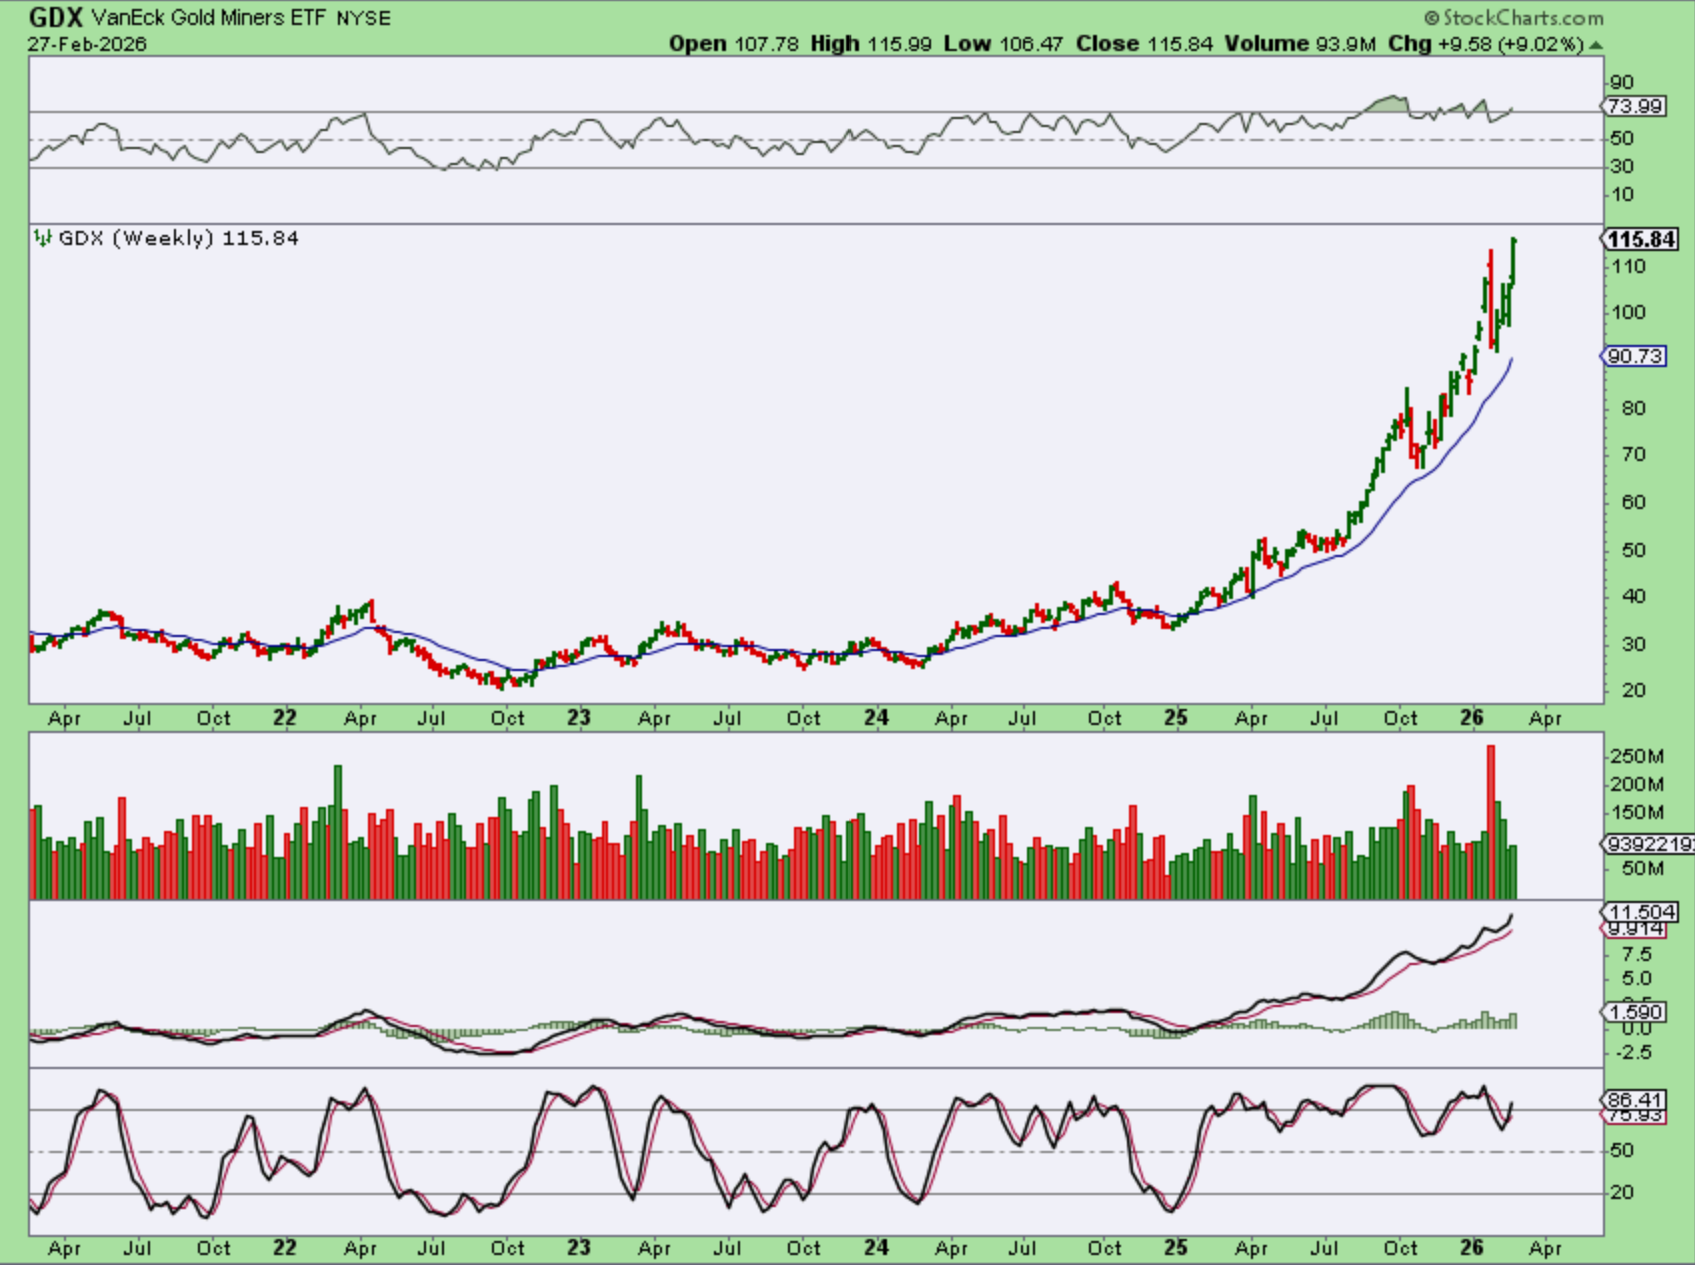
GDX – Last week I took this chart of GDX and said that it could continue higher. You may recall that I then drew in 2 weeks worth of candles…
.
GDX -You may recall that I then drew in 2 weeks’ worth of candles, and said that in a parabolic move, it can even continue higher.
.
GDX gave us that first candle and it is a 9% gain for the week.
.
GDX WEEKLY : 1 crash week down and 4 weeks recovery.
.
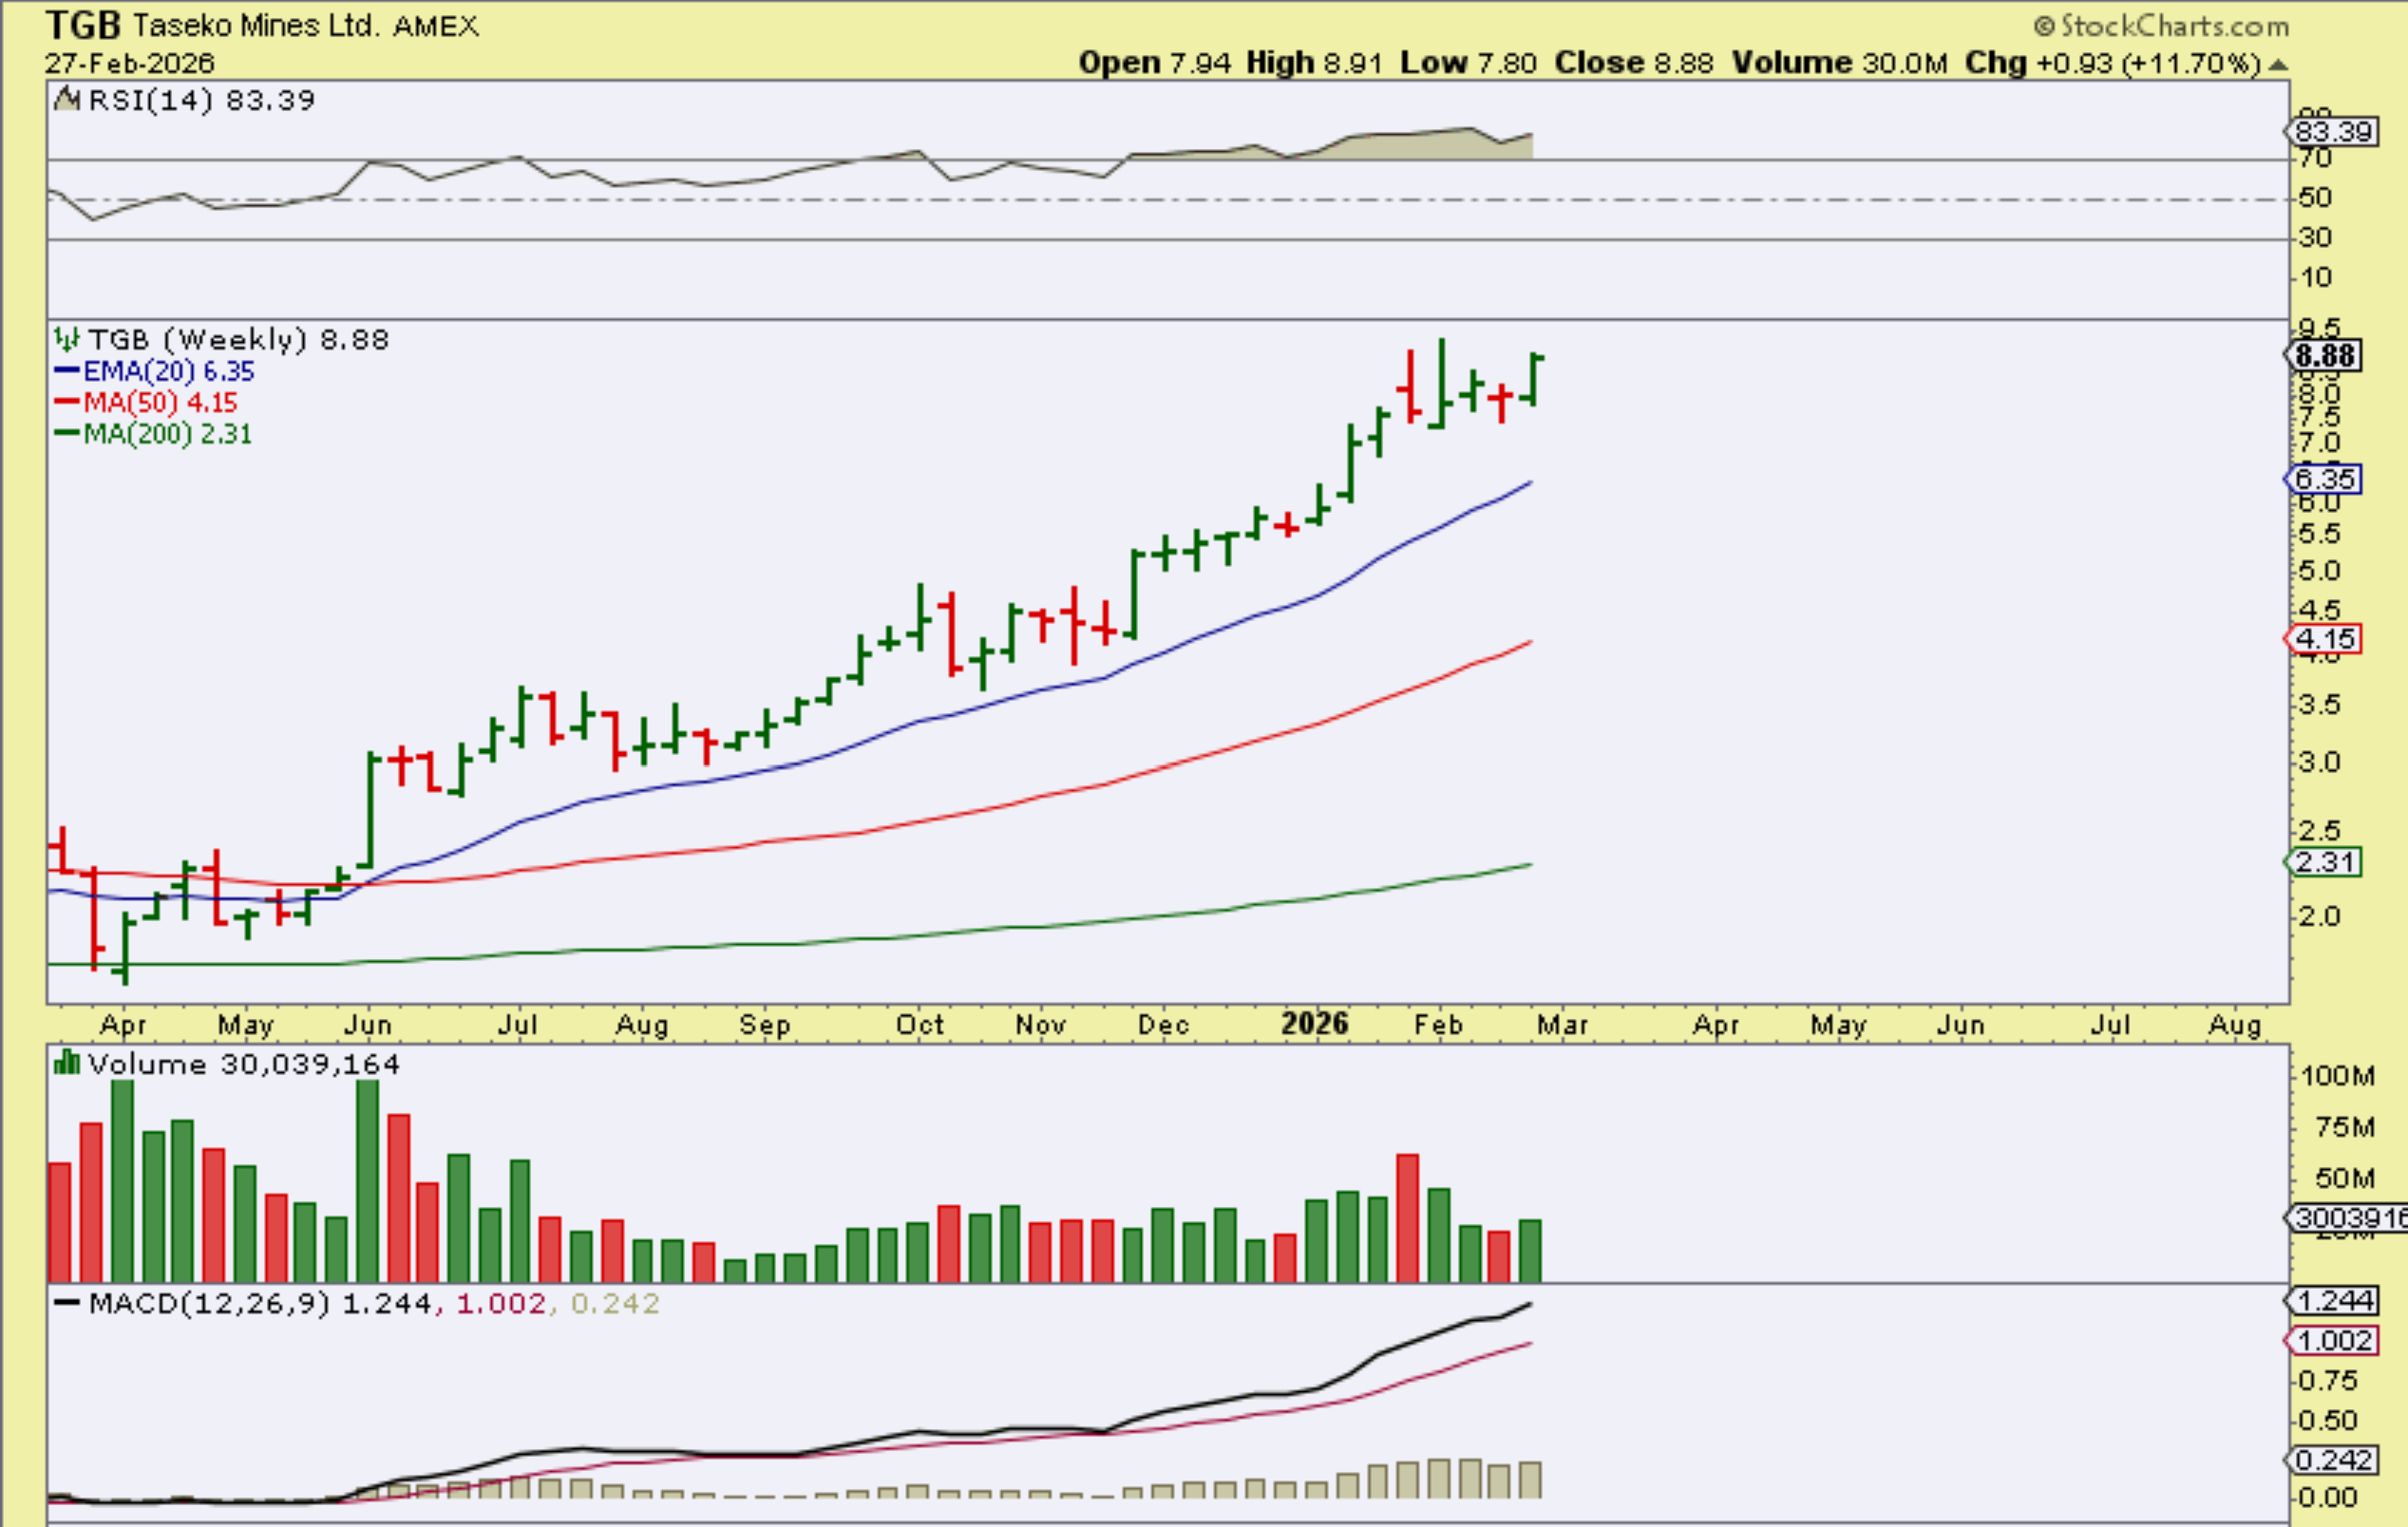
The precious metals Miners did well, and I also pointed out some Copper stocks. They also had a good week, with TGB up almost 12% for example. TGB has moved up over 500% from the April lows.
.
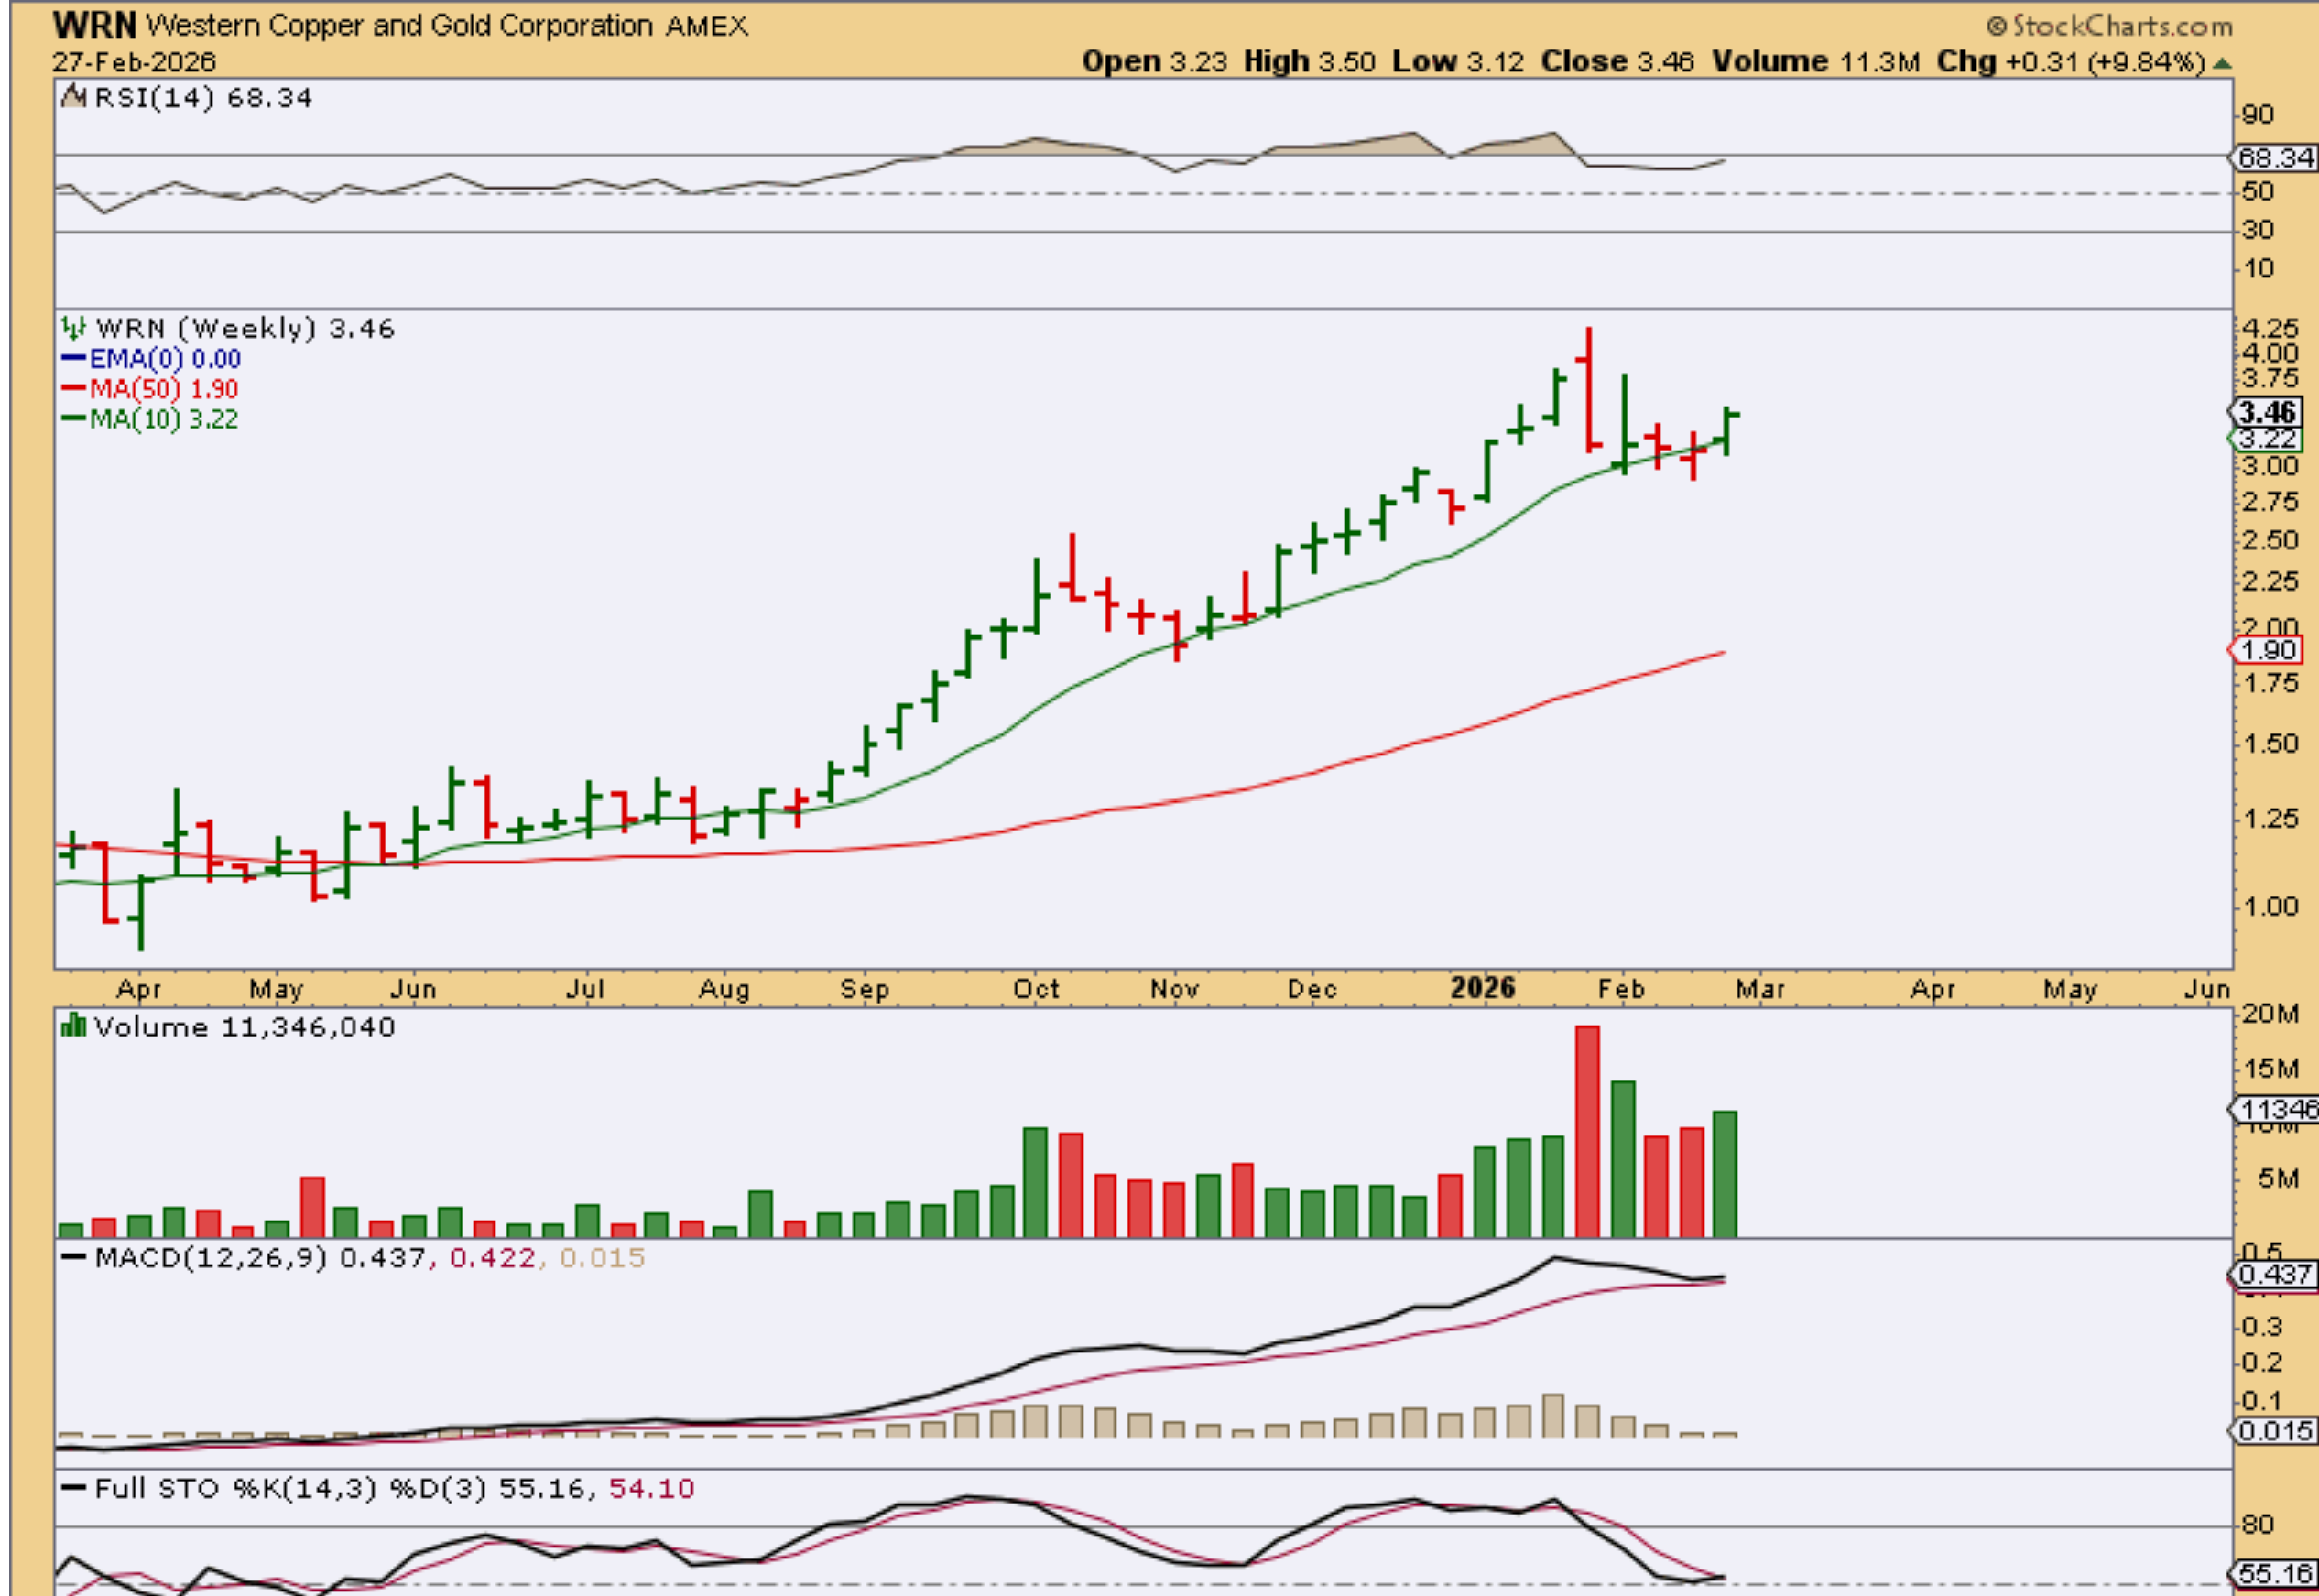
WRN was also up about 10% for the week, so the ‘Metals’ are also bullishly lined up and have been called buy and hold here. WRN quadrupled since April 2025.
.
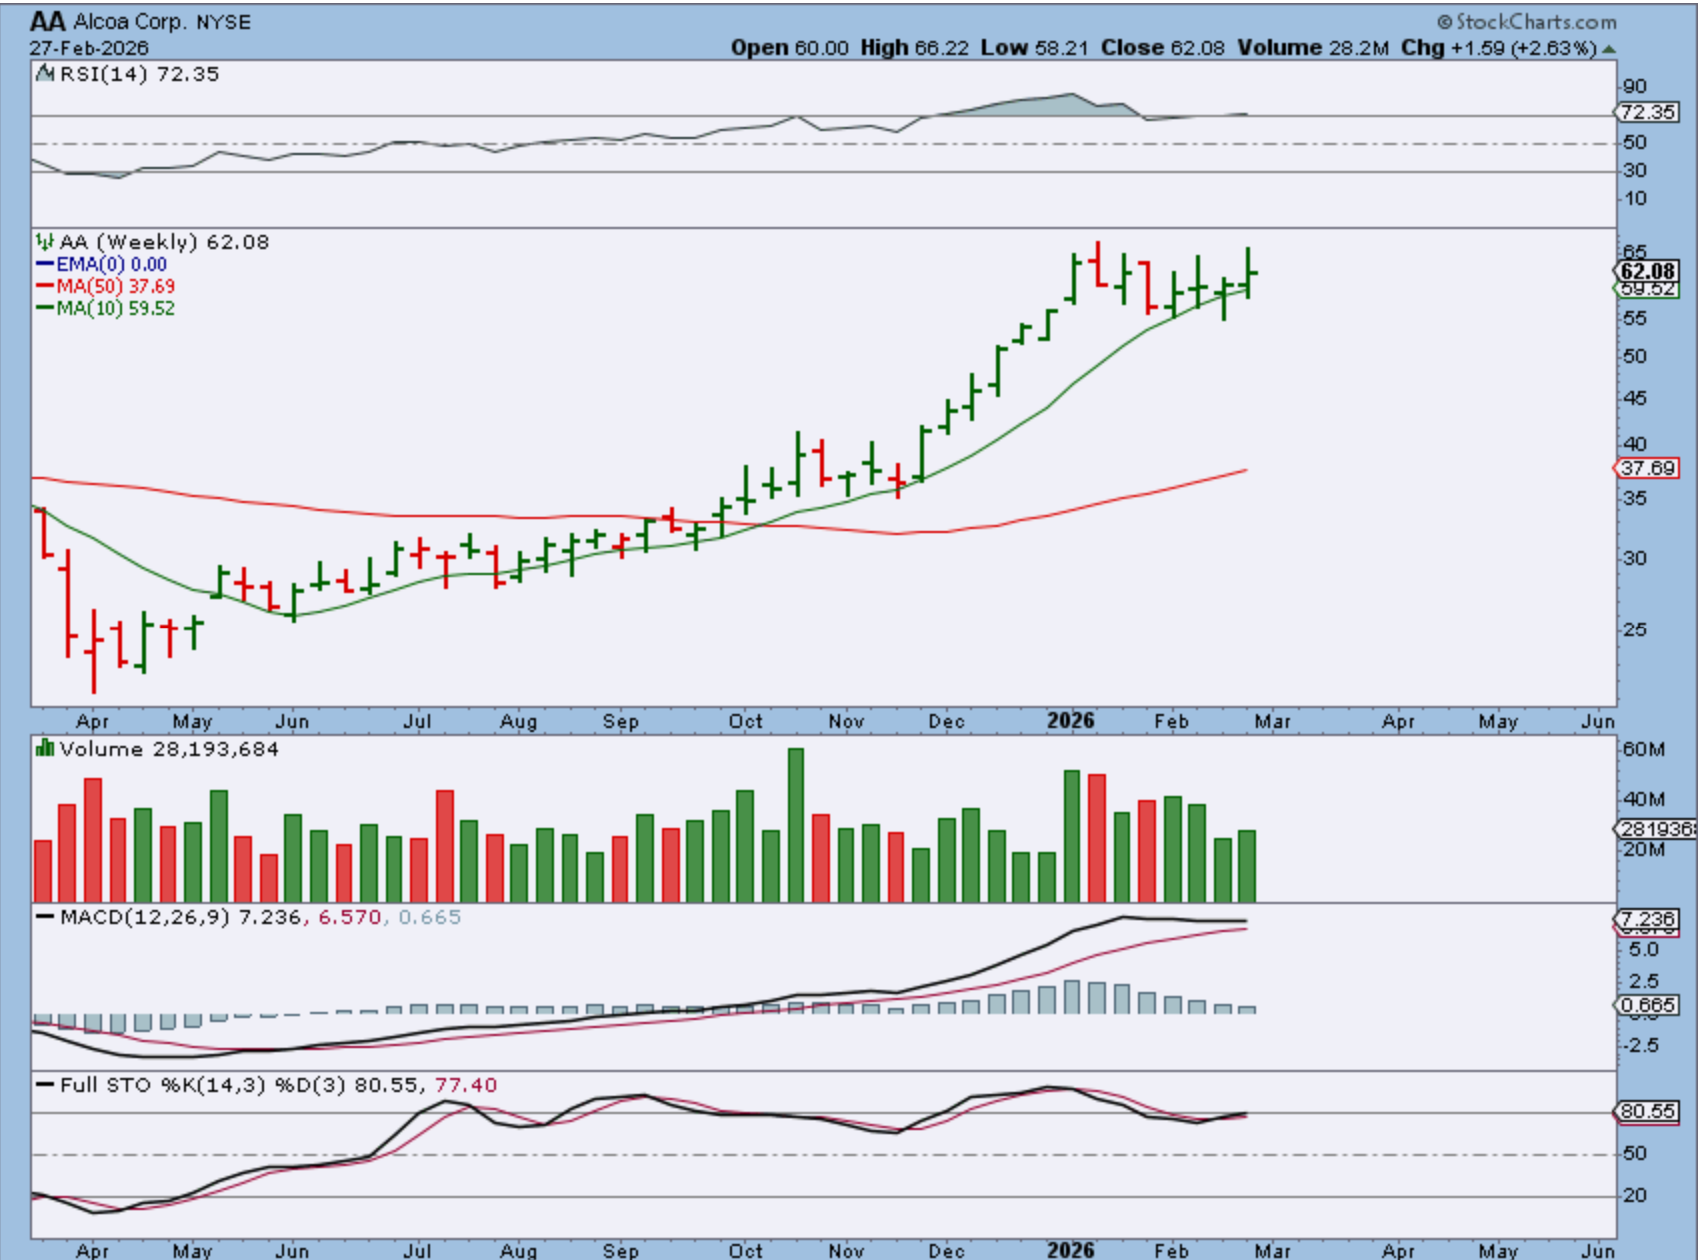
I also like aluminum and Steel stocks, so AA for example popped and dropped, but could be ready to move higher off of support. It did pretty much triple since April 2025.
.
So we do still have bullish set ups in all of the sectors that we watch, but the Nasdaq makes me a bit uncomfortable until it gets above the weekly 20ema and starts to push away from the ICL low. Oil and Precious Metals (& Copper, Aluminum, Rare Earths, etc) are also bullish and did well last week. I Hope that all are enjoying the weekend! See you on Monday. 🙂
.
~ALEX
.
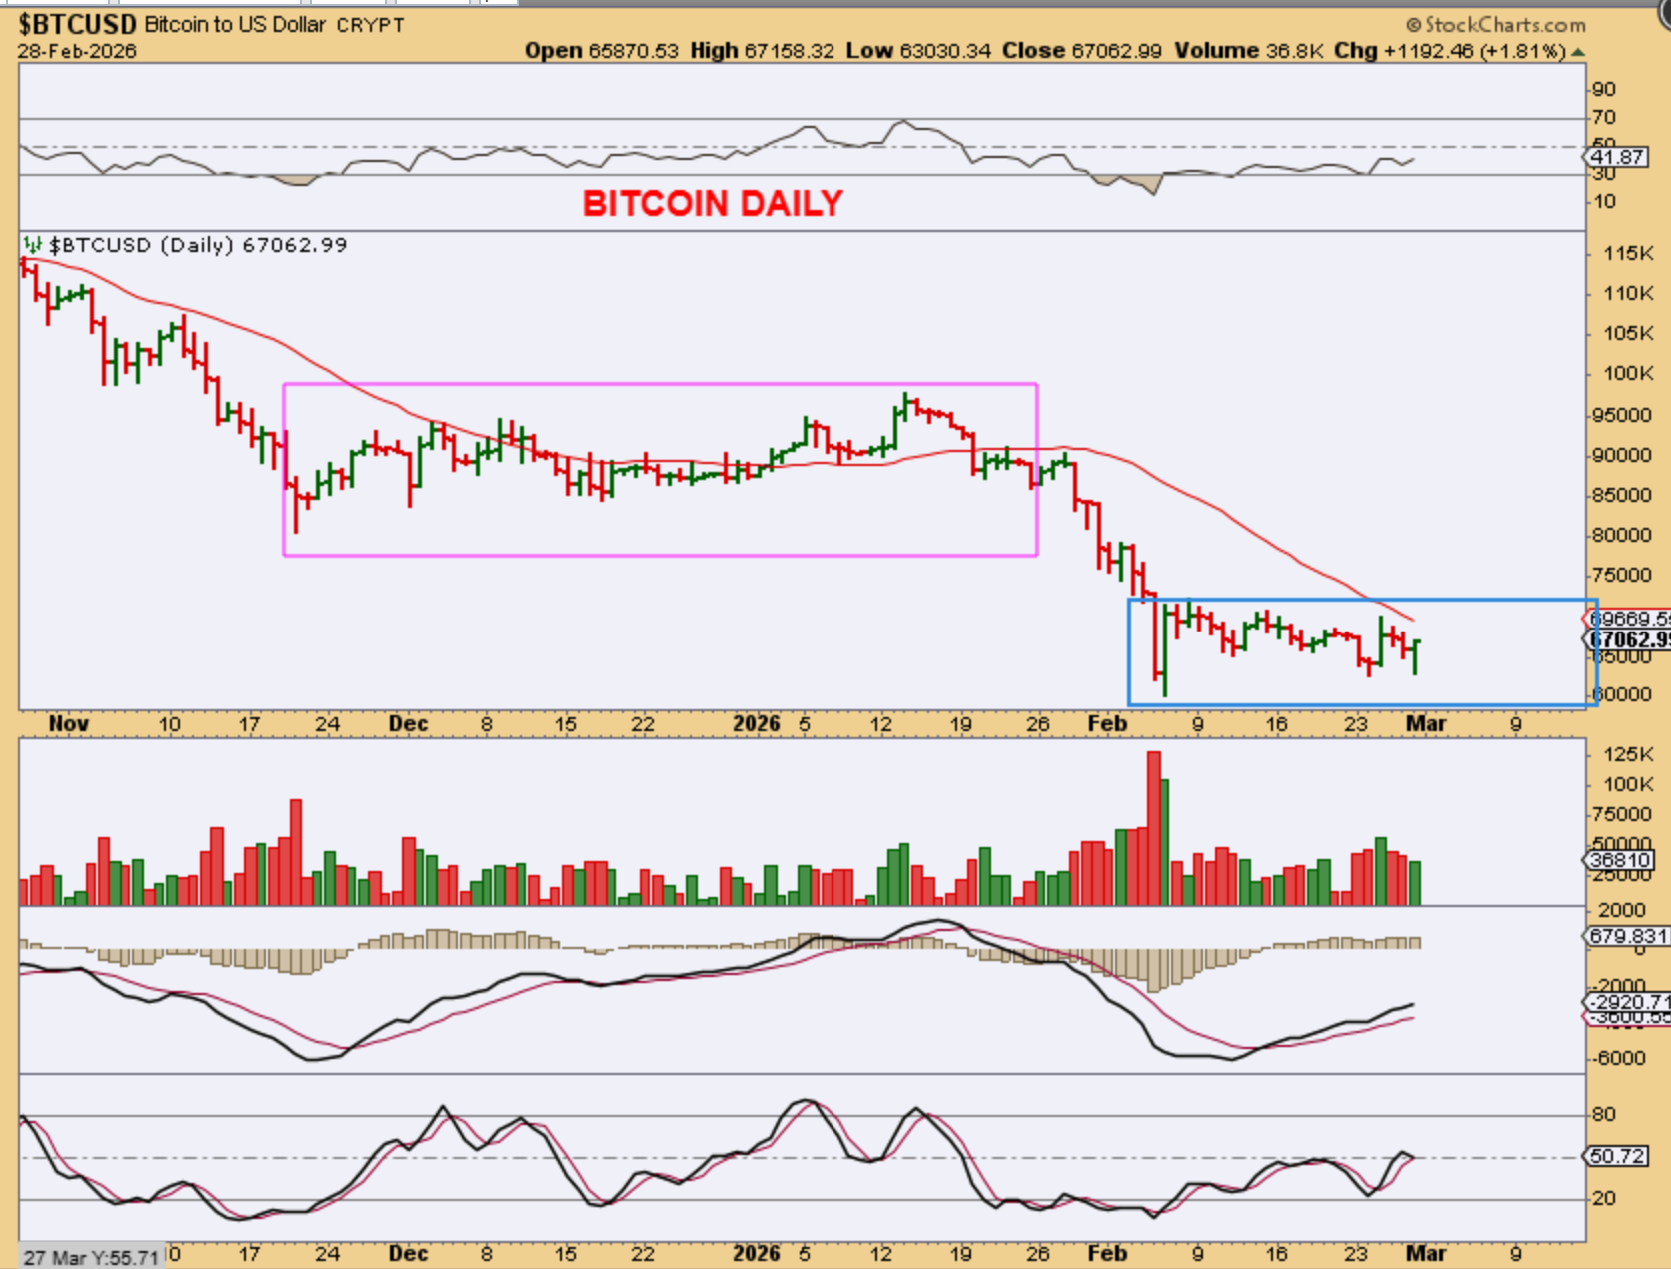
BITCOIN – Remains choppy, but we did see a better POP higher a couple of days ago. Those gains went away as selling kicked in, but now it is reversing here on Saturday afternoon. The crypto stocks are a bit choppy now too, and they may be affected by both Bitcoin and the choppiness in the general markets too.
Friday February 27th 
 Tuesday March 3rd
Scroll to top