January 18th Weekend Report
.
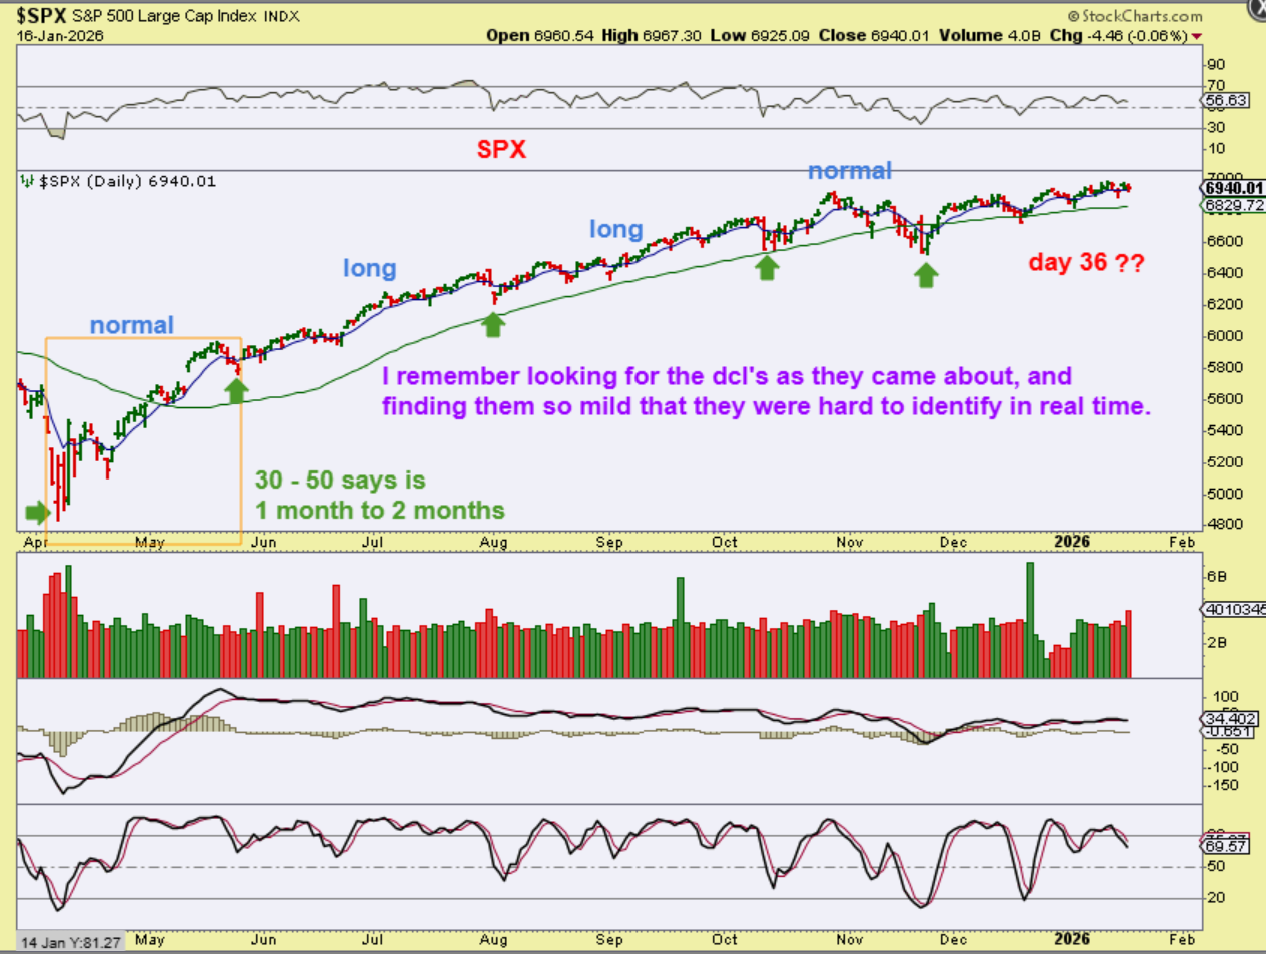
SPX – I just want to continue to show you that the markets can be choppy, but still be in a bull run. The problem is that we often get mild dips as dcls, but they are hard to identify, so we just ride that bull.
For example: Look to the left of the chart. We had normal length and long daily cycles, but finding the dcls was not easy. We just continued to ride the bull, unless it breaks down. THis is just the first daily cycle.
.
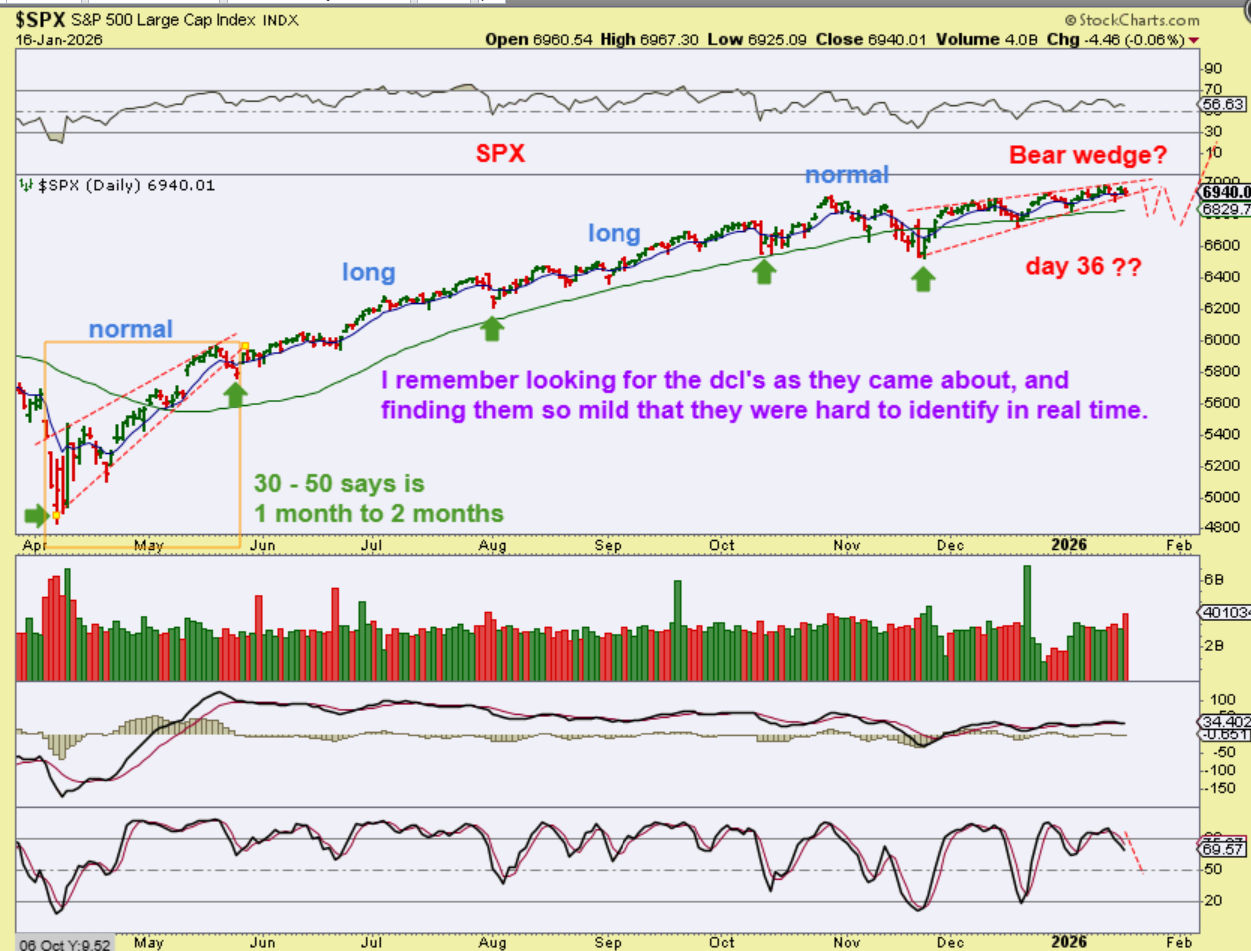
SPX Again – Is that a bear wedge that I have been seeing? Maybe, but even if it is, we are on day 36 and would be due for a dip into a dcl.
1. It isn’t bearish long term and a dip doesn’t have to be deep, it could be to the 50sma though. I drew 2 dips, there only needs to be one quick dip if we get one.
2. We also could bullishly break out higher into day 43 or so, and then back test the wedge as a dcl.
.
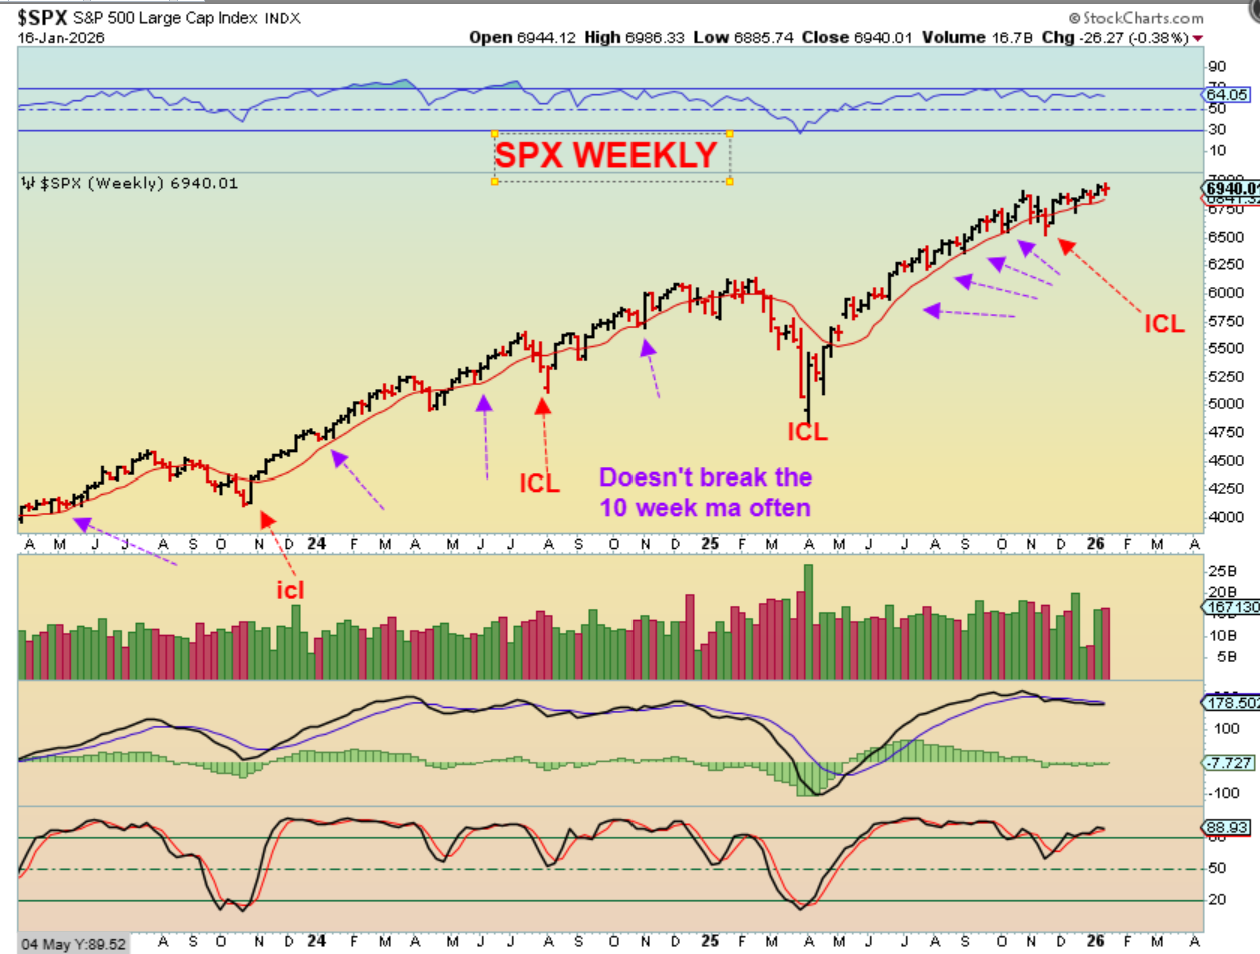
So, for the SPX Weekly, we are in a Bull market, and the Bulls are still in control. Read the chart.
.
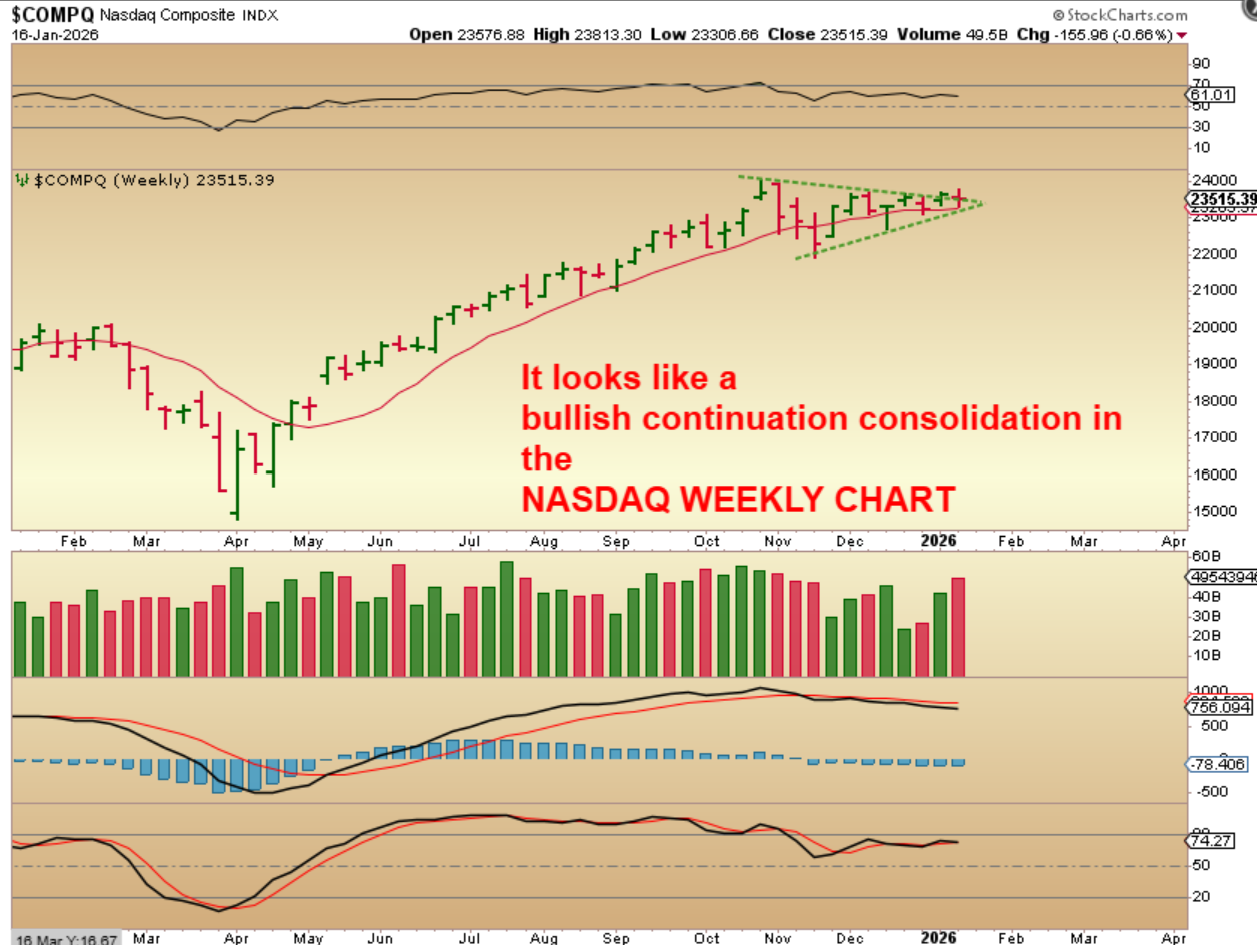
THE NASDAQ WEEKLY: We have a triangle consolidation and that should be a bullish continuation pattern, especially with an ICL starting it off.
.
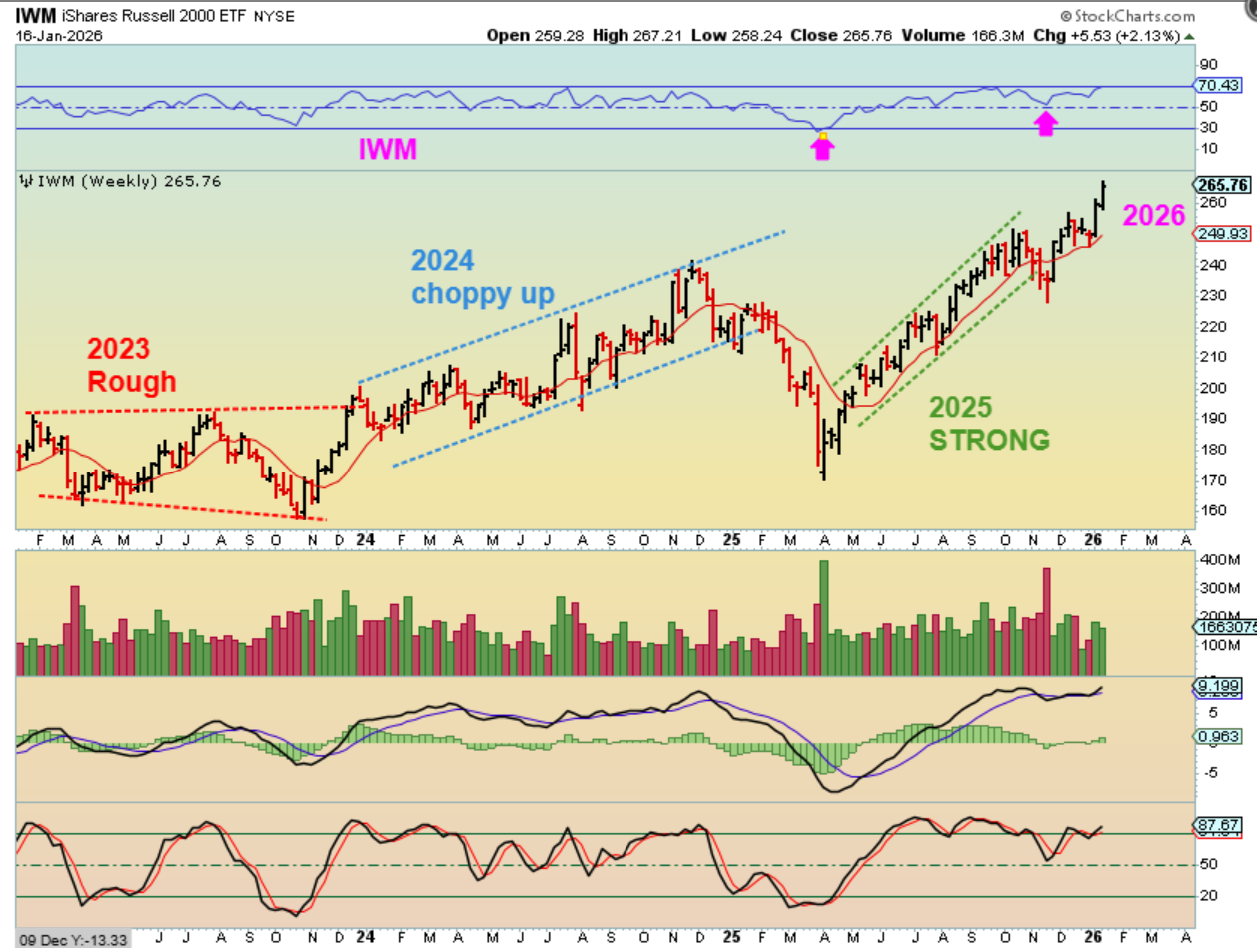
THE IWM WEEKLY chart shows acceleration in small caps. We have seen that in our daily stock trading too. Notice 2023 vs 2024 vs 2025. Last year we saw stocks ramping up nicely out of that early 2025 crash ICL. We traded many areas that made excellent gains (see RKLB, AAOI, Quants, Nuke Stocks, Robotics, AI, CRYPTO, P.M. Miners, etc). Then we had our ICL in November and now we see that same steep accent with the IWM.
.
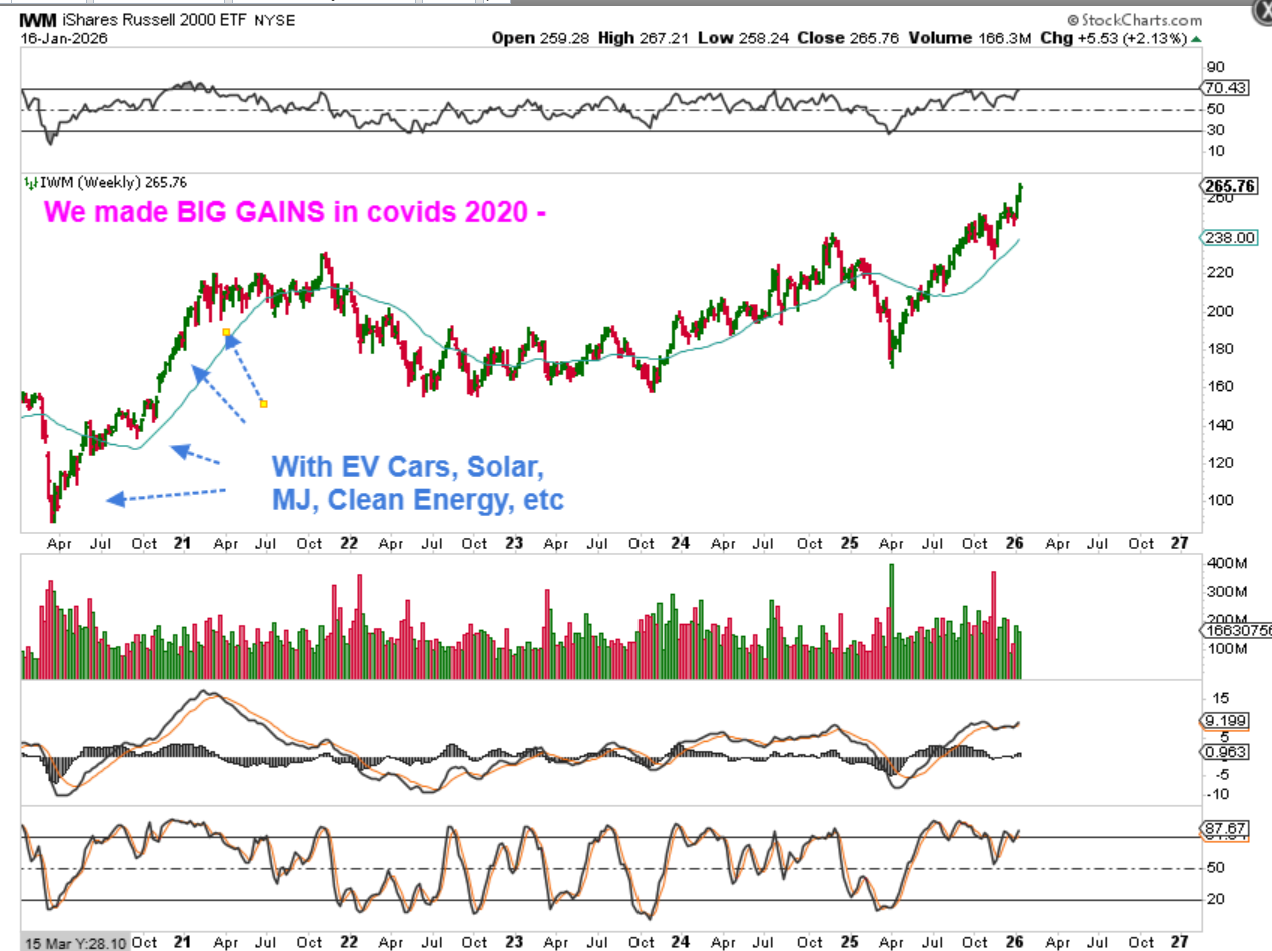
Let’s go back to Covid. The IWM WEEKLY shows us that we now have a very similar ramp up as we did in 2020. At that time, the stocks climbed that wall of worry. Do you remember EV, Clean Energy and Solar, MJ Stocks, etc back then? Now it has changed to AI, Robotics, Quants, etc. but the ramp up is SO SIMILAR THAT…
.
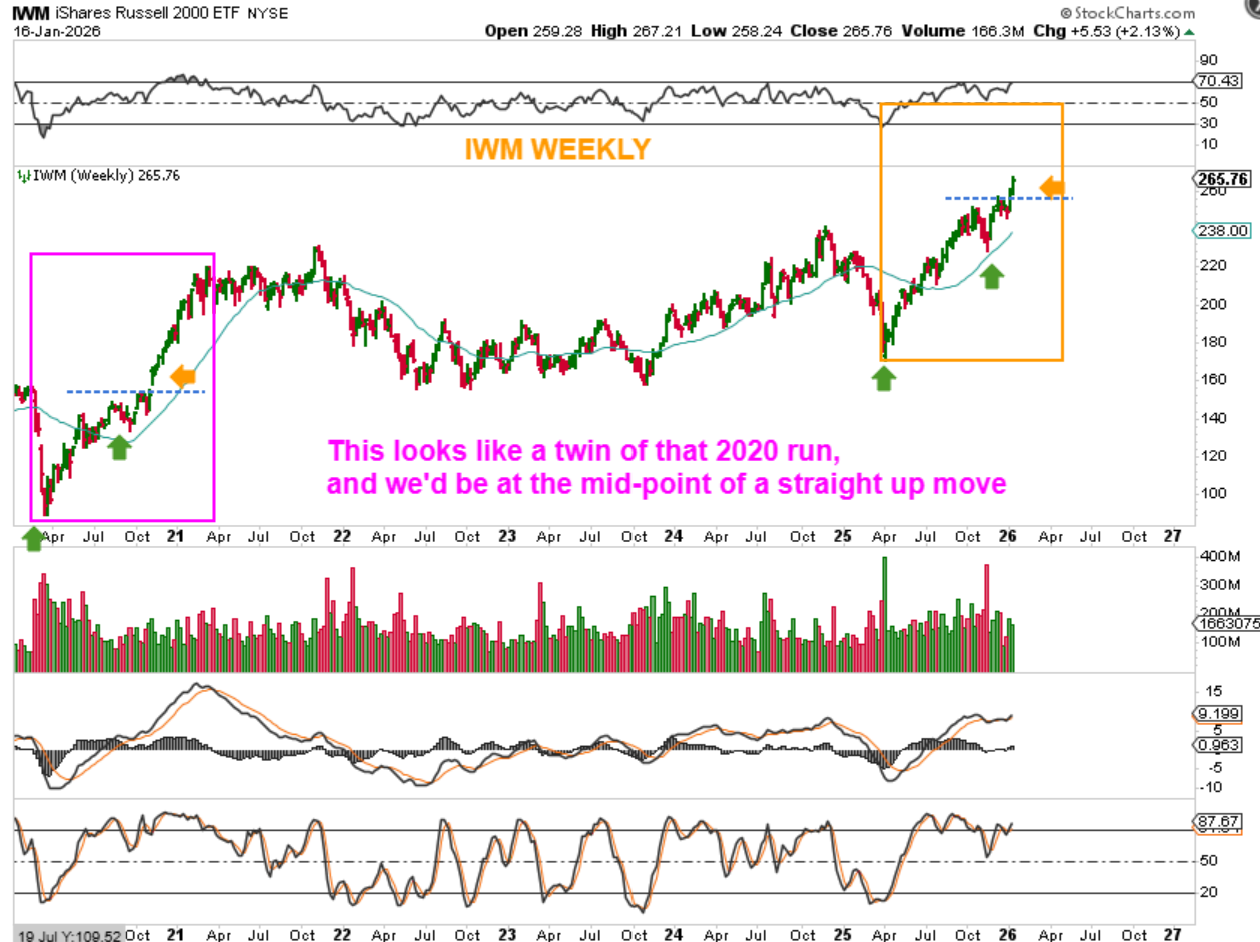
The ramp up is SO SIMILAR TO 2020 THAT I DREW THIS. Do you see it too? In 2020, we see that
1. Price ran straight up above the green line
2. Chopped sideways to vertically to consolidate a little, and then…
3. The price ran almost straight up after that small sideways chop. I hope we see the same now in 2026.
.
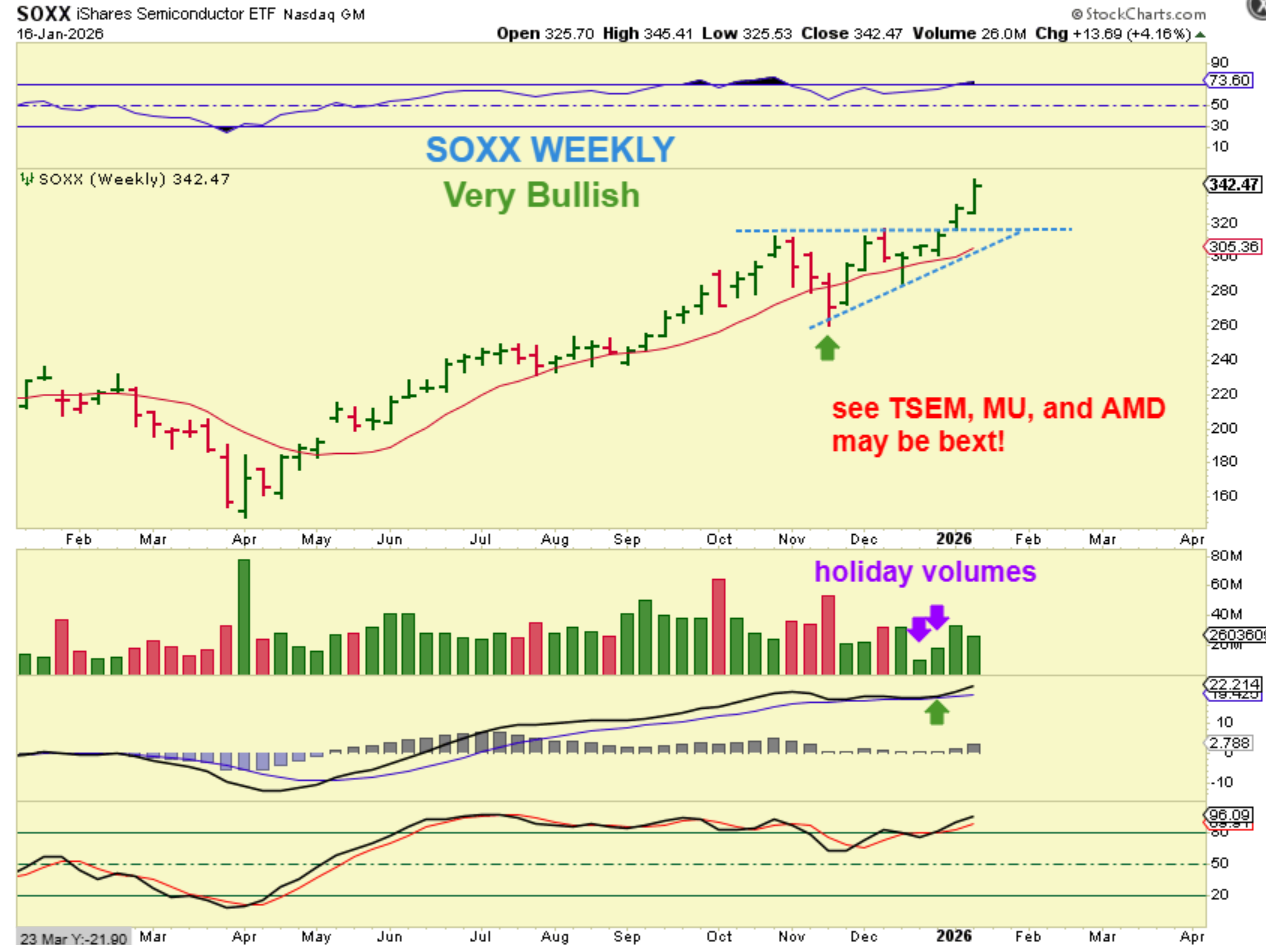
THE SOXX has been strong after breaking out from its triangular or flat-top wedge consolidation. Over time I have mentioned TSEM, MU, AMD. I do see one problem though…
.
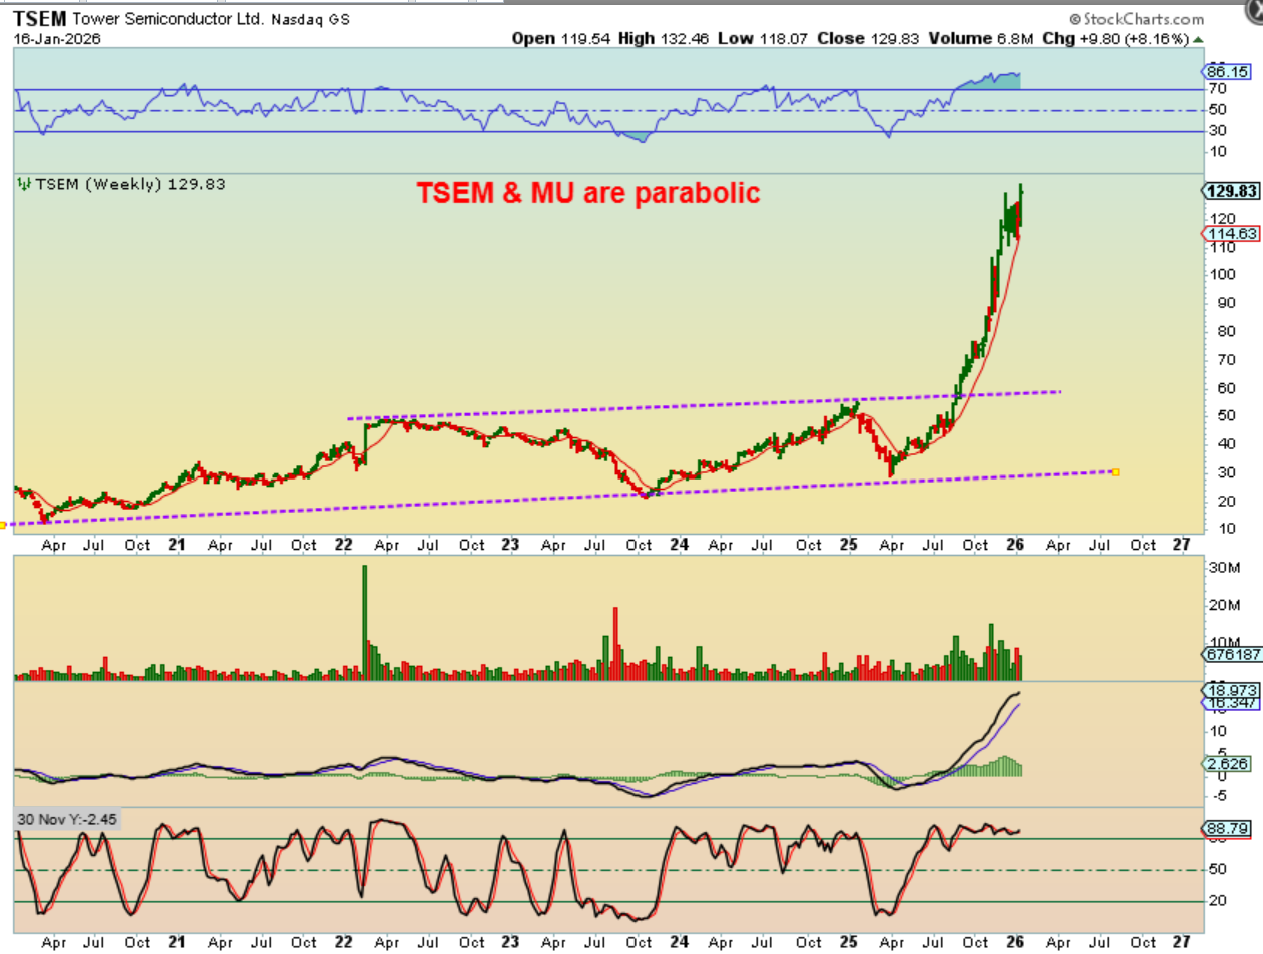
Doesn’t this look a bit too hot? TSEM and MU look parabolic, especially ramping up from last summer to now. I was also concerned with…
.
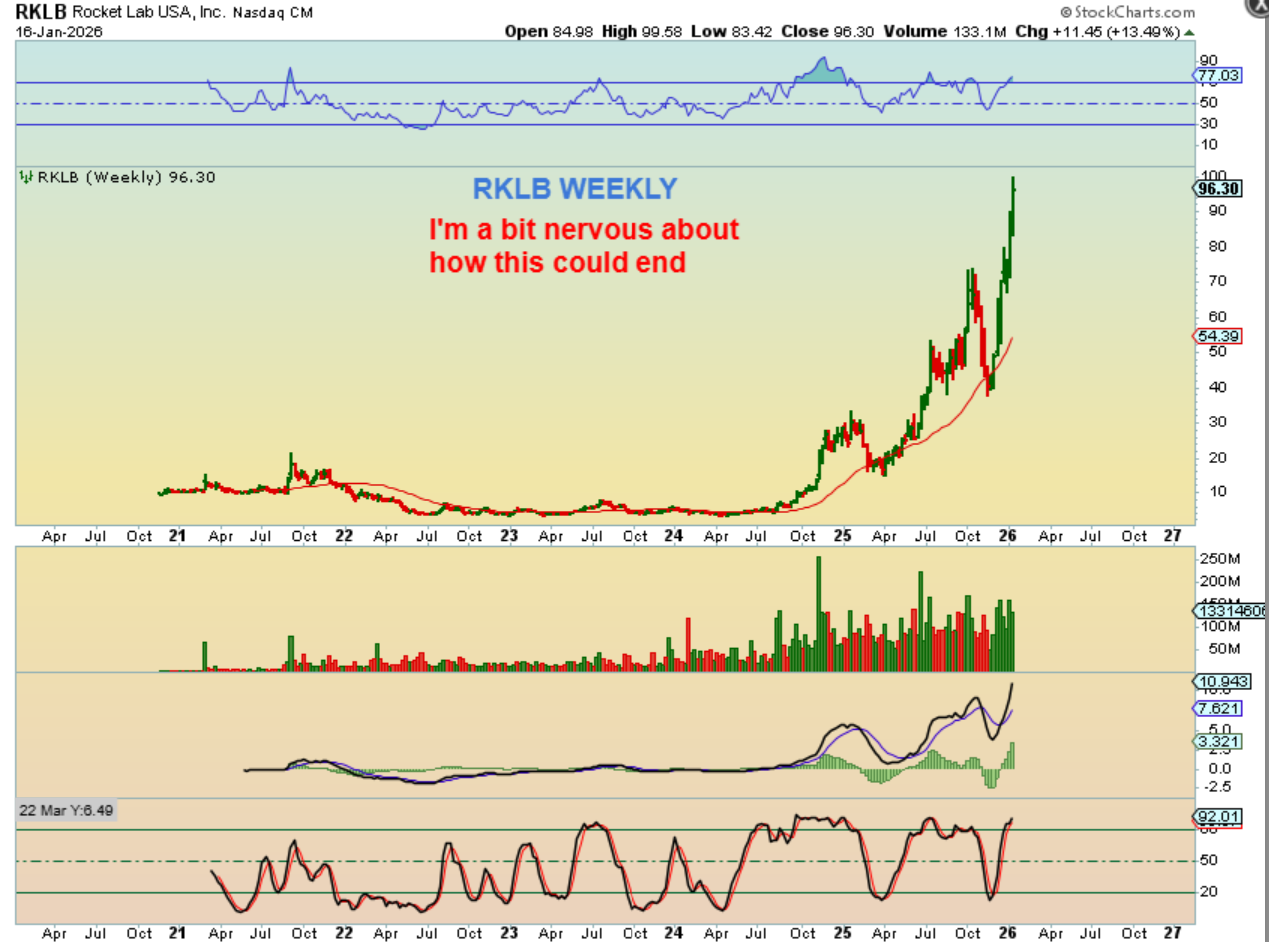
I have owned RKLB and from the Nov ICL to now it has doubled and could triple ($38 to $114). I didn’t realize that it is now in a parabolic run too, but this is straight up, right? It has rallied from the Nov ICL with no down weeks. Congrats if you bought it, but it often rallies and chops at the top. That may come sooner than later.
.
THE BULLS ARE DEFINITELY STILL IN CONTROL
.
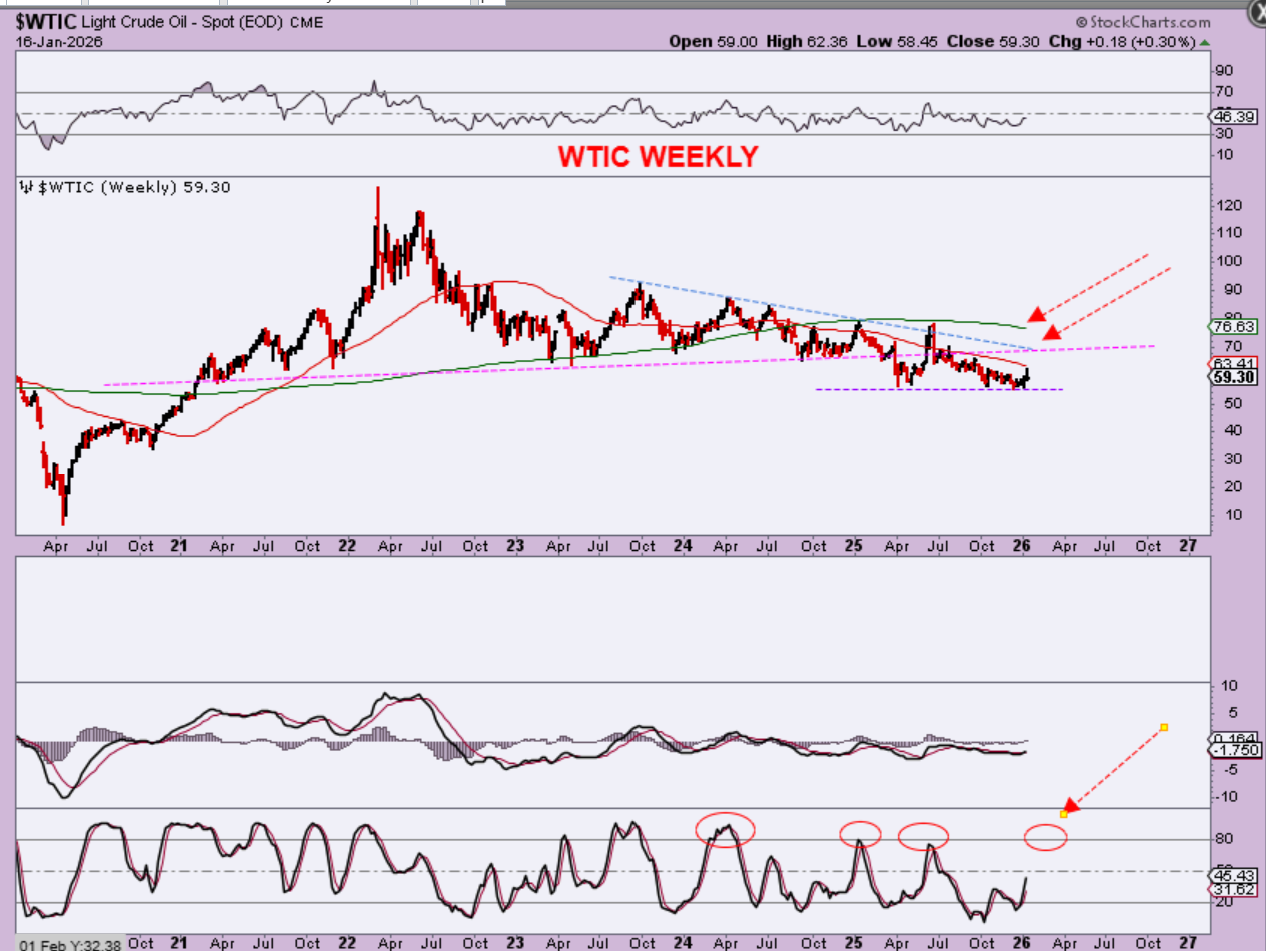
WTIC – Oil pushed higher and looked strong, but it was rejected at the 200sma on the daily chart, which adds up to the 50 ma on a weekly chart. It is not overbought, so it can continue to make that run higher, as pointed out on this chart. Oil stocks have made progress.
.
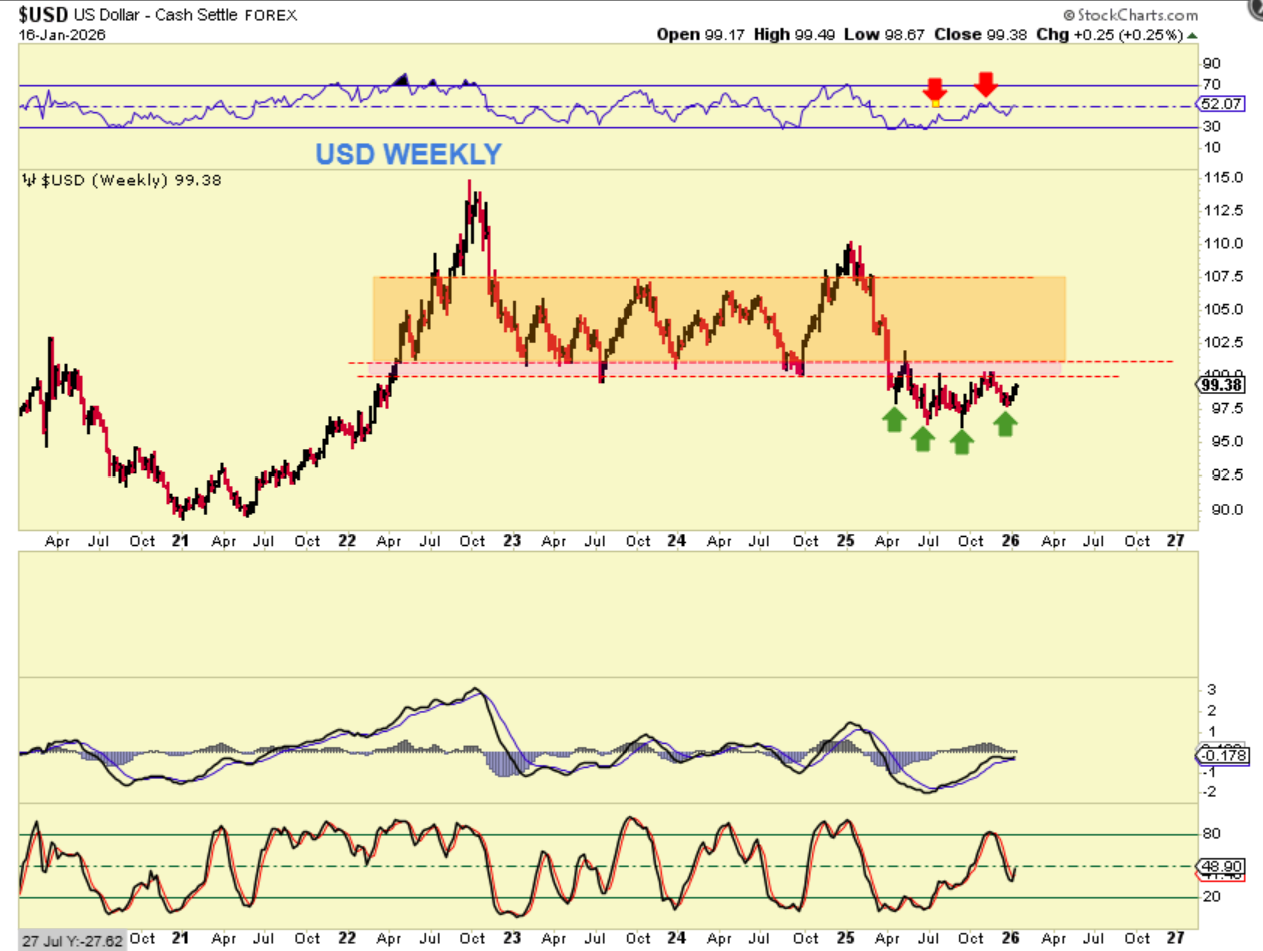
THE USD WEEKLY CHART: The USD is improving and has now put a higher low in place. The MACD is bullish and the stochastics has turned up. I do believe that we will see the USD trying to break back into that former support-turned-resistance area soon.
.
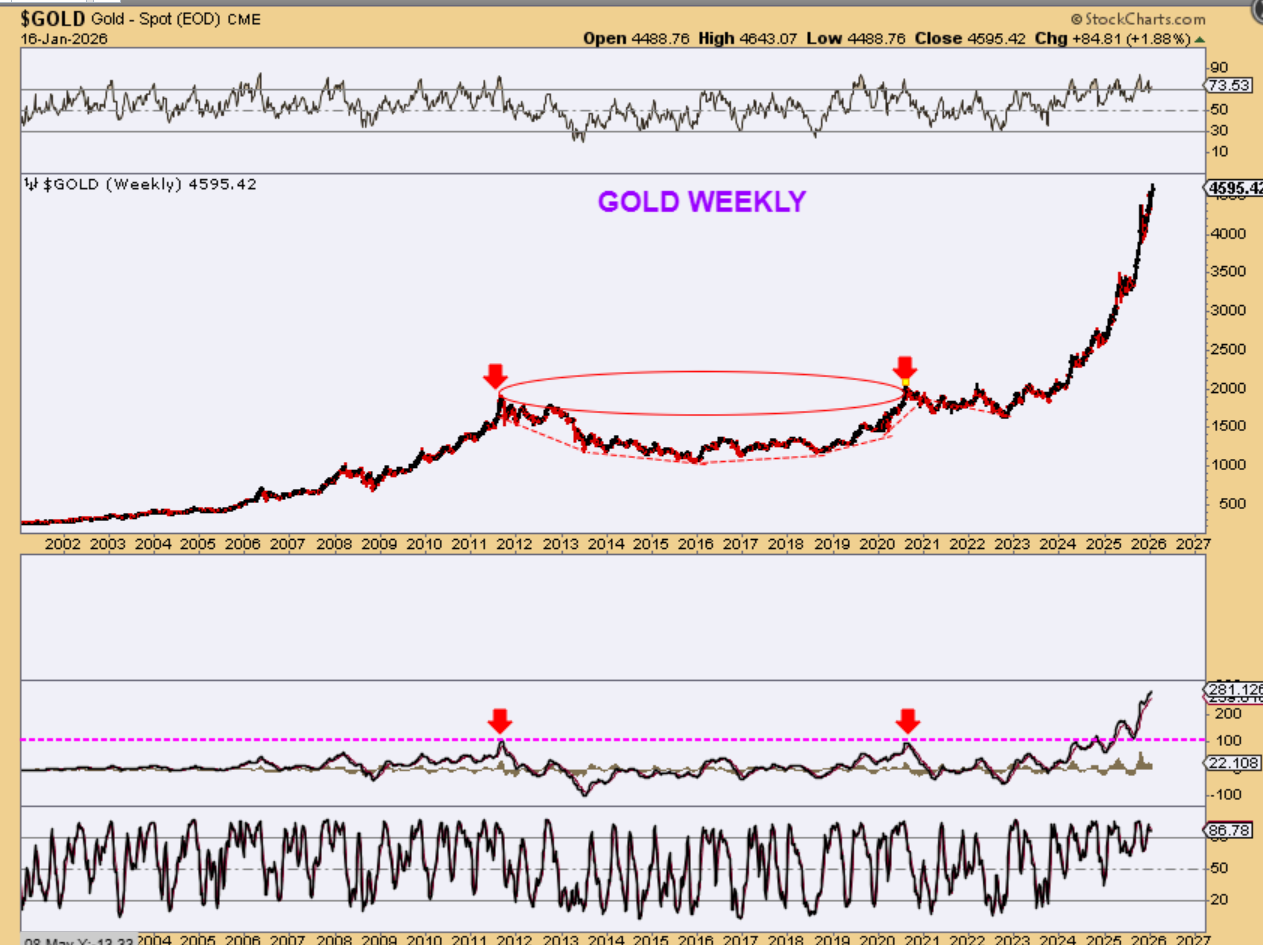
GOLD – You may have been trading Precious Metals for years like me. Do you remember that strong run from 2008 to 2011? Well, this one blows that one away. After a large cup and handle formed, Gold broke out and started a vertical run. Also, take a look at that MACD. Much of 2025 was a long choppy consolidation that now shows up a triangle, and Gold has rallied higher from that point, almost straight up. Gold seems to want to run to the $5000 area in this new intermediate cycle.
.
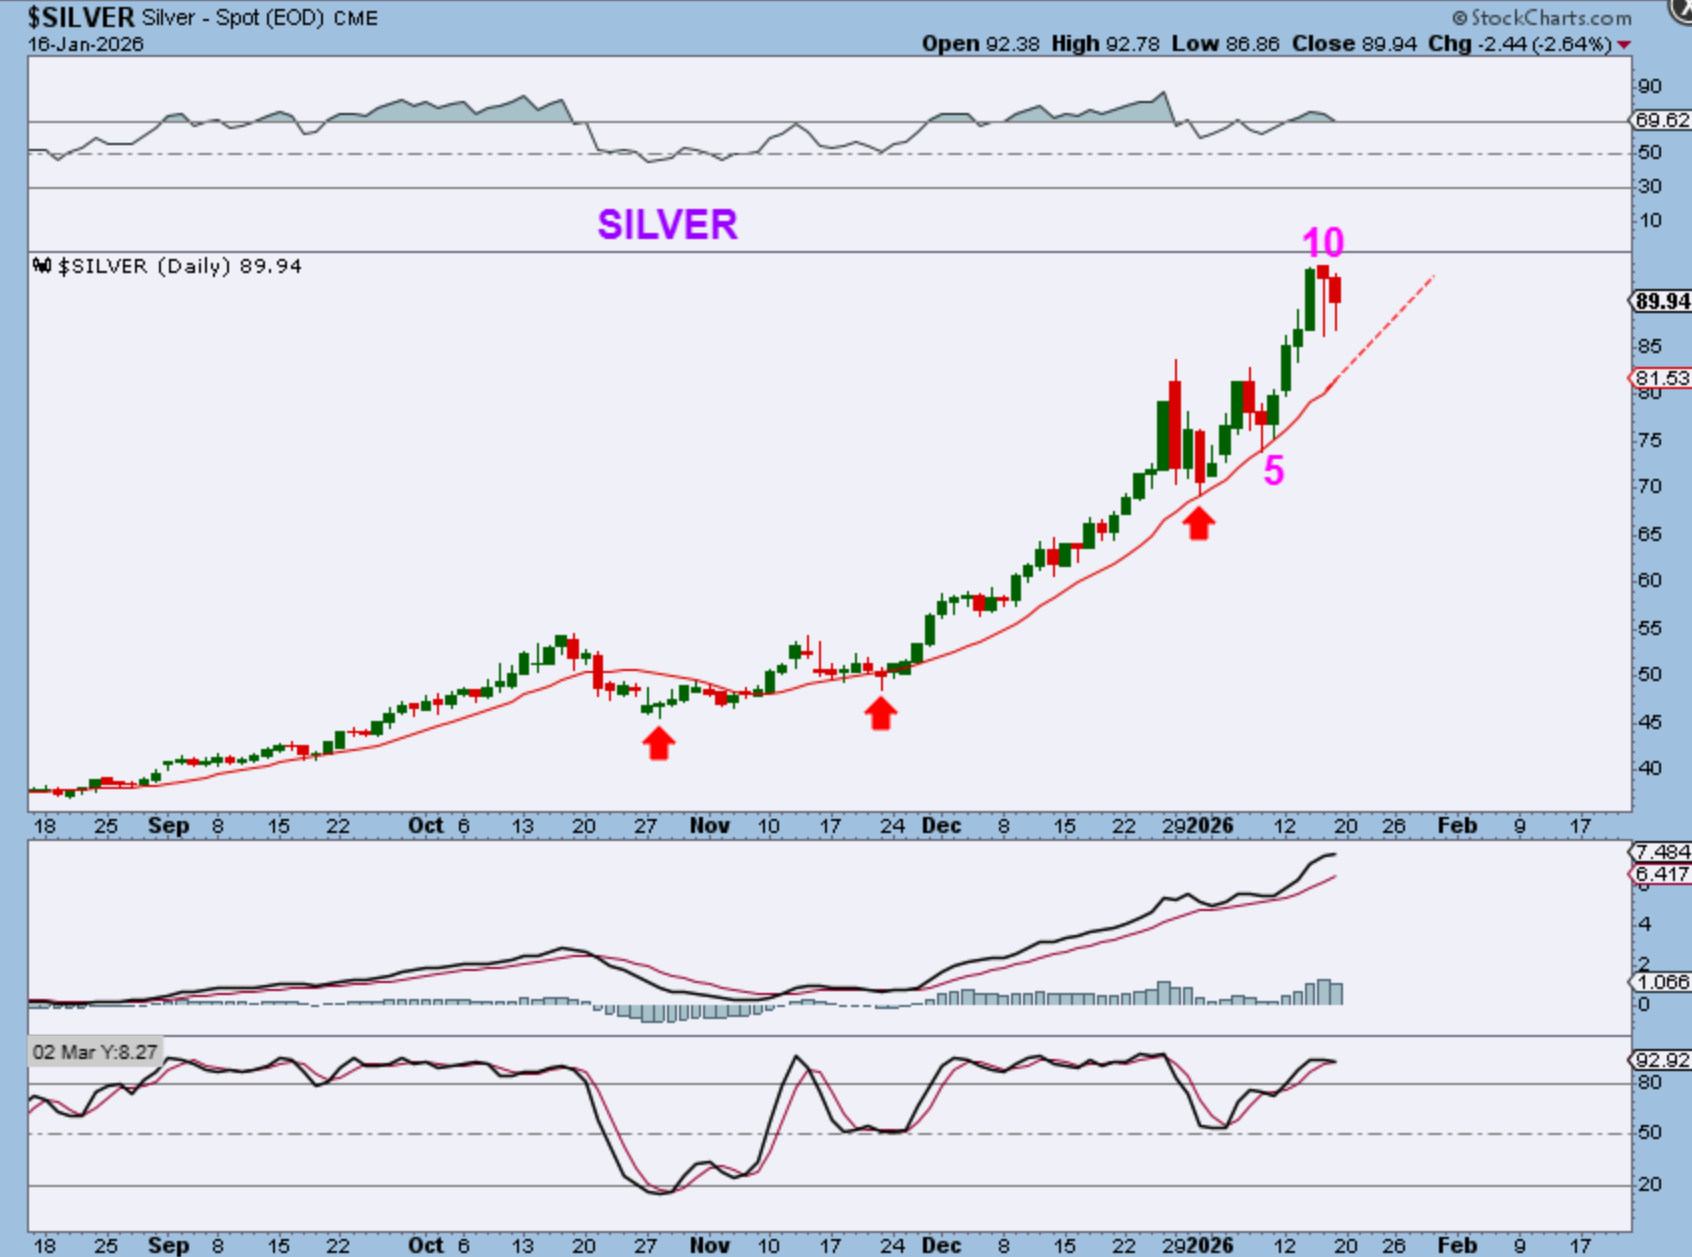
In a weekday report, I drew this chart of Silver and added the last 2 candles as what I called ‘Lollipop’ looking candles, where price sells down, but it tries to recover.
.
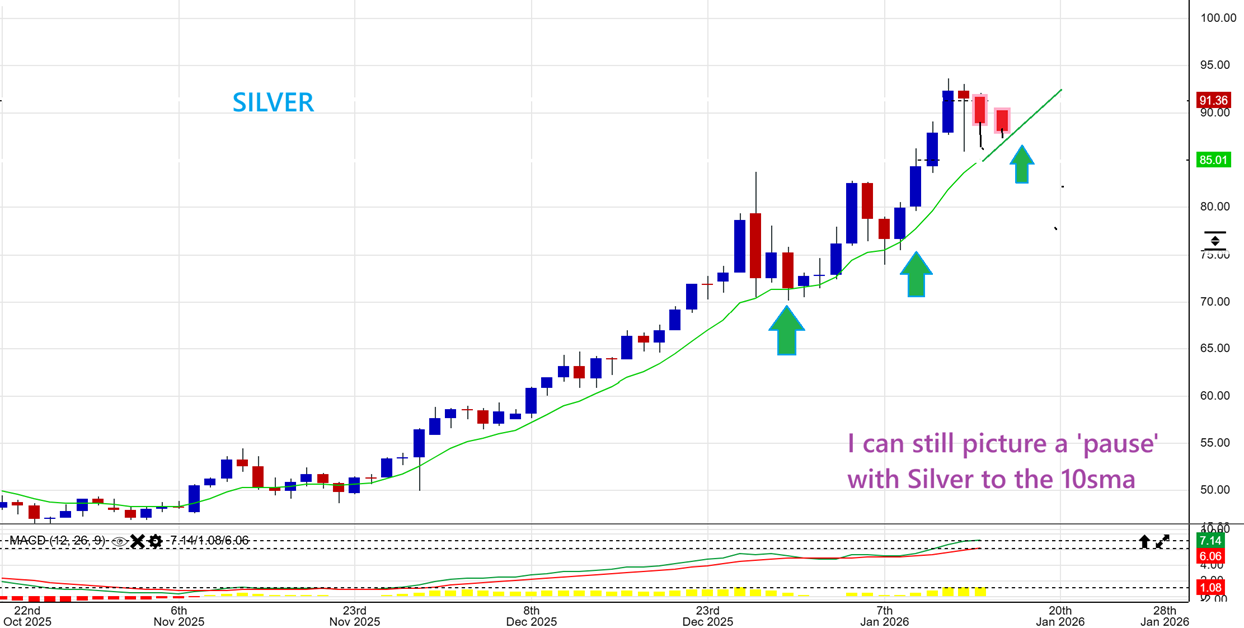
Also in a weekday report, I showed Silver as having larger candles or moves now, but it could possibly pull back and make another run. I actually have a target price for Silver at $97.63
.
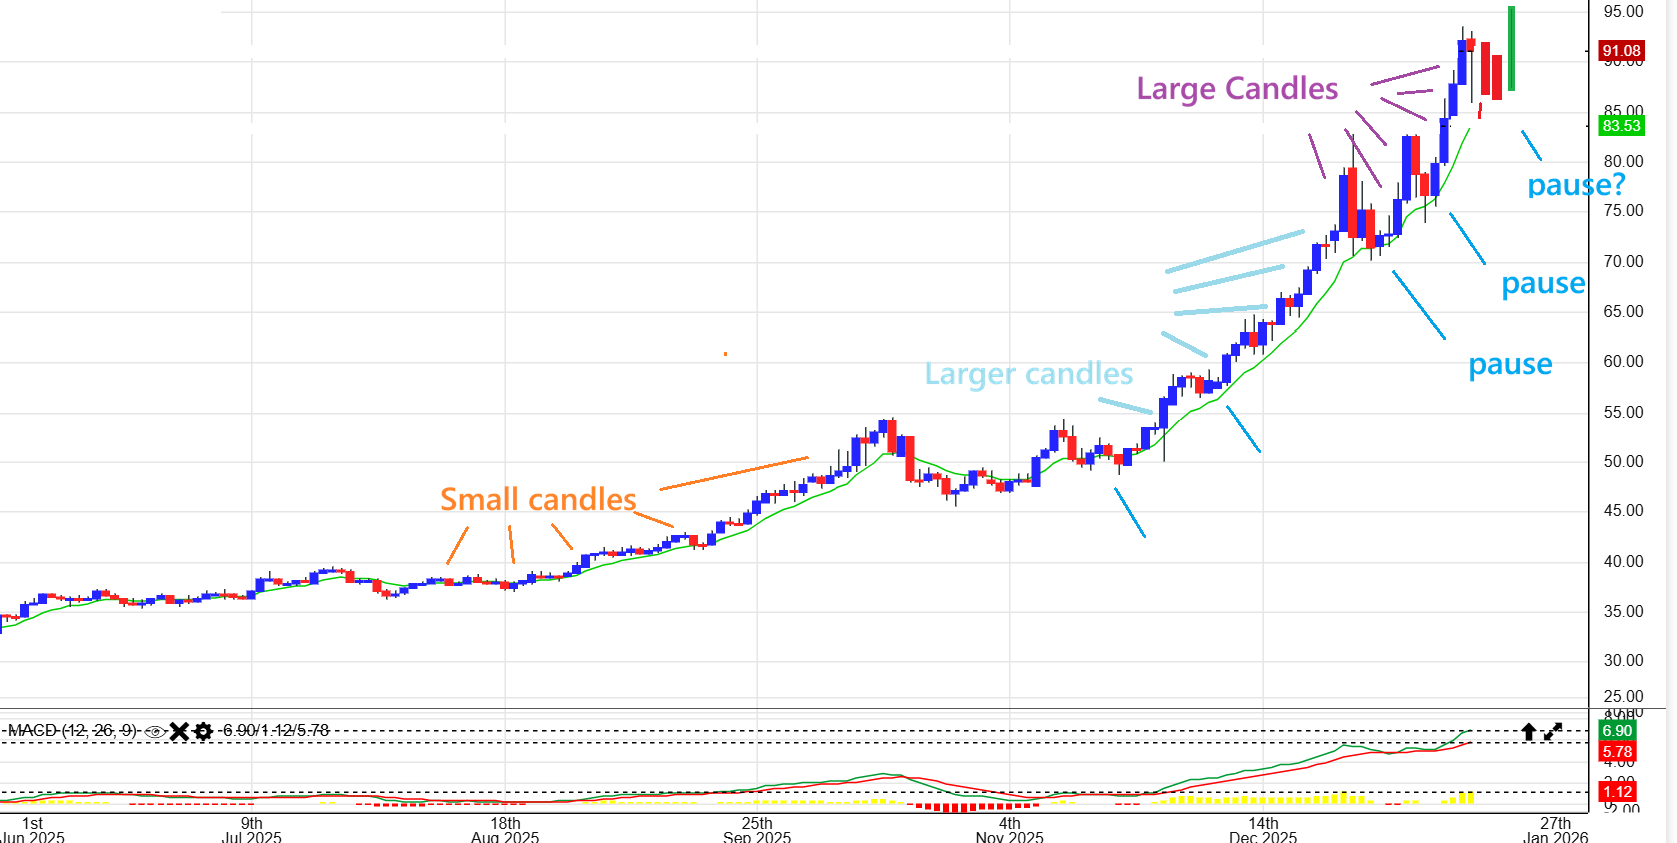
SILVER DAILY – Silver did a bearish reversal in December, usually a topping candle, but that only lasted for 3 days. With the US arresting Argentinas’ leader, Irans’ uncertainty, Israels troubles, etc , the geopolitical climate seems to have stoked the fire again. So, Silver dropped right to support, bounced and dropped to that support again on day 5. Silver then made new highs on day 10 and is on day 11. In Fridays report I mentioned Silver could chop to the support with ‘lollipop’ looking candles, and we do see that happening now. I have a target for Silver at $97.63.
.
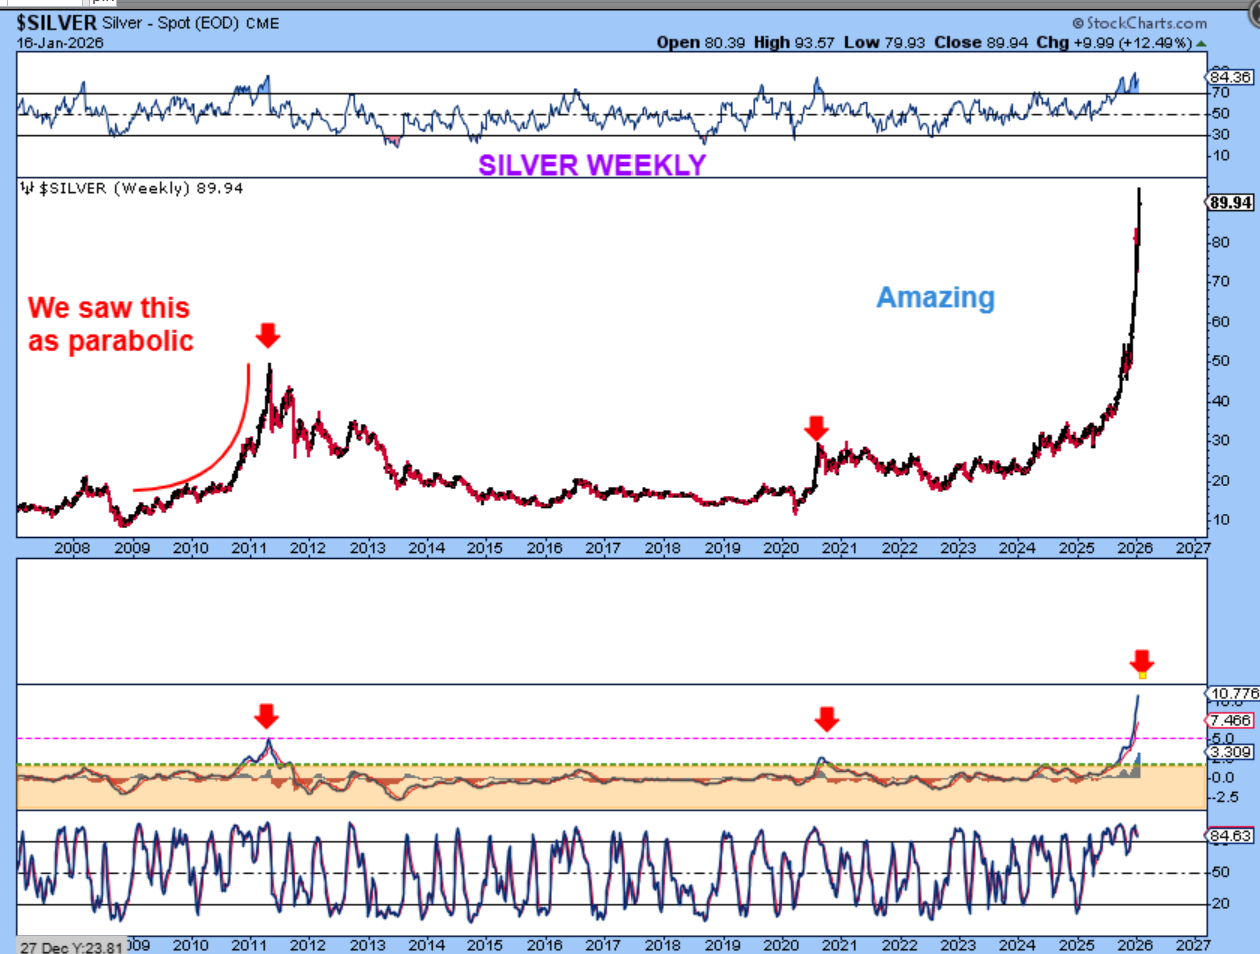
Step back and look at THE SILVER WEKLY CHART and it is amazing! What else can we say.? This is not seen as a sustainable move, since it is straight up, but calling a top is tough. It looks like it would be common to run to a nice round number of $100, I have a measured move target of $97.63, but a ‘wiggle’ at this rate could outdo that number.
.
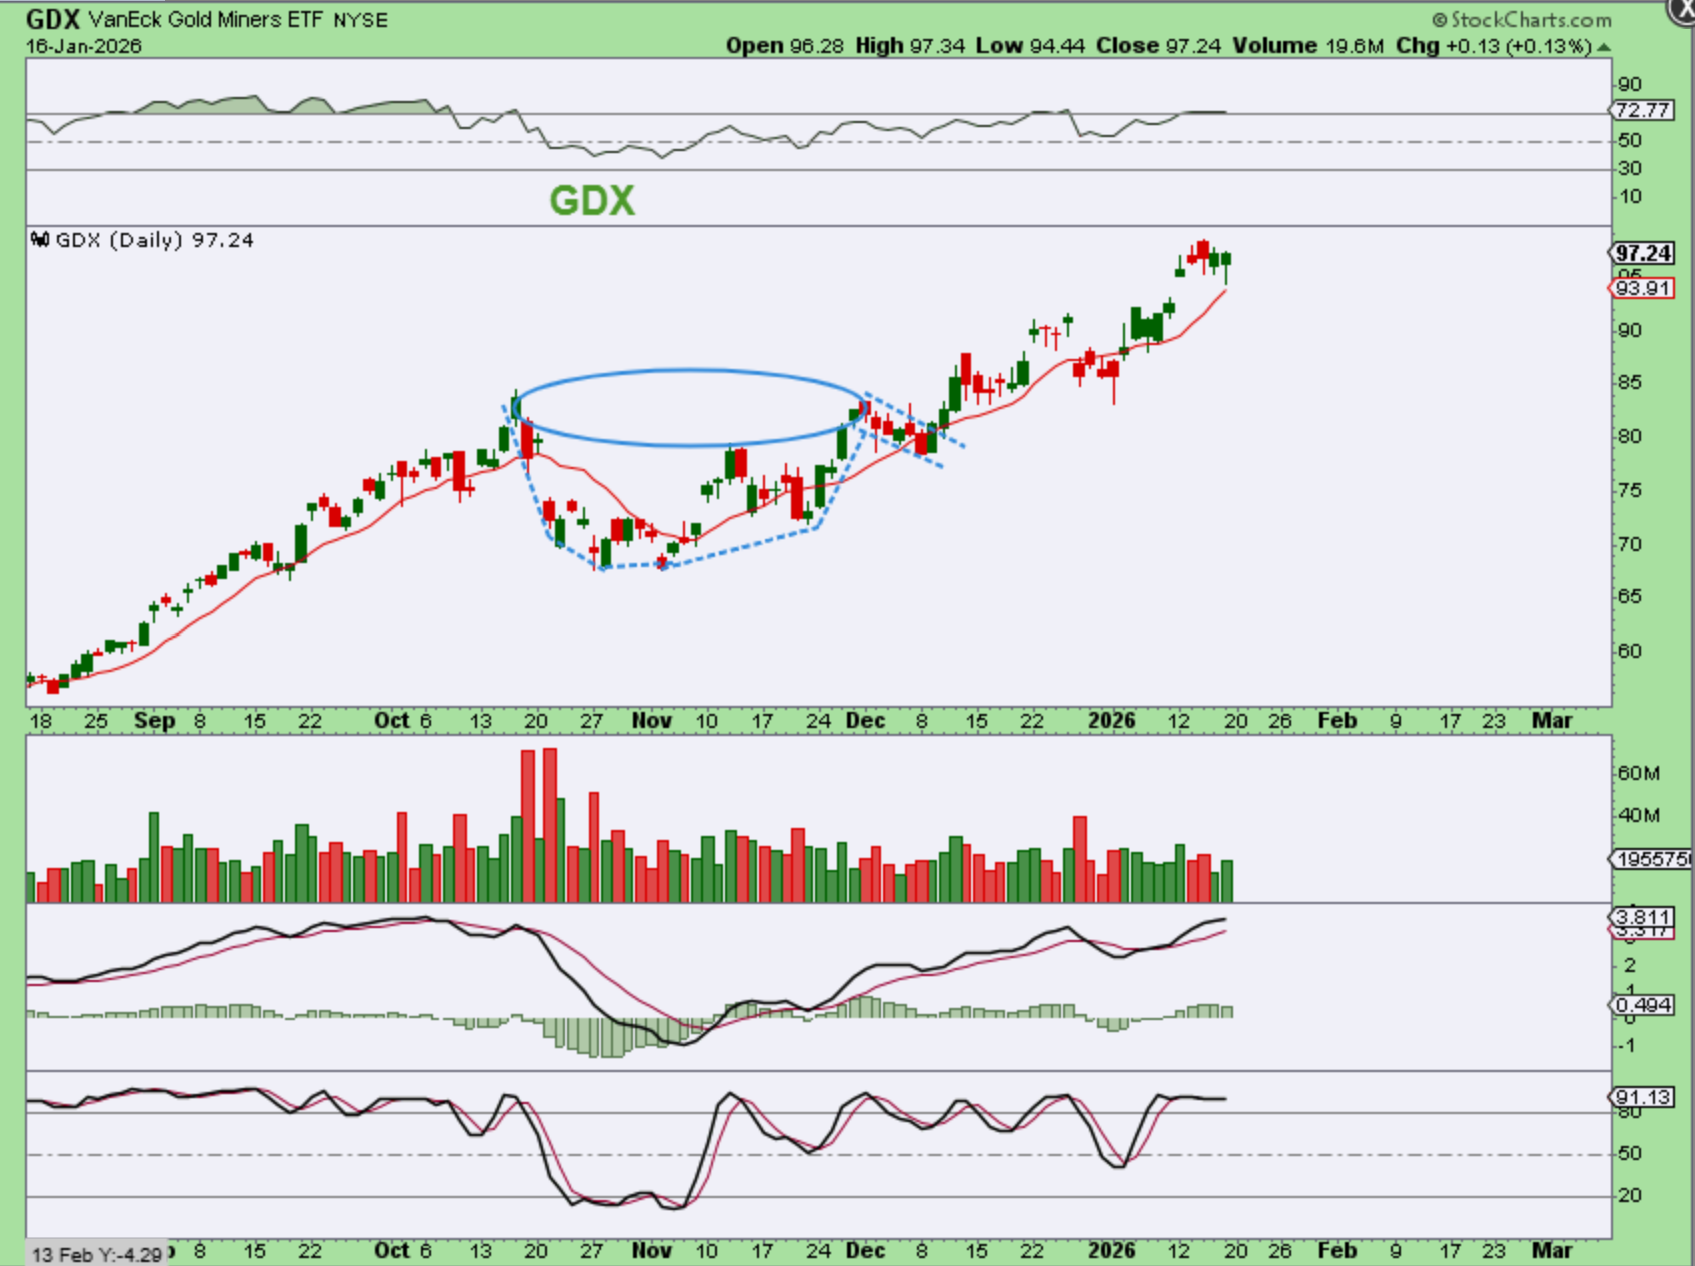
GDX has been chopping higher, mostly following what Gold is doing. It is 10 days out of its most recent low, with a day 8 ‘peak’ so far. The big picture for GDX also shows that this has been a beautiful run…
.
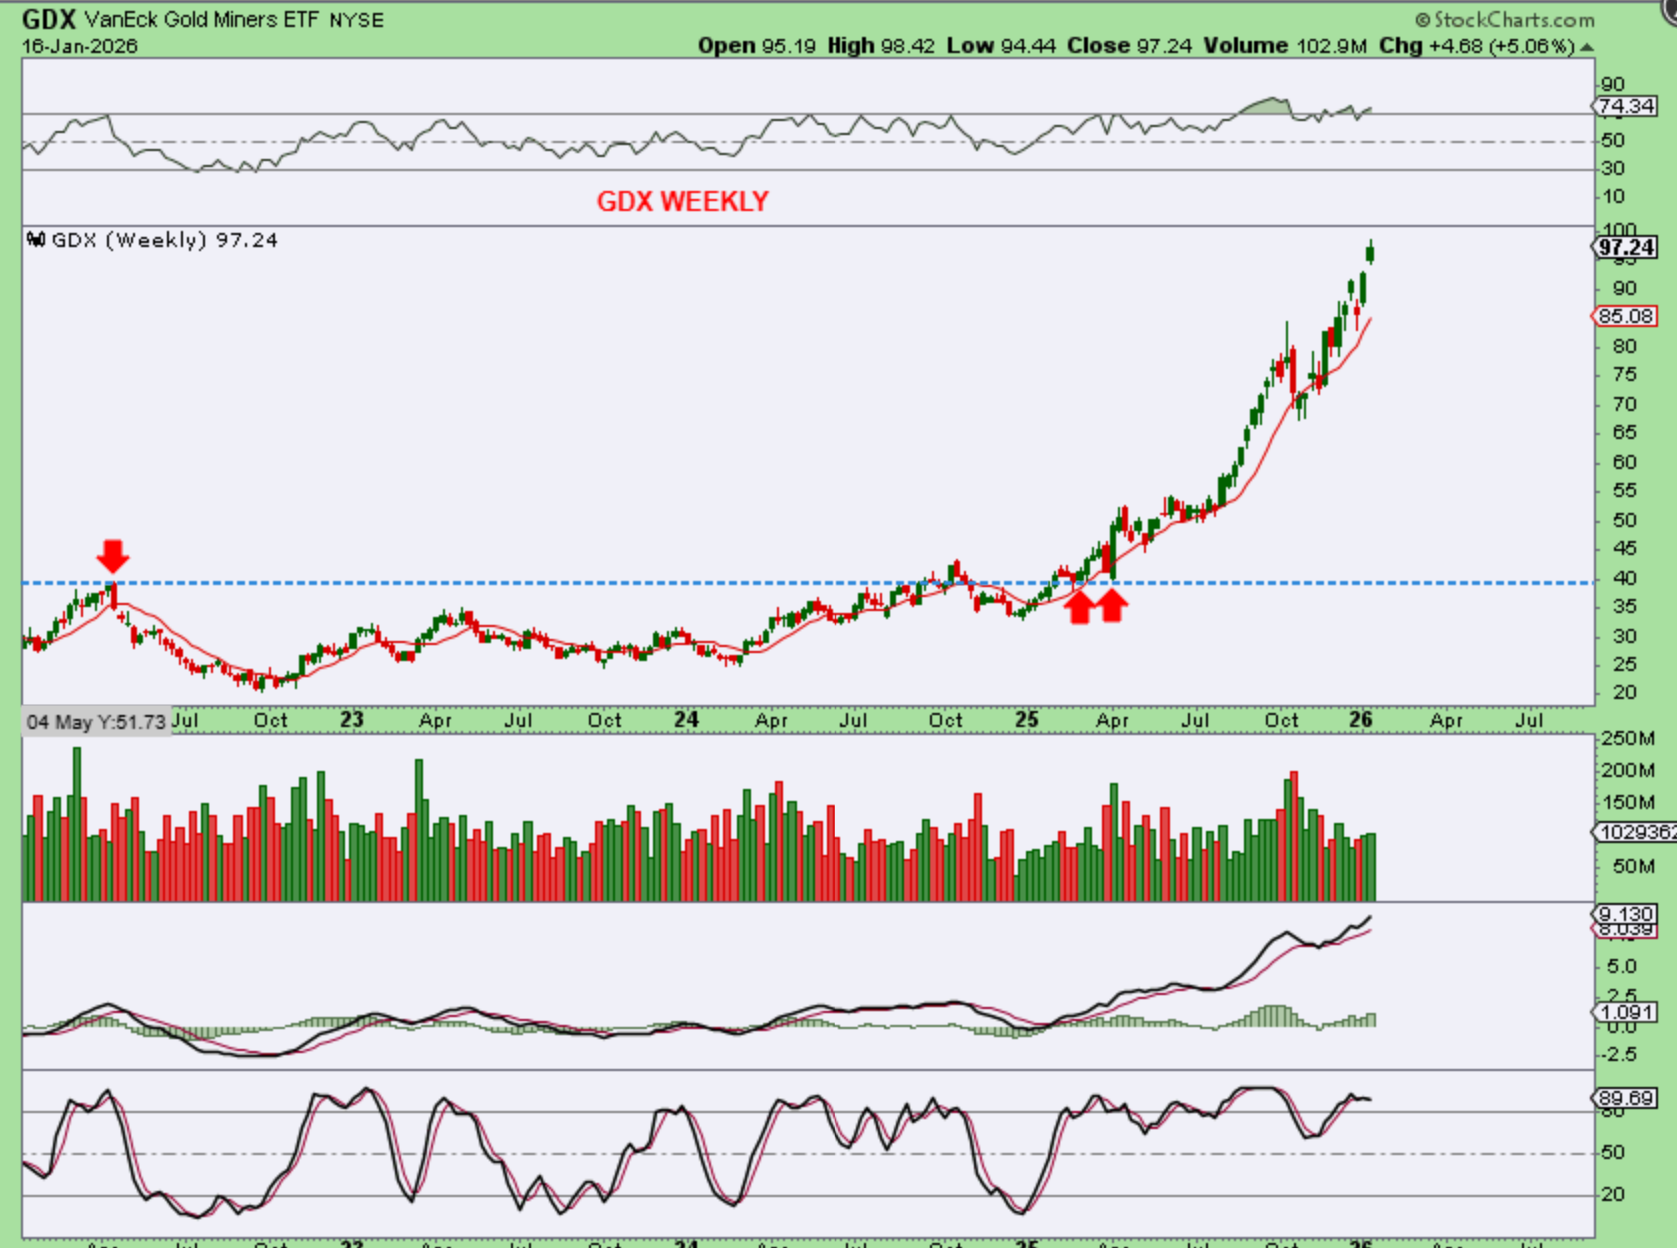
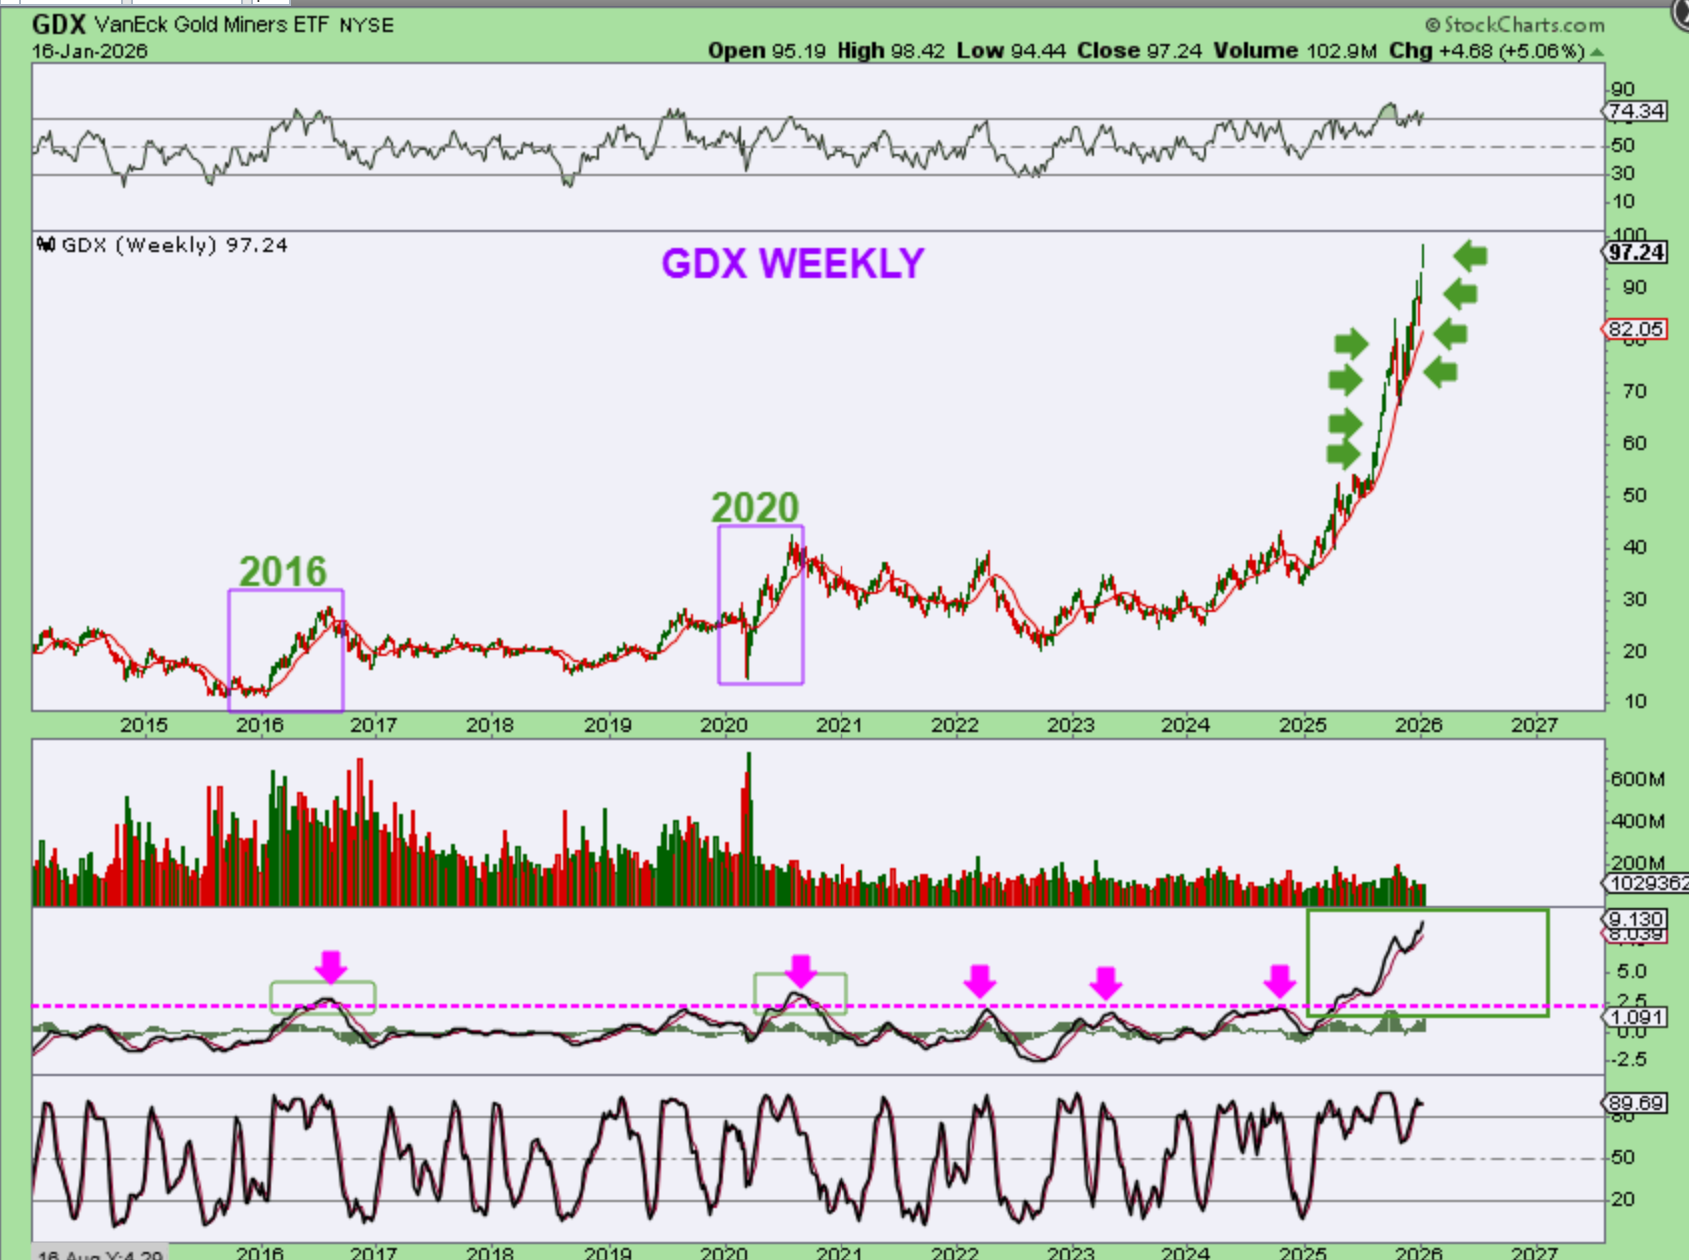
GDX WEEKLY BIG PICTURE: We know that Miners were choppy and difficult at times, but when you step back you can see that the miners did very well in 2025 into 2026. It doesn’t look parabolic here, but it does if you zoom away…
.
GDX has been running at a steep incline here too, and compared to prior rallies of 2016 and 2020, this one has been very strong. 20205-2026 has climbed the red 10 week ma as a stop. The MACD is extended now too. We’ll see what happens now that GDX has approached that $100 area. Often large round numbers find selling.
.
The Bulls are running and that can continue with dips along the way. Gold and Silver are extended and in a parabolic run, raising stops is prudent. Bitcoin is below. Thanks for being here and I hope you’re enjoying your weekend (long weekend in the U.S.).
.
~ALEX
.
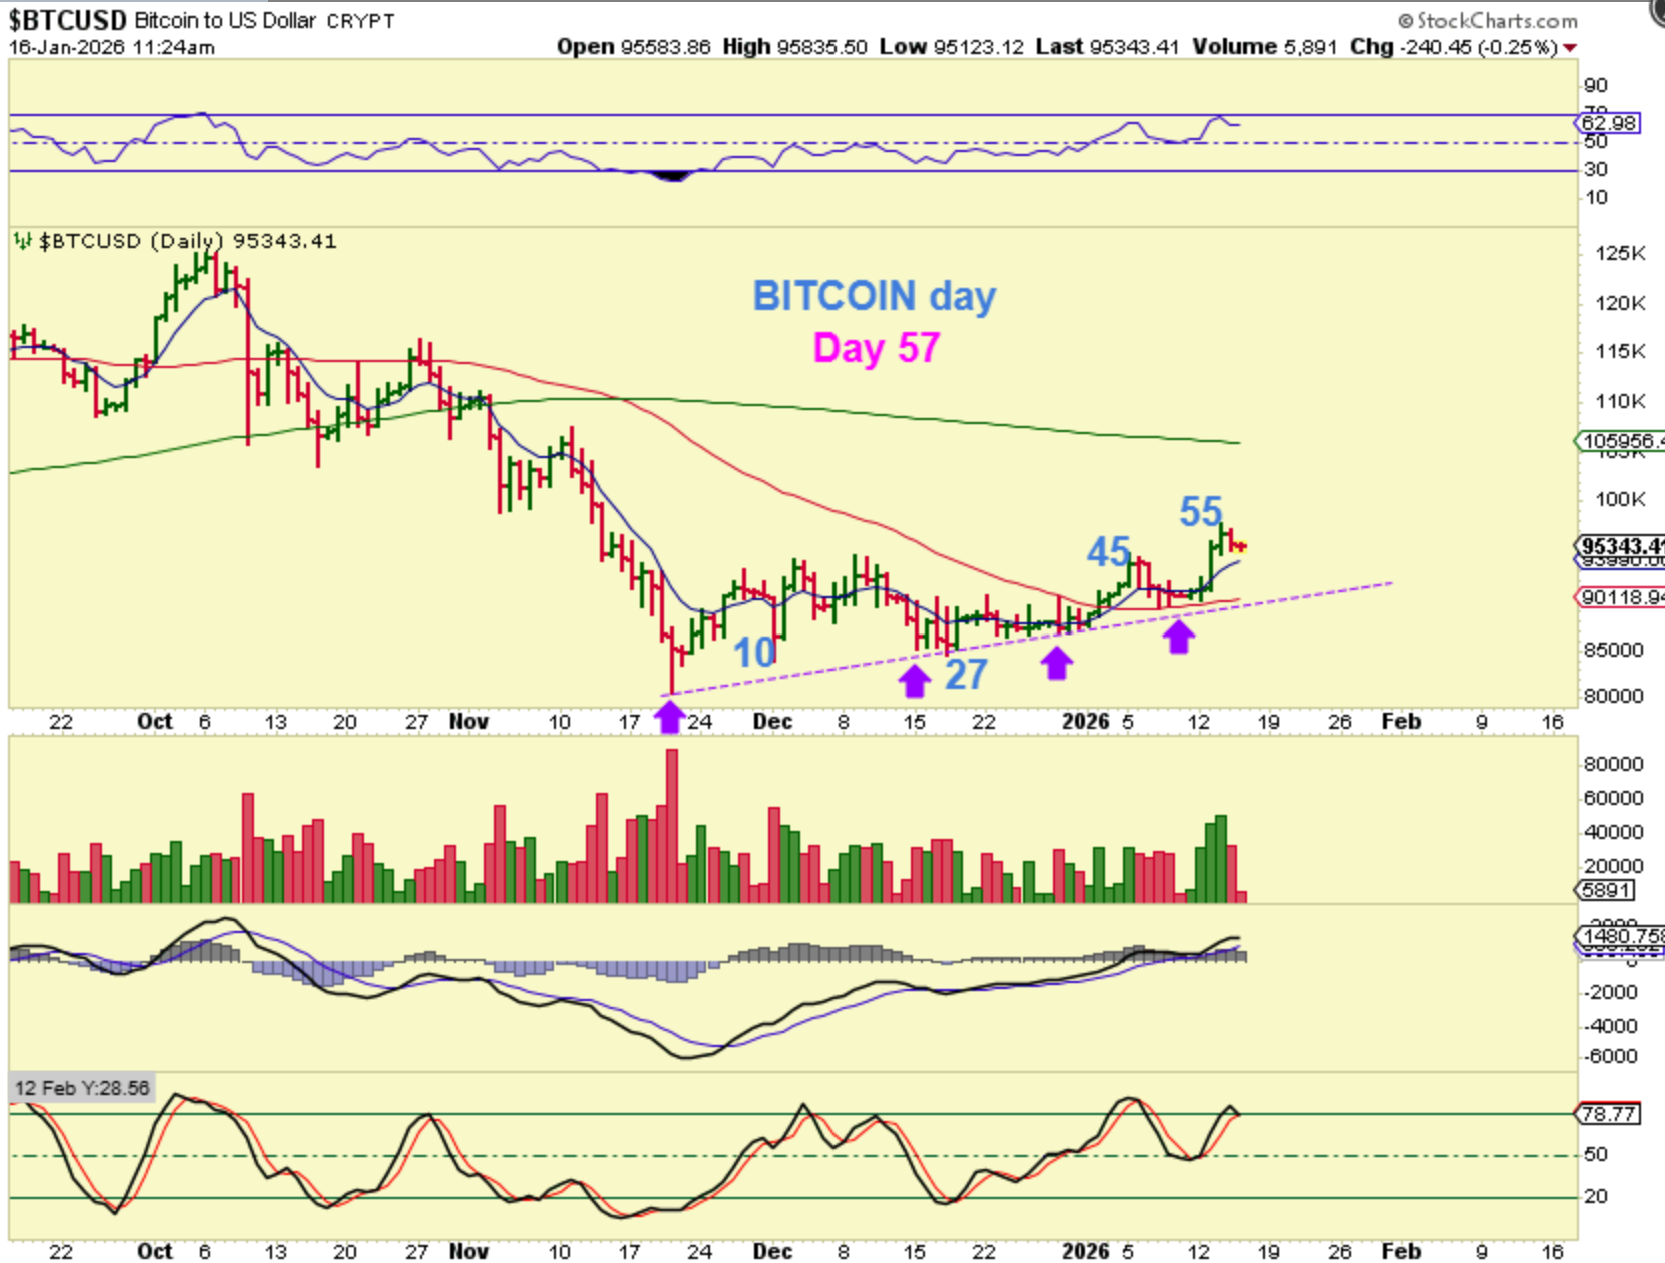
This is what I wrote on Friday: Day 57
BITCOIN – We are now 57 days out of the capitulation low and that is starting to get late. This trades over the weekend and the holiday on Monday, so you’ll want to keep that in mind is you took a short term trade in Crypto stocks or Bitcoin. I will say that this chart looks like a bullish base, but the time for a good rally seems to be quickly running out – IF that 4 year cycle plays out, and it should.
.
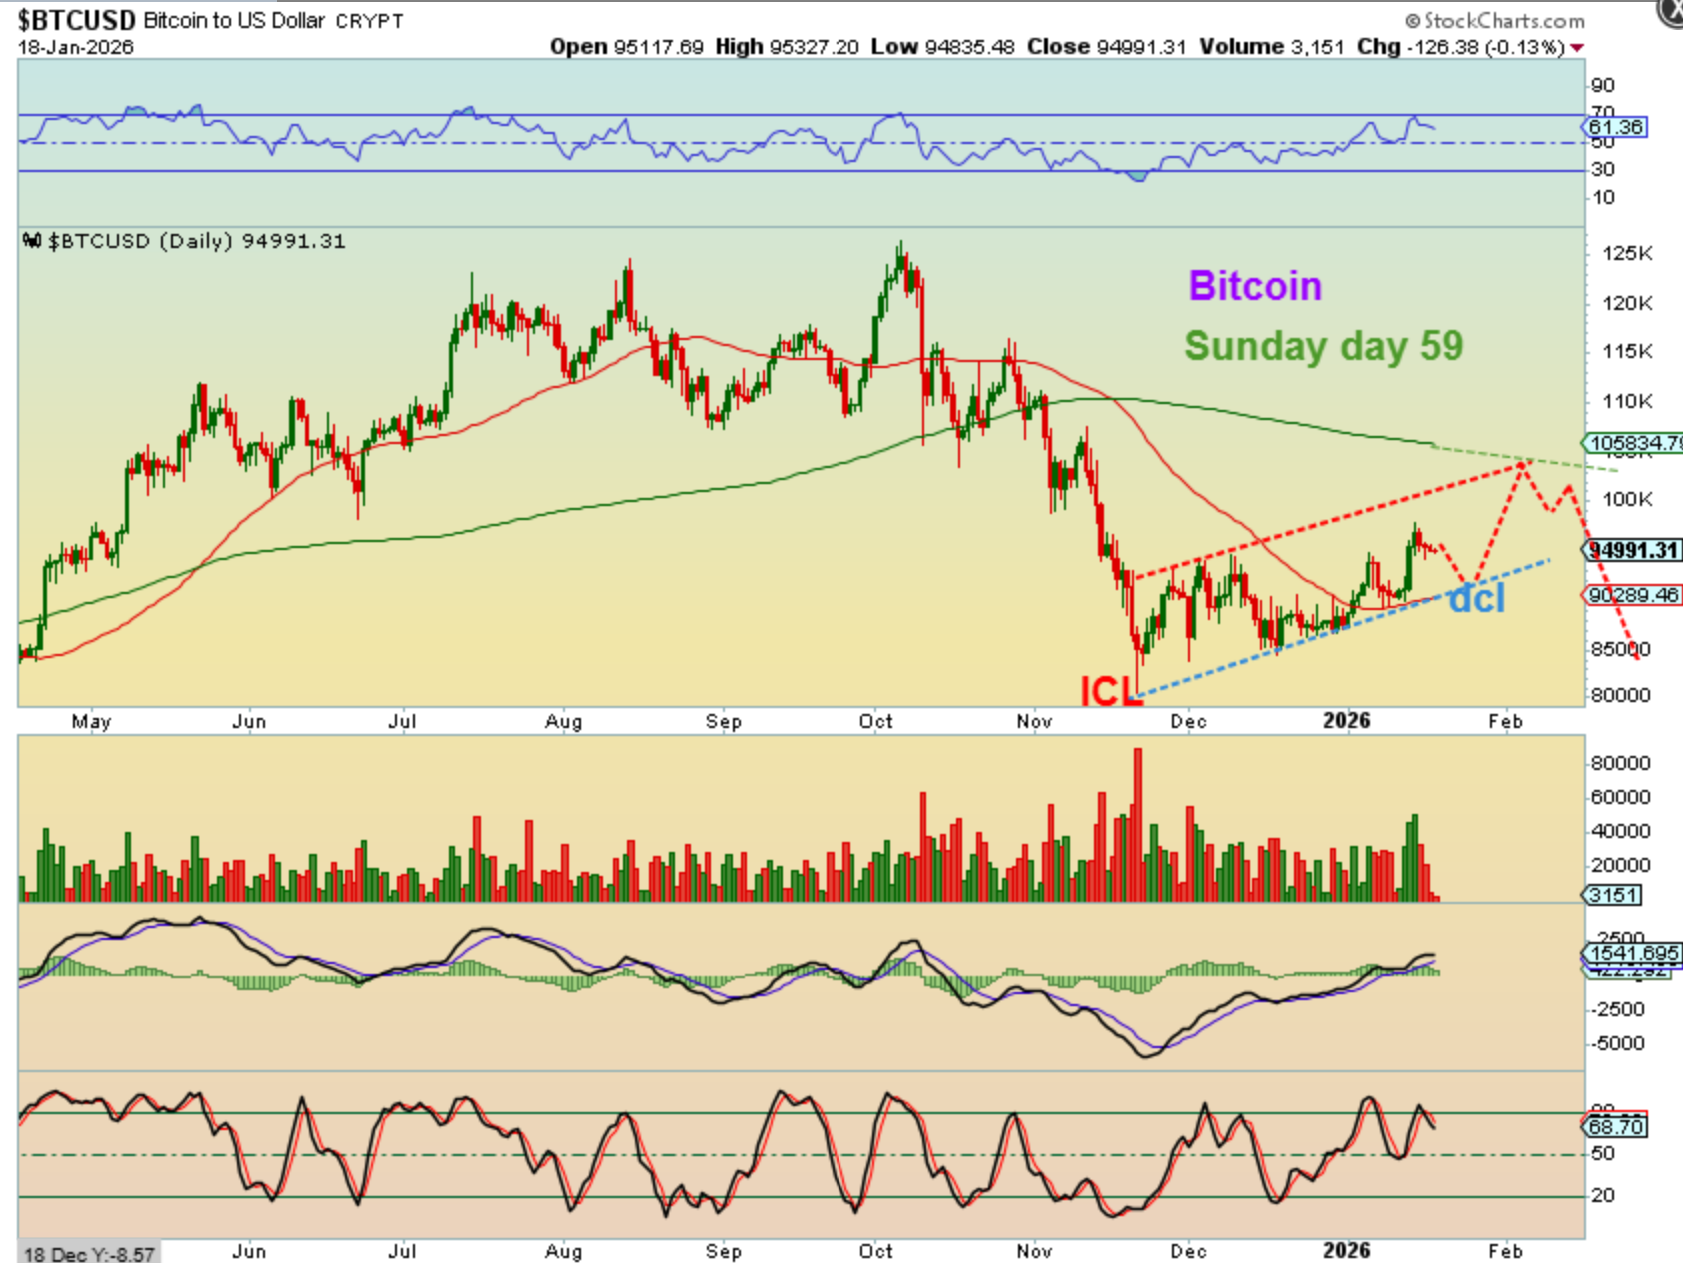
The current Daily chart for Bitcoin would have us on the 59th day out of the lows, and often we drop into a dcl around day 60. We did not make it up to the 200sma, so will then next ‘bounce’ out of a dcl get there and THEN we roll over? Maybe, and if so that may look like what I have drawn here. We know that we should be in a weaker 4th year for Bitcoin, and it should sell down into 2026 and then become a strong buy toward the end of the year. That would be a 4 yr low and the beginning of the next run. That could be an exceptional place to get into Crypto stocks, or even before that time.
.
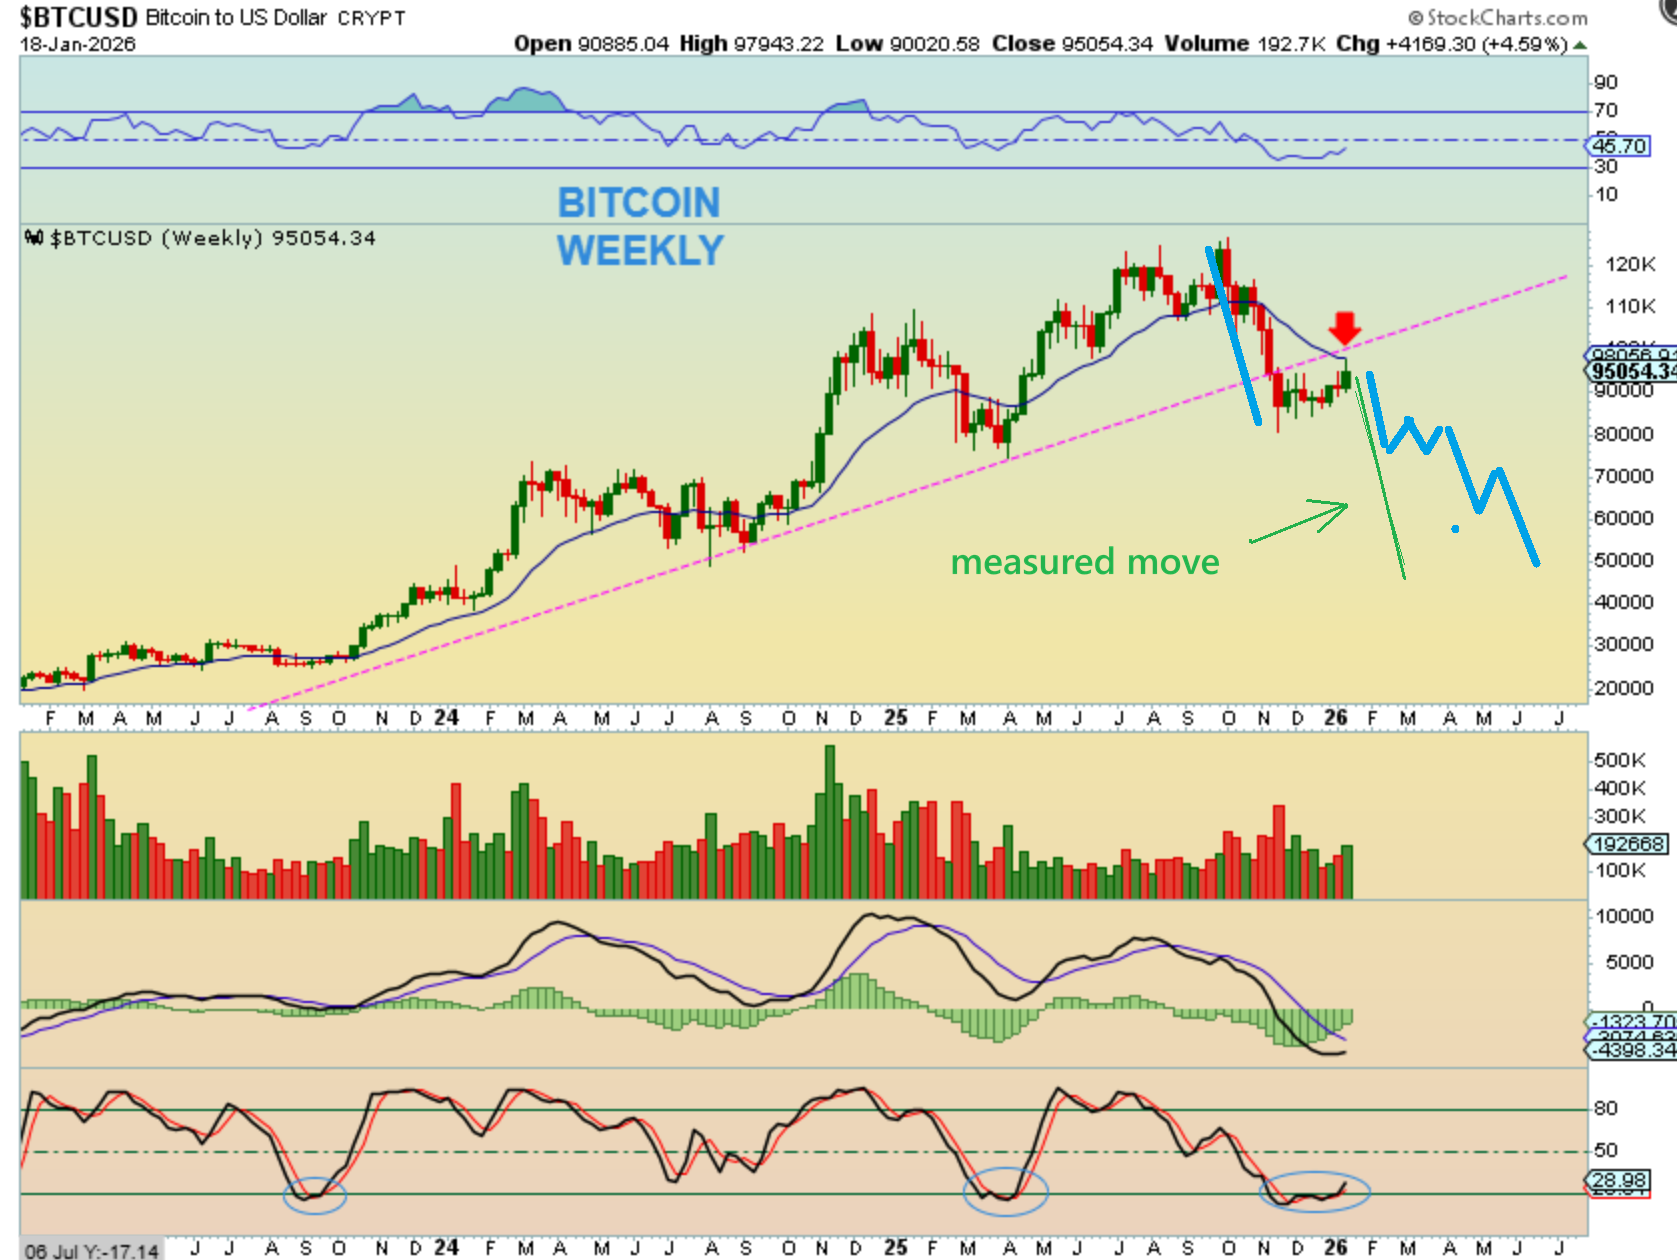
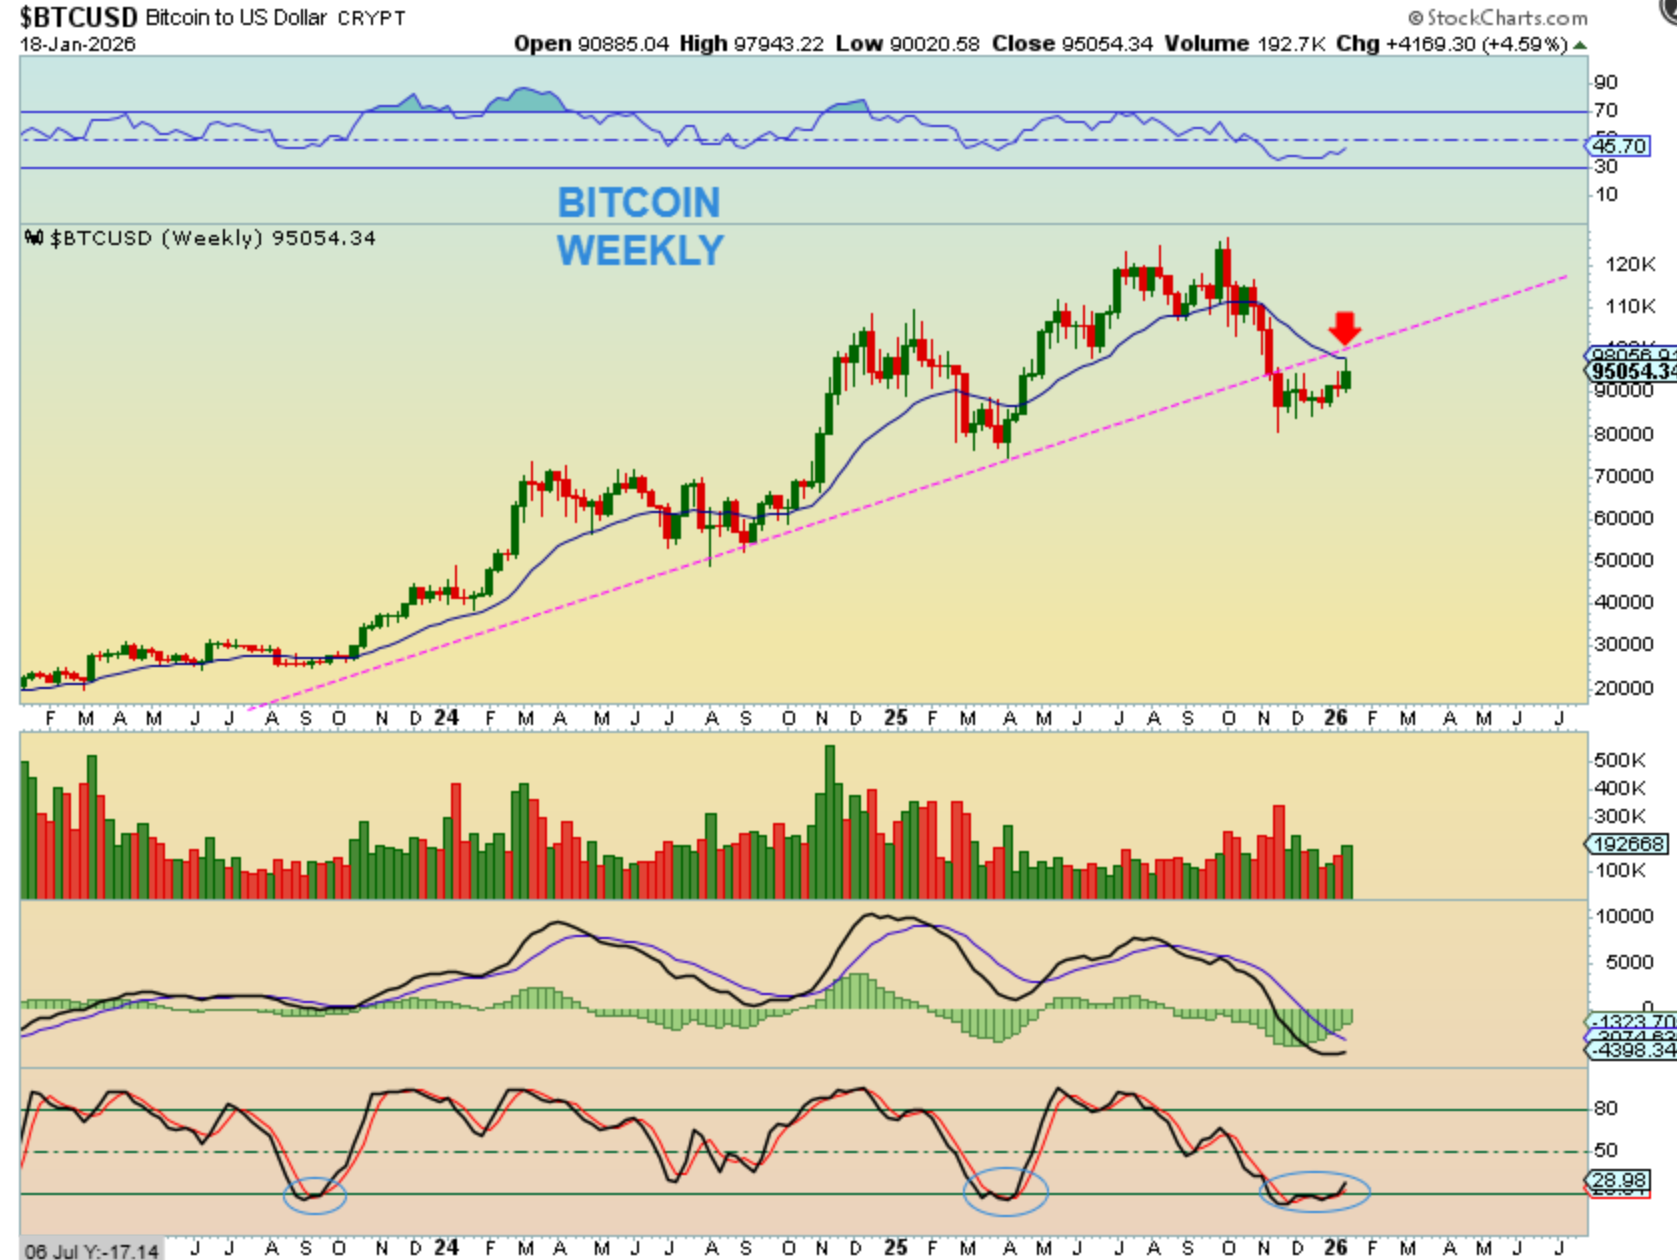
The Weekly chart for BITCOIN shows a tag of the weekly 20 ema and rejection. This chart looks like a bear flag, but it can continue as shown above and then roll over into that 4 yr low later. I will continue to cover Bitcoin in 2026, so that we can prepare to invest in Crypto as the lows approach (or if anything changes along the way).
.
The Weekly chart for BITCOIN:
If I do a measured move for Bitcoin, we may only drop to the $50,000 area (Note: Bitcoin often exceeds the measured moves though). I wanted to show this just in case, due to possible Government buying or intervention, and then we could possibly see a slight change this year in how deeply Bitcoin sells off into a 4 yr low. Also, how quickly those lows may come into play if there is intervention is a thought that I’ve had, so I just want to monitor and be prepared for whatever comes our way. Past 4 yr sell offs often bottomed near October/ November.