Friday January 16th
Today is Friday, the last trading day of the week and just as a reminder, the U.S. Markets are closed on Monday.
.
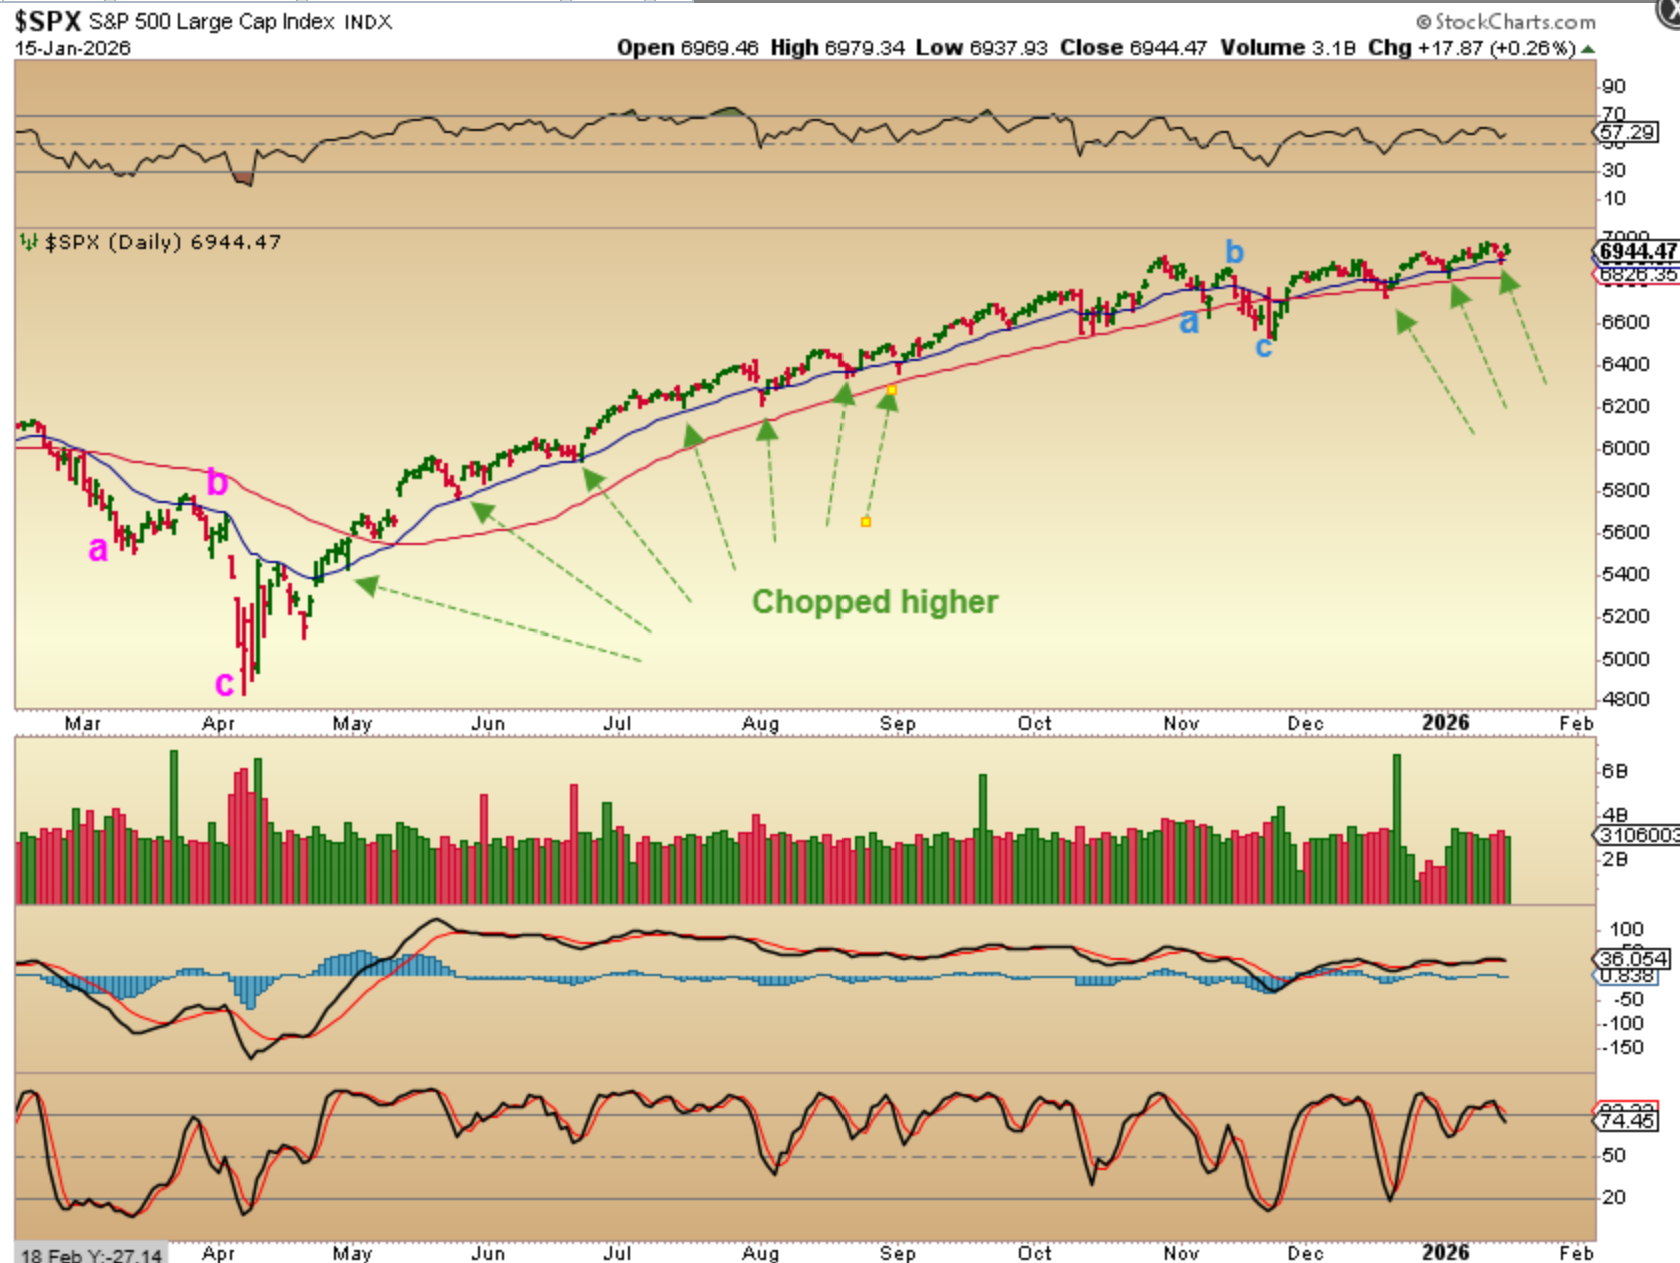
SPX – This chart is just a reminder that while the markets can chop higher at times like they are now, last year when they chopped higher our stocks on our watchlists doubled and tripled over time.
.
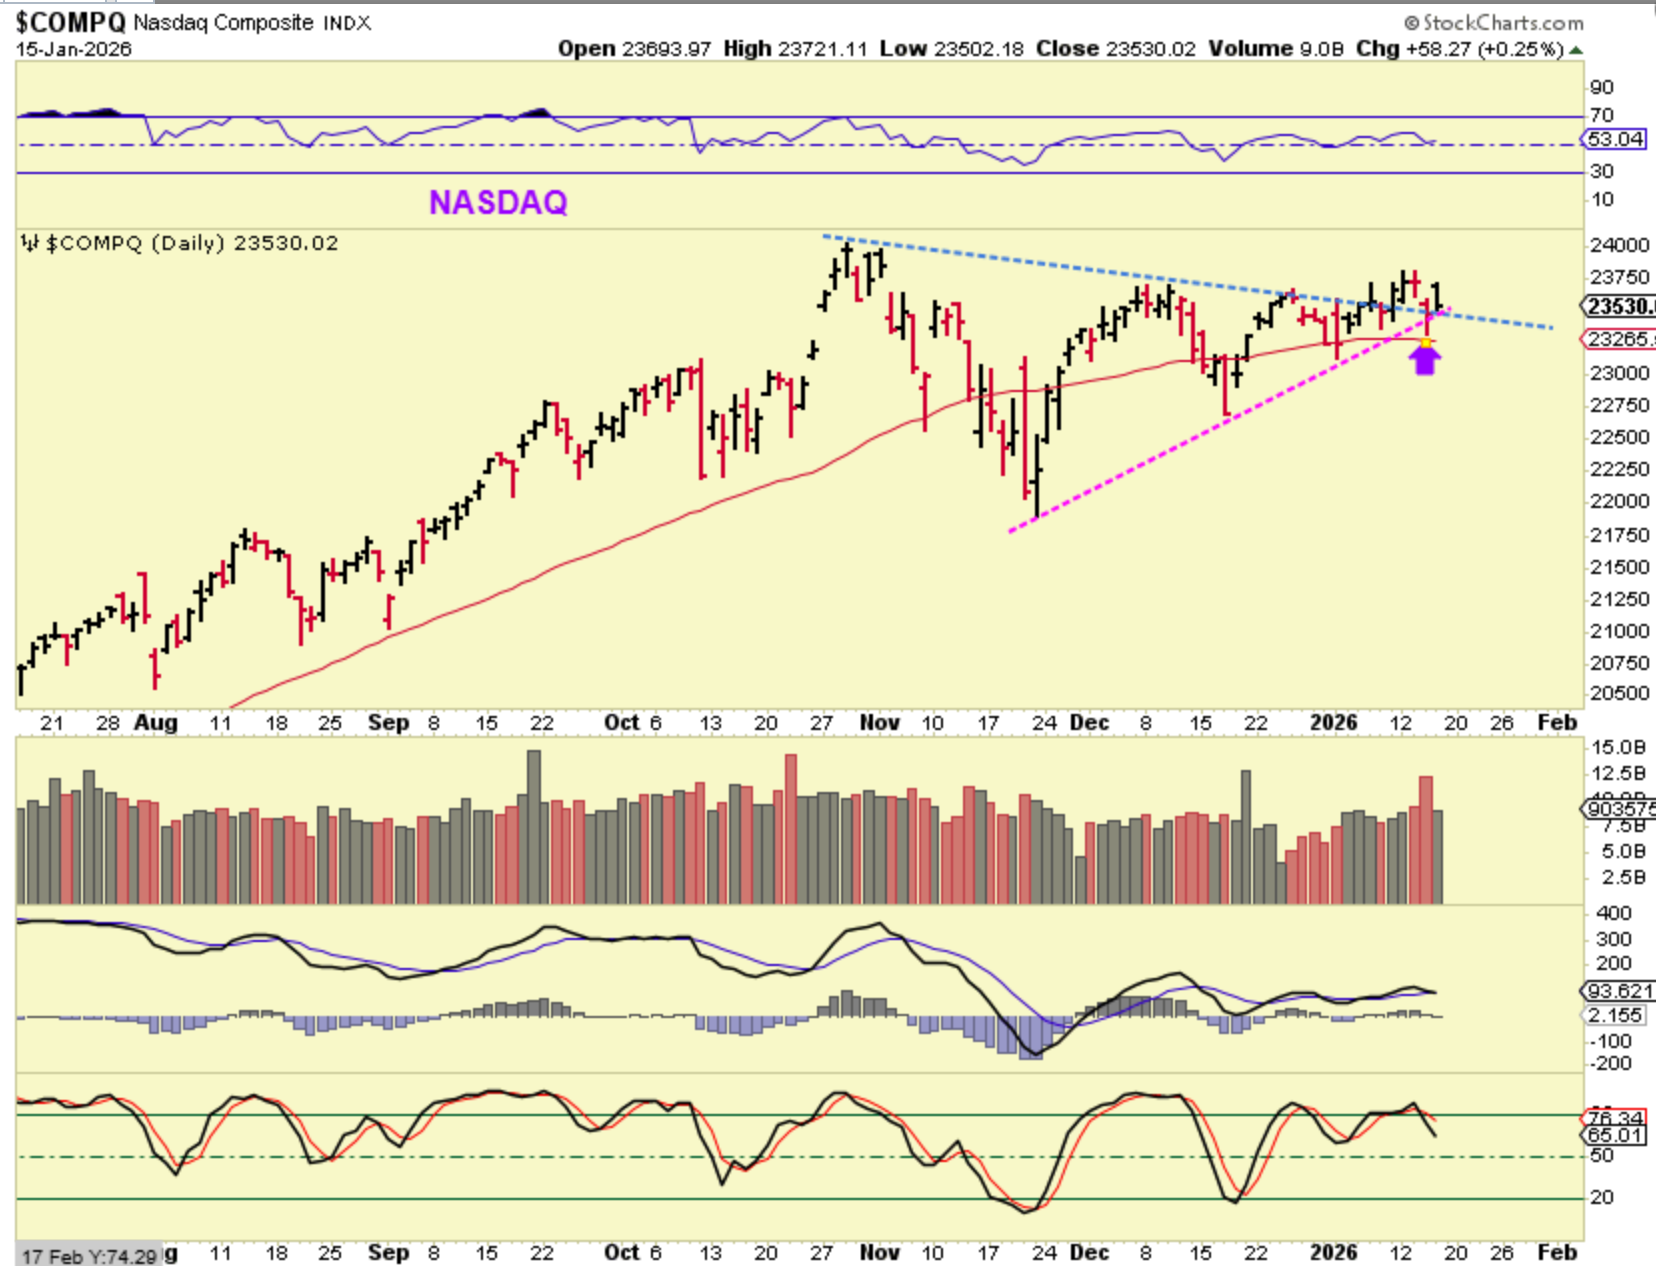
The NASDAQ broke out this week and then sold off on Wednesday down to the 50sma. On Thursday it gapped up quite a bit and recovered that breakout. It then sold down into the end of the day, but was still up $58 and held that triangle trendline. For this reason, I’d LOVE to see the Nasdaq move higher on Friday.
.
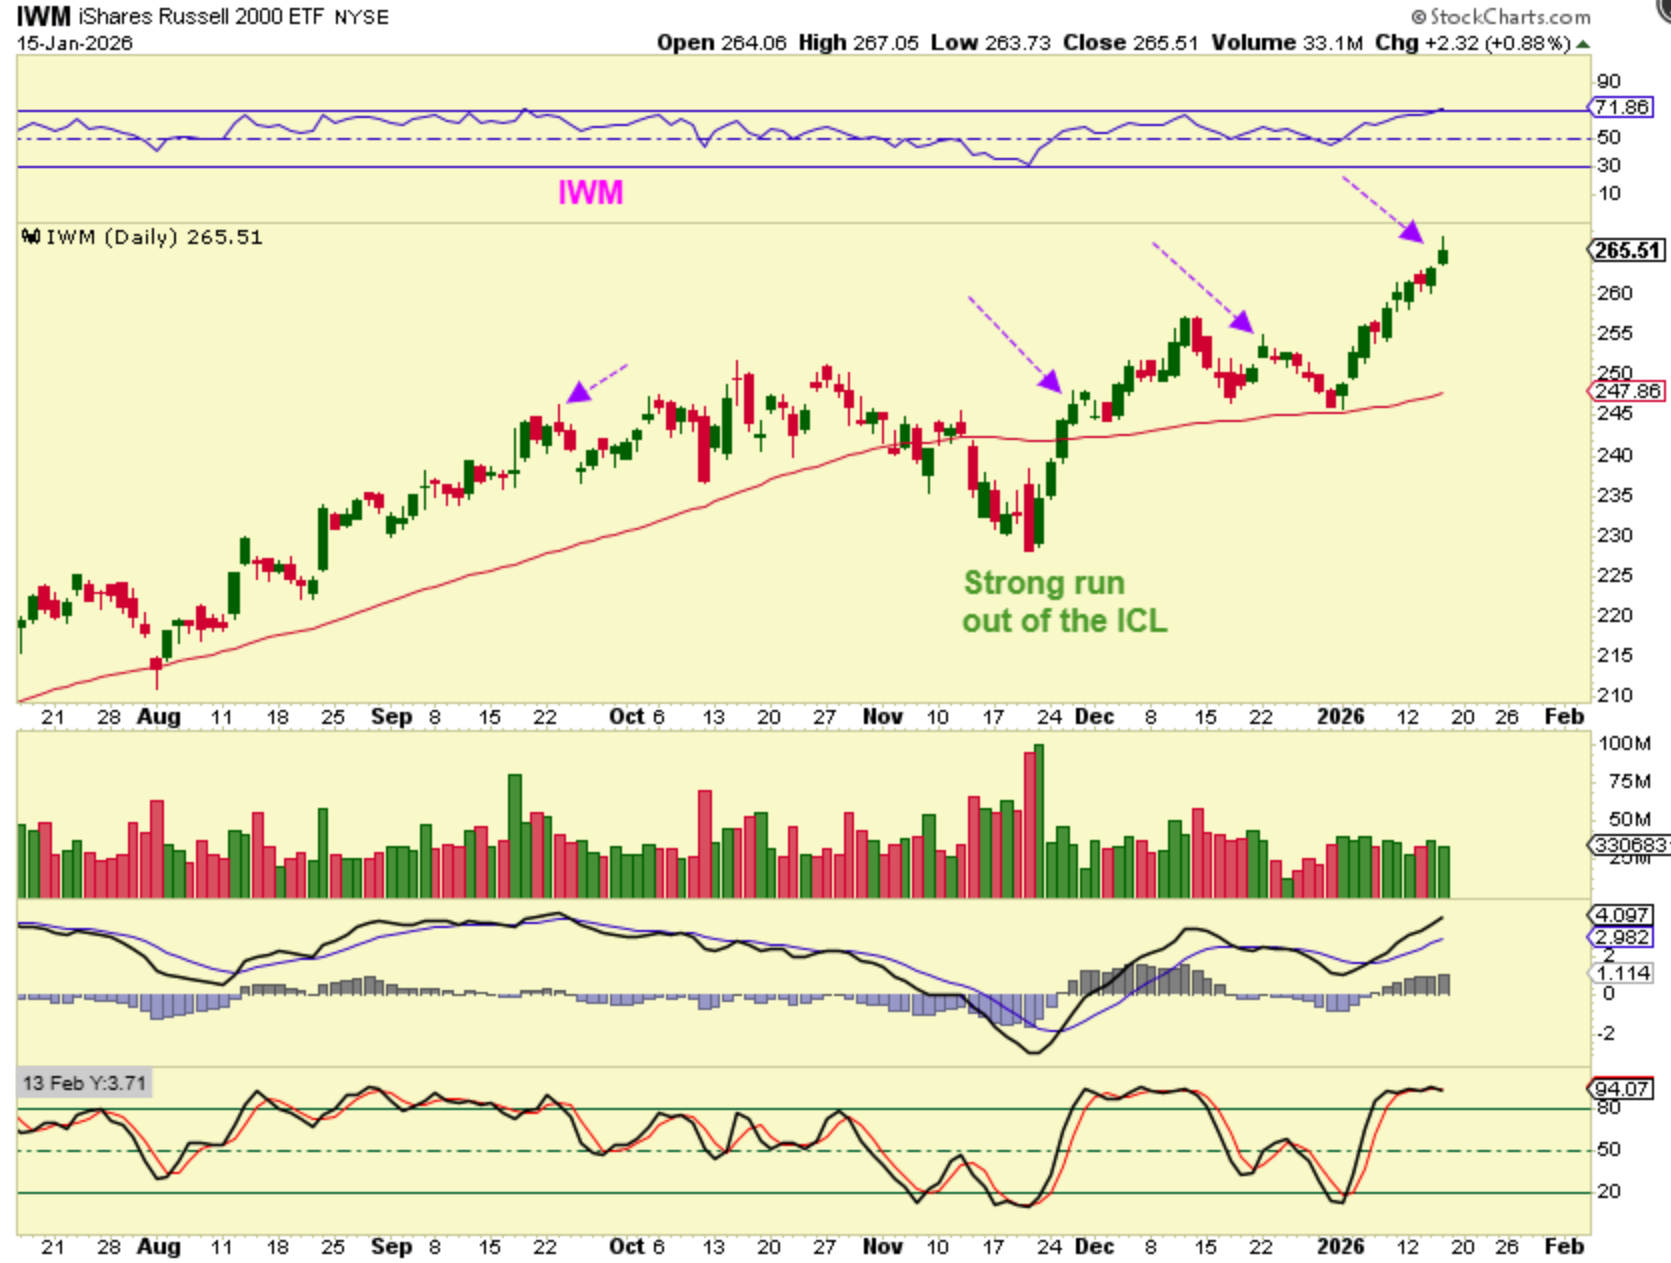
And The IWM has rallied strongly, but it also sold down at the end of the day. That is usually a reversal at the top, but lately our Bull markets are just choppy and some have given us only 1 or 2 days lower. THAT SAID, If that tag of the 200sma was not a dcl, then this may also be day 37 and a dcl would come due at any time.
.
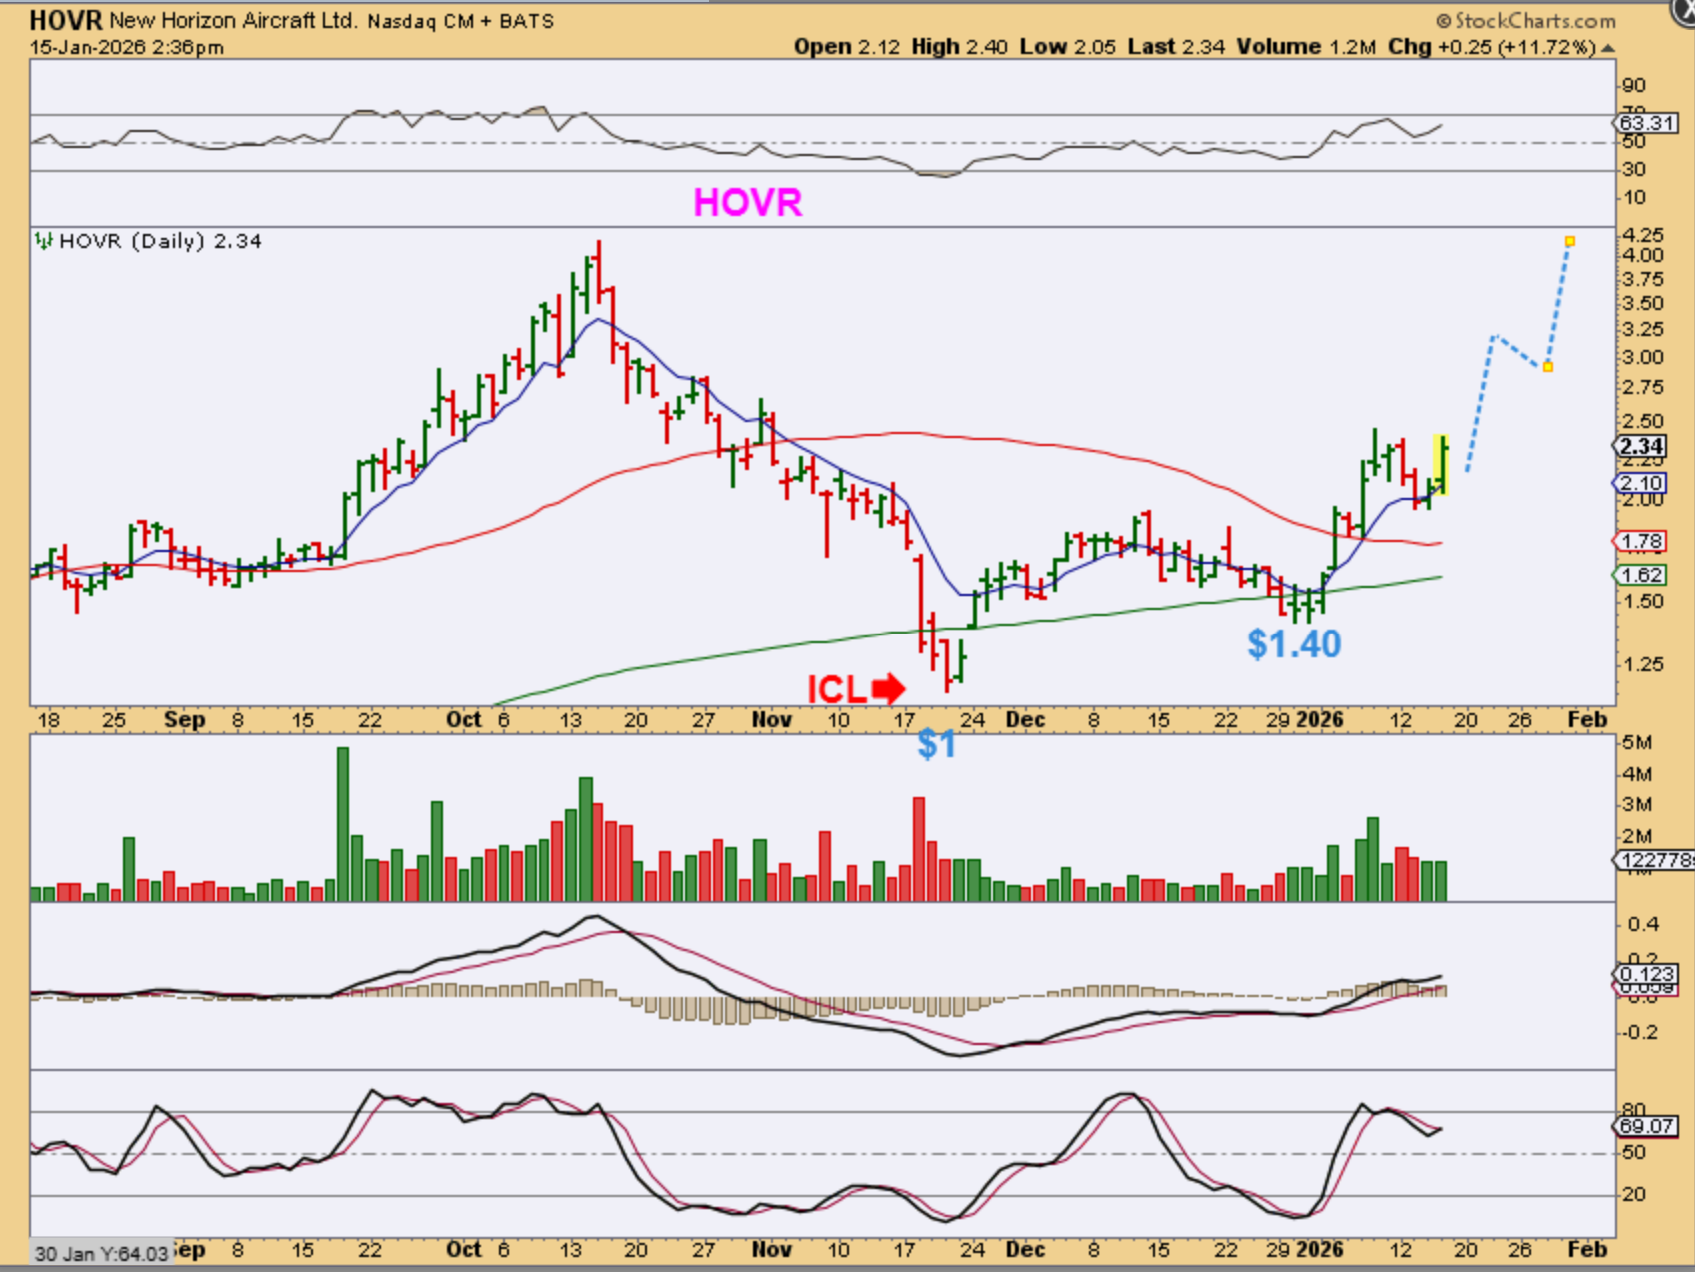
HOVR dropped to the 20ema and rallied nicely, up almost 12% by the final hour. HOVR remained strong and closed up 11% and this looks like it wants to form a large cup and run back to the highs.
.
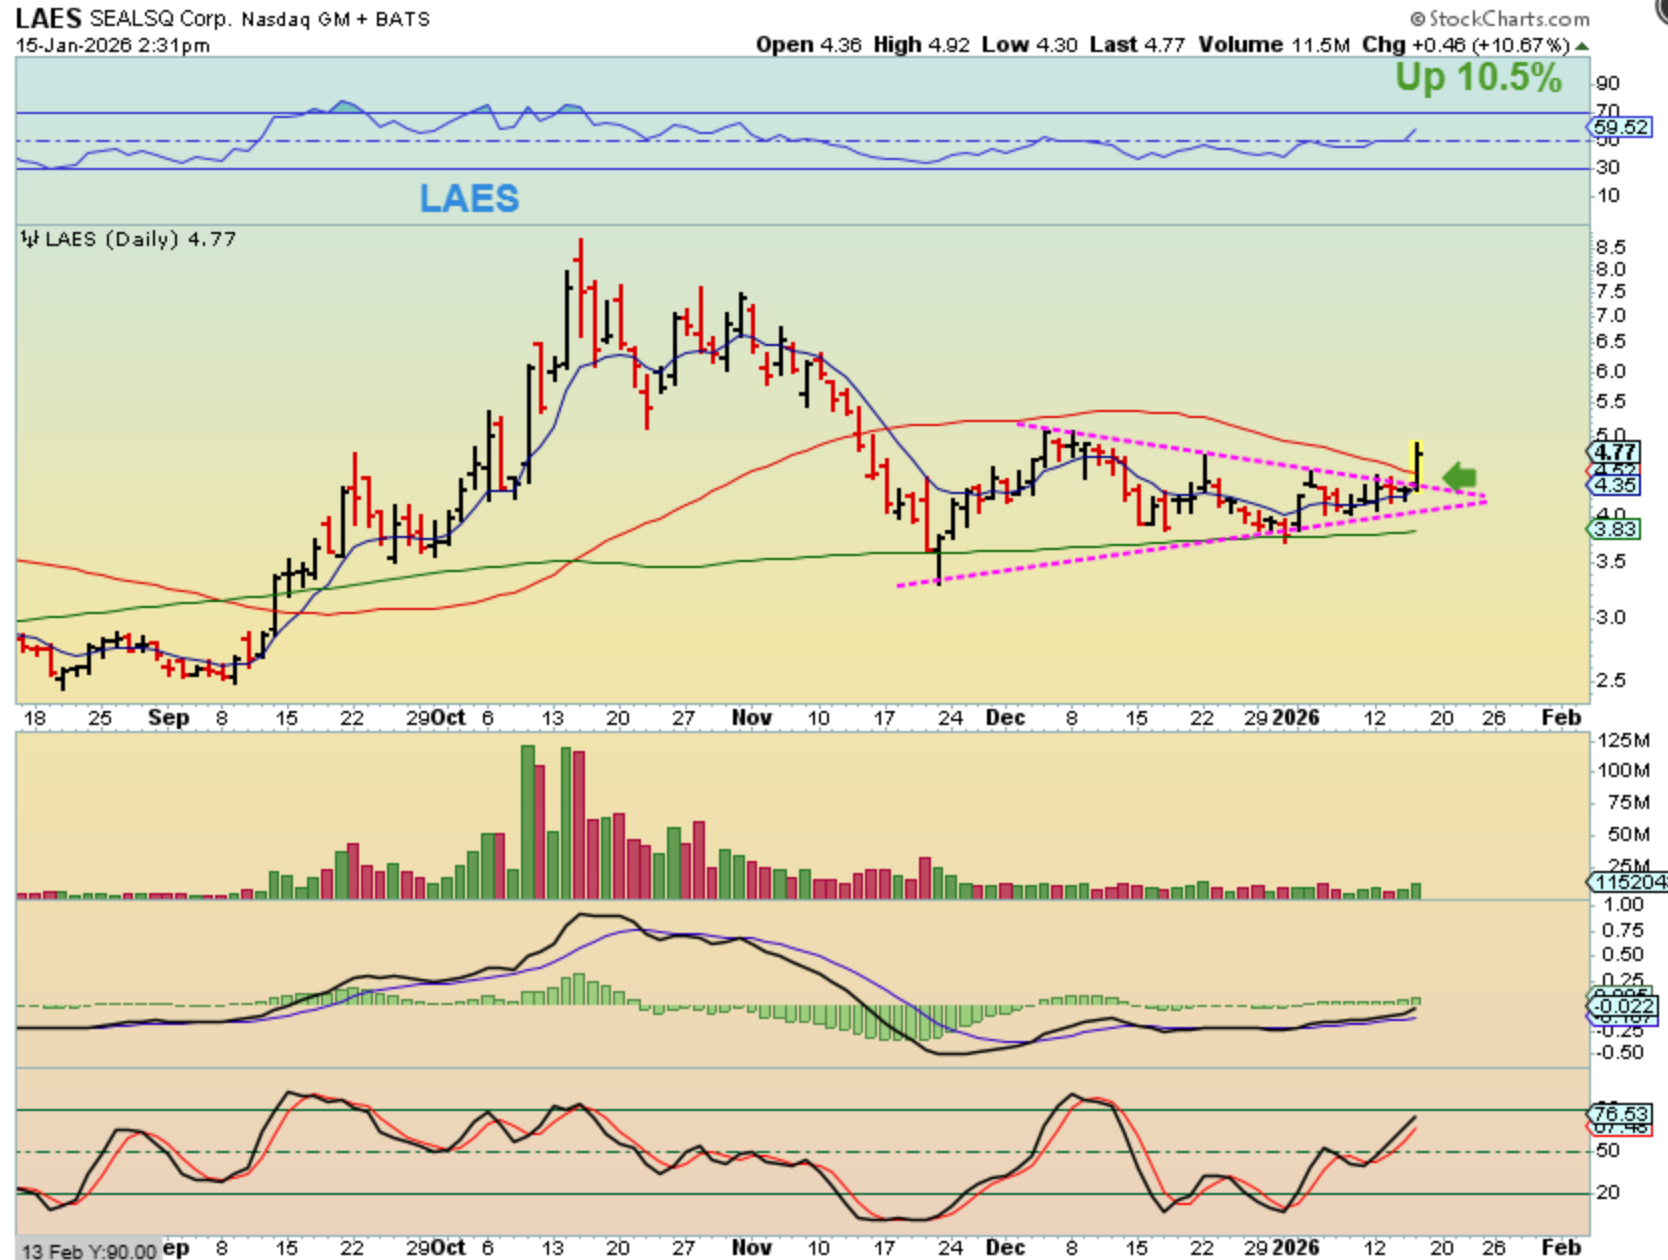
LAES broke out so I grabbed this chart at 2:31 p.m. et. It slowly sold off into the end of the day, but it still closed up over 7% at $4.65, so this might make a nice buy in this area.
.
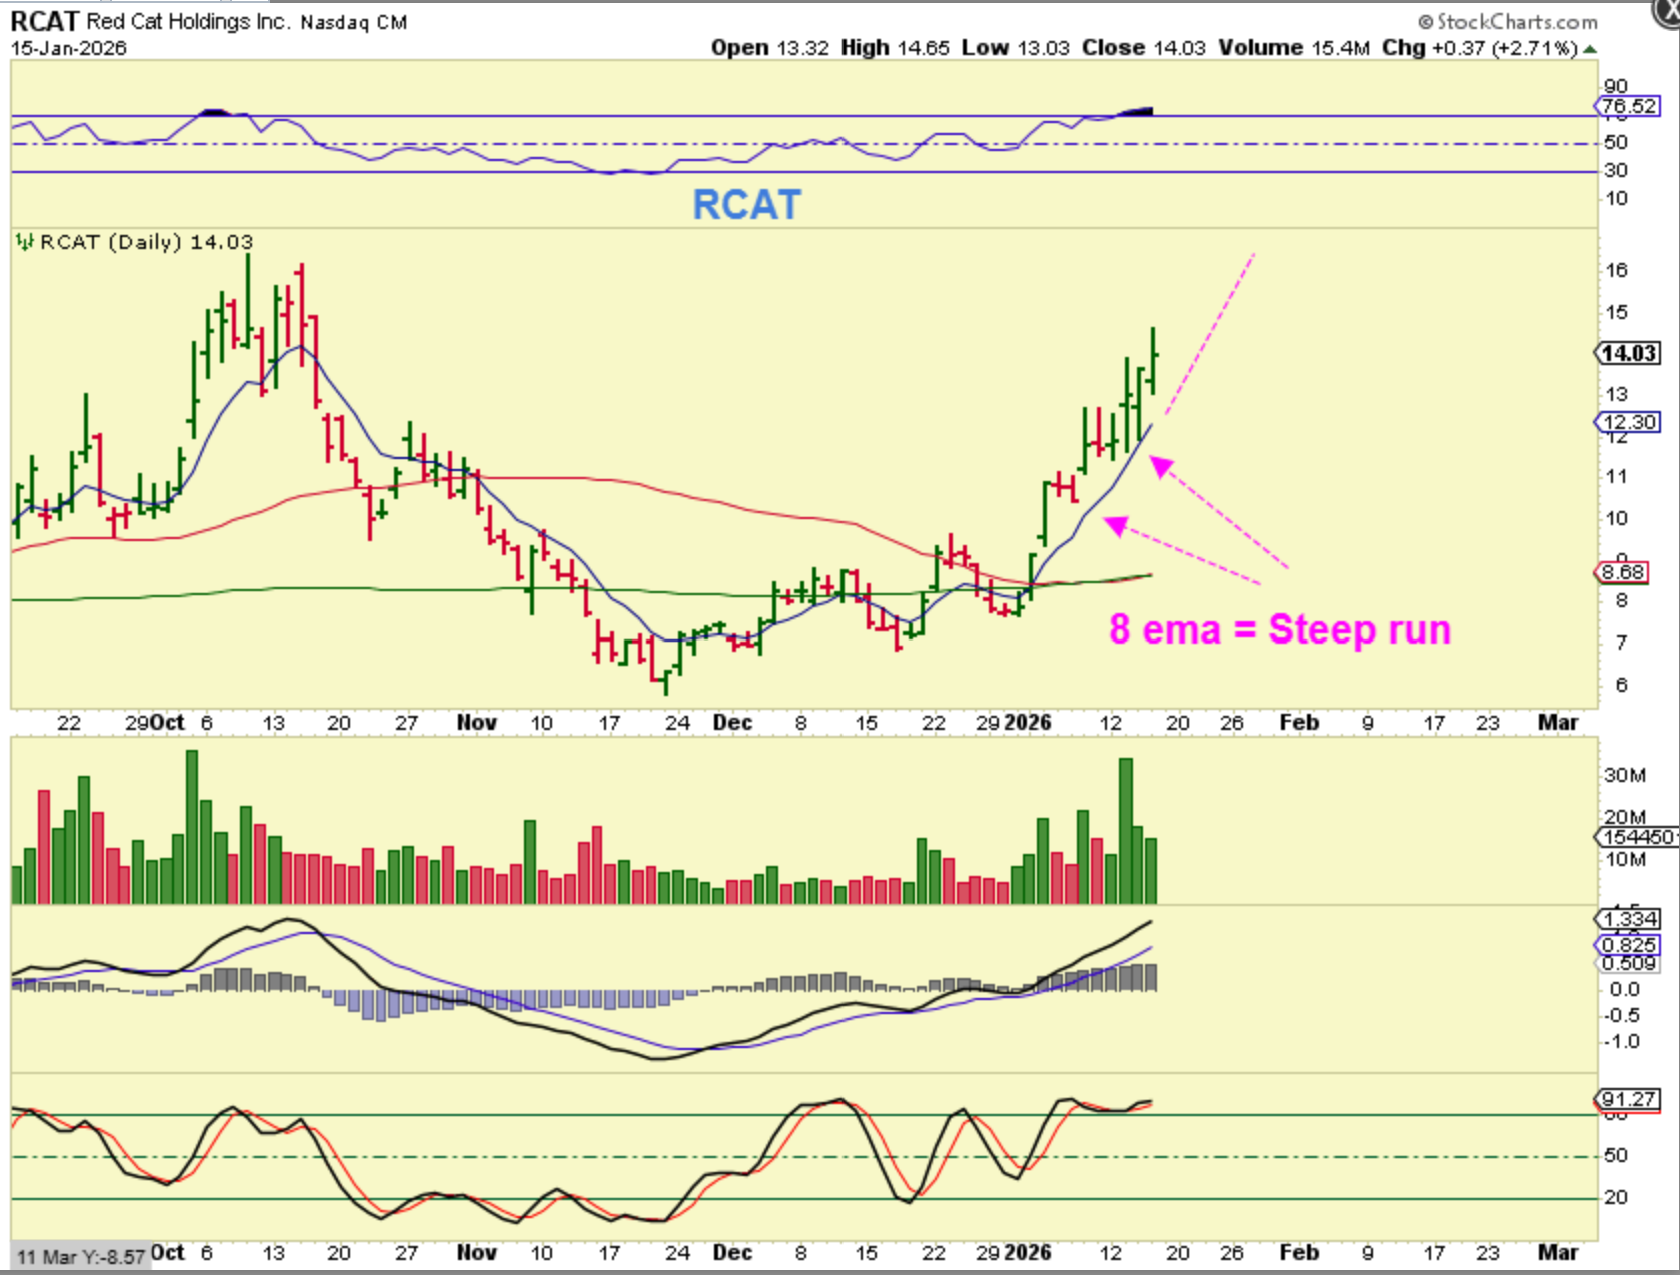
RCAT has been closing higher each day, even though it has a tendency to drop in the morning. I have this as a Drone Stock and had it in the reports. I Own this as buy and hold and wanted to show you something. I just noticed…
.
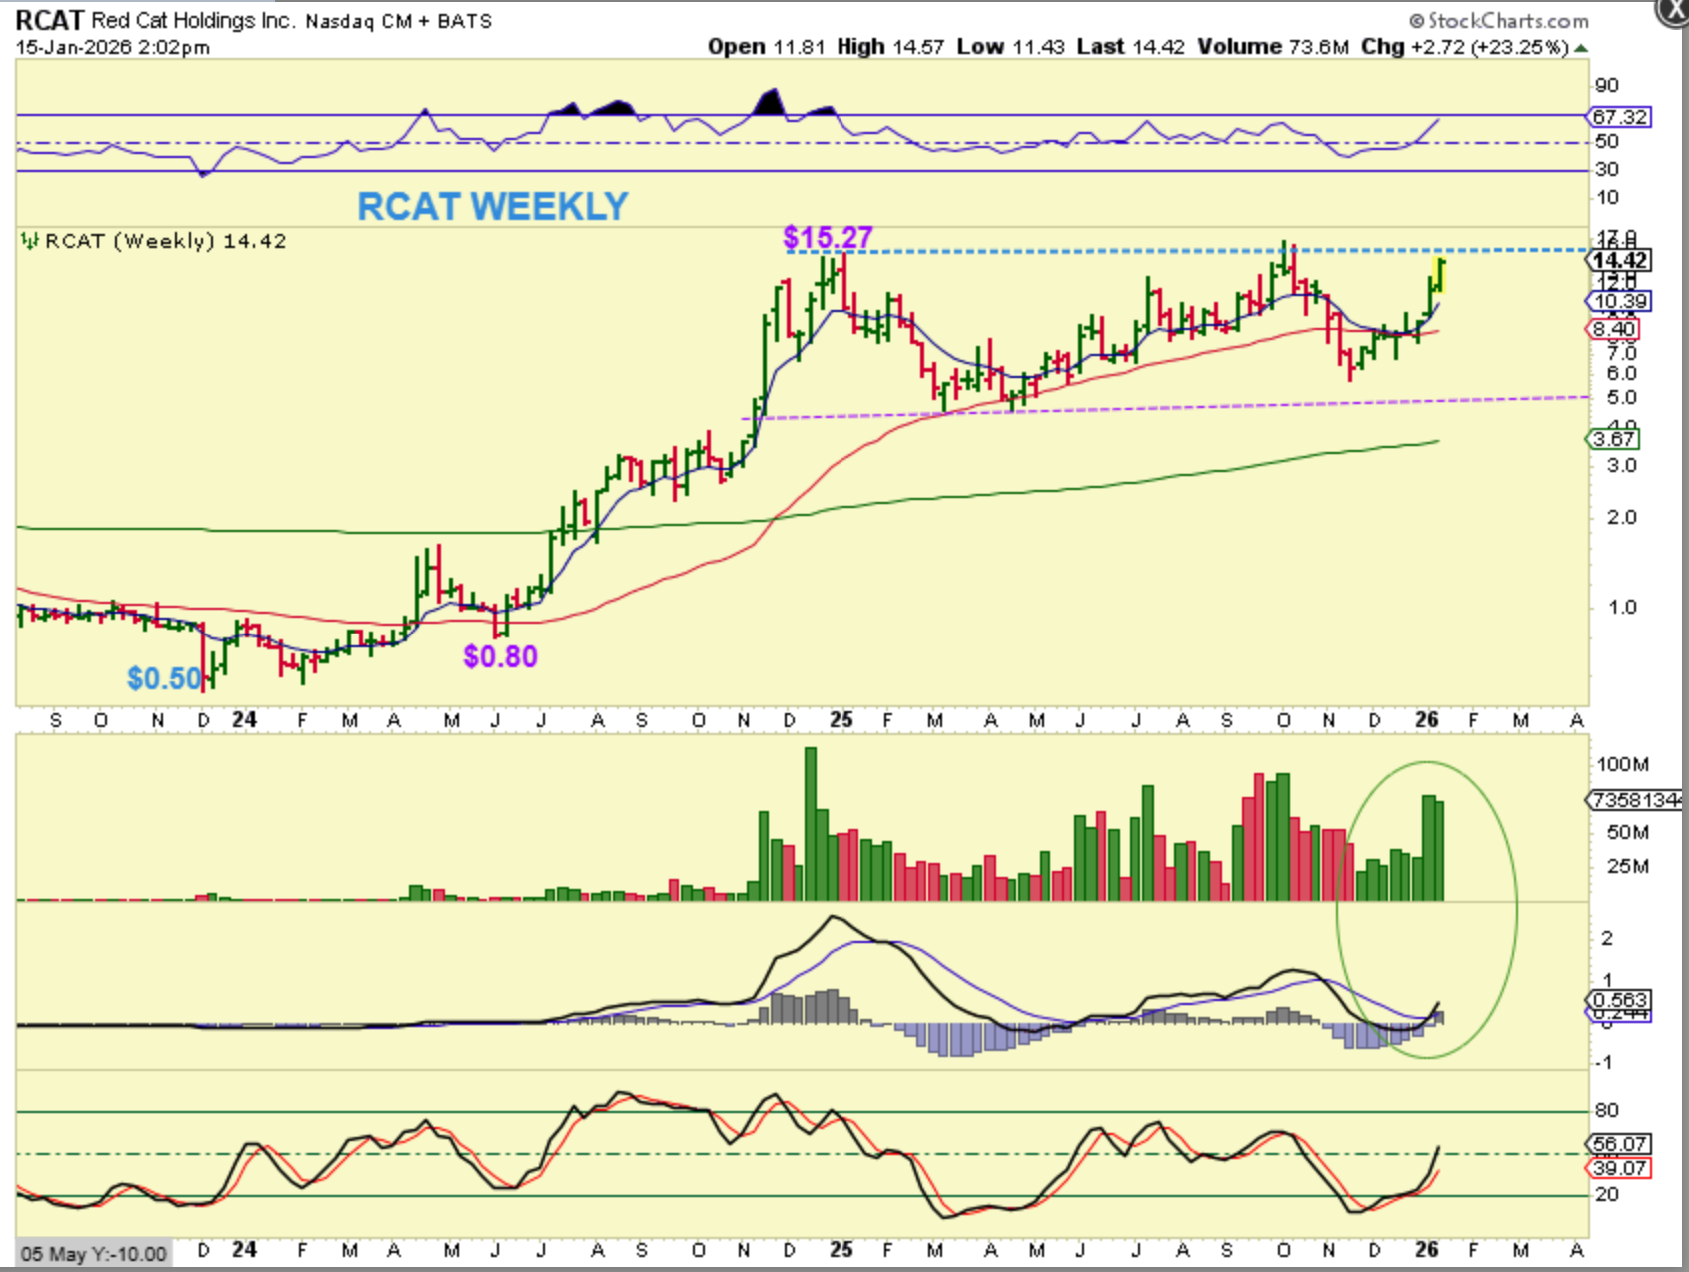
RCAT WEEKLY:
I just noticed that the weekly chart has this running up out of that Nov Icl toward all-time highs. Volume has been swelling and this looks ready to breakout. The last time it was here was in October and that was at the end of an Intermediate Cycle. Now it is coming out of an ICL, with more strength.
..
2 days ago I mentioned this:
UMAC, RCAT, ONDS are drone stocks that I like and mentioned. I pointed this out at the 20ema in yesterdays report, and here it was up 5%, but it closed up 10%.
.
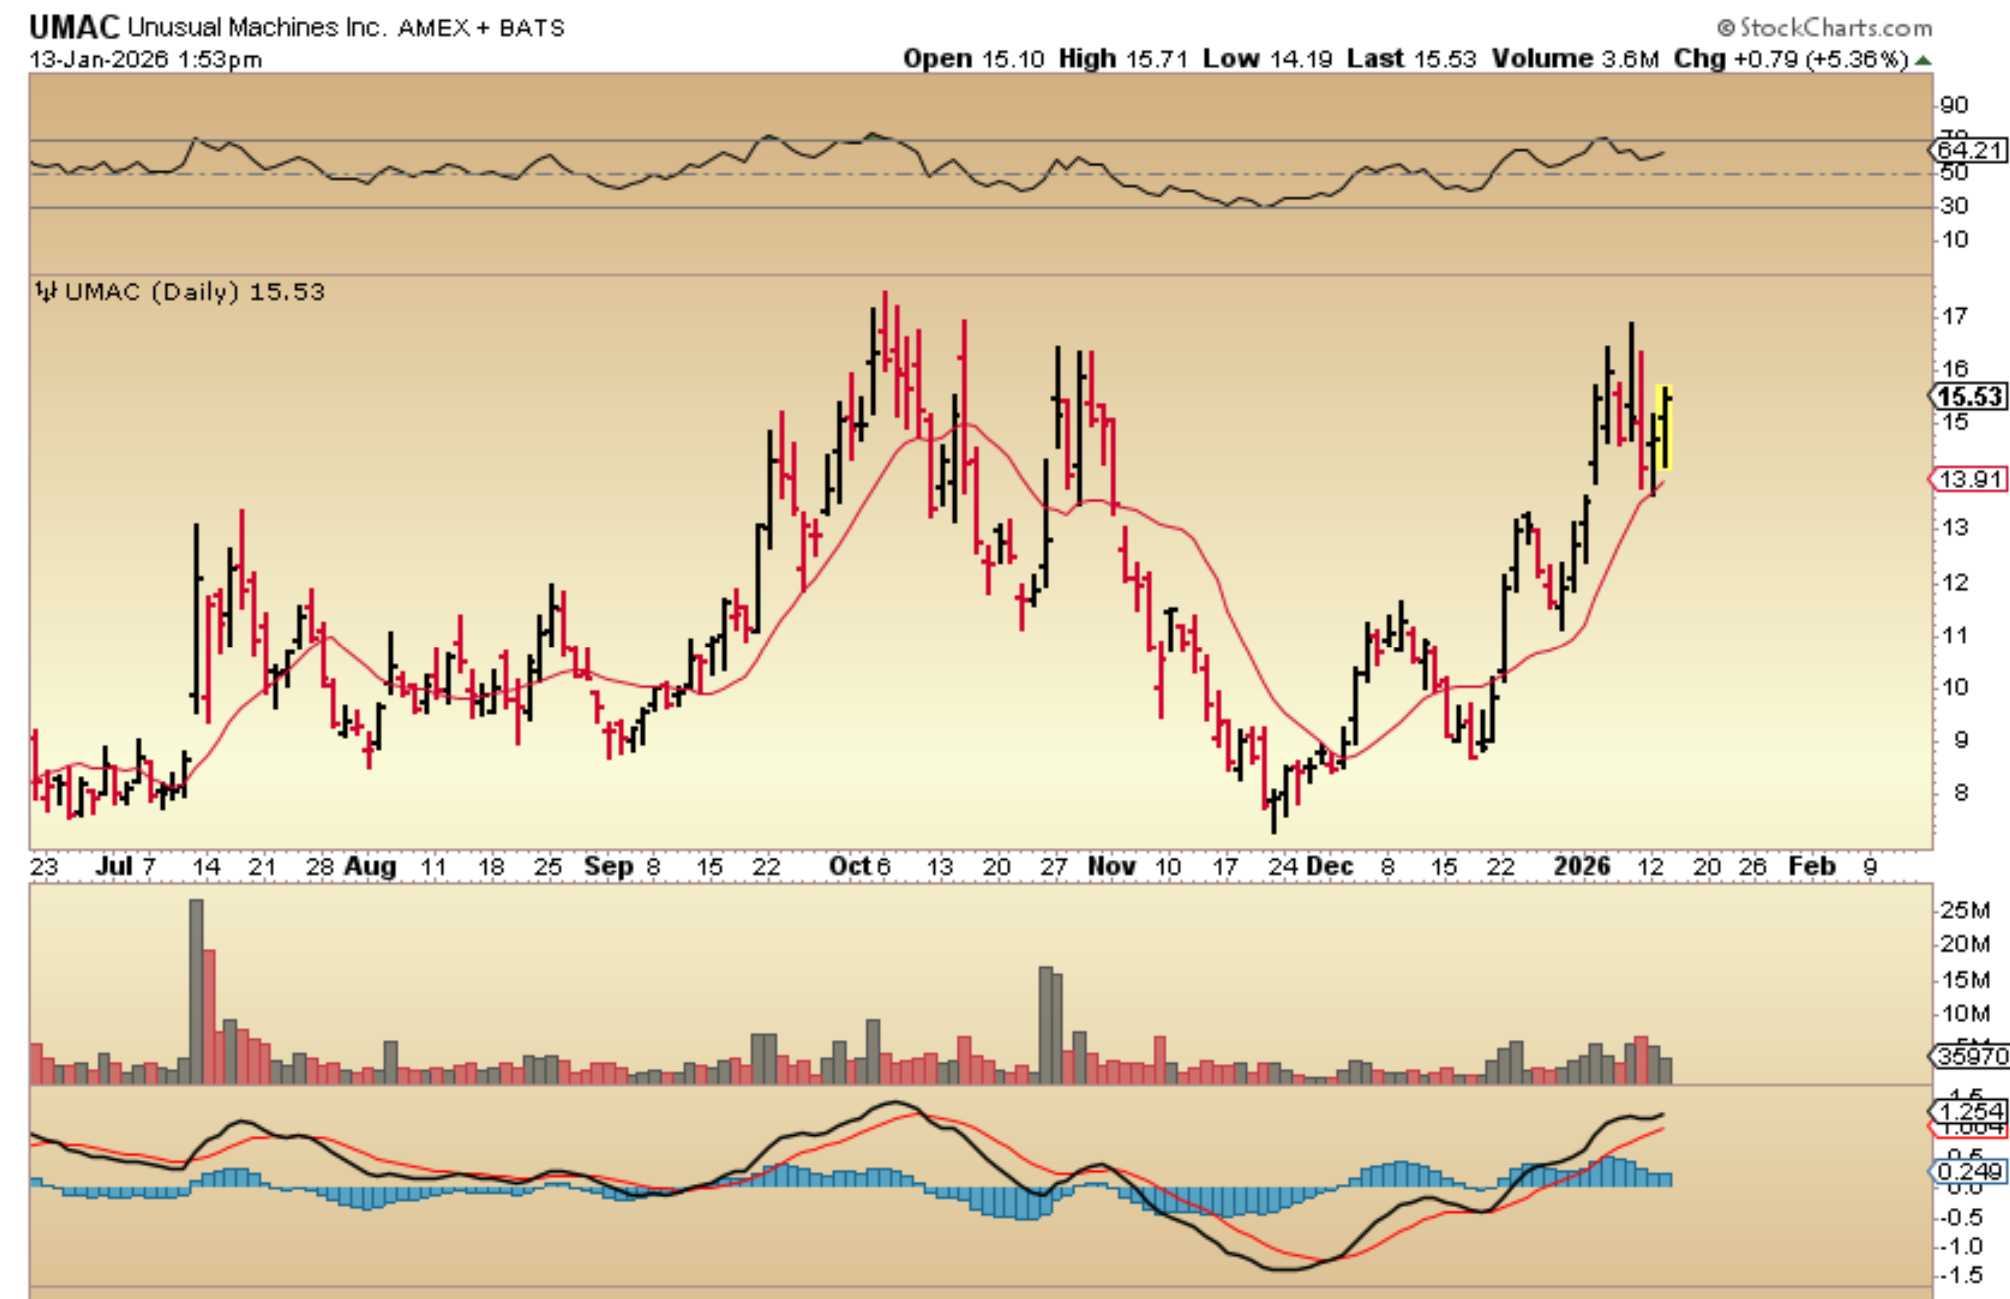
UMAC surged that day and then it dropped and rallied again on Thursday. This is another one that sells off on me each morning, and then rallies back, so if you see it dip toward the 20ema, that’s a buy. Here UMAC closed up 5%, but was up another 3% in after hrs…
.
UMAC closed up 5%, but was up another 3% in after hrs when they released this news. They have also had other releases showing growth potential and customer needs (future orders).

.
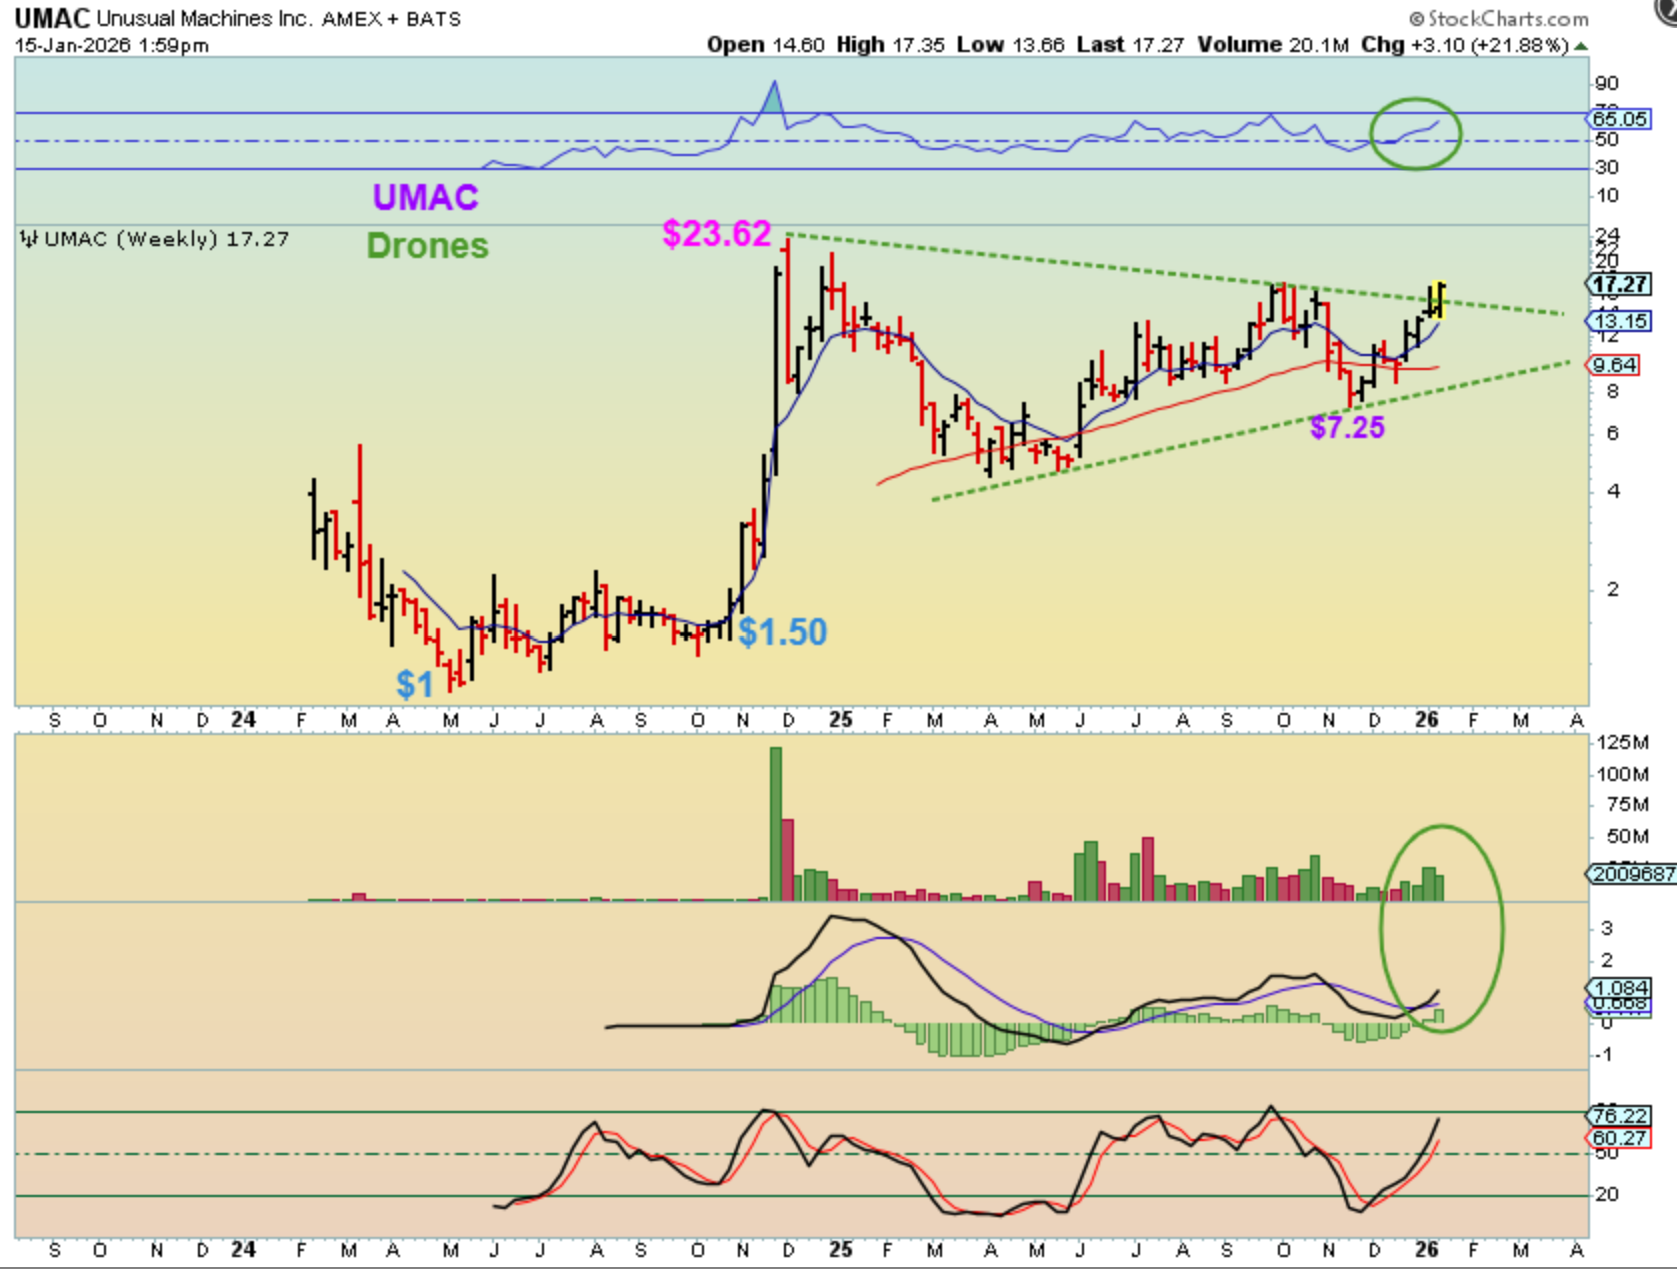
So I took a look at UMAC on a weekly chart too:
THE UMAC WEEKLY is breaking out of a long pattern too. So when you look at this, in 2023 UMAC ran from $1 to $23, and after the recent ICL dip, it was at $7 and now it’s at $17, so the potential is there. Scroll up again and you’ll see that it can be quite choppy on a daily chart, but over time it is a solid climb.
.
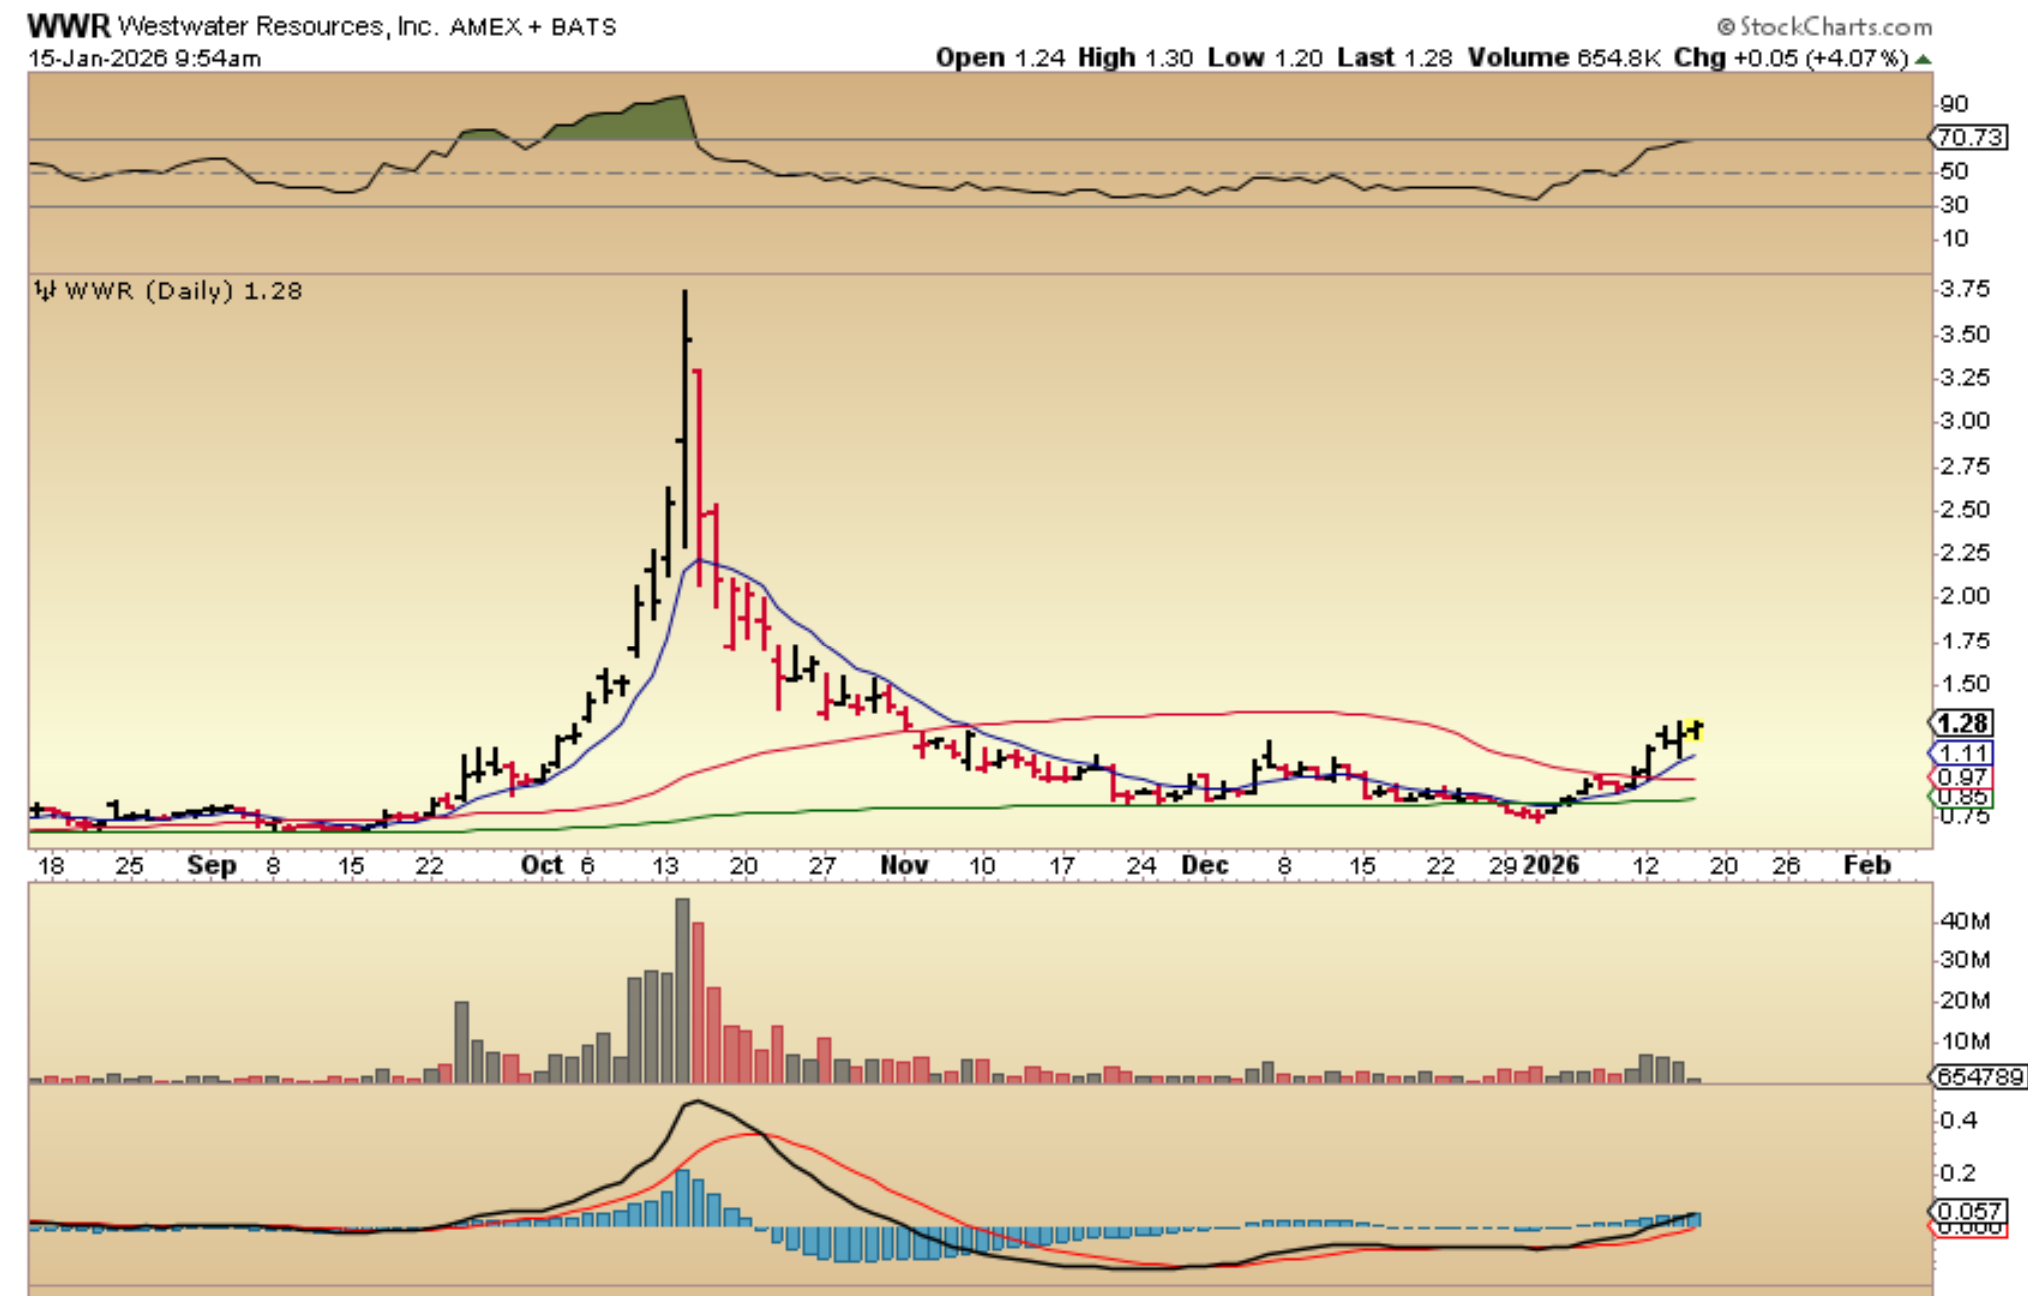
WWR – Take a look at that September – October run! It dropped and formed a decent base, and now it looks like it is running again. It crawled under the red 50sma and then broke out. That tag was a back-test of the 8 ema. That is what it climbed last time, so this is a buy.
.
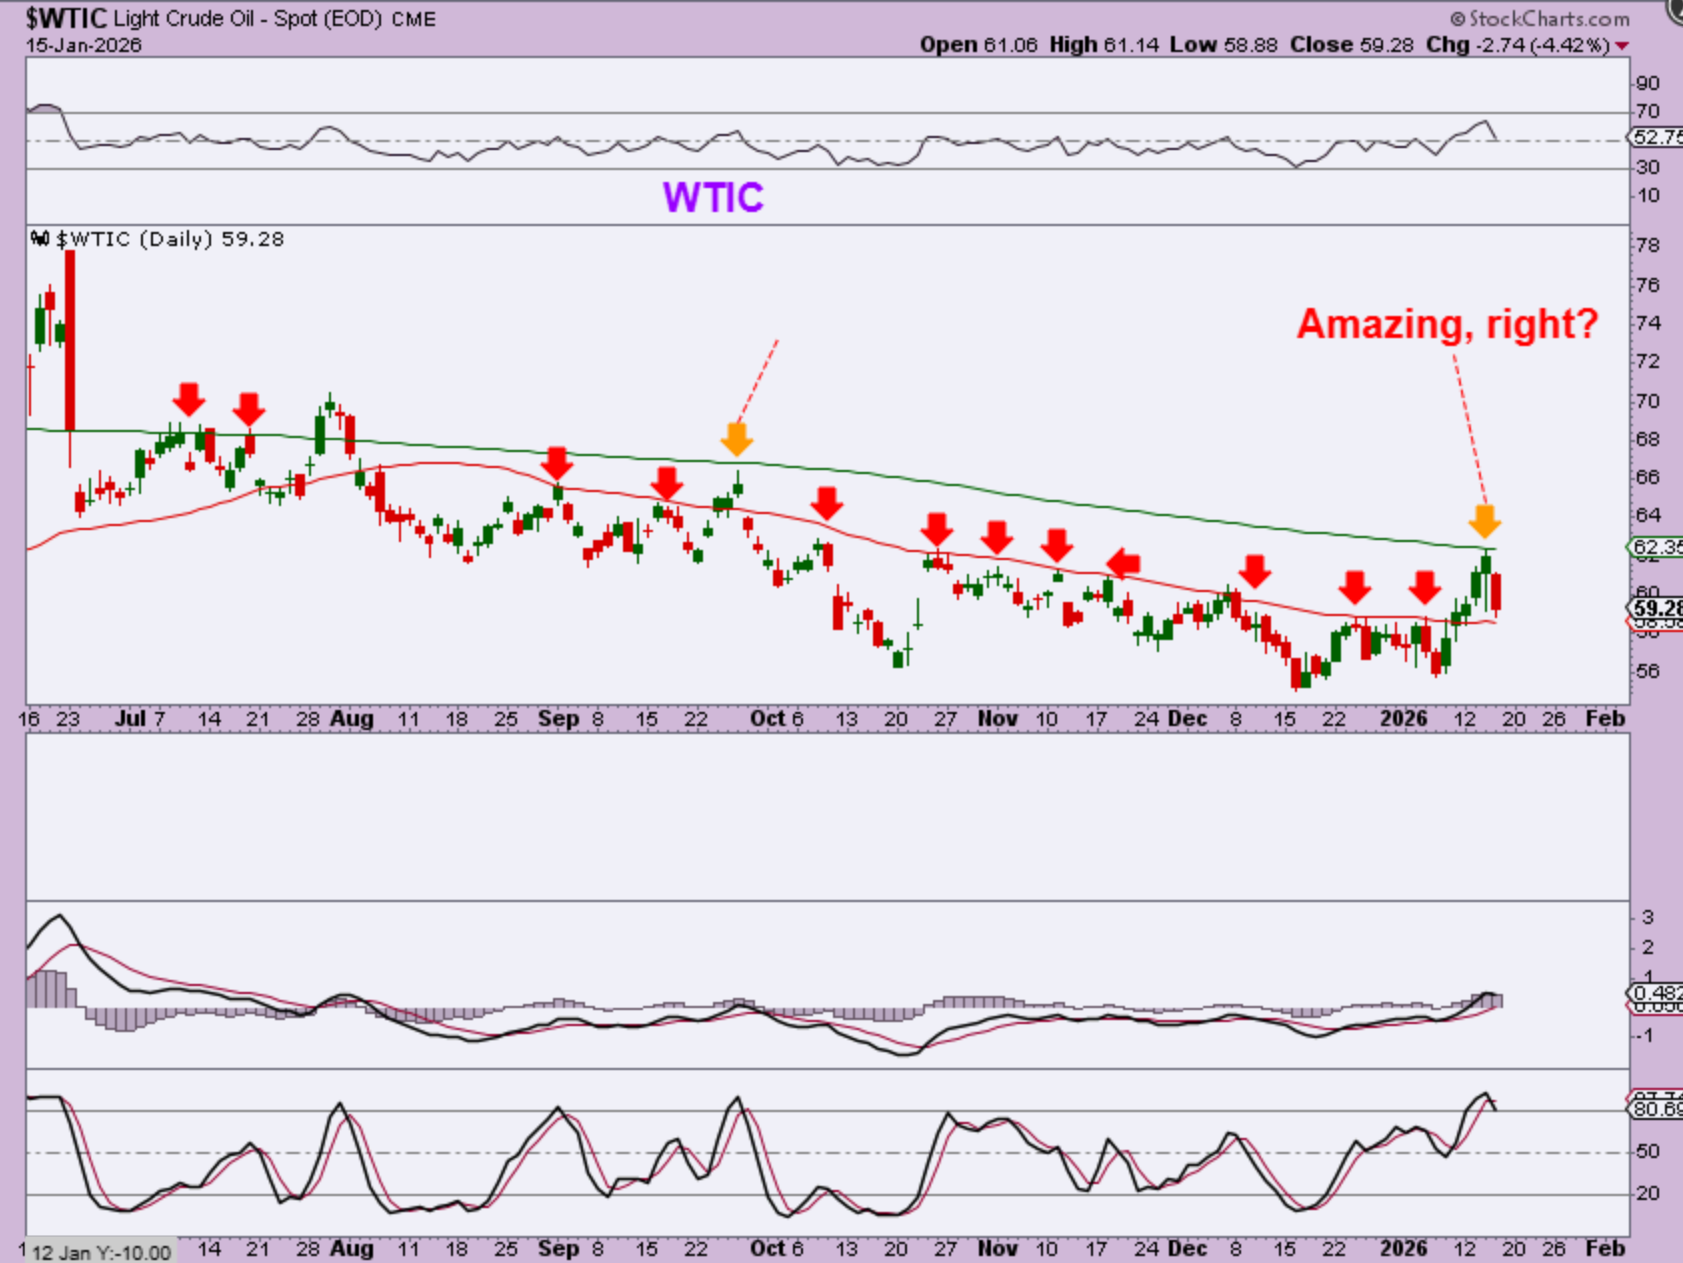
WTIC – Oil was running strong and then it met the 200sma. Isn’t that amazing how we knew in advance that the 200sma could act as resistance and …then it does? Well, it is only day 20 out of the low, so it will likely make a run for that 200sma again, but it may just remain choppy, like it has so many times before.
.
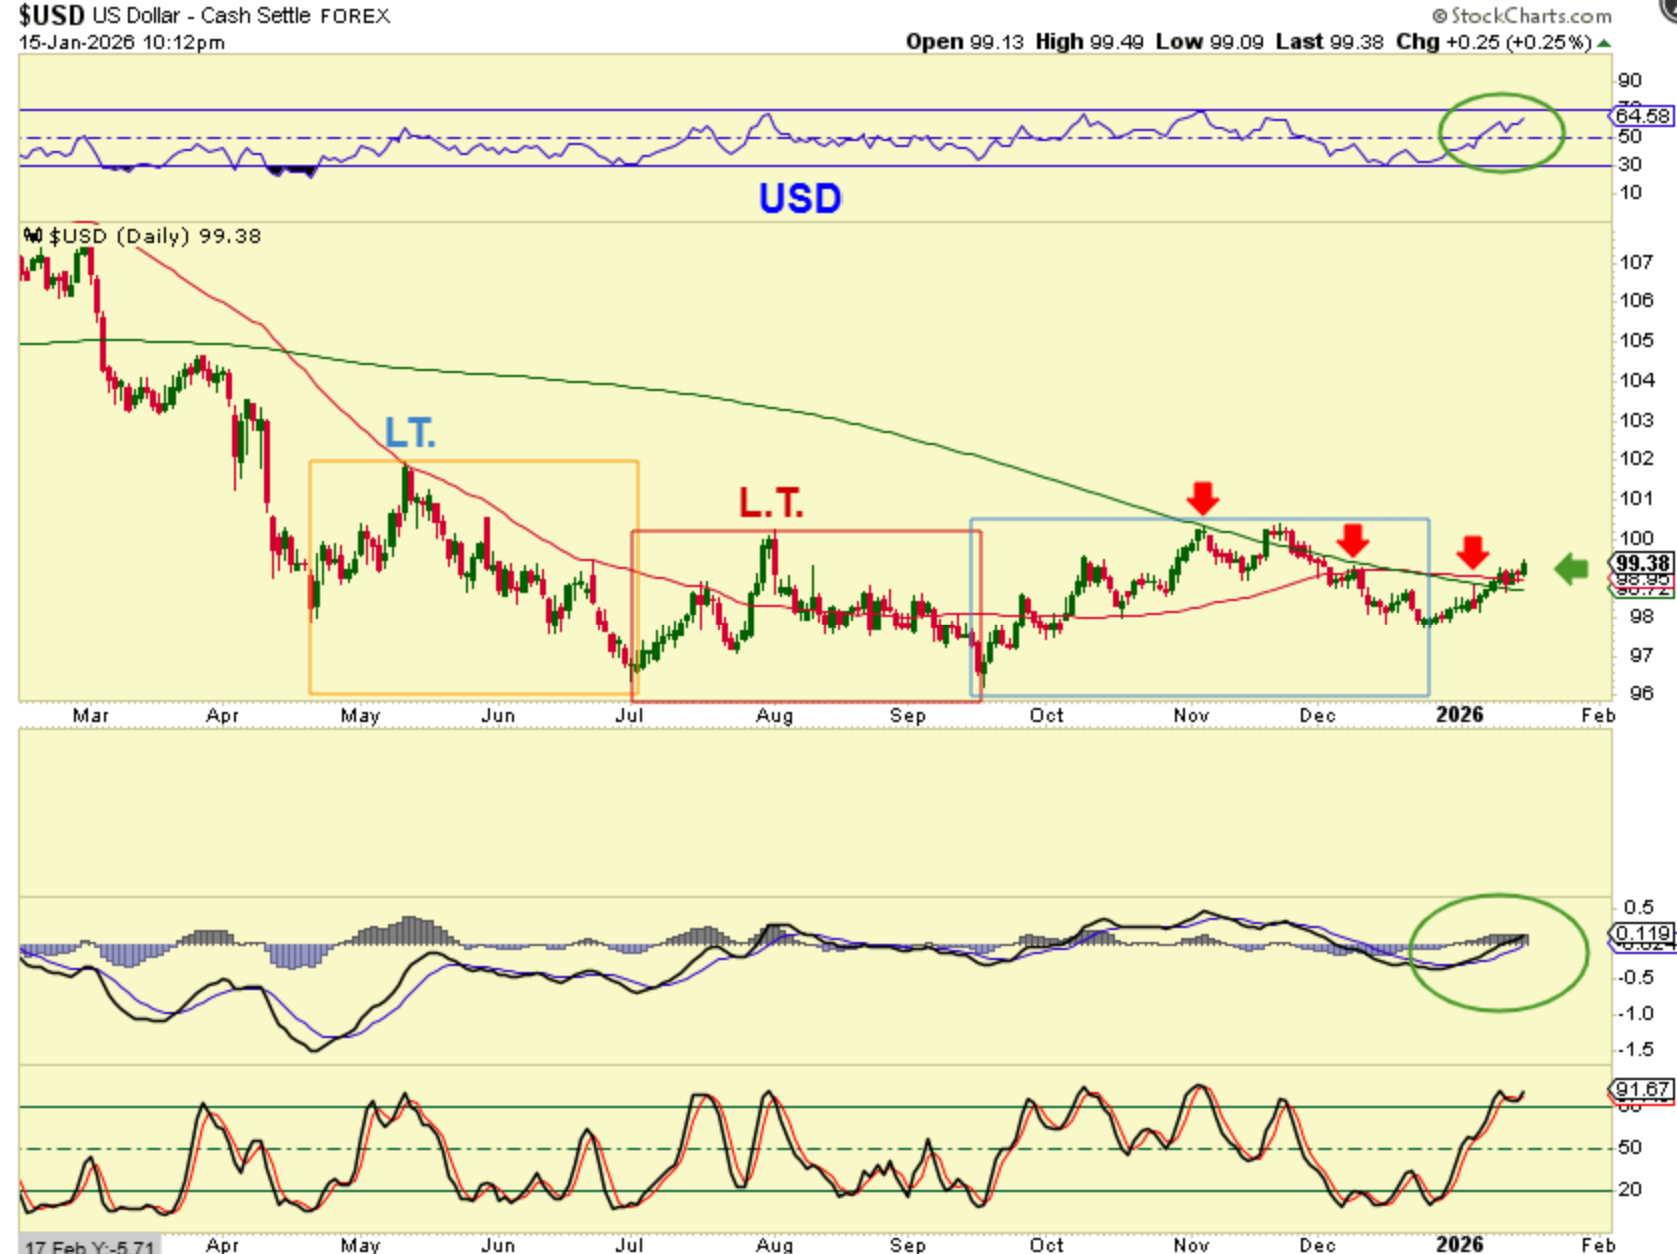
THE USD has a higher low and now it has made it through the 50sma and the 200sma. The USD actually looks bullish for now.
.
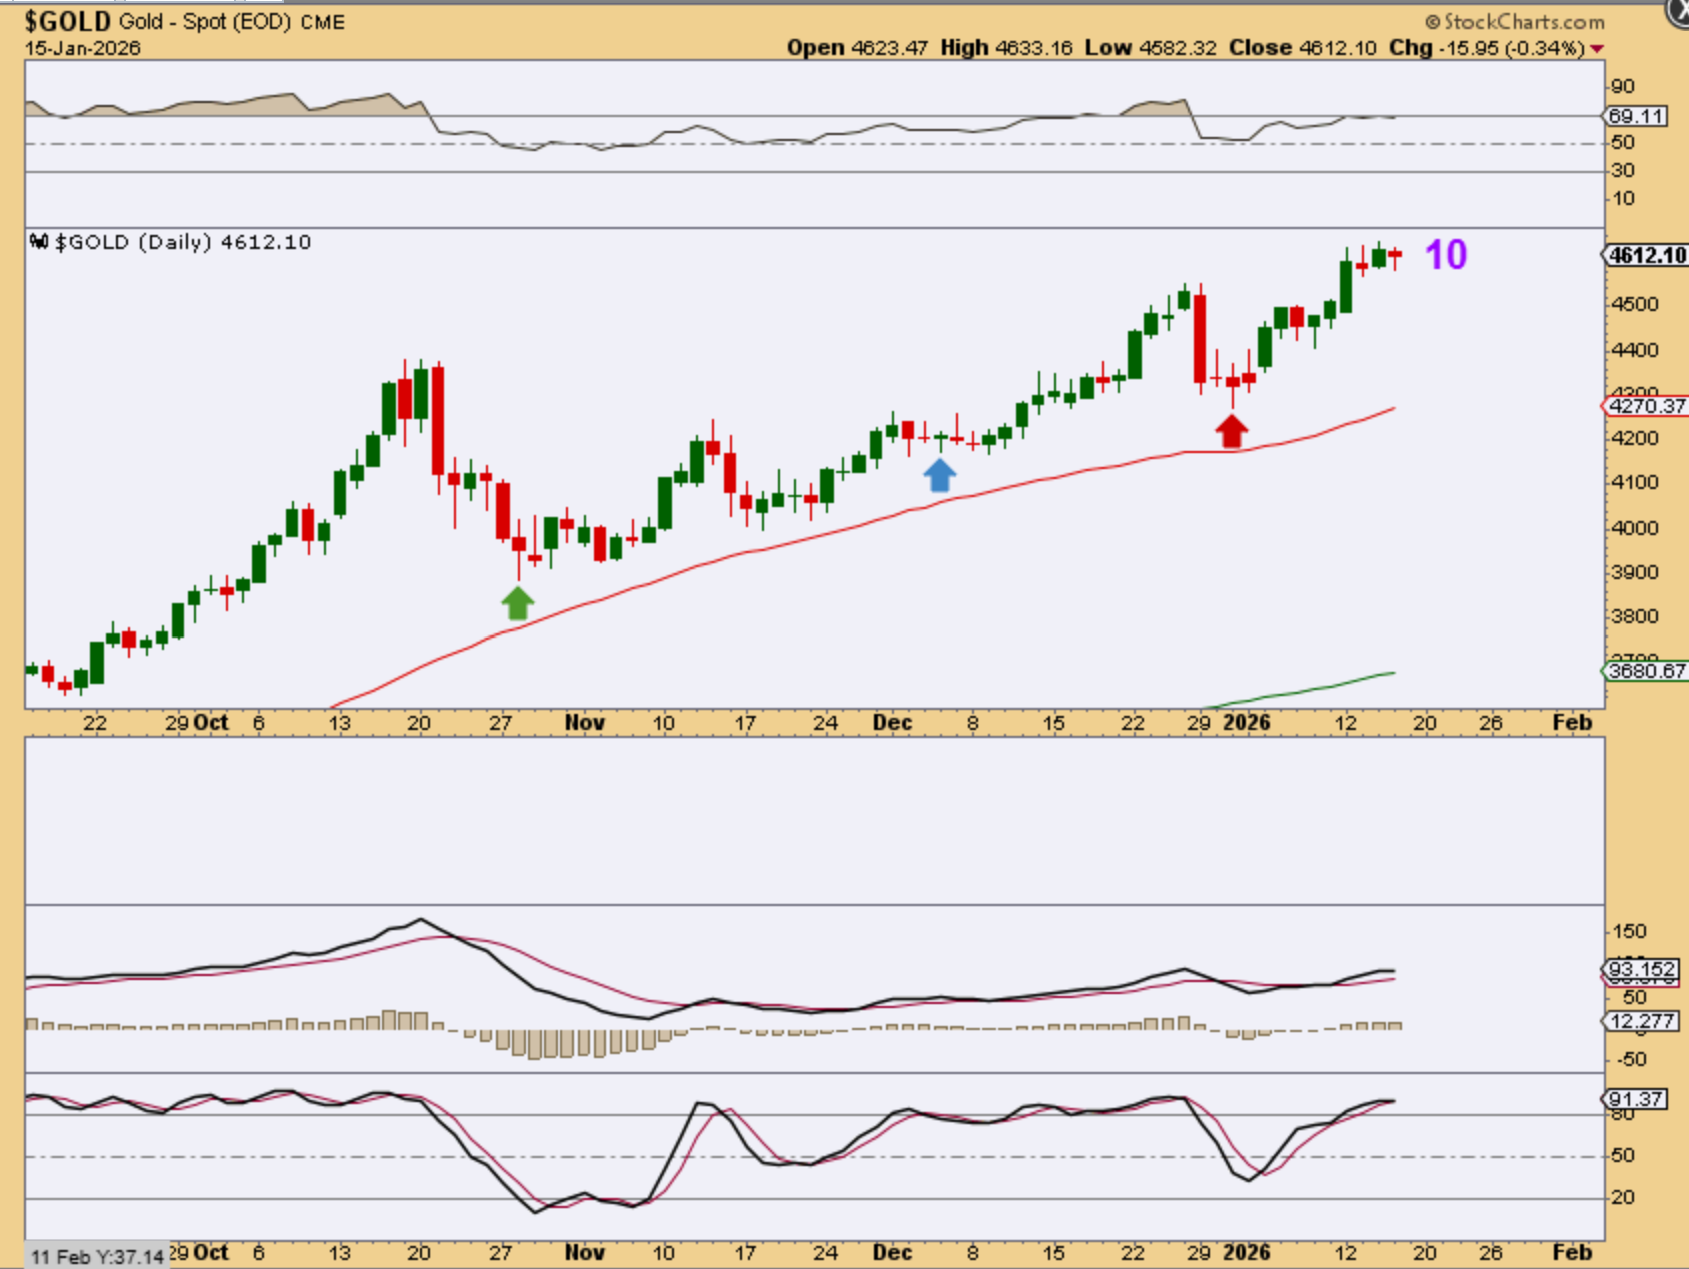
GOLD is on day 10 and I think that with the recent sideways consolidation, it is still likely heading higher to the $5000 area.
.
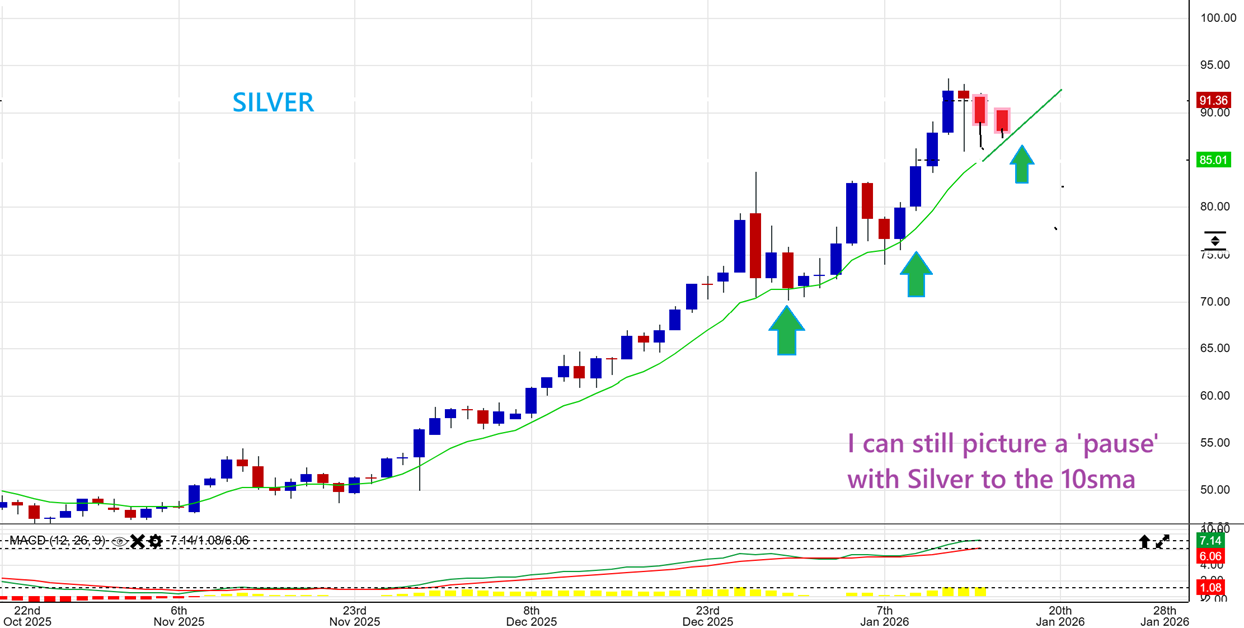
SILVER probably should have chopped down to the green 10 sma, but it dropped $7 overnight, and then it actually recovered. Silver doesn’t look ready to collapse if it can recover like that, and Silver is probably going to run to the $100 area. THAT MEANS that it might run up near the $100 and then sellers will start to take profit. It may not actually touch the $100 mark.
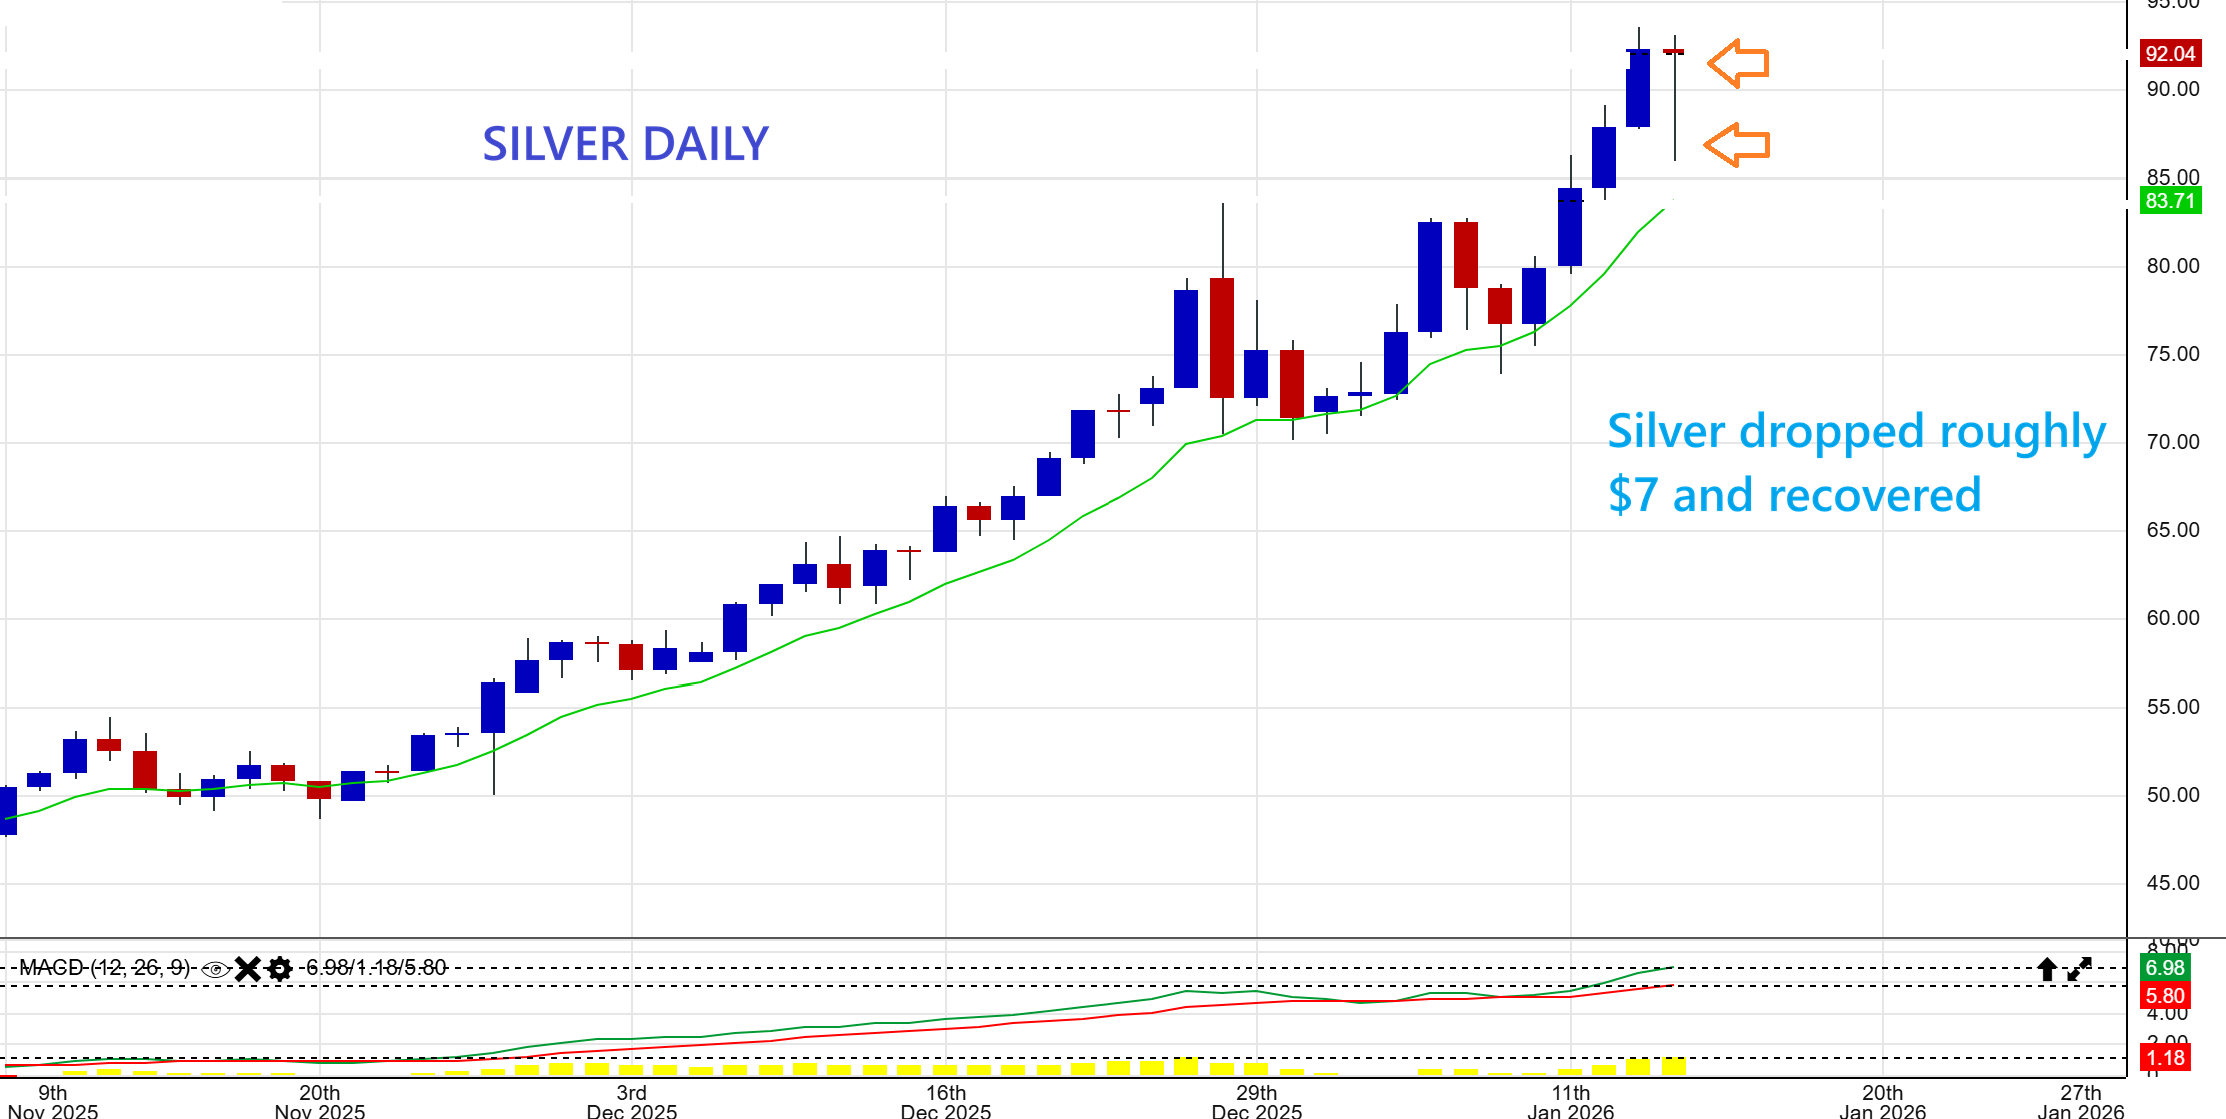
.
SILVER could still chop sideways like it did in December, to reach the 10sma. I have drawn that idea in on this chart below.
.
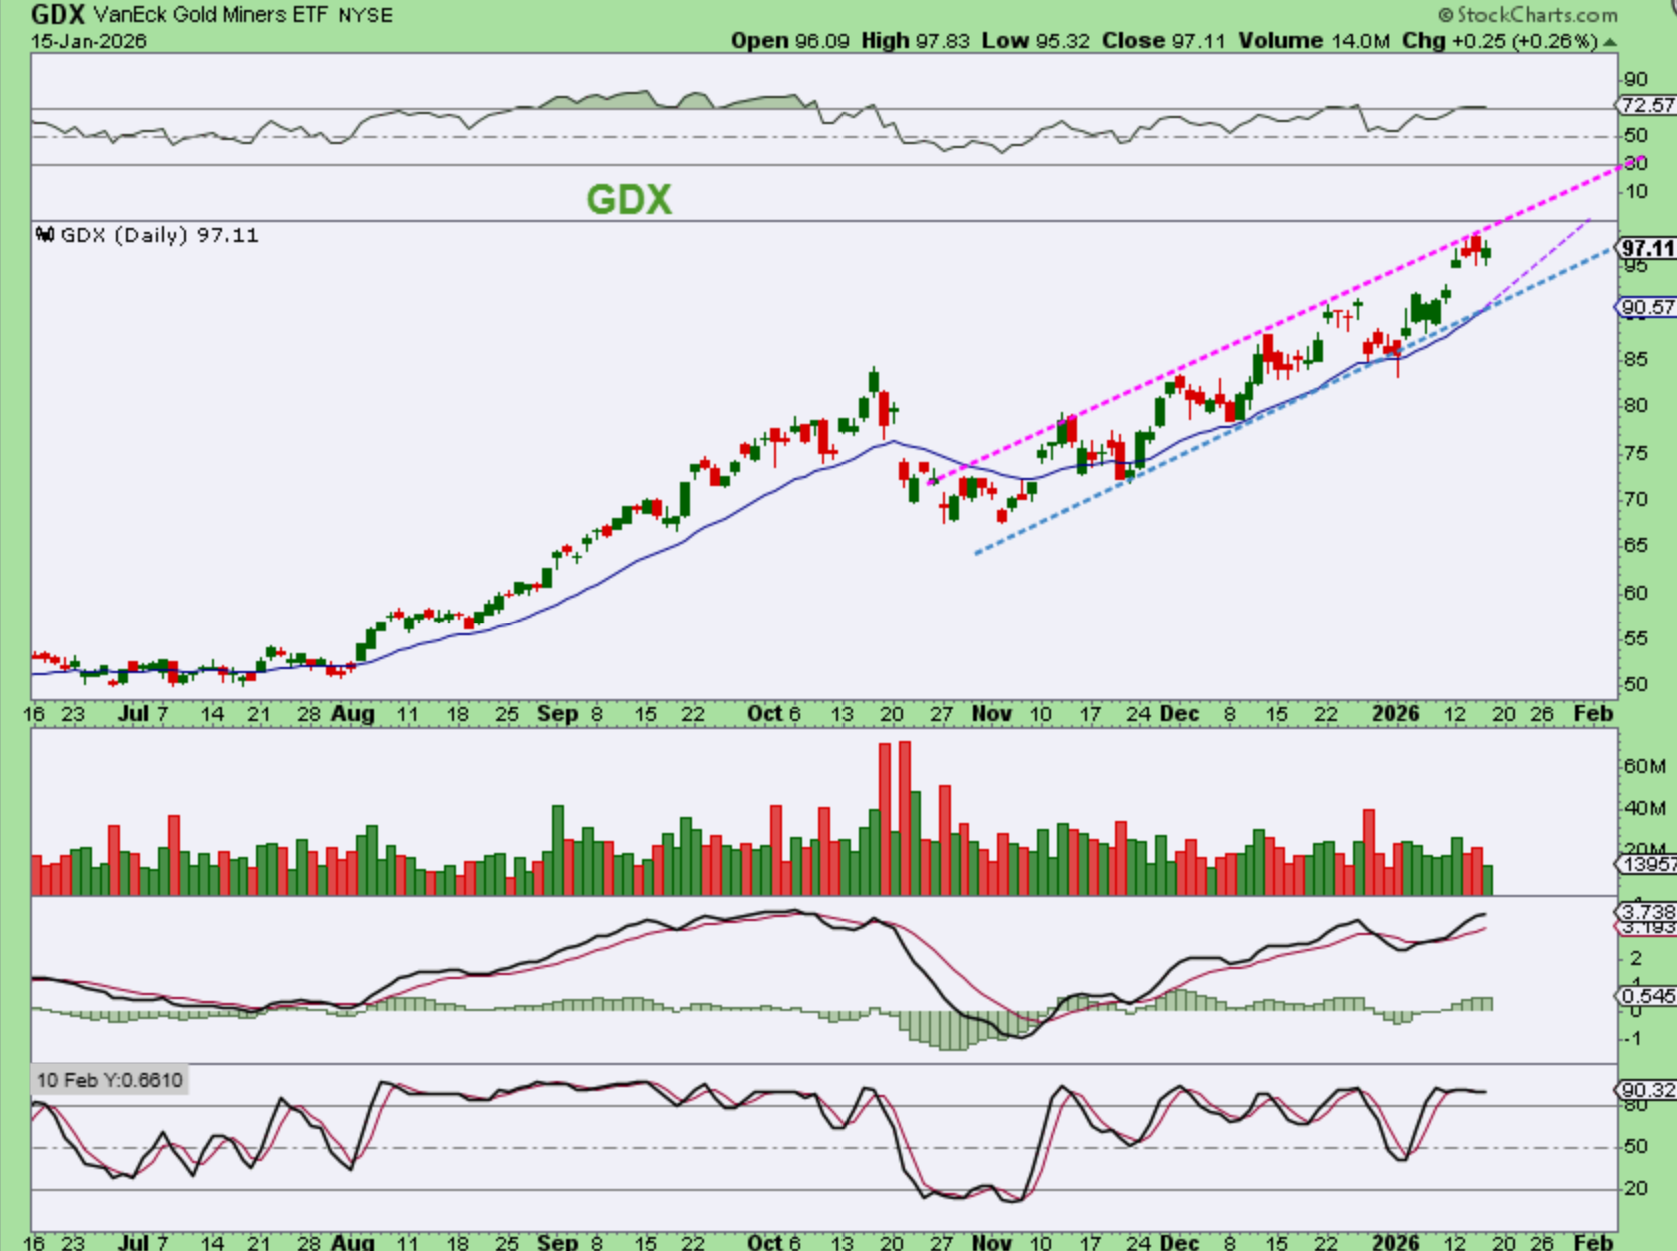
GDX was up 25 cents and is riding up and along the upper trend line right now. There is an open gap that could fill if Gold stalls or dips further.
.
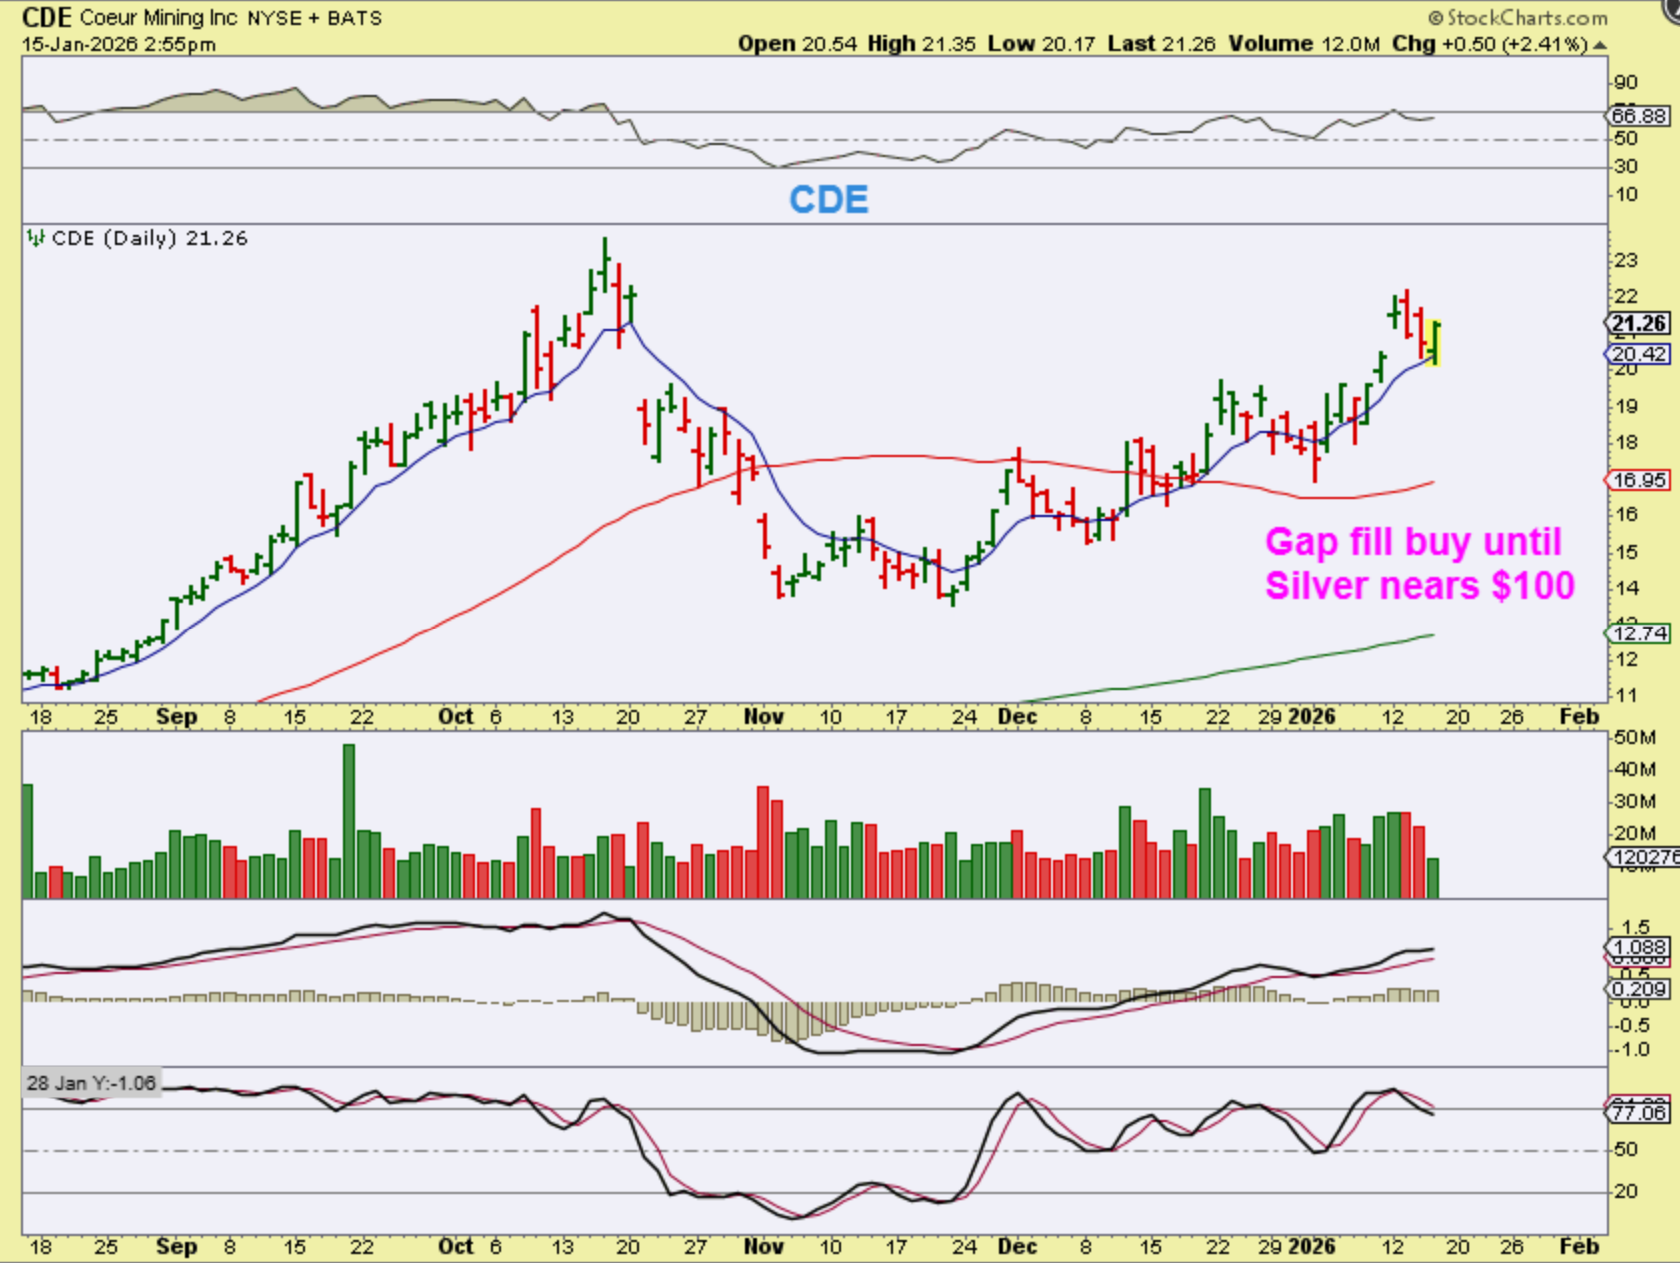
CDE – When Silver dropped and recovered, the silver stocks did that too, so stocks like CDE reversed at the 10sma and filled that gap from the other day. CDE looks like a nice set up and I’d say that it was a buy.
.
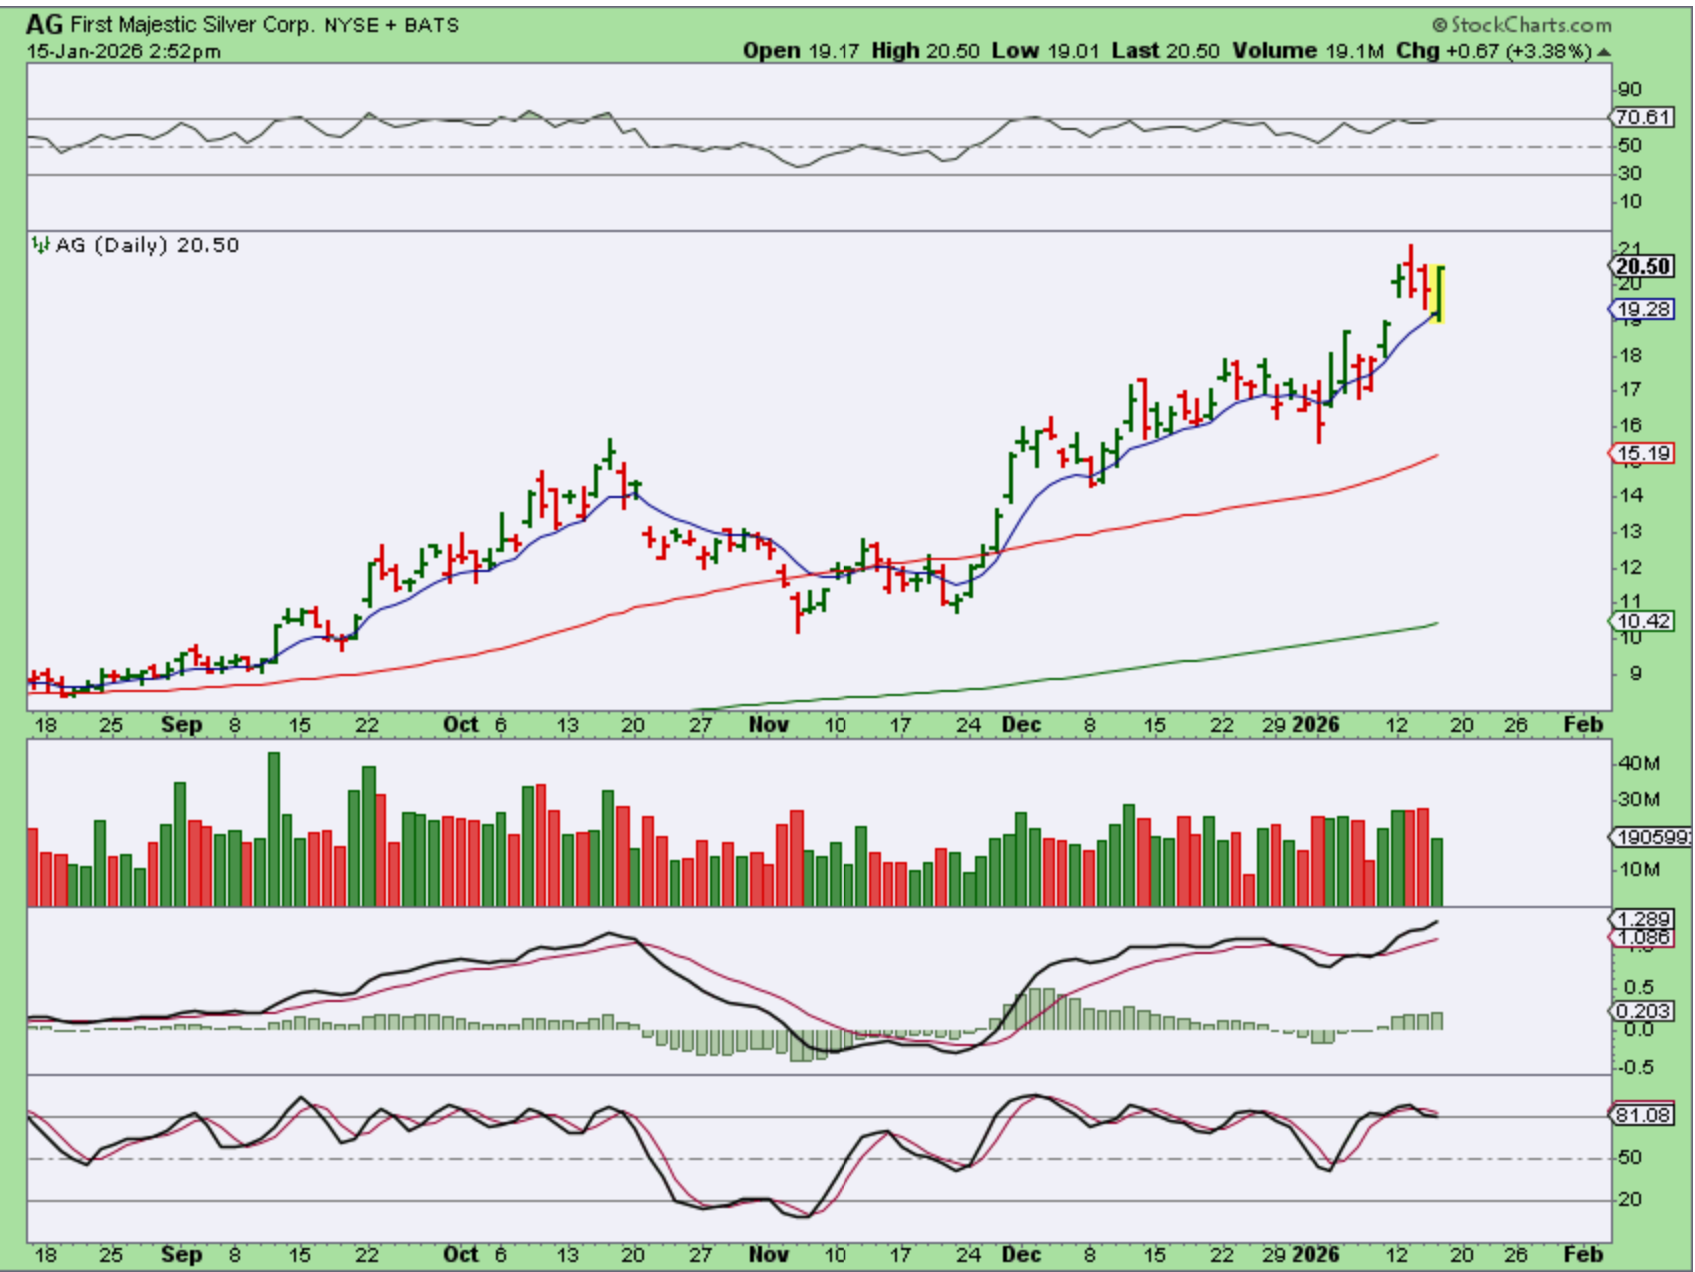
AG dropped and reversed higher too and it also filled that gap from Monday.
.
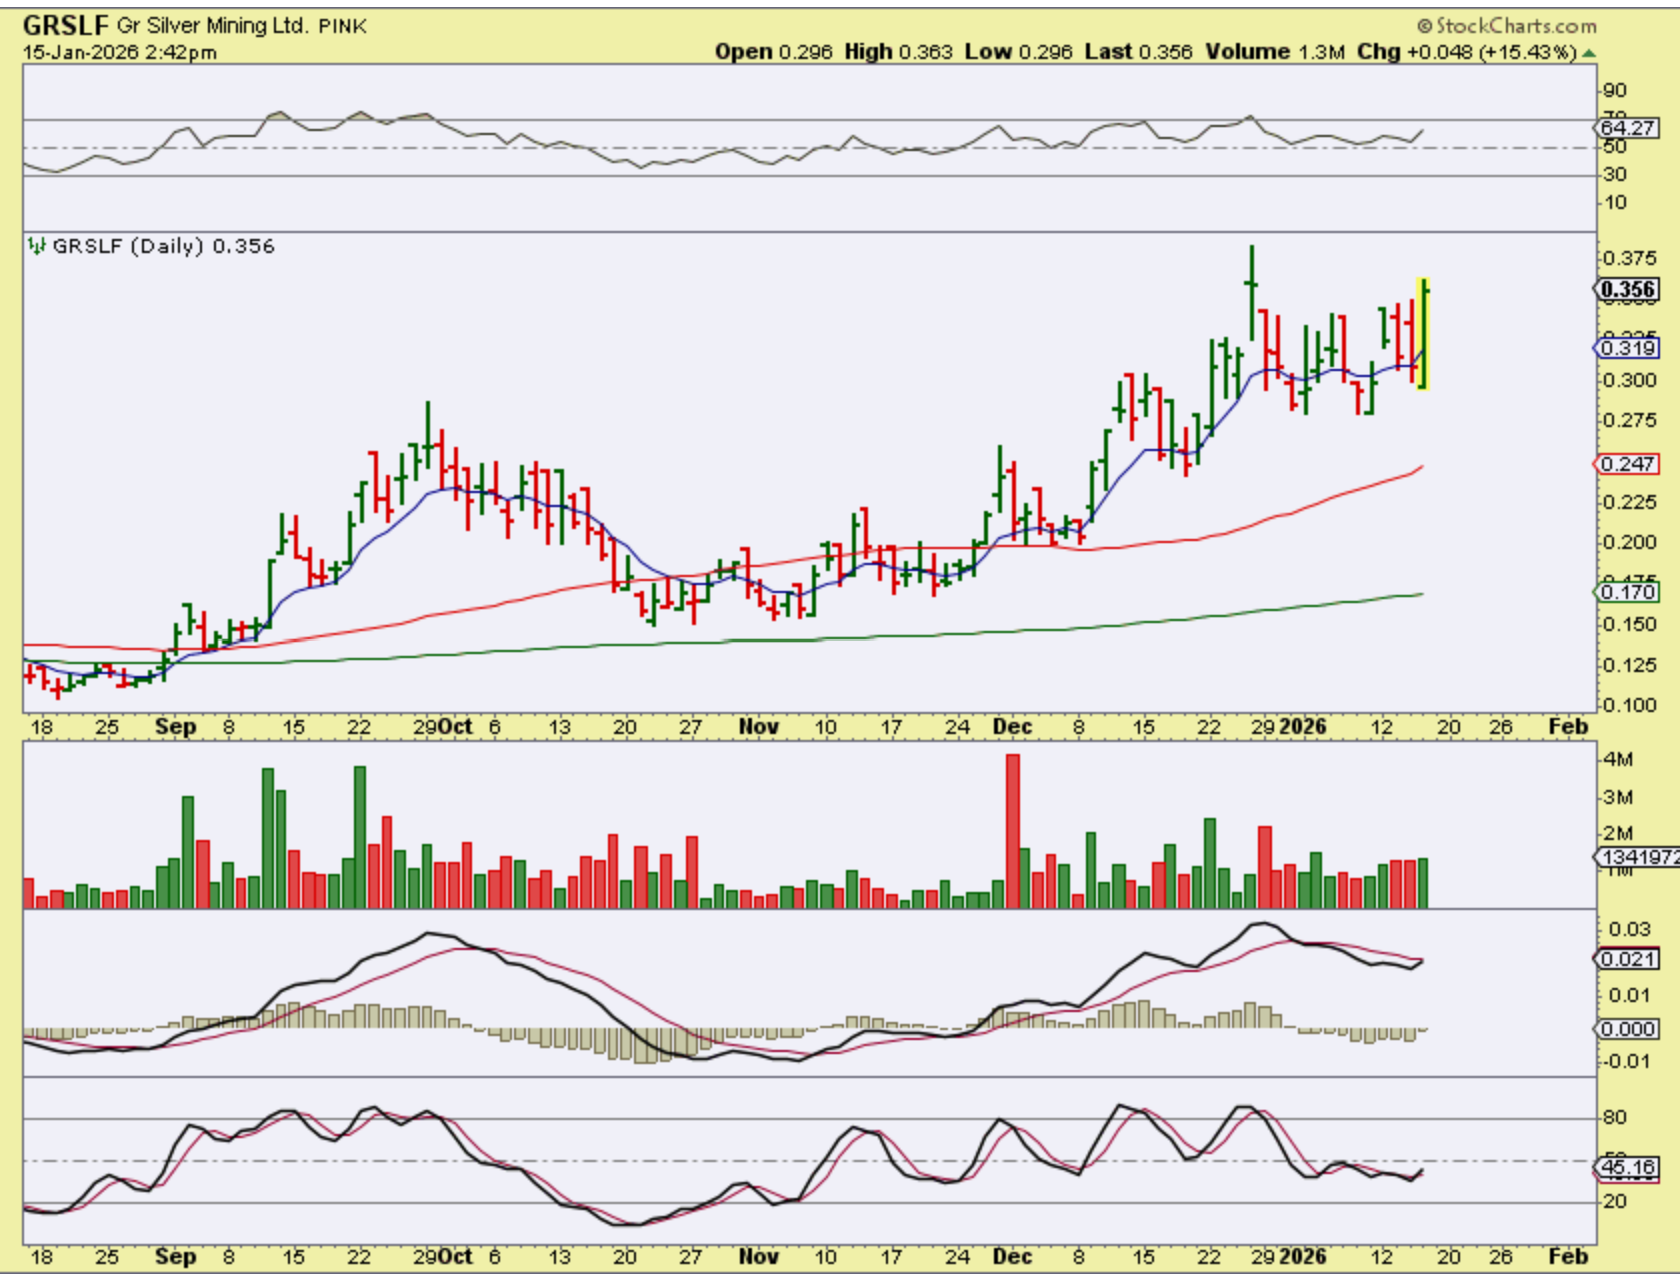
GRSLF is chopping sideways after dropping earlier in the week, so this was a large 15% up day.
.
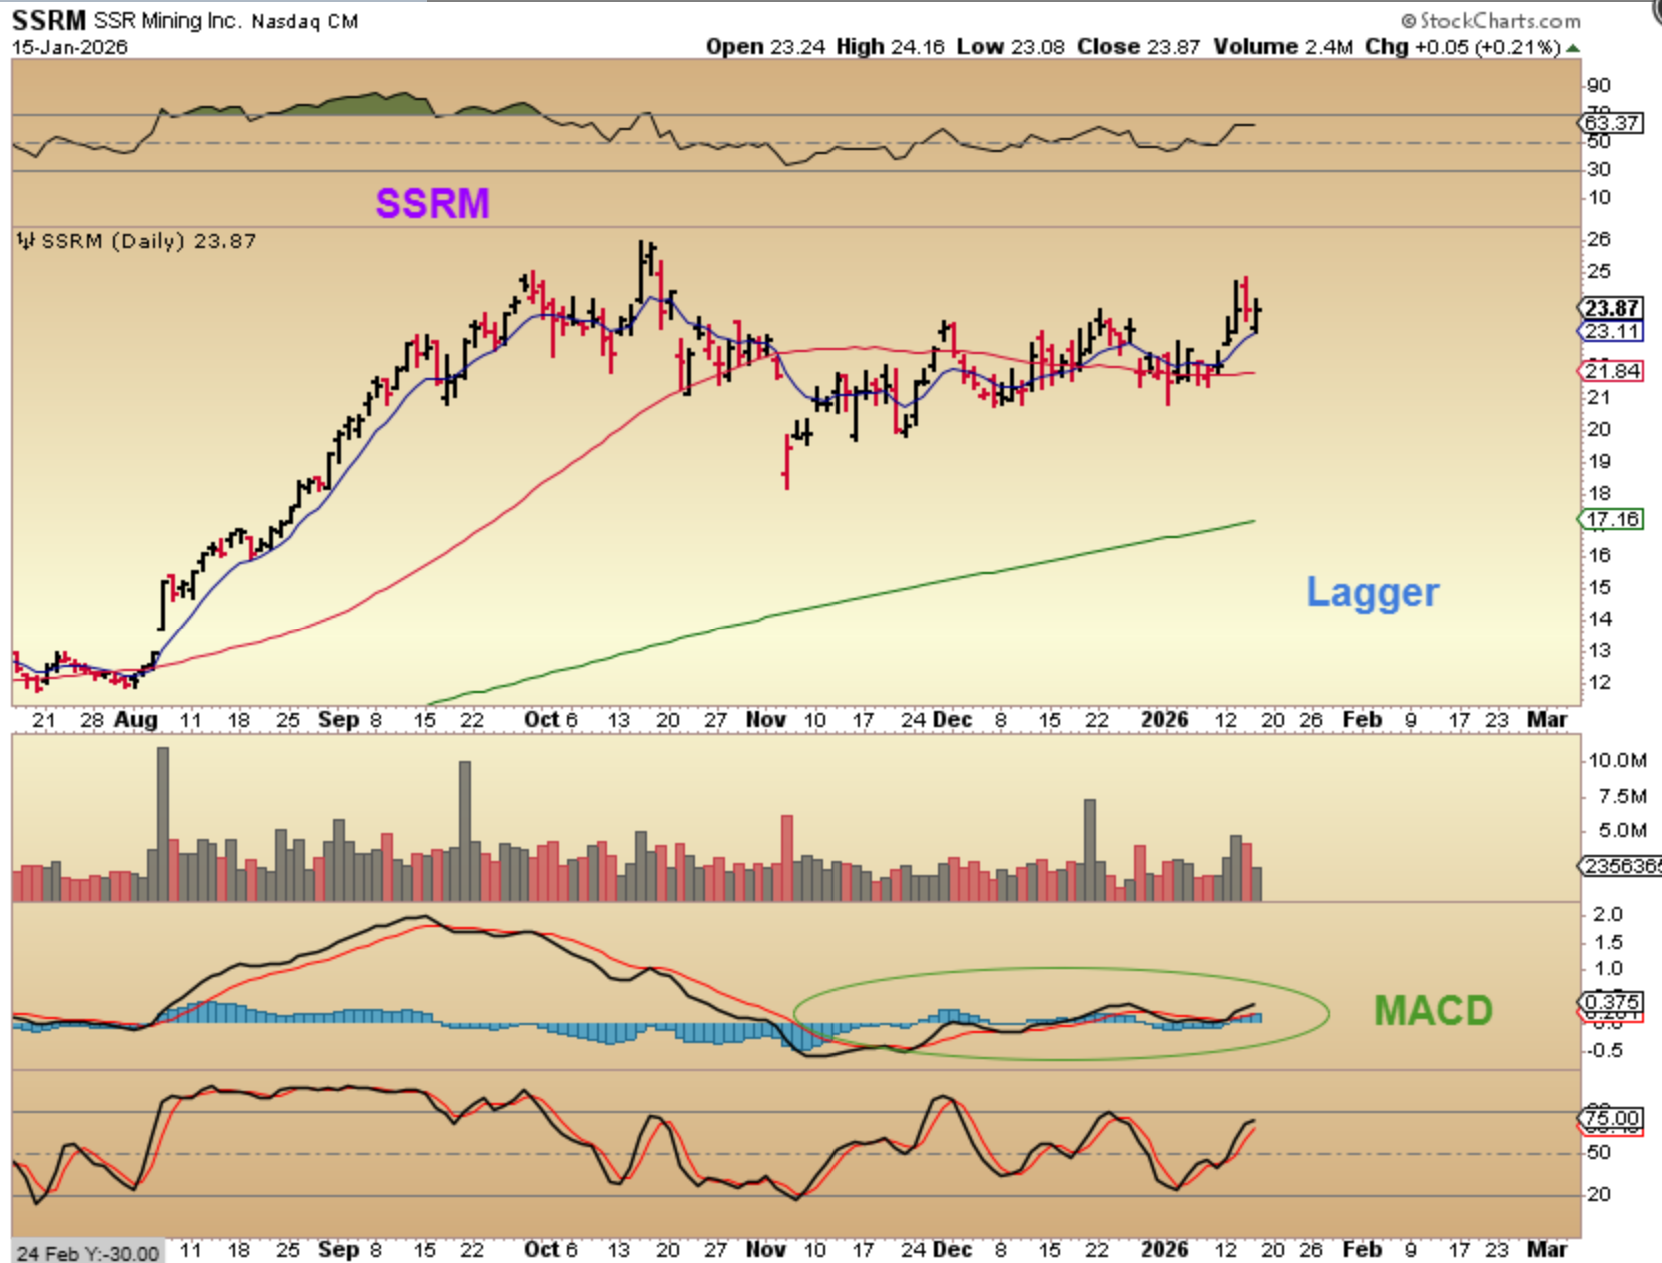
SSRM is lagging other stocks, but it does have a bullish set up. I showed this in an earlier report, and You could have bought this anytime this week and been fine. I do think that it wanted to go higher as long as Silver still has time left in it. Since last Fridy SSRM went from $21 to $25, so it can run from here.
.
The bulls are doing well, but it does get a little choppy at times. I still like the set up in the General Markets, and many of our stock picks here are making good gains out of that Nov ICL. Oil is still ‘o.k.’, but it does seem to always fail at the 200sma mark, so we’ll have to wait and see if Oil can break out this time. Oil stocks actually do look fine, you can see WTI, PUMP, NOG, VET, VLO, etc. They are pulling back, but they may be a buy opportunity if you like this sector. In fact, XLE & XOP still look healthy. The Precious Metals are bullish, but they can also be choppy and recently Silver stocks didn’t follow Silver again. Silver dropped and recovered yesterday and so did the Silver stocks. You would have to believe that the clock is ticking for the Silver parabolic run, but so far it has been ‘surprises to the upside’.
.
As a reminder, The U.S. has a holiday on Monday and the markets are closed. Bitcoin is below, enjoy your Friday trading and your weekend!
.
~ALEX
.
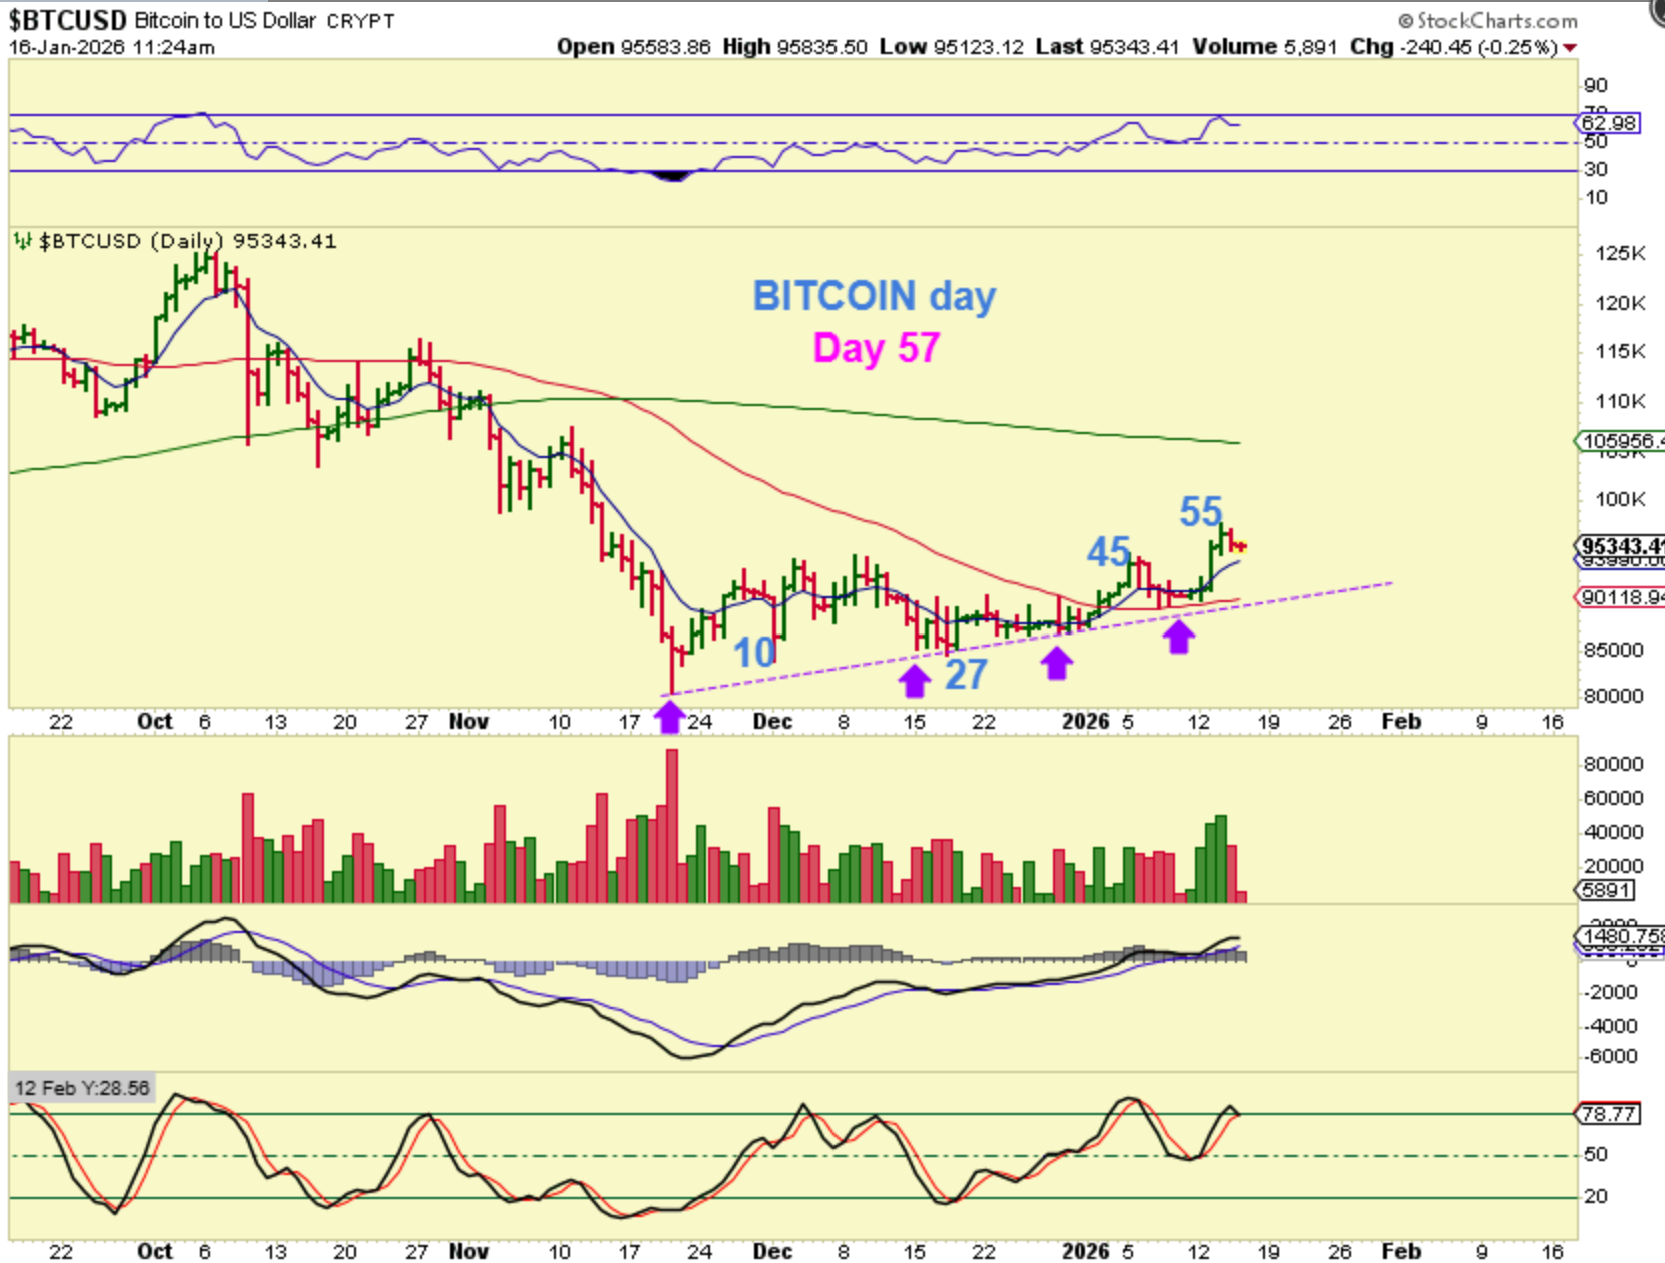
BITCOIN – We are now 57 days out of the capitulation low and that is starting to get late. This trades over the weekend and the holiday on Monday, so you’ll want to keep that in mind is you took a short term trade in Crypto stocks or Bitcoin. I will say that this chart looks like a bullish base, but the time for a good rally seems to be quickly running out – IF that 4 year cycle plays out, and it should.