December 27th Weekend Review – With Important News
The Bulls remained in control this week, but at the end of this report I’ll have some important charts and a short discussion on Silver and the Miners. Please don’t miss it.
.
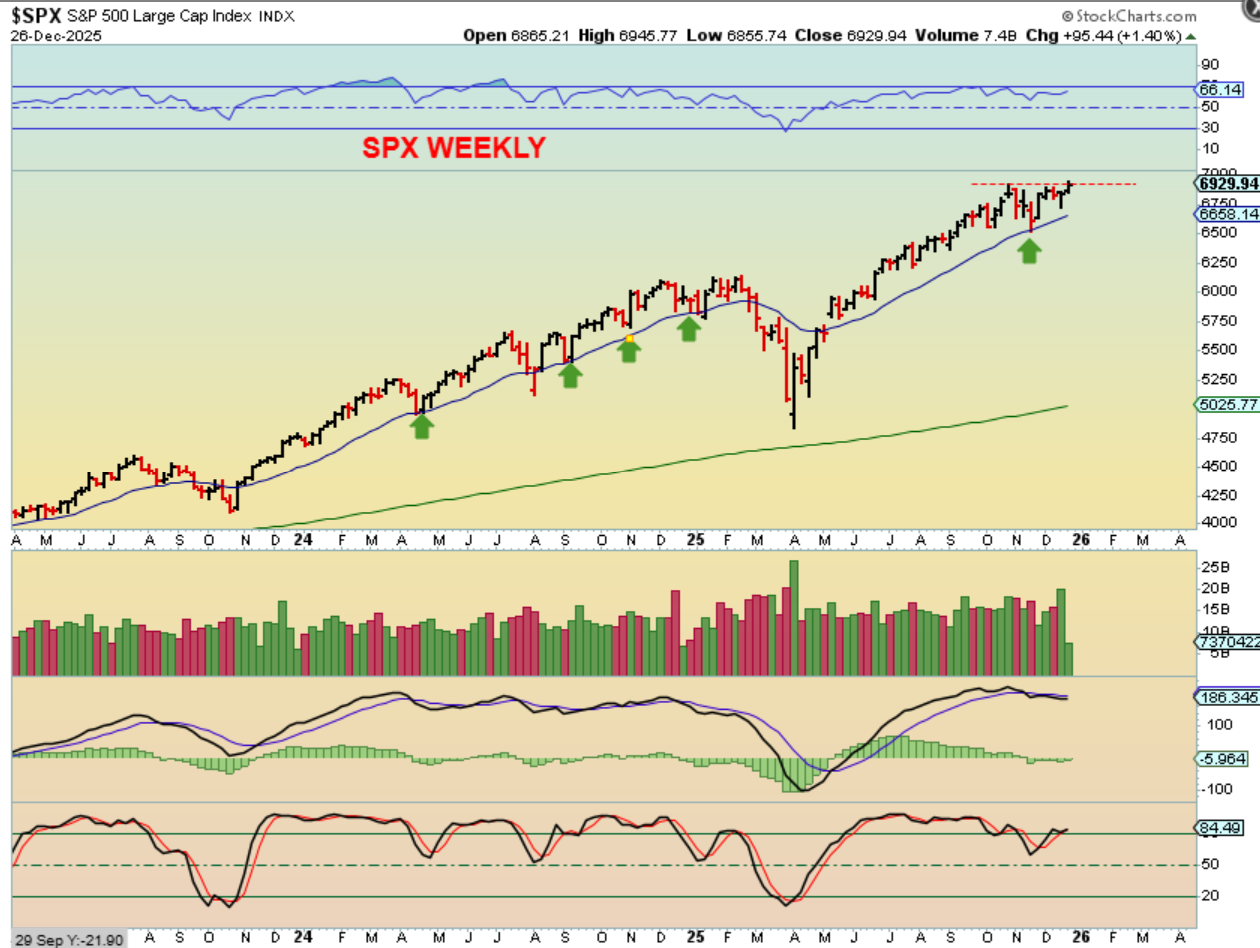
THE SPX remained bullish, breaking to new all-time highs. This can continue higher next week.
.
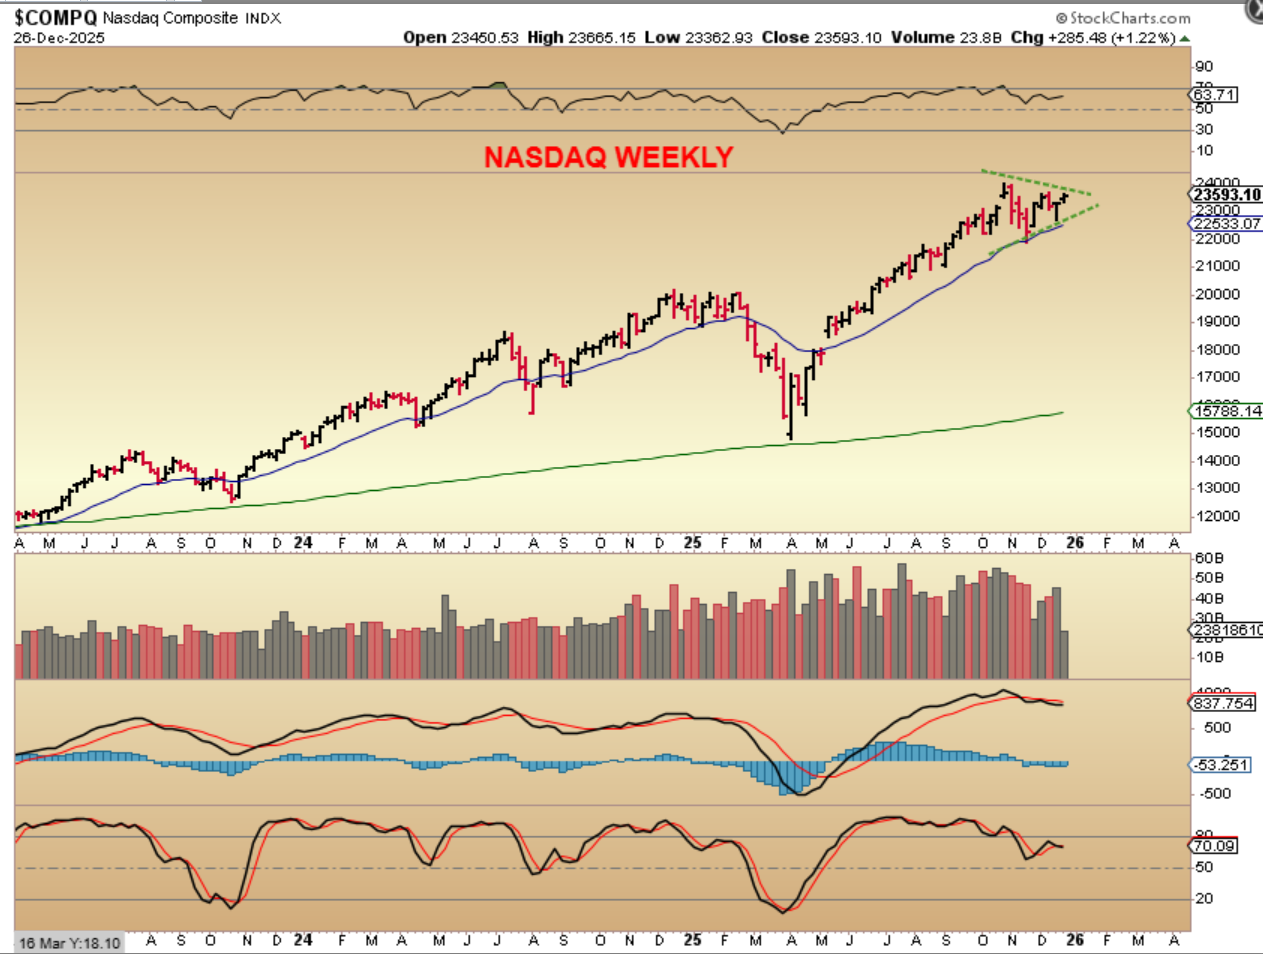
NASDAQ WEEKLY – The Nasdaq is not at new all-time highs, but it did move higher out of that half cycle low too. It remains in a bullish set up with a possible bullish pennant forming.
.
WTIC – Oil broke down, recovered, and then did a pop and drop last week. Oil is very choppy as it tried to move higher out of its’ recent low.

.
THE USD broke down in April and even though it has tried to recover since then, it has been unable to. On the last push higher, a rate cut weakened the Dollar and it has dropped again. The stochastics is not nearly oversold, so it may continue to drop over time.

.
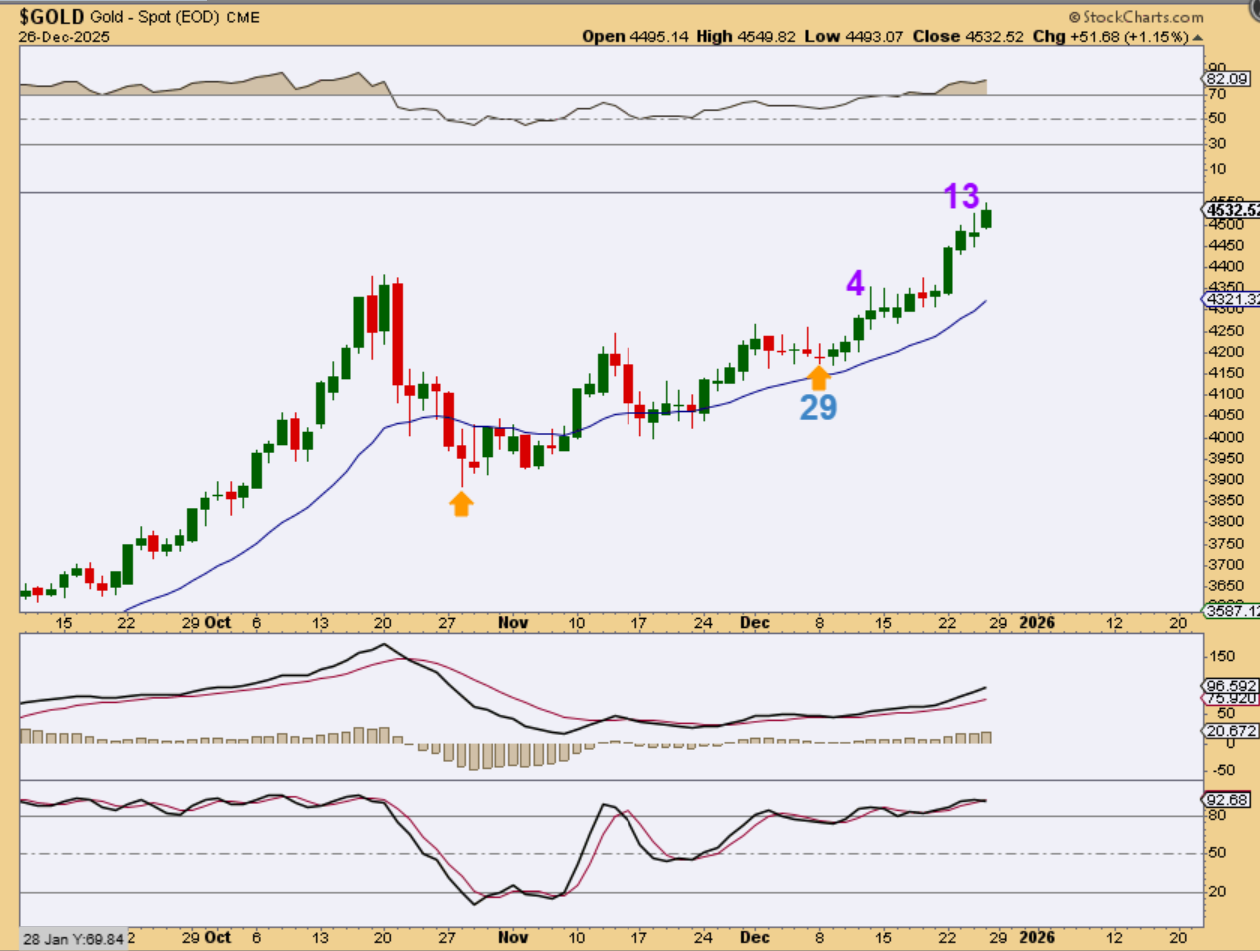
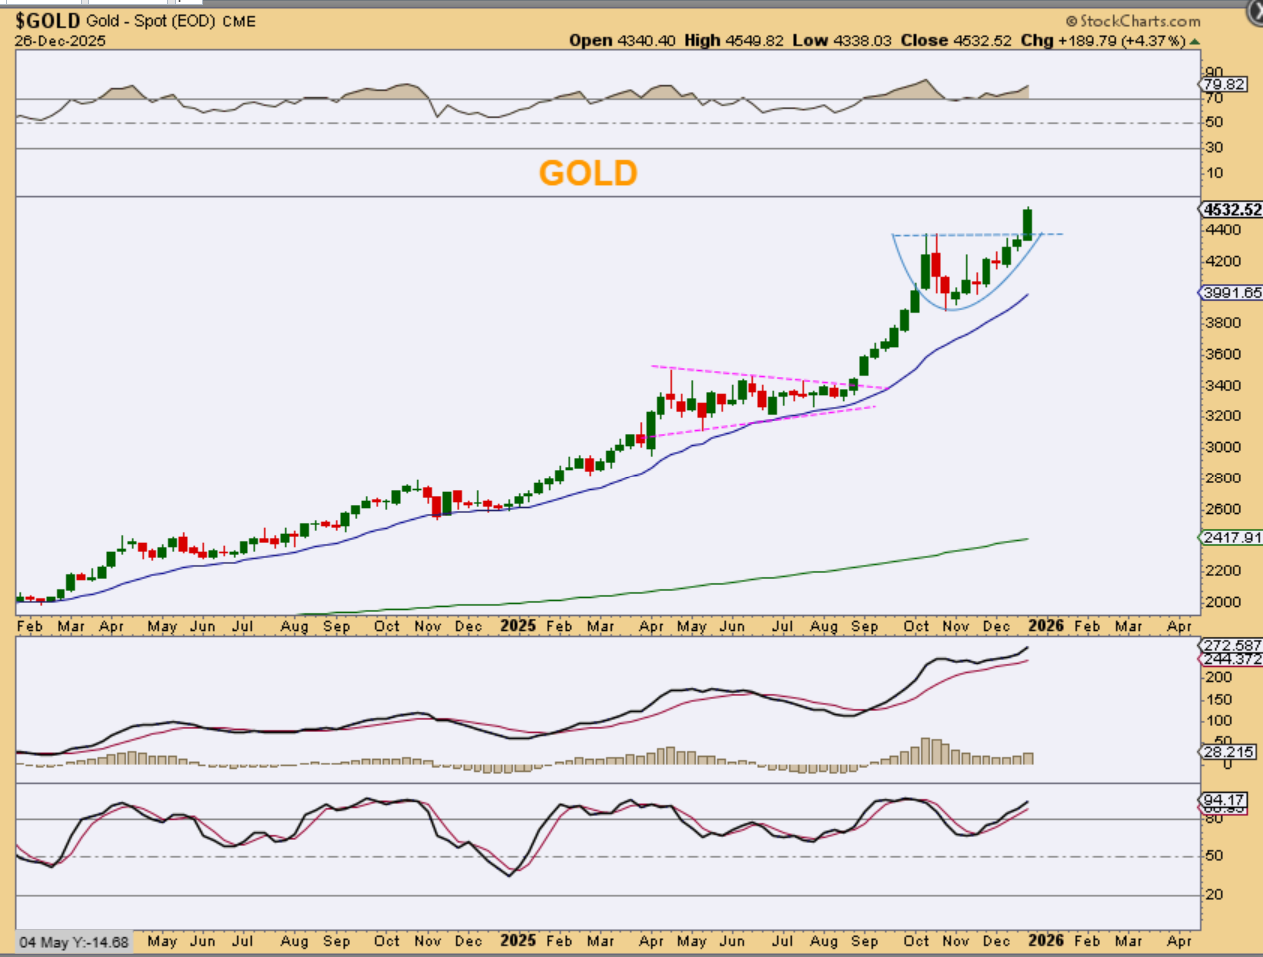
GOLD is on the 2nd daily cycle, and it broke out on Monday and started to make a run to new all-time highs again this past week. With a day 13 high, this is a bullish set up that can continue higher. Unfortunately, many of the larger Gold Miners went sideways for 4 days. Some of the 5-letter explorers did move higher, others like Tudor (TDRRF) lagged.
.
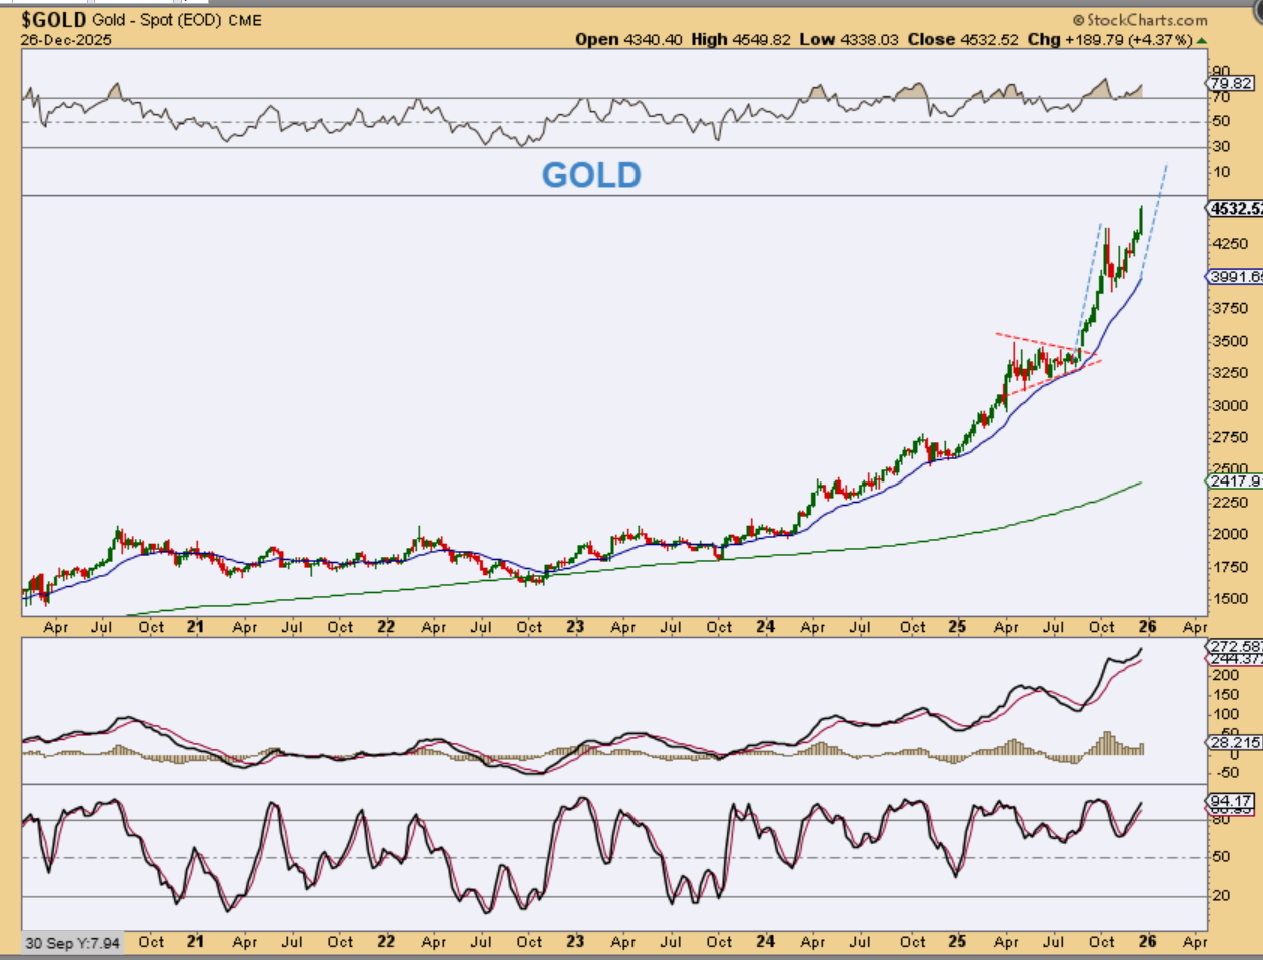
So the GOLD WEEKLY CHART shows the break out to new all-time highs of roughly $4550. This can continue higher next week, despite the RSI divergence.
.
GOLD – Since Silver is now going parabolic, the upward climb of Gold may also start putting in a final run higher, followed by another consolidation in the first half of 2026, unless it crashes. Eventually we will get a pullback, and the manner in which Gold pulls back will let us know if the run is done or not. You see that last pullback in October lasted only 2 weeks and then buying started again (A cup formed).
.
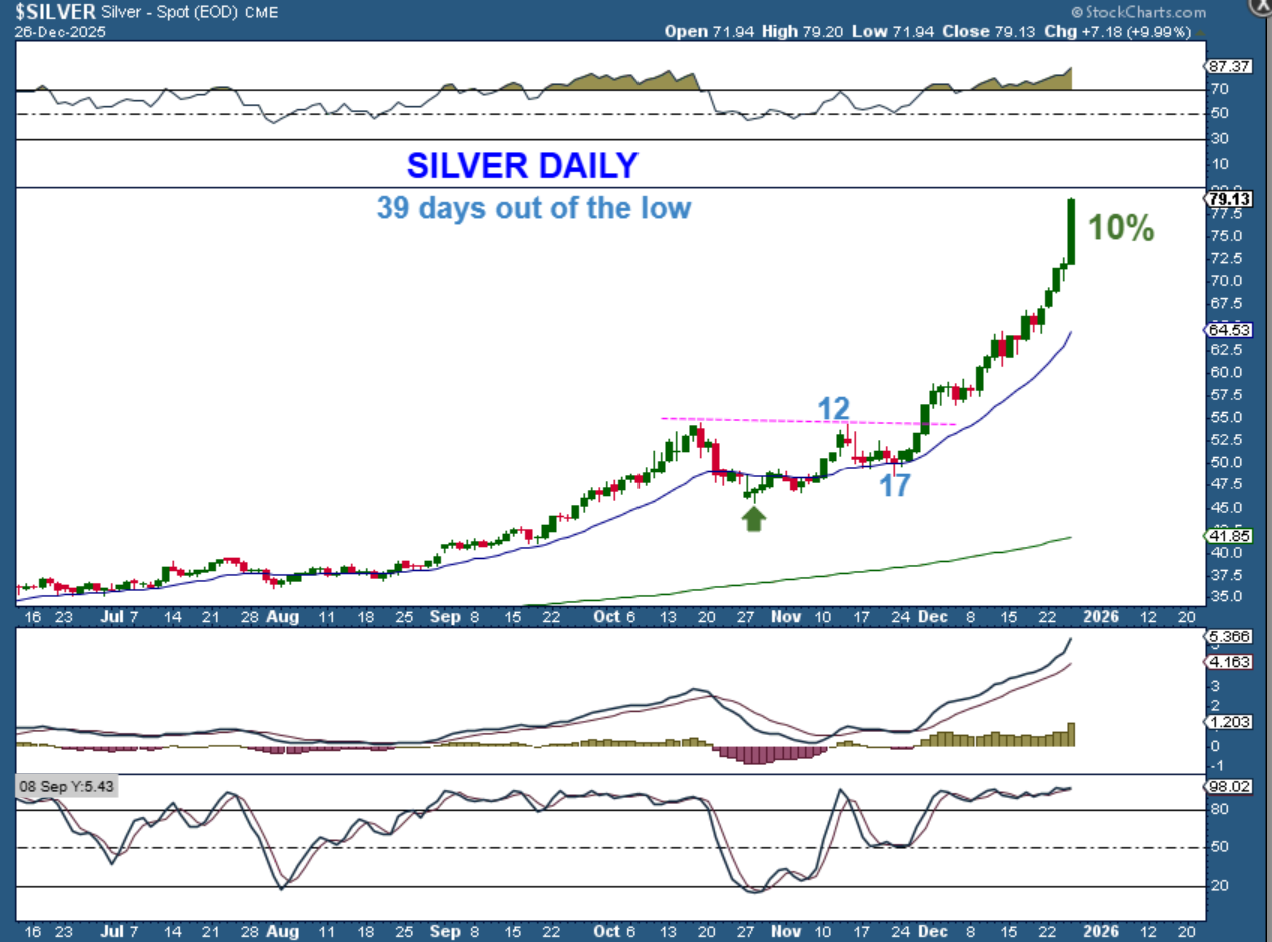
SILVER – Silver had a 10% day on Friday! Wow!
The daily cycle counts are still a bit obscured, with no real visible dcl after day 17 (so was day 17 enough of a dip? That was probably too early, so day 25 in that handle may be the dcl), but to be honest, that count may not matter anymore. I think that this 2nd daily cycle is starting to go parabolic. Actually, it is parabolic, and you’ll see that on my next chart.
.
Is SILVER Parabolic yet, in your eyes?
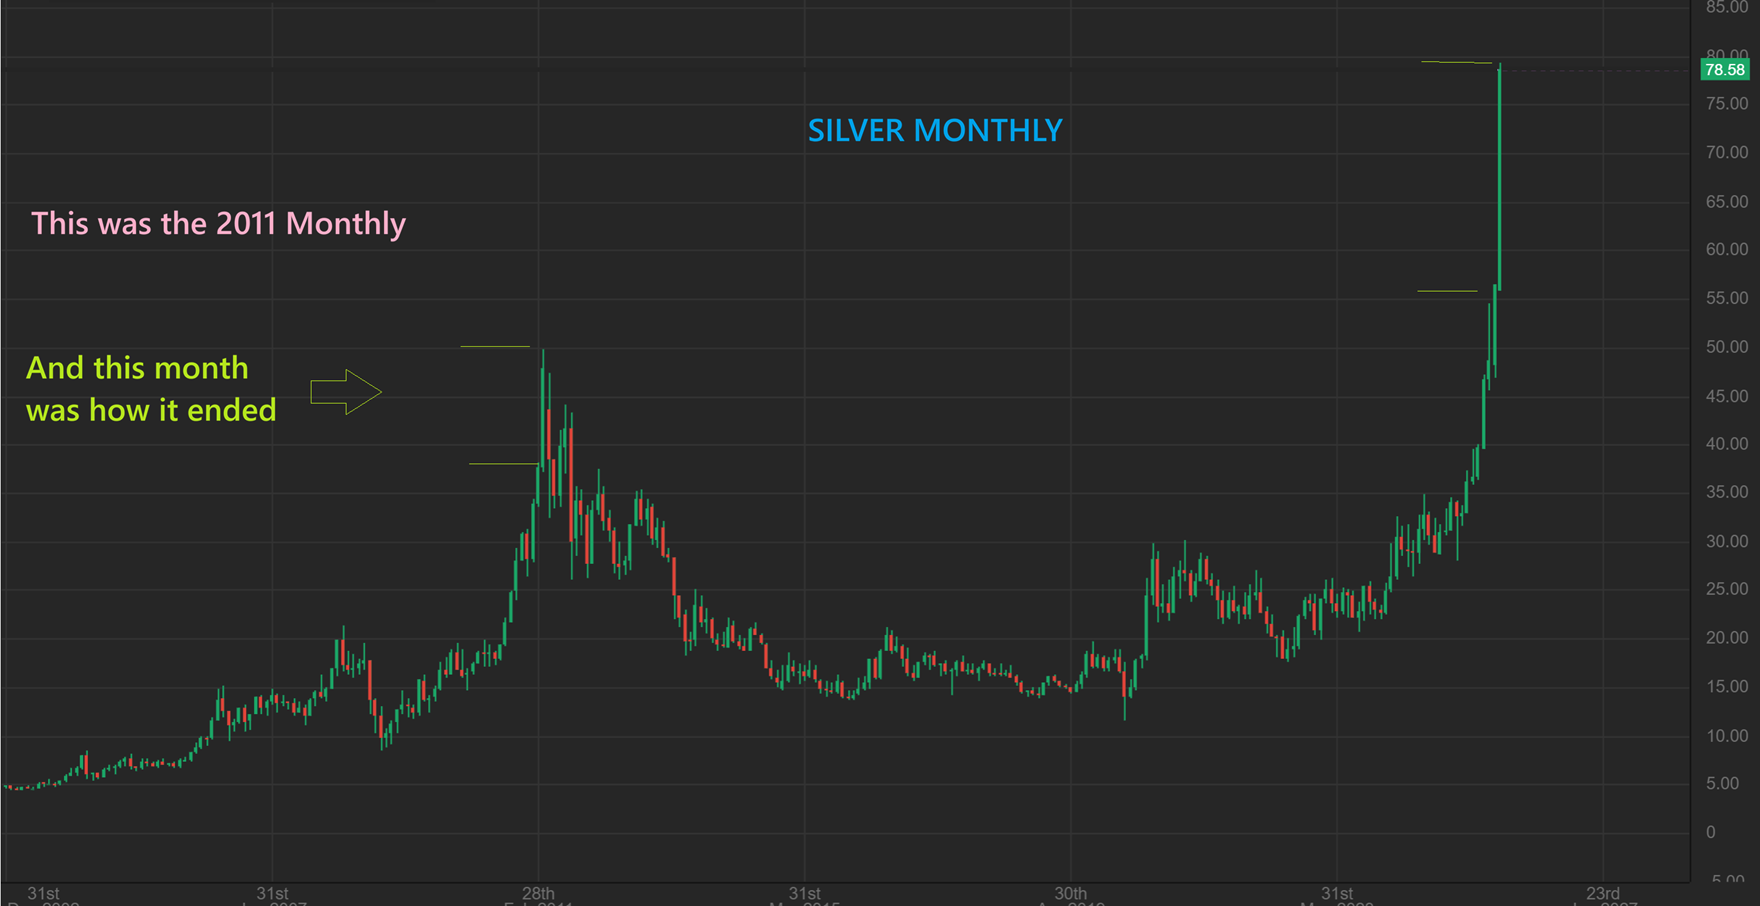
This means that despite the cycle count, we are likely to top on this run and it could come at any time. It could be Monday, it could be on Friday or it could come on the following week, we just don’t know. What we do know is that a run like this is really getting too extended to be sustained. Look at 2011 compared to now.
.
SILVER MONTHLY– The month chart of December ends this week, and this is where Silver is at already. Again, compare the top in 2011 to now. As mentioned, I will have additional coverage of Silver at the end of the report.
.
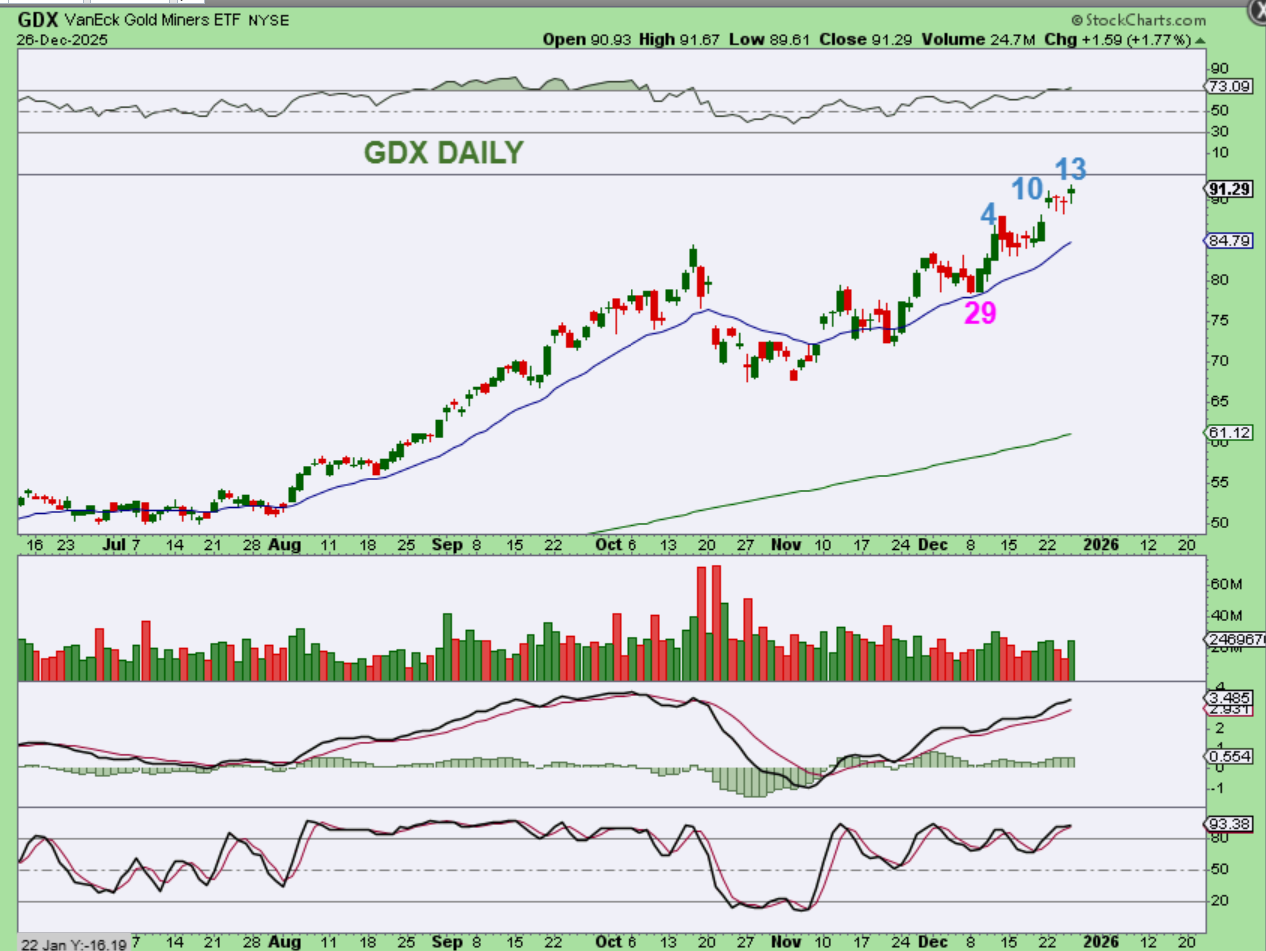
GDX is more similar to Gold, so it has broken out and appears to be on day 13 as a peak so far. As you can see, Miners went sideways last week despite Silvers massive ramp up and Golds 5 day run higher.
.
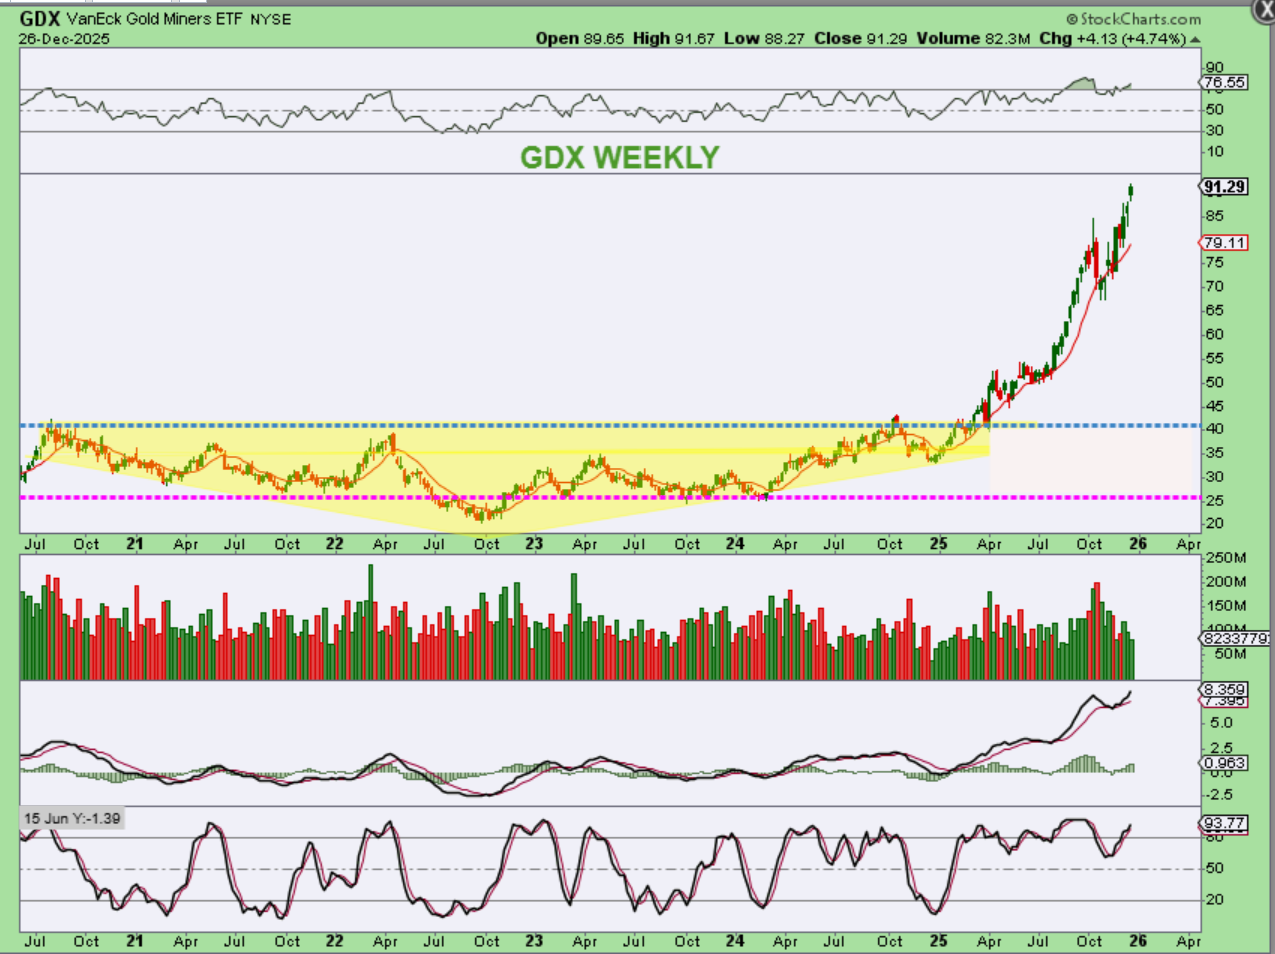
GDX WEEKLY – 2025 was a stellar year for Miners though. We simply may be seeing a final run higher here. I can see this as a 5th wave. I can also see the pattern of A-B = C-D if you start from the breakout of July. It can still run higher for now.
.
GDX can still run higher, since A-B = C-D has more room to run, but if Silver finally drops and Gold follows, we’d expect the Miners to drop too.

.
So the Bulls are still firmly in control and last weeks ‘Santa rally’ did play out with prices running higher. That can continue next week too, and a ‘Santa Rally’ often does continue into January. That said, we need to address Silvers recent ramp up in realistic terms, so I am going to do that below, and Bitcoin will follow.
.
I hope you are all having a great weekend, thanks for being here at Chartfreak with me!
.
~ALEX
..
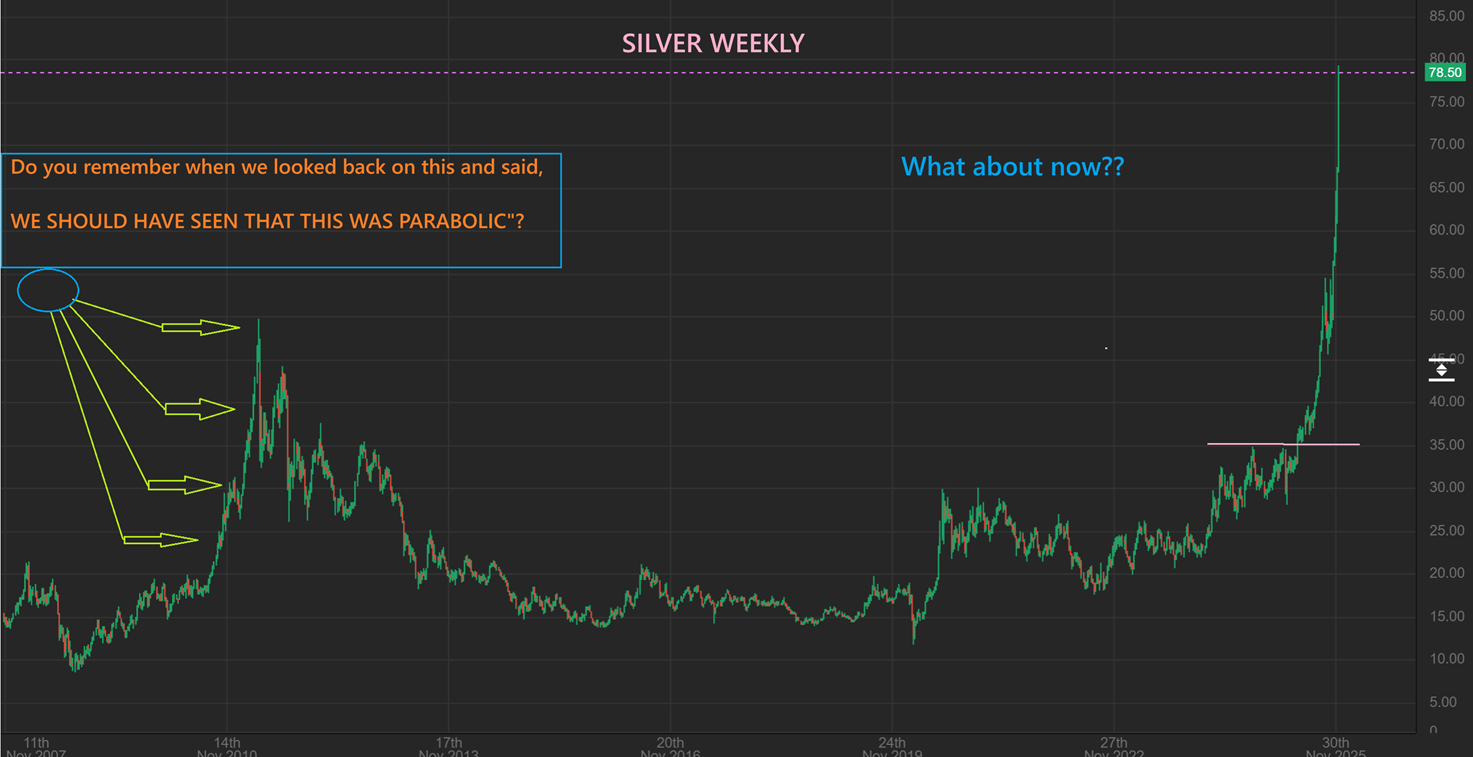
I want to show you what happened in 2011, when Silver had that ‘blow off top’. When that parabolic run took place, many thought that it was normal and could continue higher and higher to $100. Some may think that this is the case with Silver now too, I have heard some mention $100, $200, and even $300 on ‘X’ (Twitter). IF THAT HAPPENS, it will probably come after some multi-month consolidations, so I want to just review the 2011 run for your benefit.
.
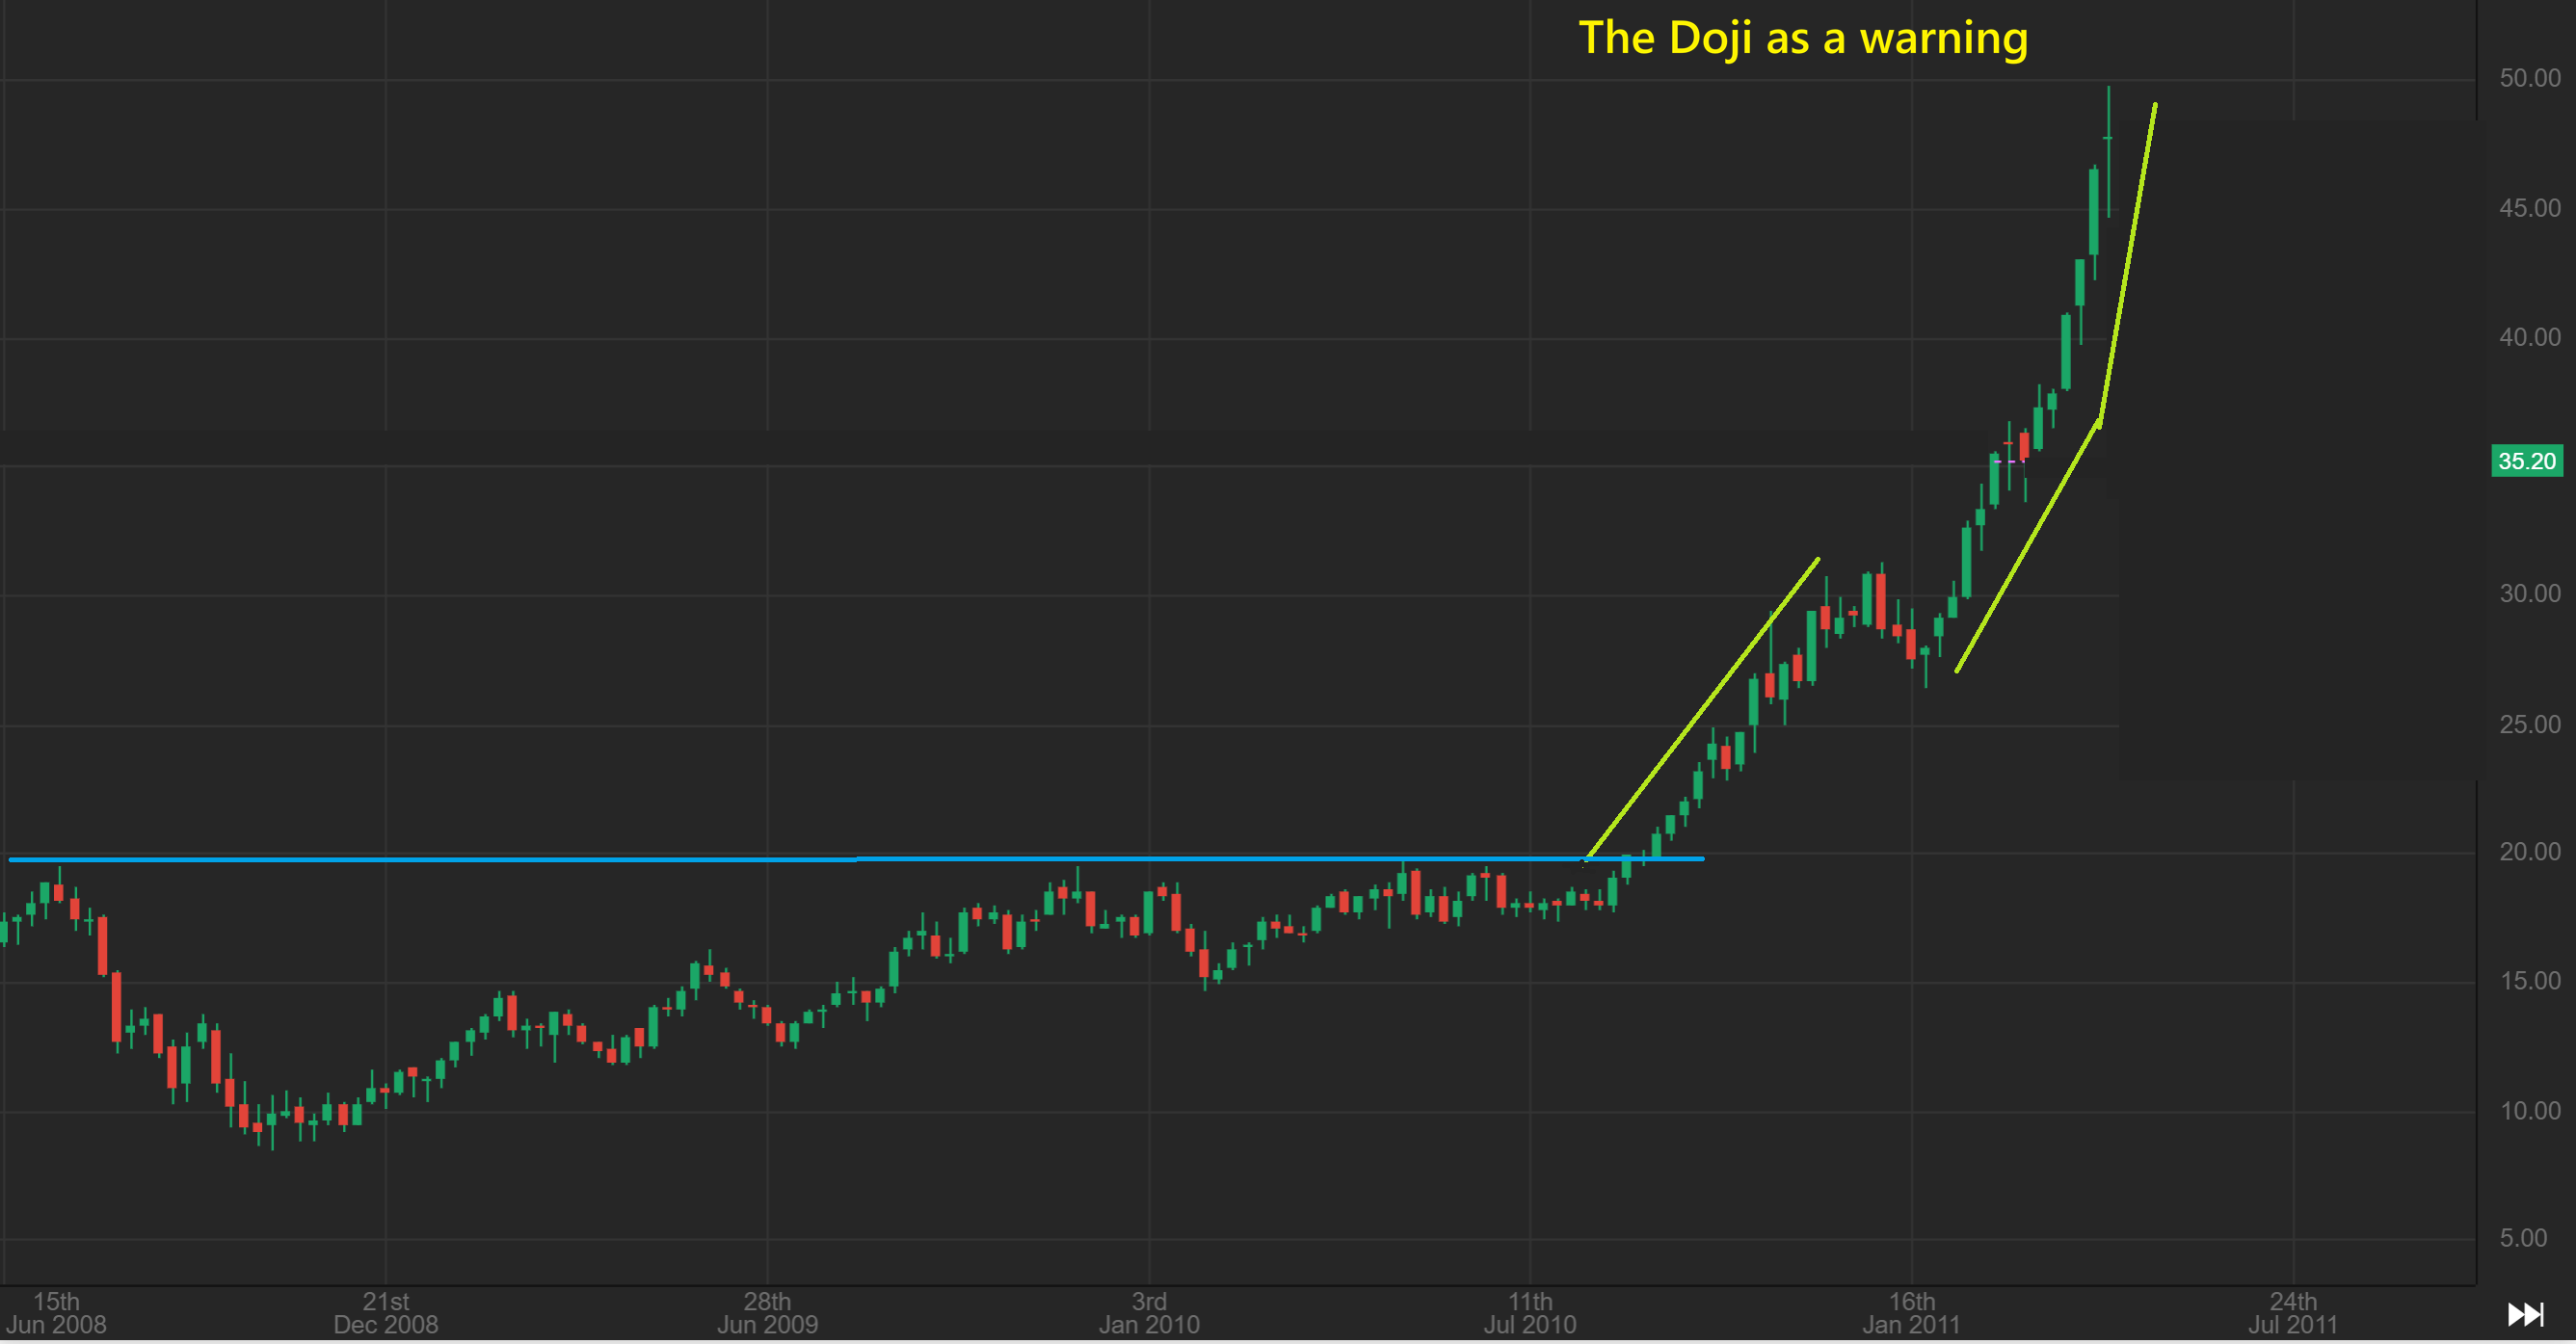
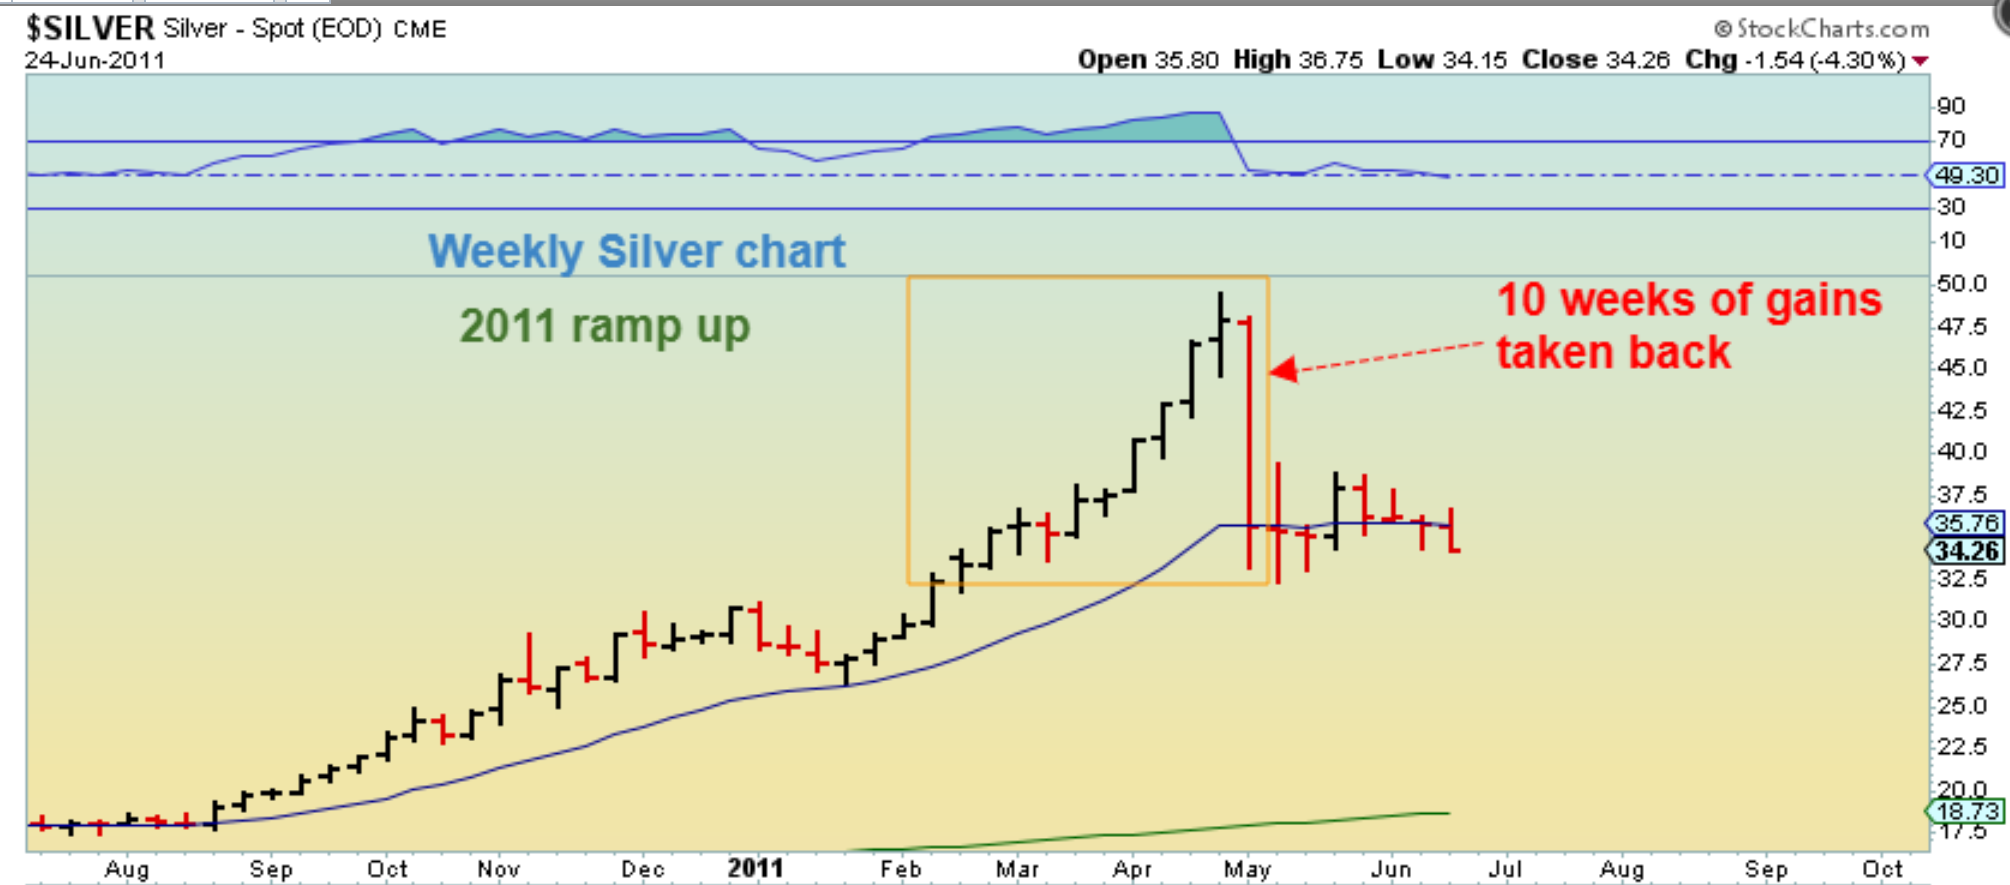
THIS IS THE SILVER WEEKLY CHART FOR 2011 –
Silver ran up week after week and it was very strong. It did give a doji warning, so that was good, but it was hard to sell yet, since Silver just moved higher week after week after week. If you were holding SILVER, SLV, or AGQ – you made big gains week after week after week. However when the music stopped…
.
SILVER WEEKLY 2011 – When silver sold off, it only took 1 week to erase 10 weeks of those gains (& AGQ is leveraged, so it was bad). And like I said…
.
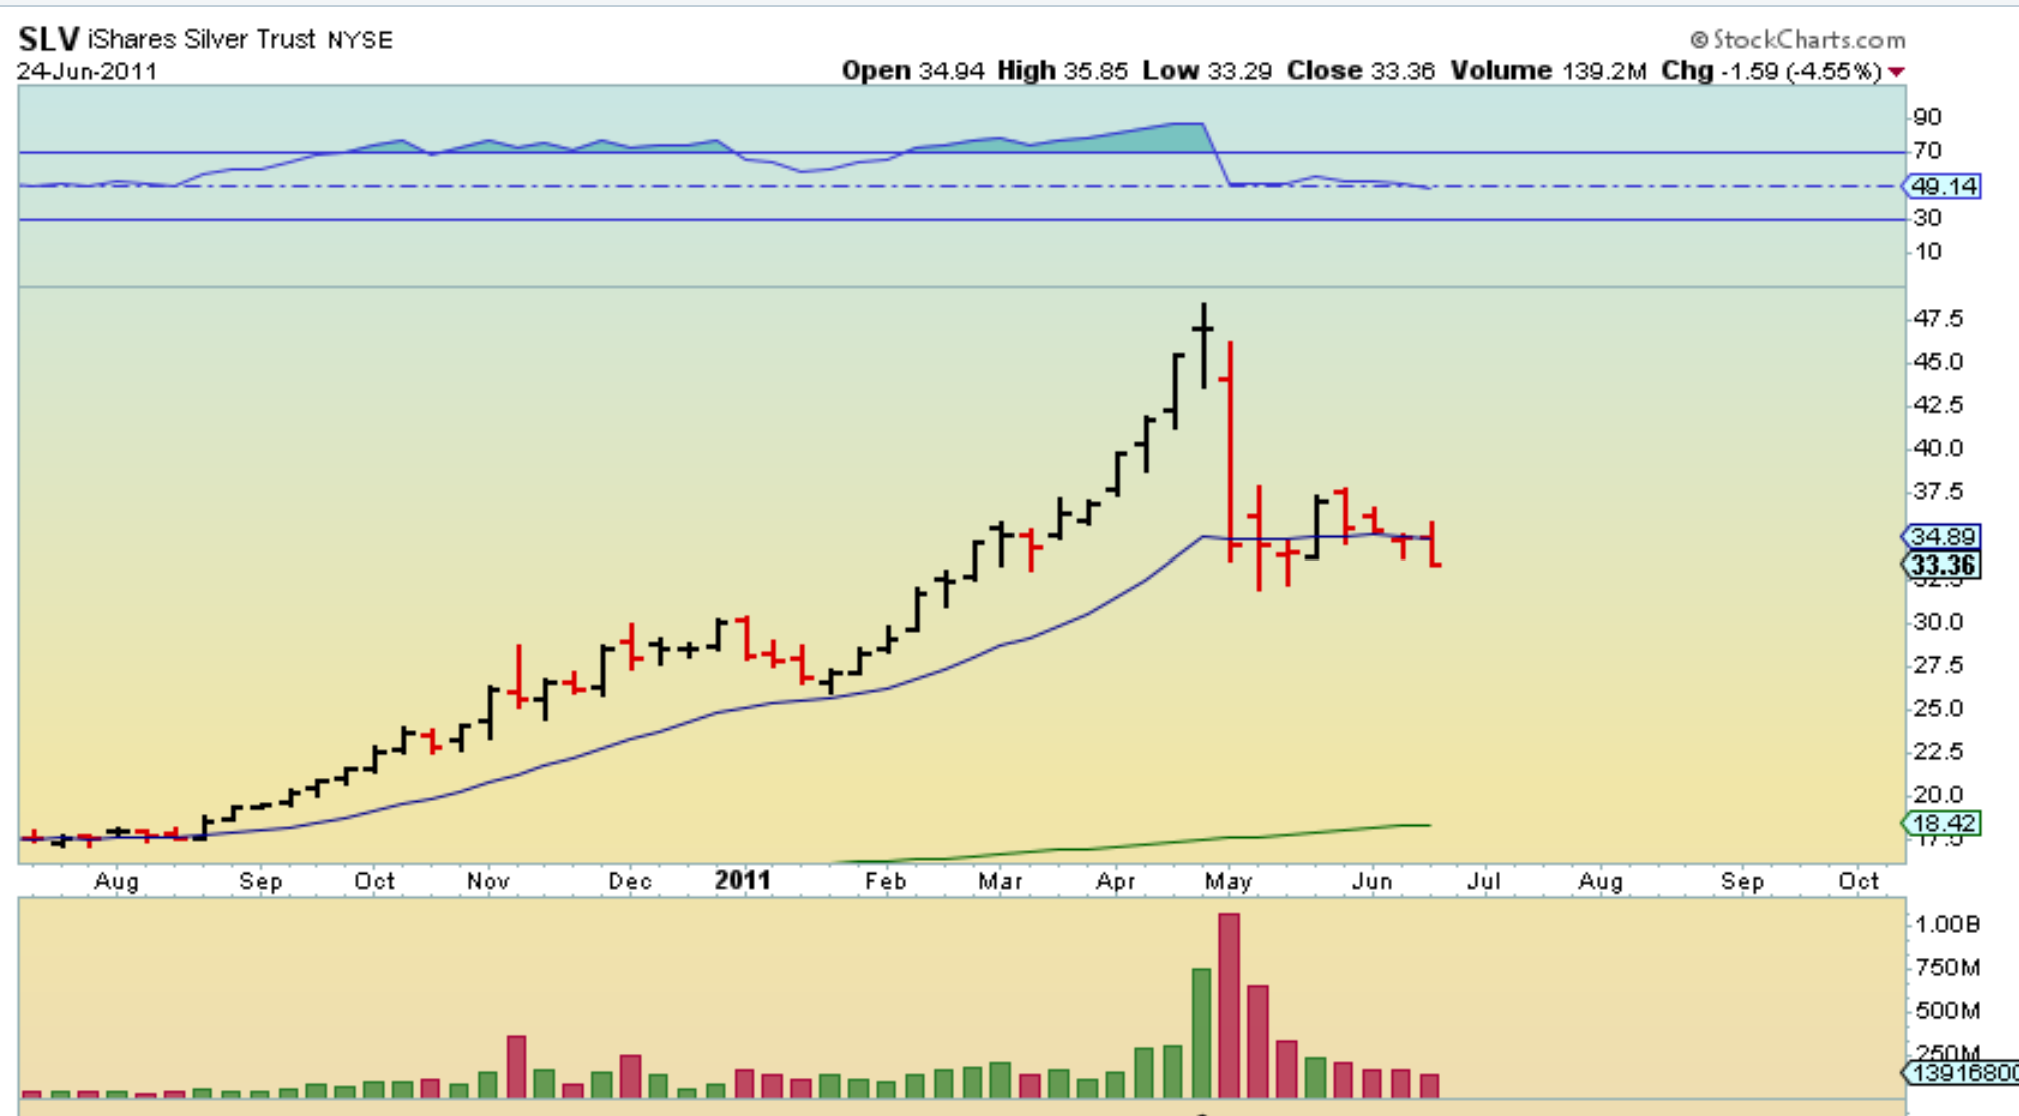
If you were in SLV, you also made great gains from that reversal at support with about 13 weeks of upward rally. Now look at that 1 week drop- it erased up 10 weeks of gains. So this is a little sobering when it comes to parabolic runs. They become unsustainable and often when sellers head for the exits, they all cash out at once. Next…
.
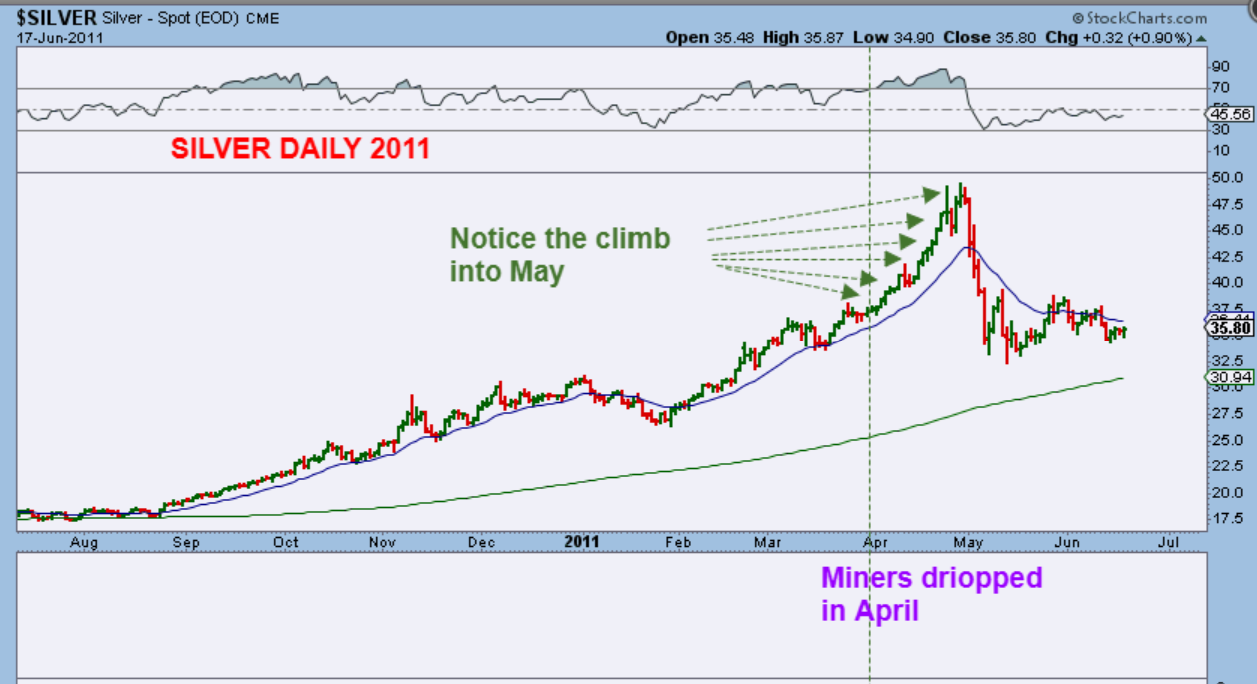
SILVER DAILY 2011 –
IMPORTANT TO ME: Next is the daily chart. Silver climbed day after day after day from March into MAY, right? Look at April where I put the dotted vertical line. Just about all of April was green, green, green. Why is that important to me? That Silver had a massive rally from $37 to $50 in all of April?
..
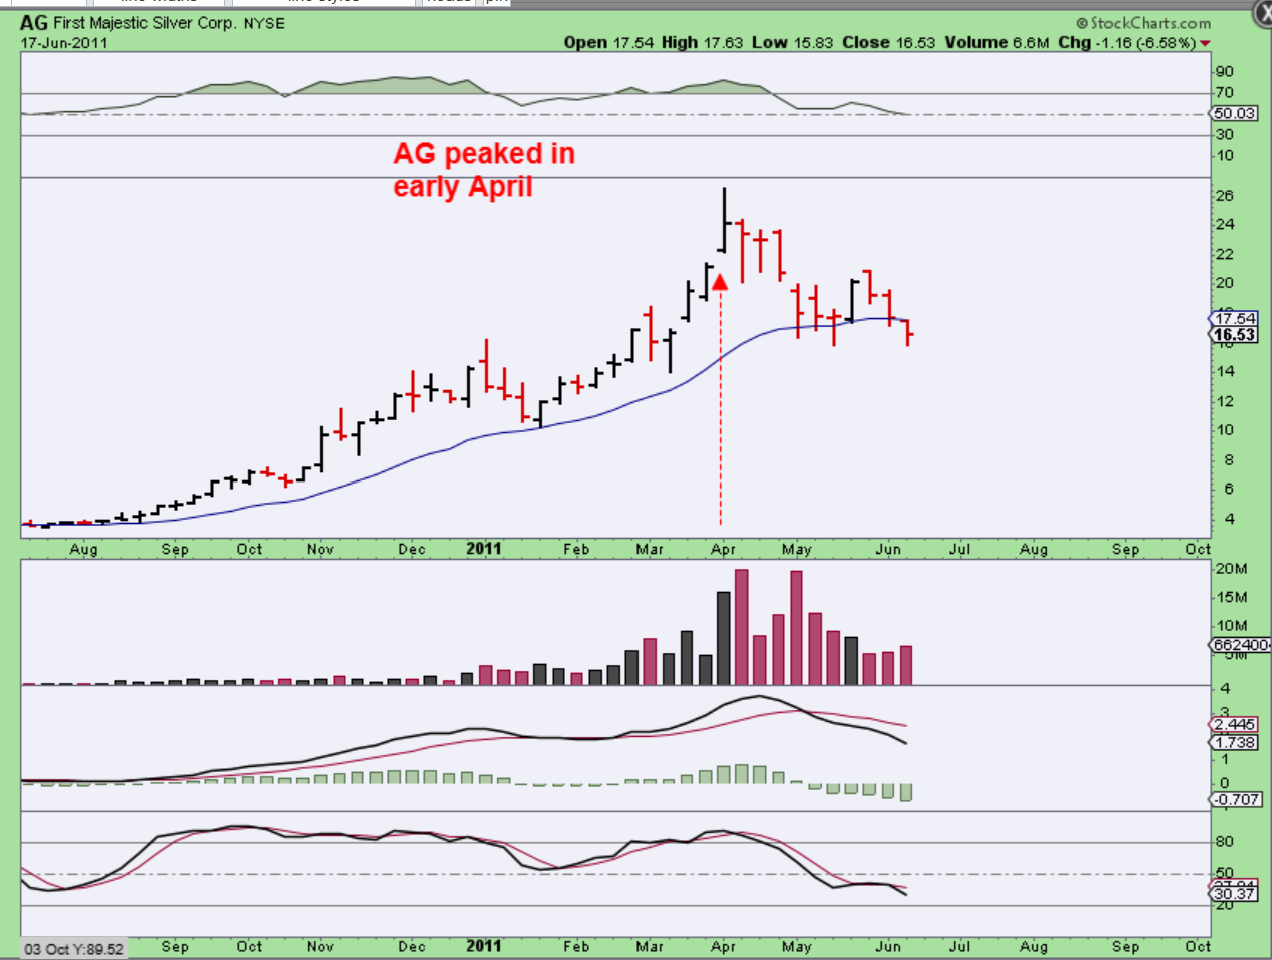
Take a look at AG 2011:
Ag peaked early in April and while Silver ran from $37 to $50 in a massive April rally, AG was selling off. Please look at this chart.

.
AG peaked in early Aprl in 2011 while silver shot straight up. Was this an isolated case?
.
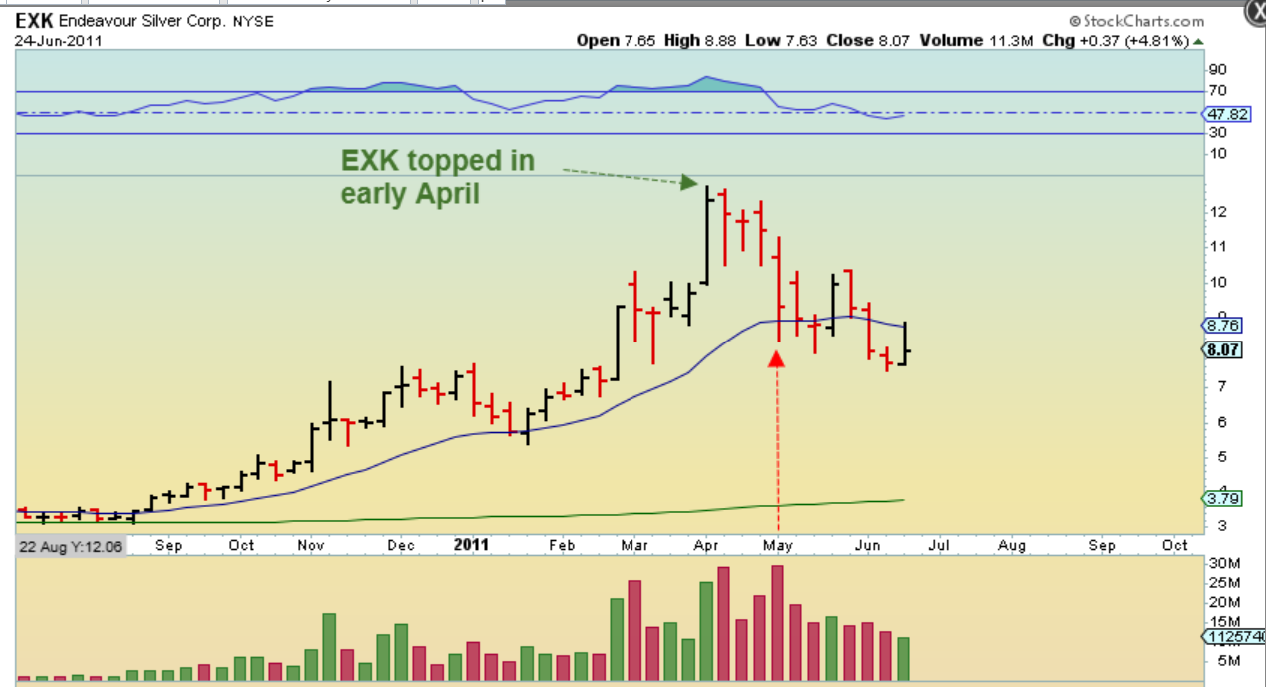
EXK peaked in early April as Silver made that parabolic run into early May too.
.
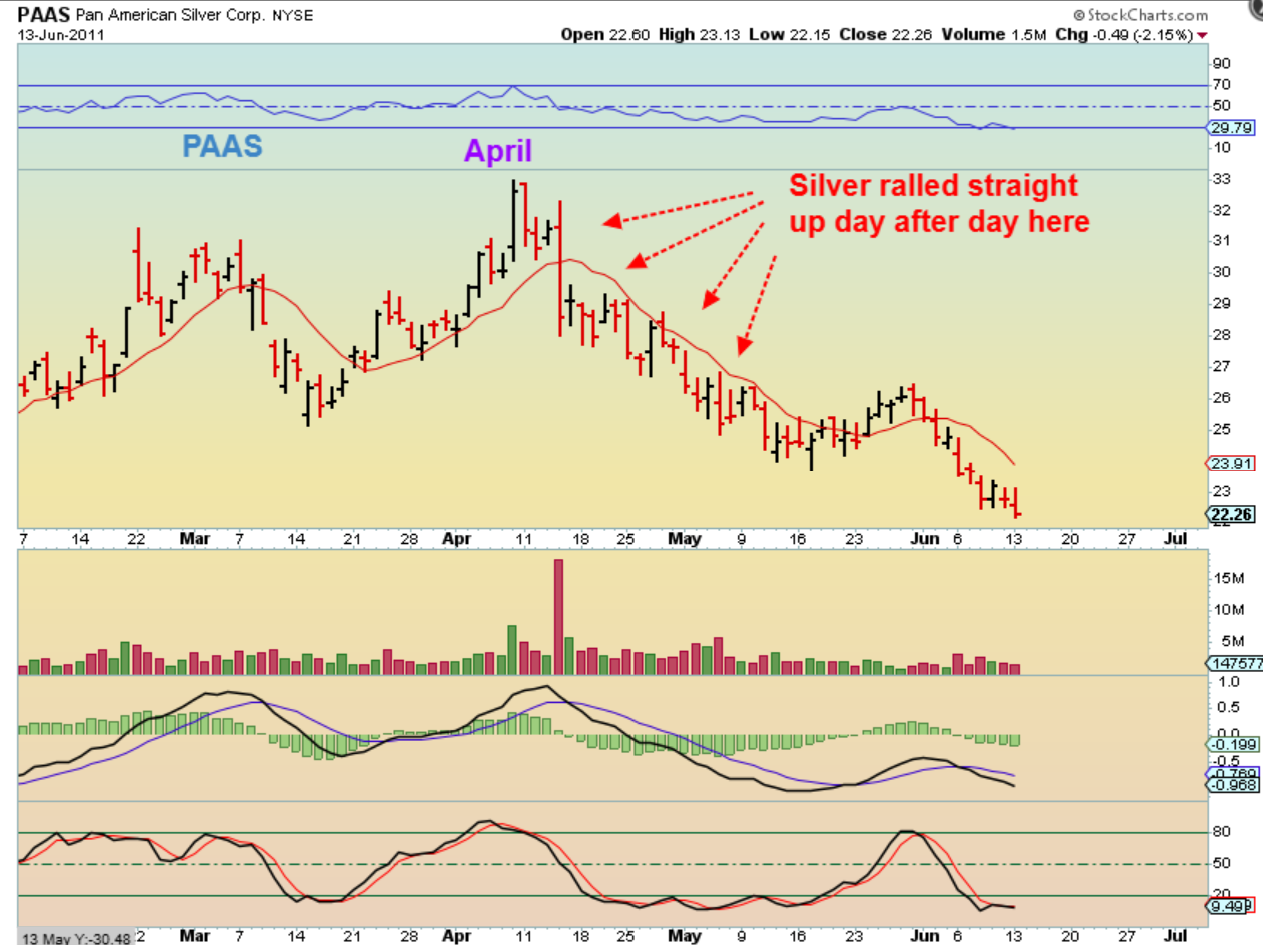
PAAS peaked in early April as Silver ran from $37 to $50 day after day after day.
.
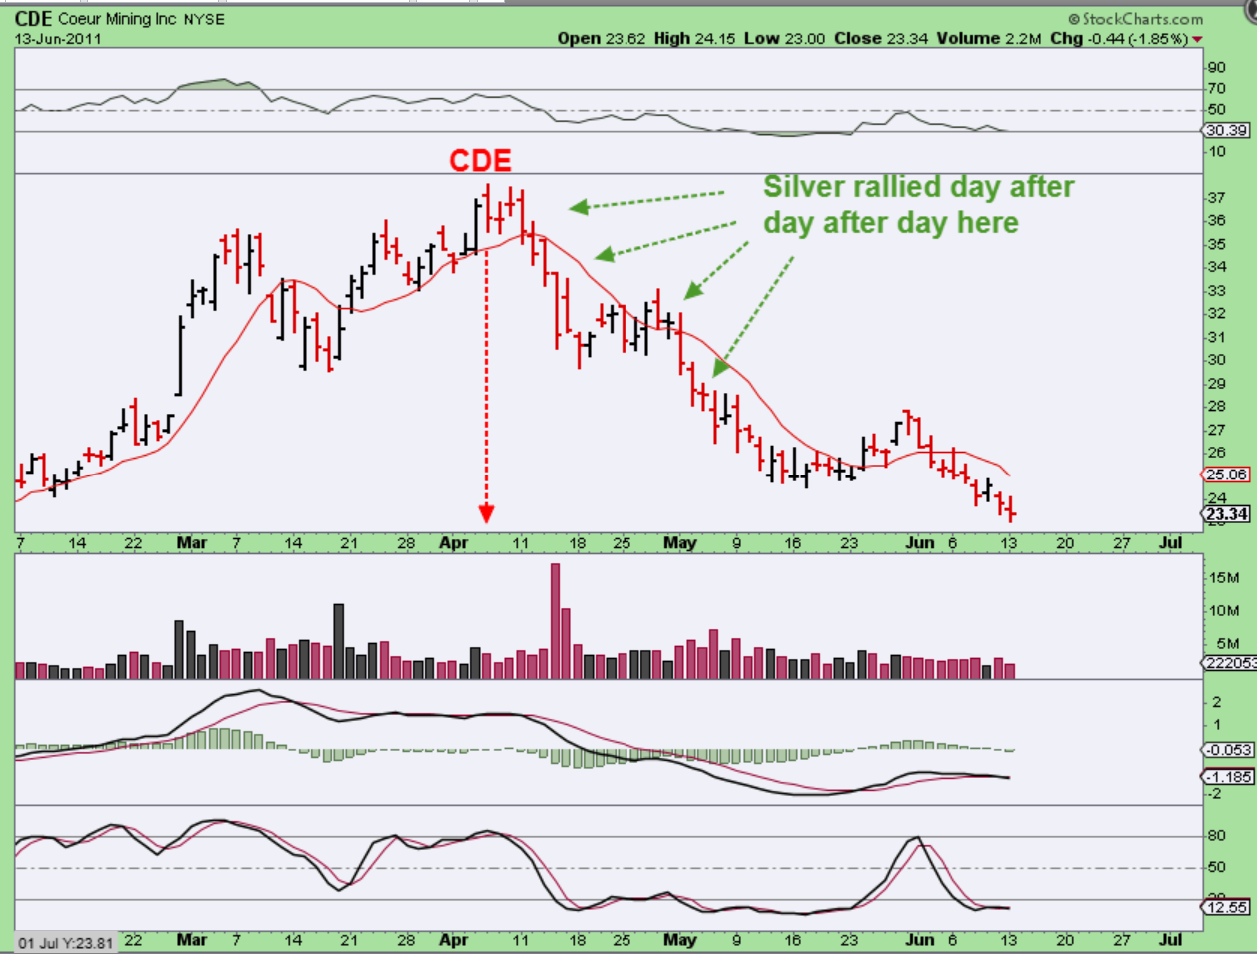
CDE peaked a month before Silver too. Well, I guess that our next guess would be, “Maybe the stock markets crashed heading into May, and dragged down the Miners?”
.
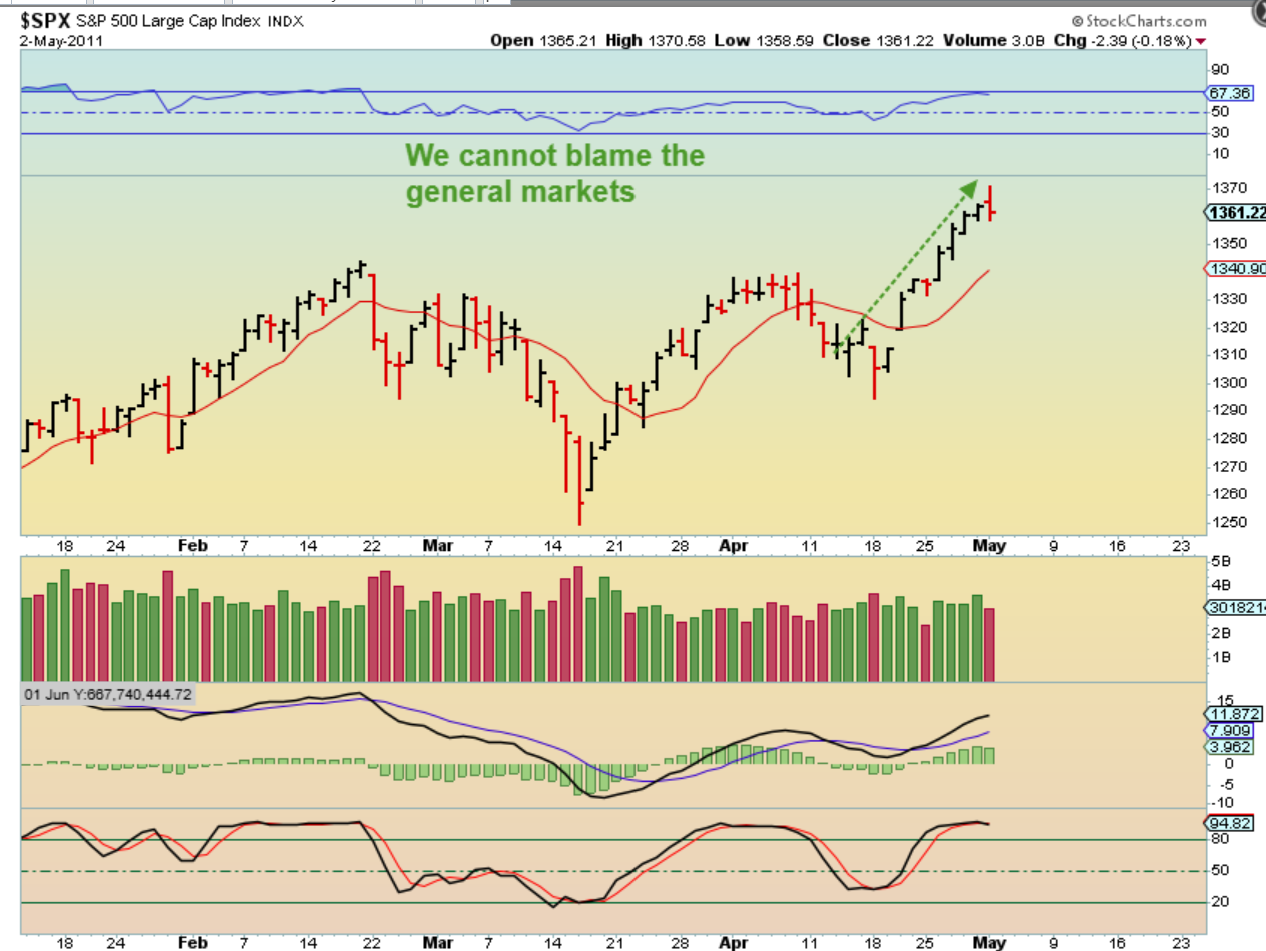
Well, I guess that our next guess would be, “Maybe the stock markets crashed heading into May, and dragged down the Miners?”
.
No, the stock markets actually looked exactly like they do right now. I see a dip into an ICL and then a half cycle low that rallied to new highs from April into May. So the general markets were rallying to new all-time highs, Silver was a Rocketship higher into May, and Silver stocks dropped. Smart money may have been selling into the buying.
..
Conclusion: I have been a little frustrated holding EXK, AG, CDE and seeing Silver rocket higher day after day, while my Major silver stocks do a little pop and drop here and there. I was actually trading in 2011, but I forgot that the Miners often lead and they topped first, by a month. After this review for myself and for you, I am thinking that Smart Money knows what may be coming with Silvers blow off top, and they want to sell their Miners to the late-comers that are now buying, because silver is so strong.
.
This reinforces the idea that Silver may be ready to top at any time.
.
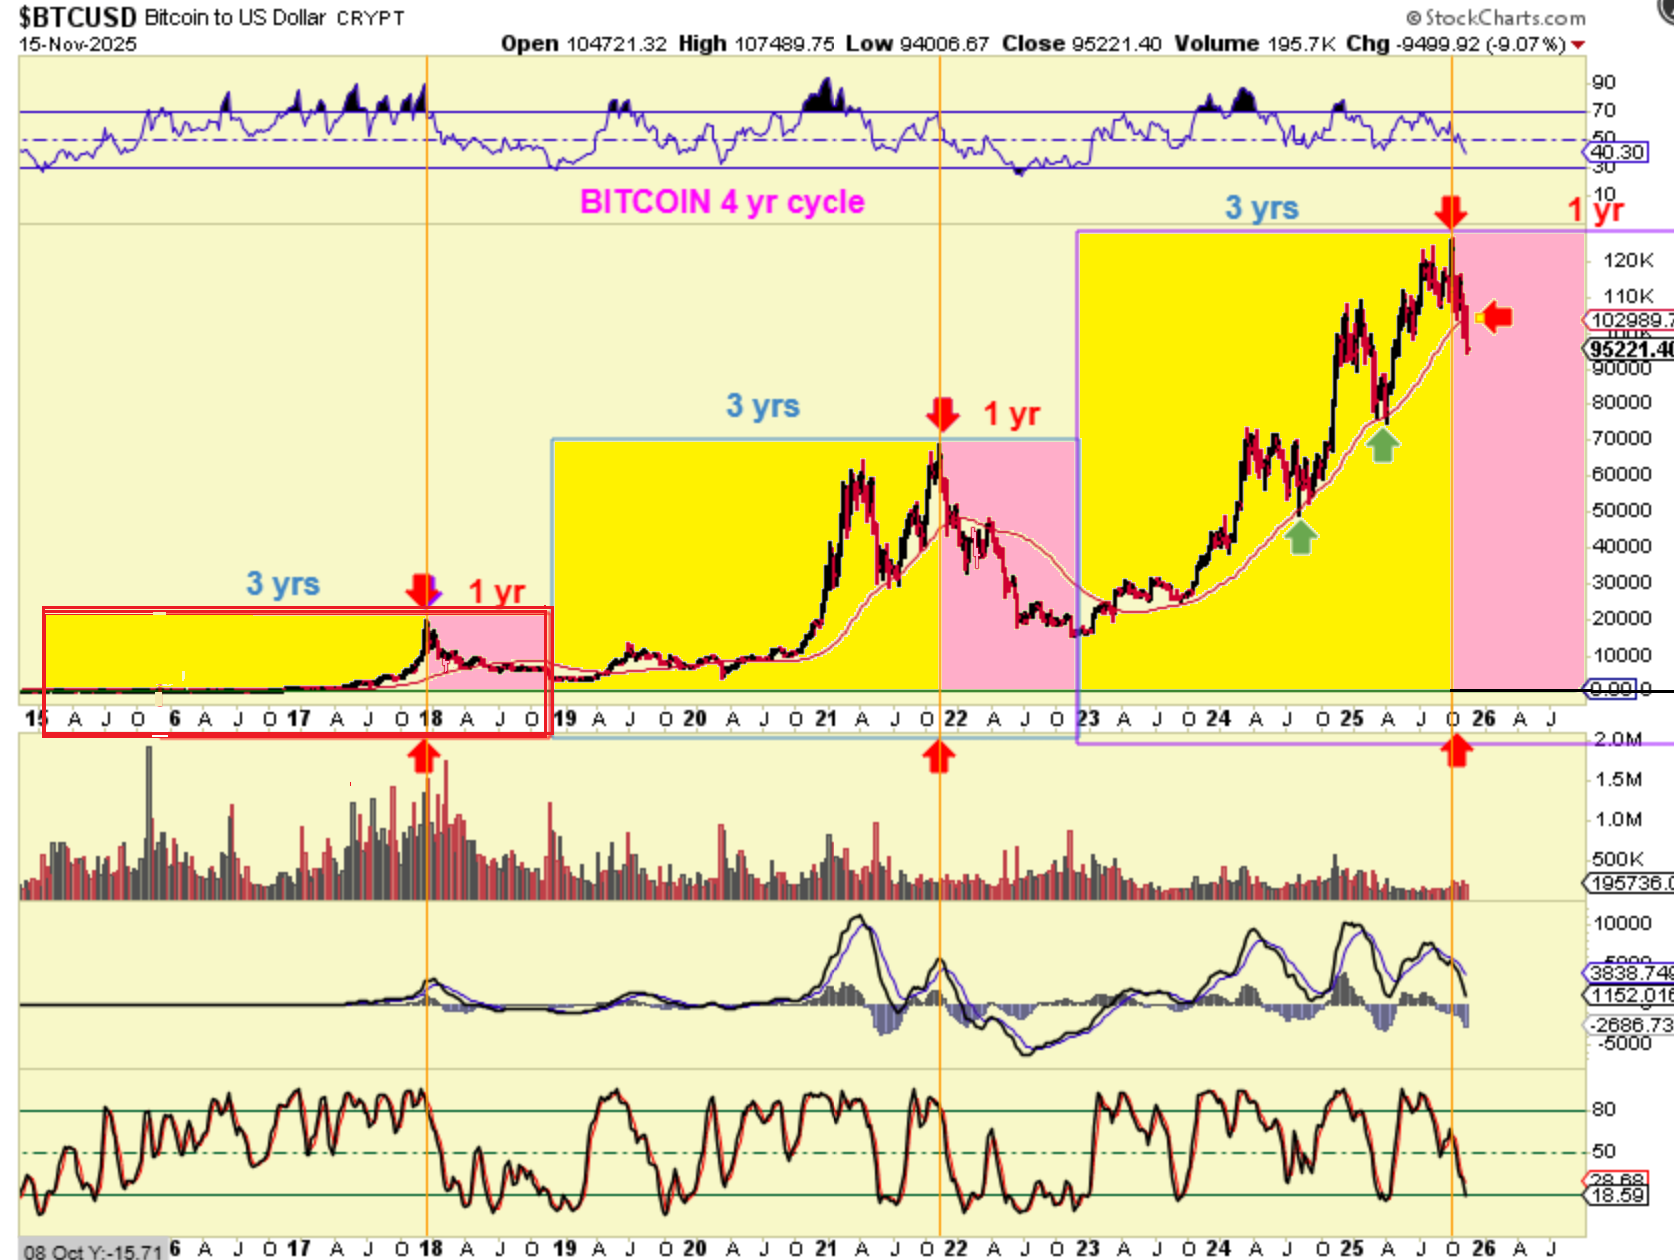
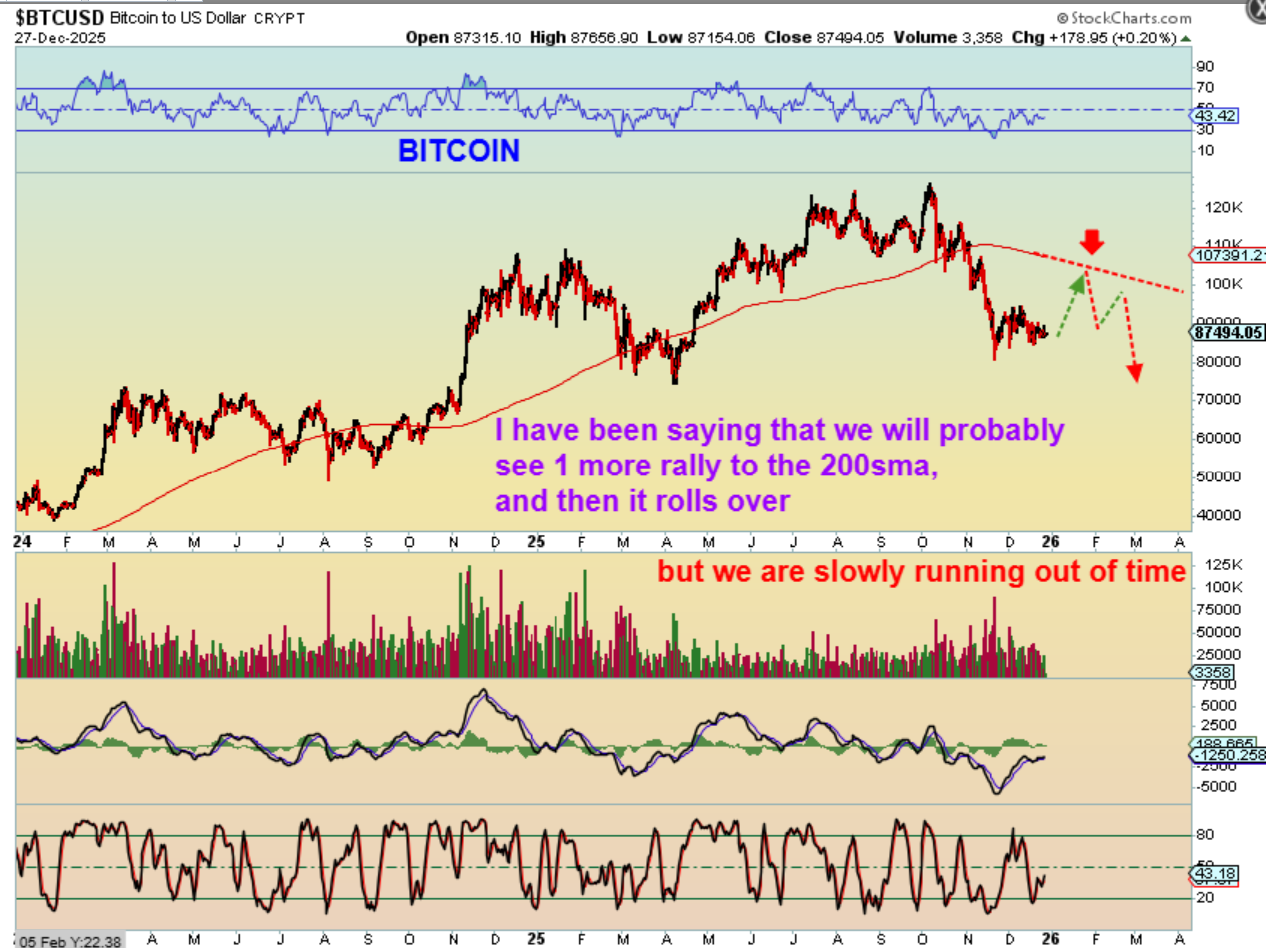
BITCOIN –We are halfway through the 60-day daily cycle and Bitcoin has not been able to run higher. Please read the chart.
.
BITCOIN
As a reminder, I have been posting charts of the 4 year cycle like this all through 2025, as a reminder that we could peak in the end of 2025. I had this in our November 15 report, and so far… it is playing out as expected.