December 20 Weekend Report
With Fridays trading to end the week, things look really good.
.
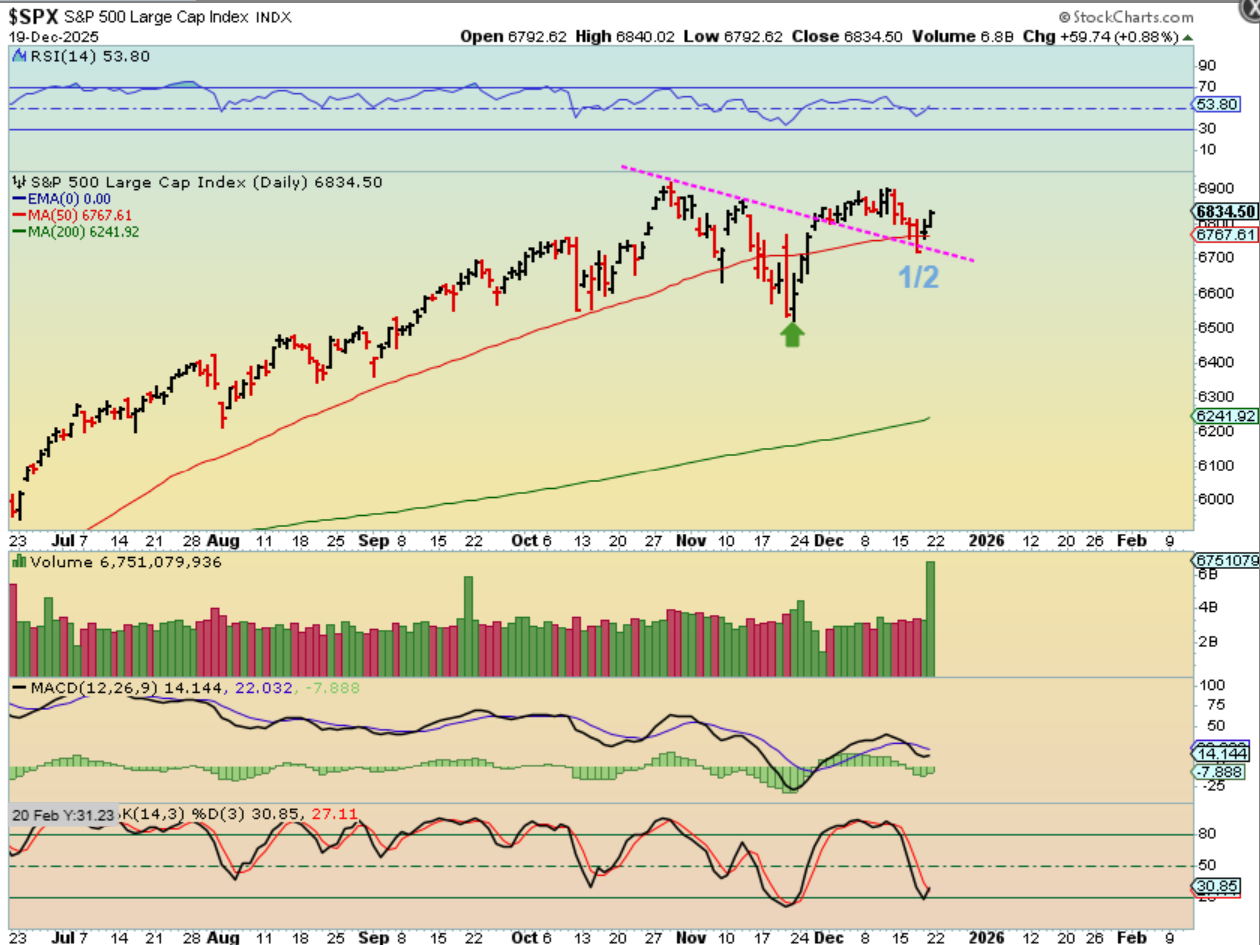
THE SPX does seem to have a half cycle low and a small shake out, and now on Friday, day 19, we are heading higher. THIS IS BULLISH.
.
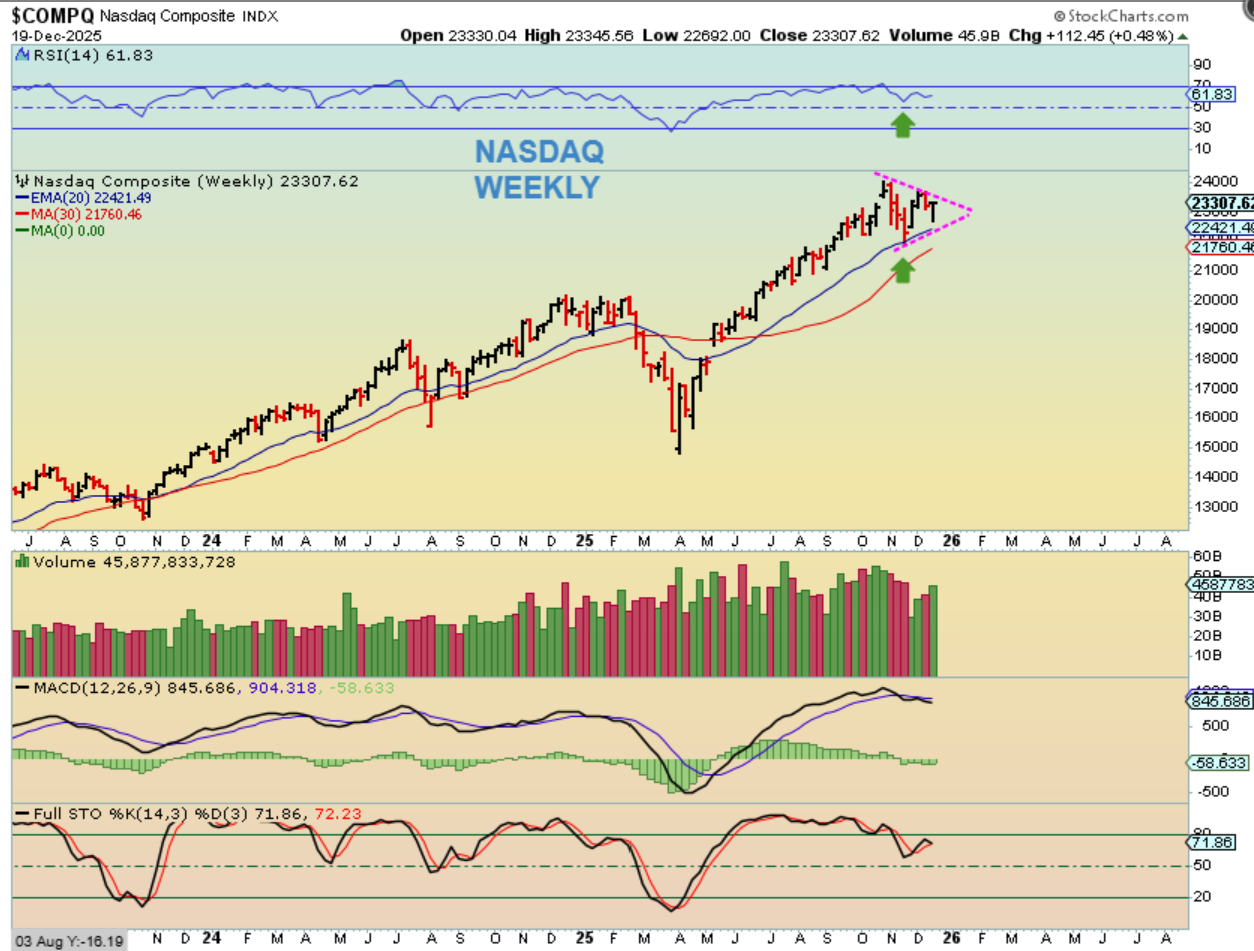
THE NASDAQ WEEKLY Chart shows a drop and recovery too. THIS IS BULLISH TOO.
.
Individual stocks that have been bullish and dipped lower with the dcl/ ICL are looking good too.
.
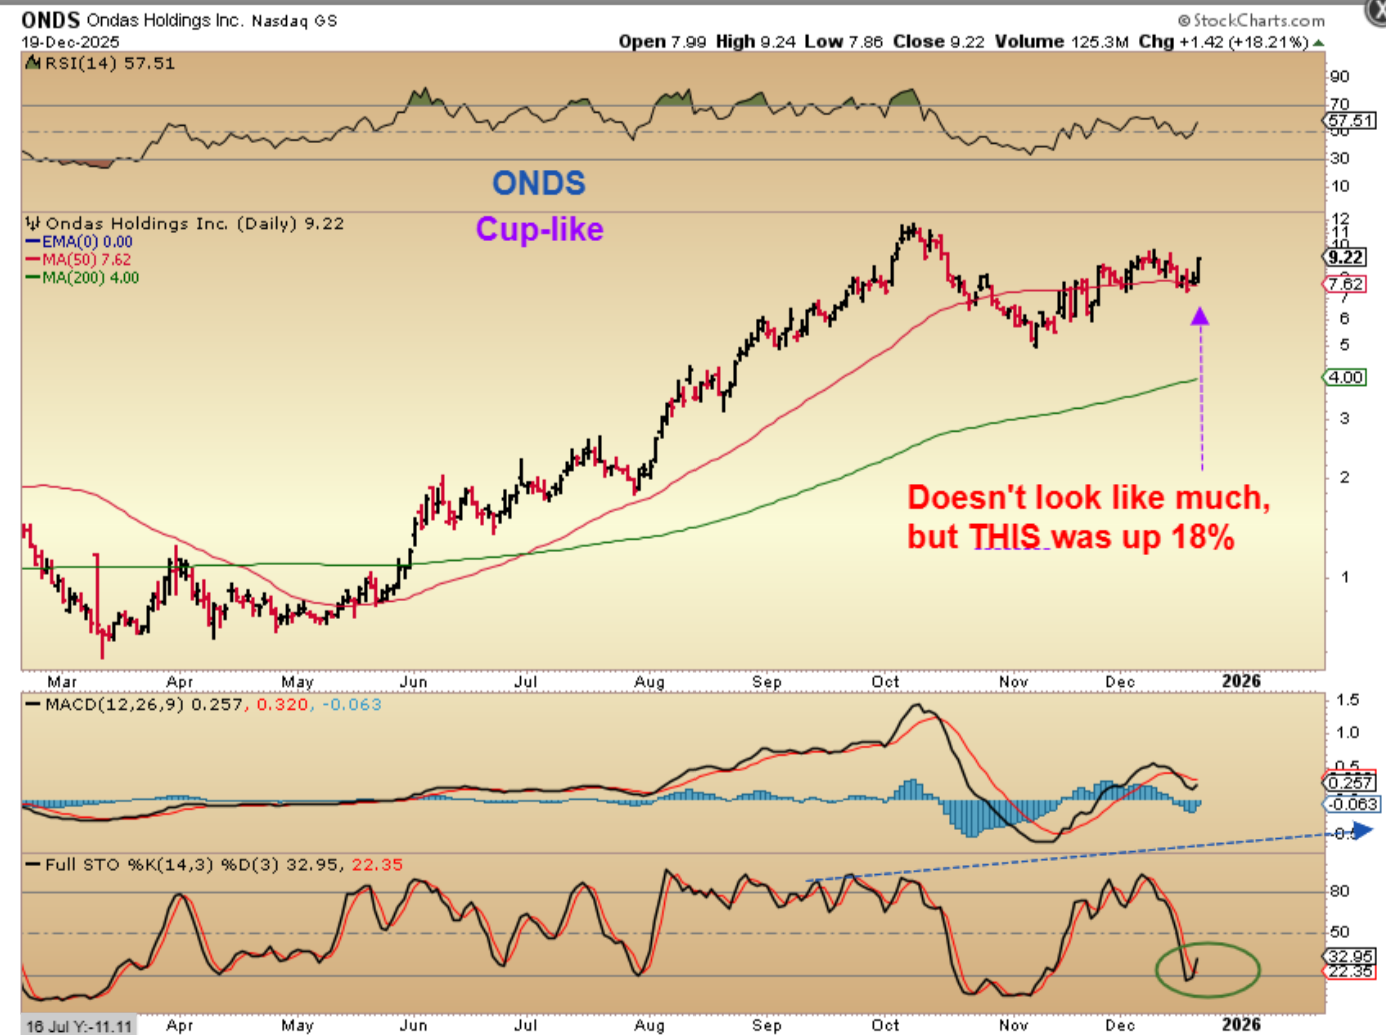
ONDS – This stock looks like a strong bull run (under $1 to $12) followed by an a-b-c down into an ICL, doesn’t it? And now after climbing up and along the red 50sma, it popped almost 20% on Friday. A stock like this could run nicely if the markets remain bullish.
.
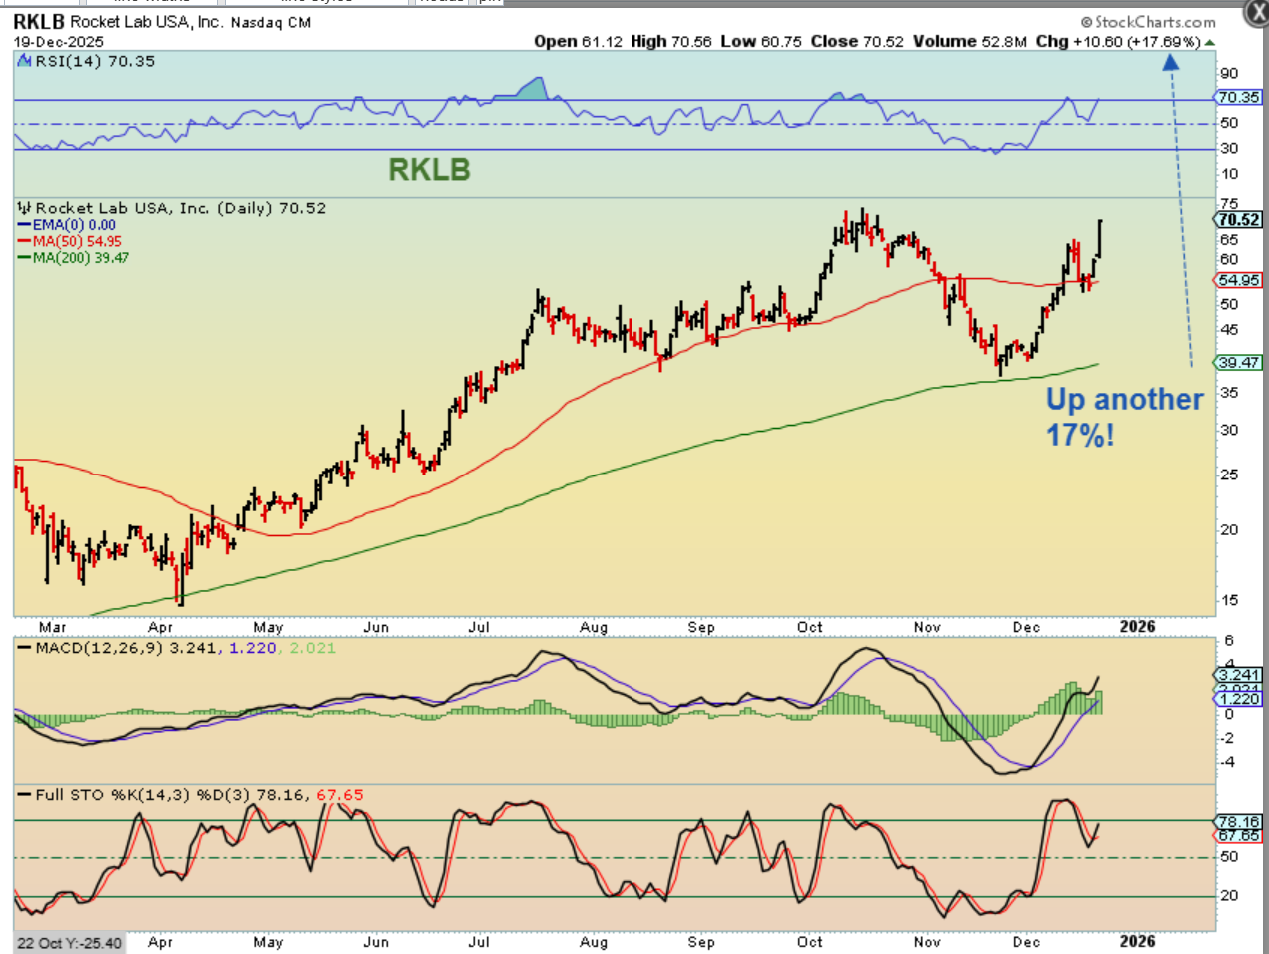
RKLB was in the reports as a buy (or add to current position from the 200sma) at the 50sma reversal. It also popped almost 20% Friday. It is up almost 100% from the dcl / ICL low.
.
BBAI reversed at the 200sma, it may be ready to go. IT ran up 11% on Friday.

.
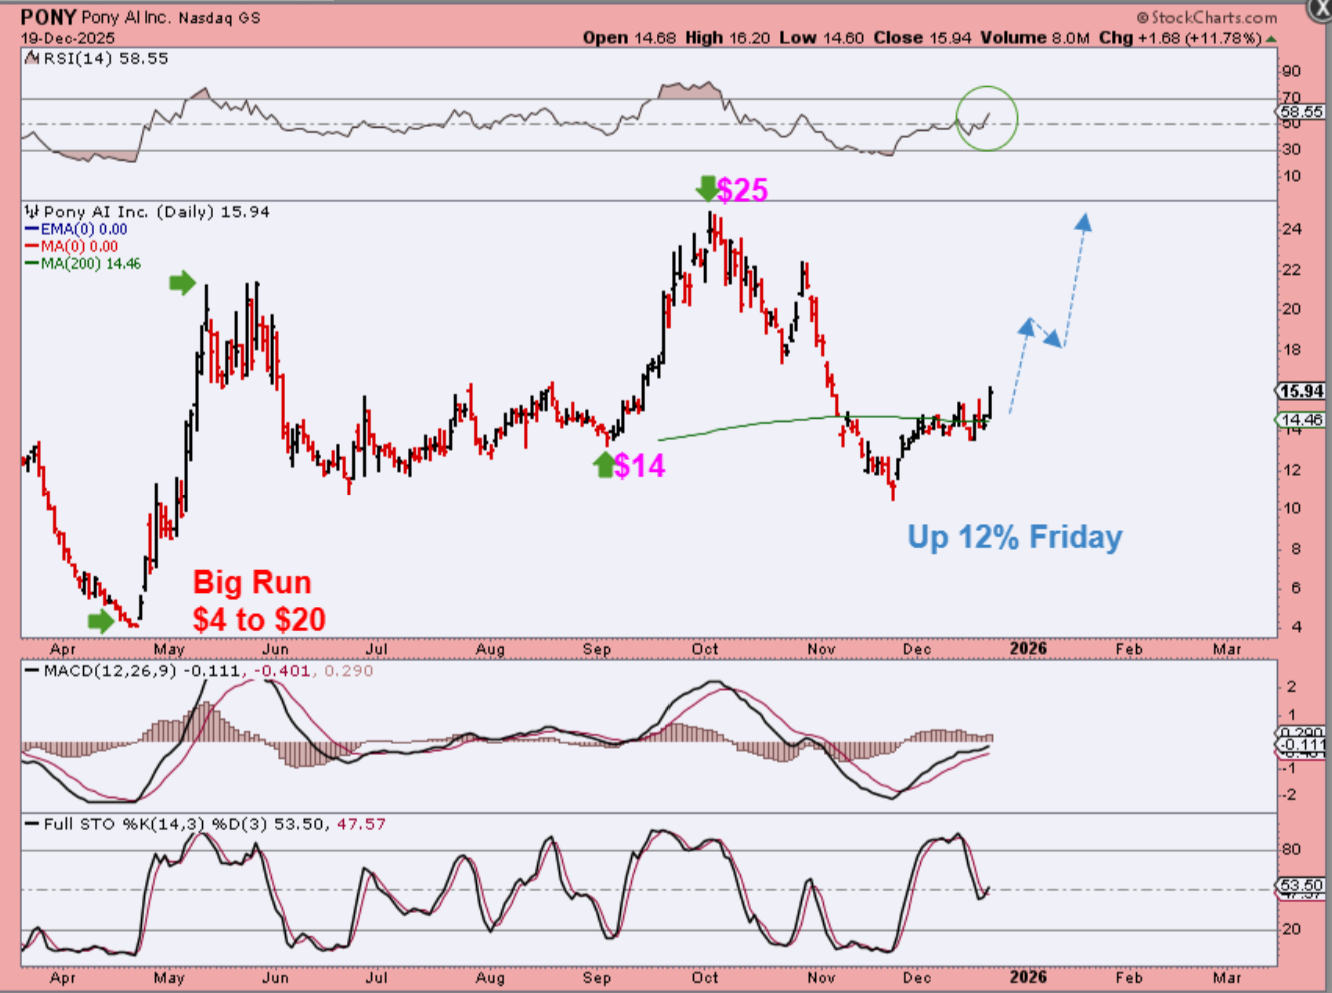
My Little PONY has great potential as an ‘AI’ Stock that has already released earnings 2 weeks ago and held up during the recent selling. It possed almost 12% Friday too.
.
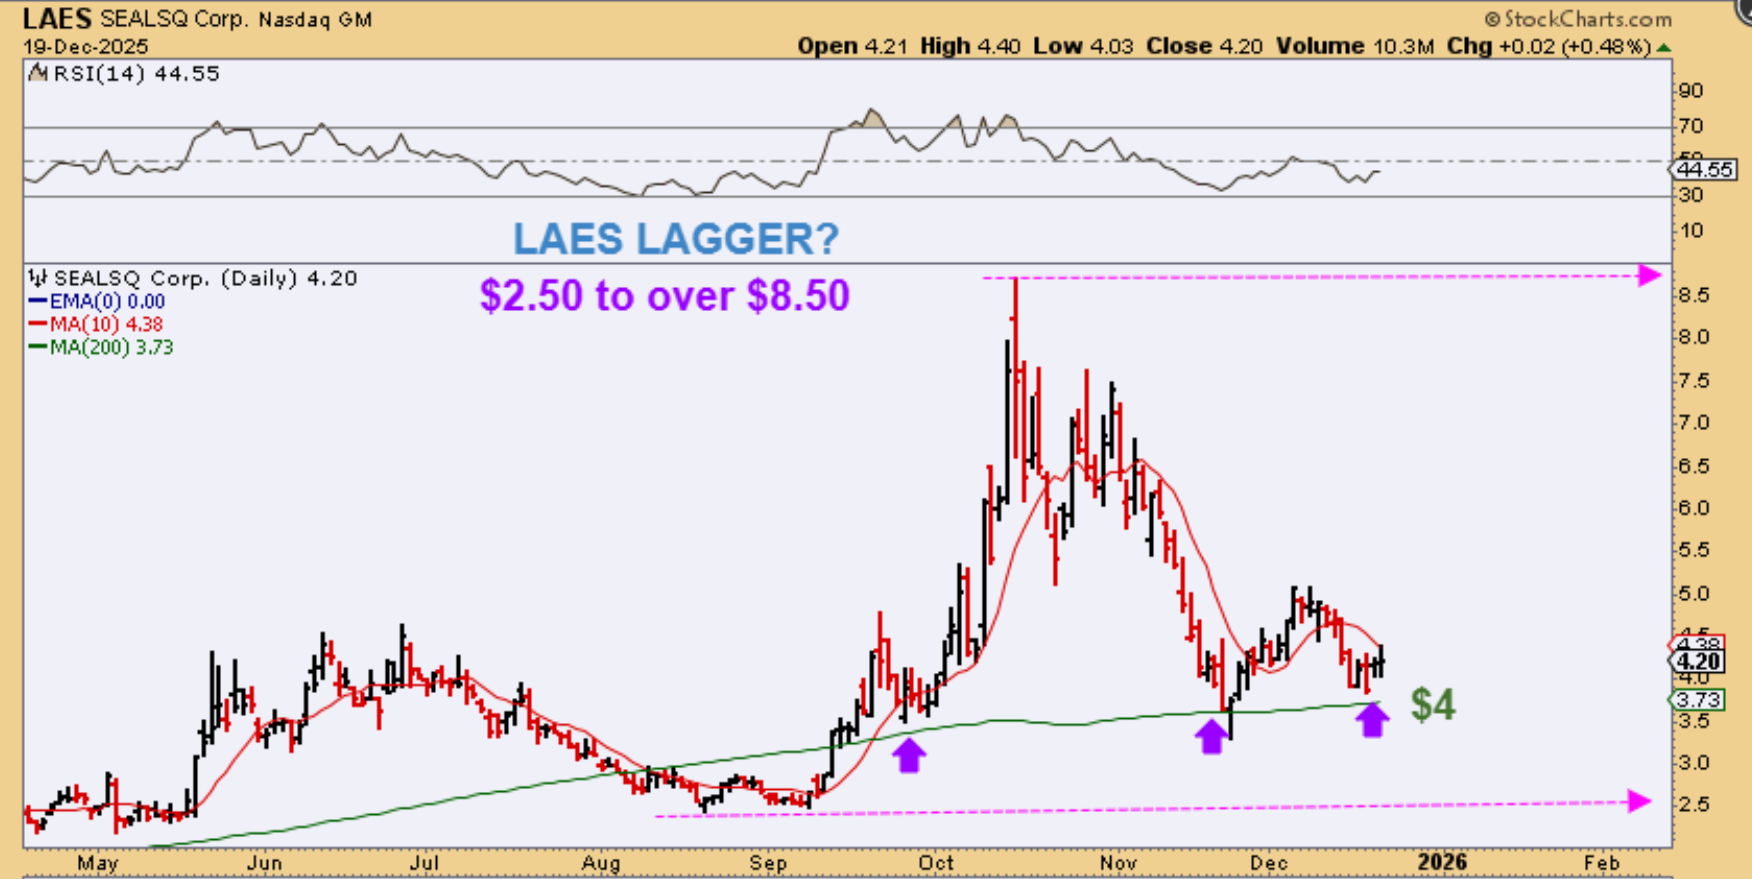
LAES is lagging, but it has had some strong rallies too. This could run up 100% or more if the markets remain bullish.
.
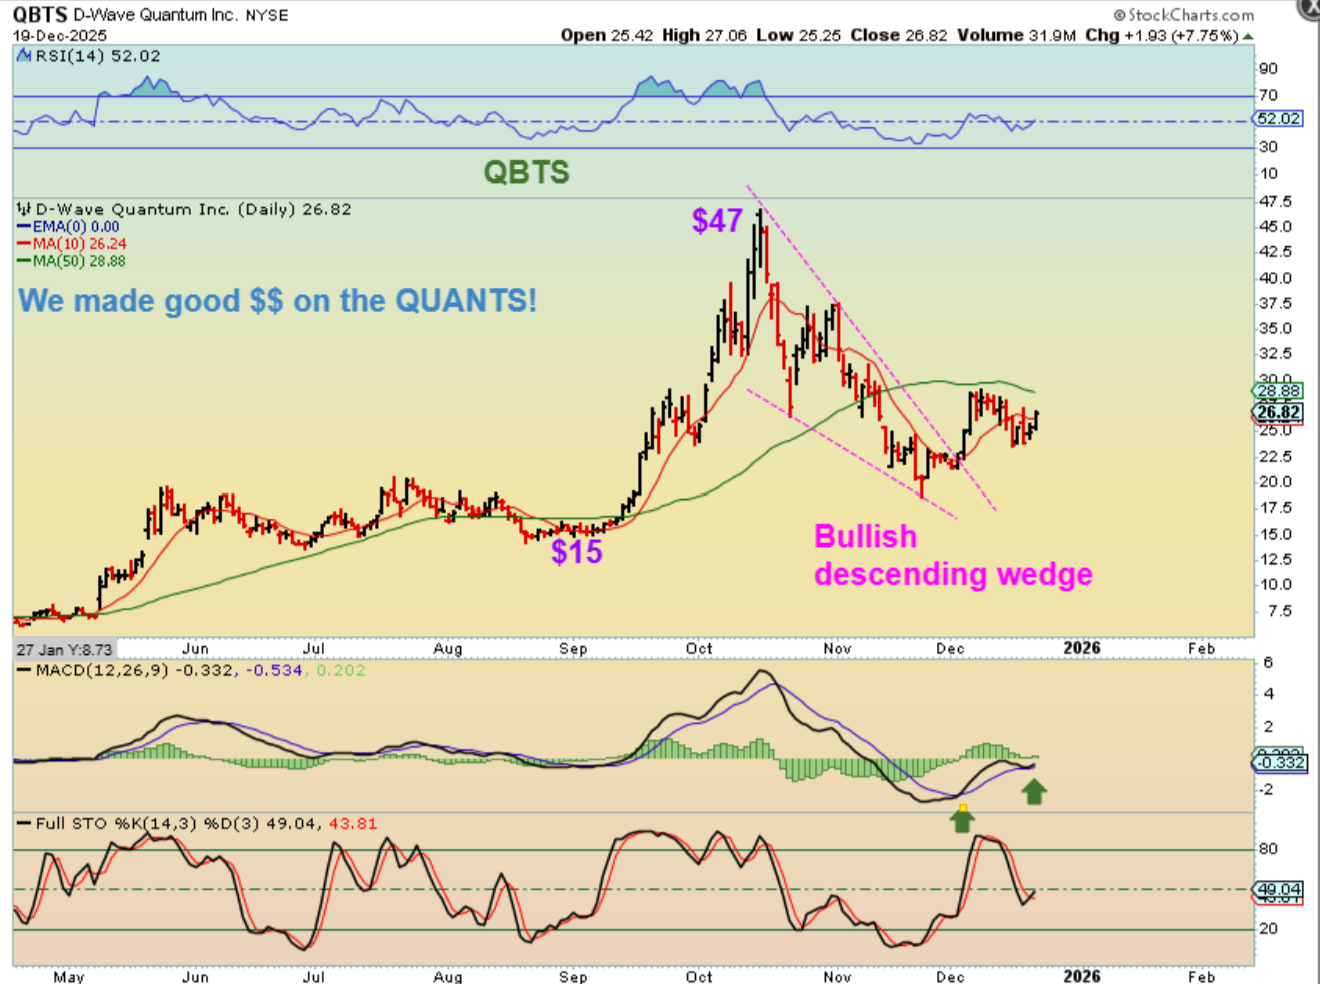
QBTS was up 7.75% on Friday, and when these get running, they can really tack on the gains. So again, if the markets remain bullish these should do very well.
.
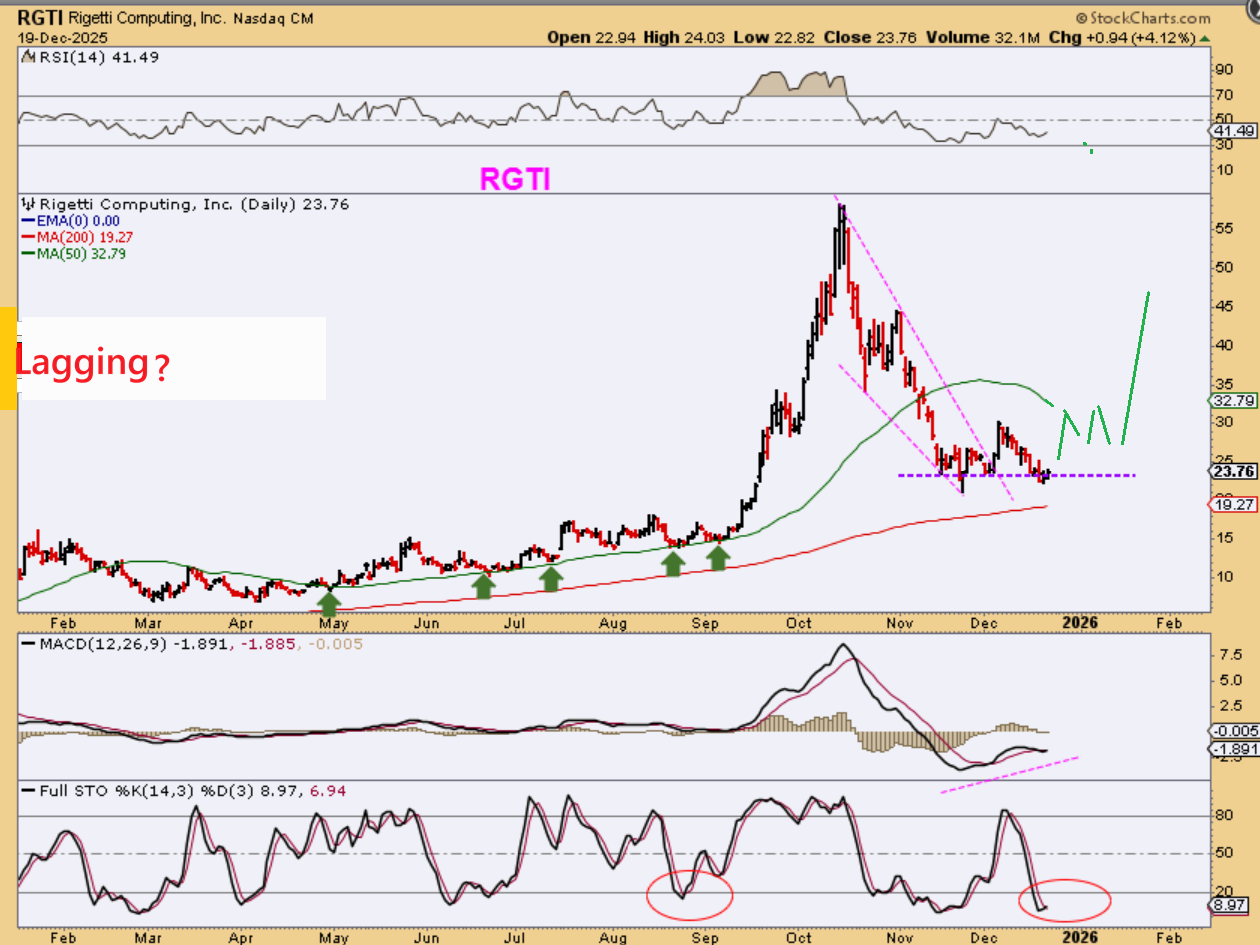
RGTI – Another Quant stock that is lagging a bit, but has great potential.
.
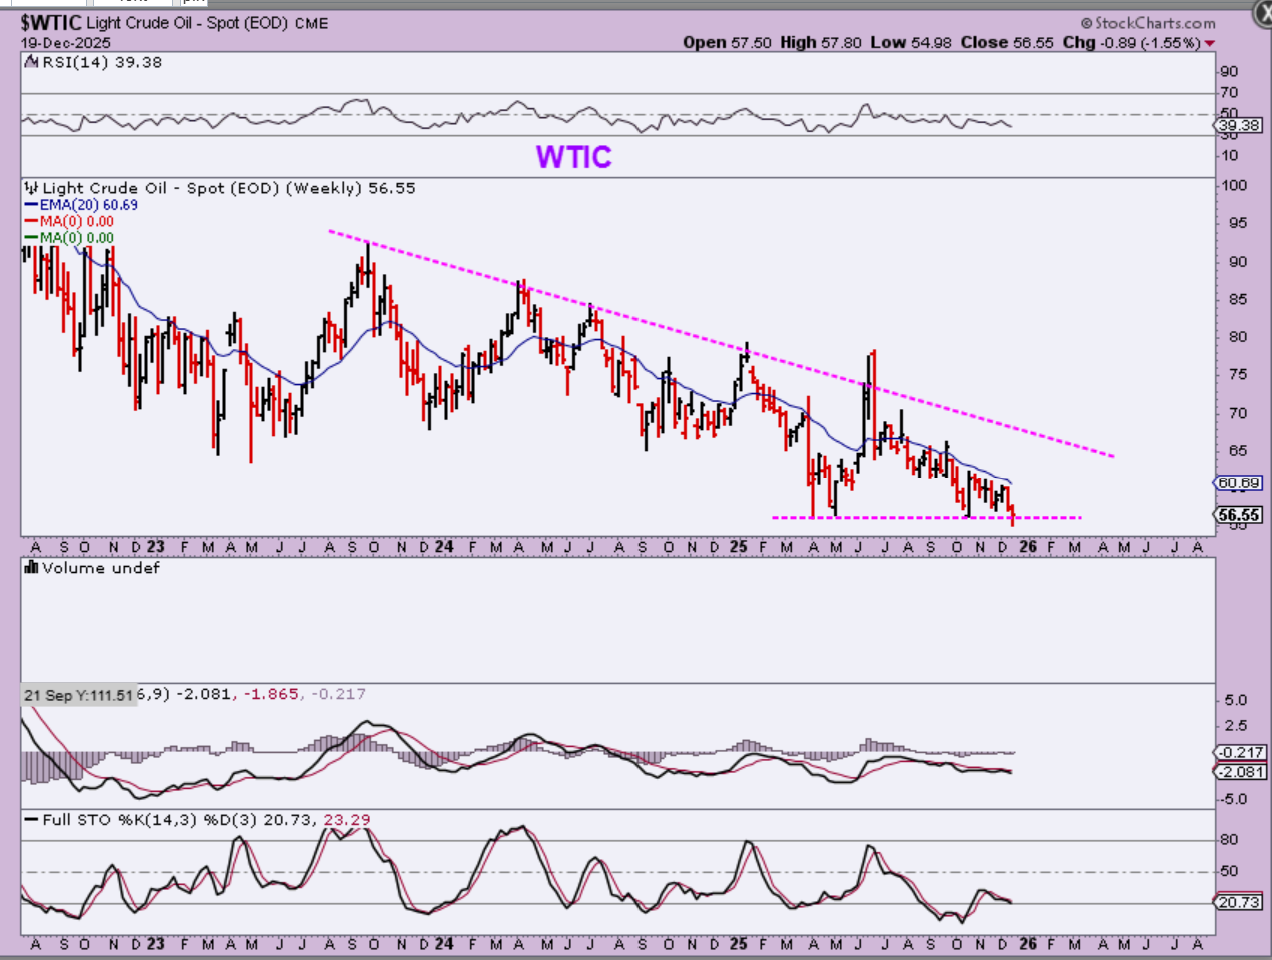
WTIC – Oil broke the lows and tried to recover.
.
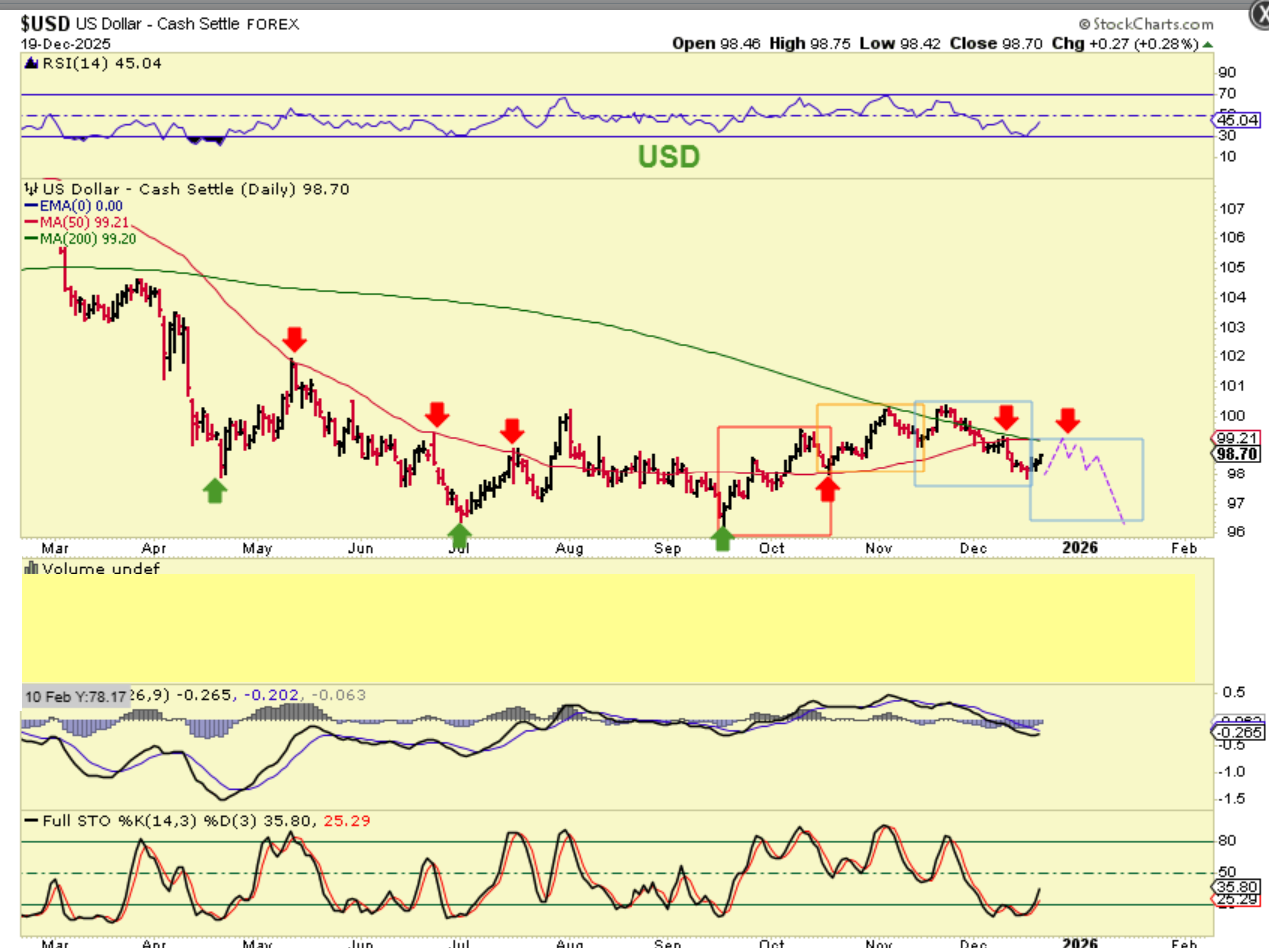
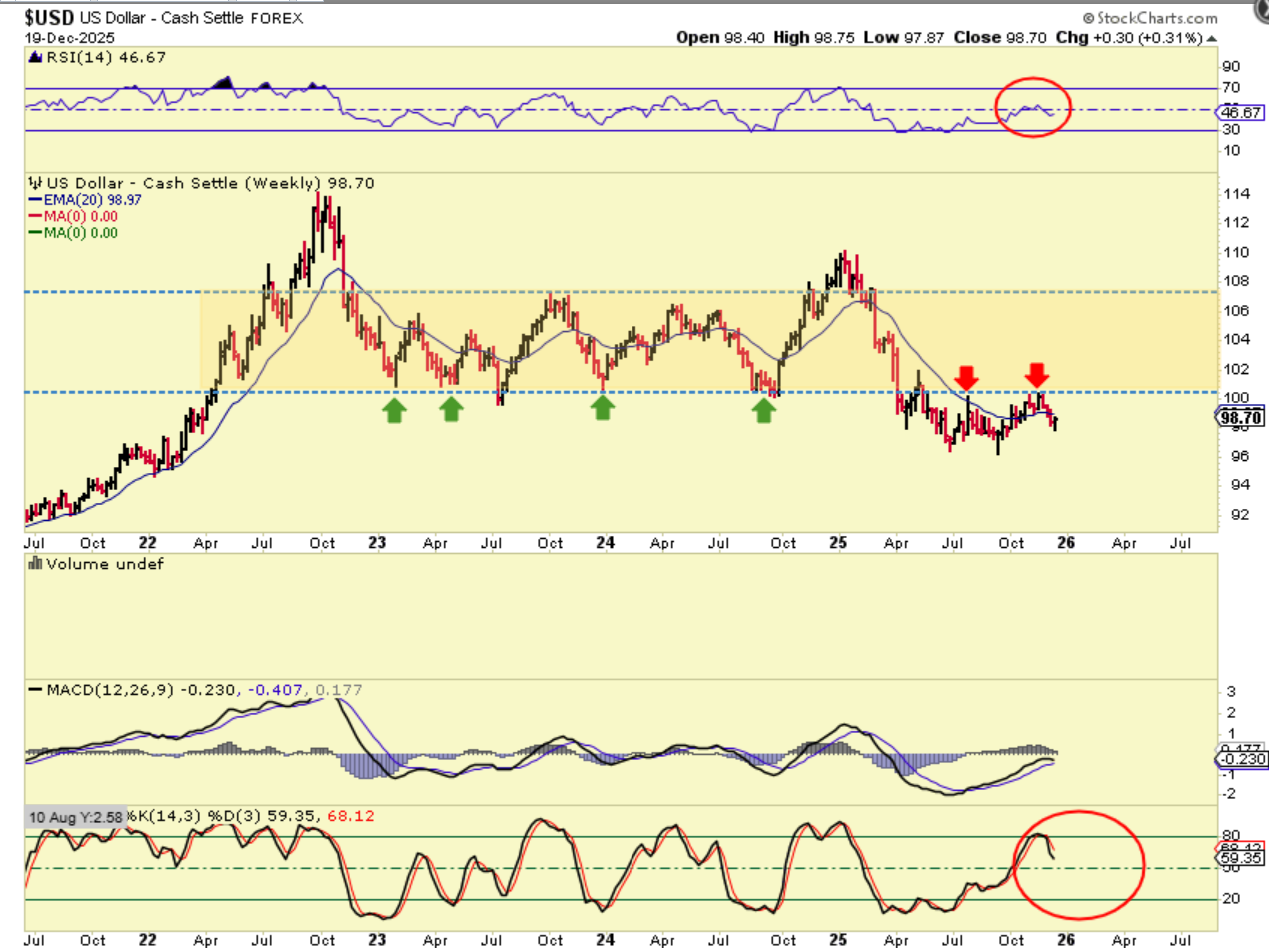
THE USD is pushing up out of the lows and is oversold, so we may have a dcl in place. Can it get above that strong resistance? We’ll see.
.
THIS WAS IN FRIDAYS REPORT:
THE USD: I tried to mark dcls roughly here with orange arrows, but it was so choppy that some are hard to see. Some were short, others look to be long. That being said, we do look ready for a dcl right here, so we’ll see how this bounce plays out.
.
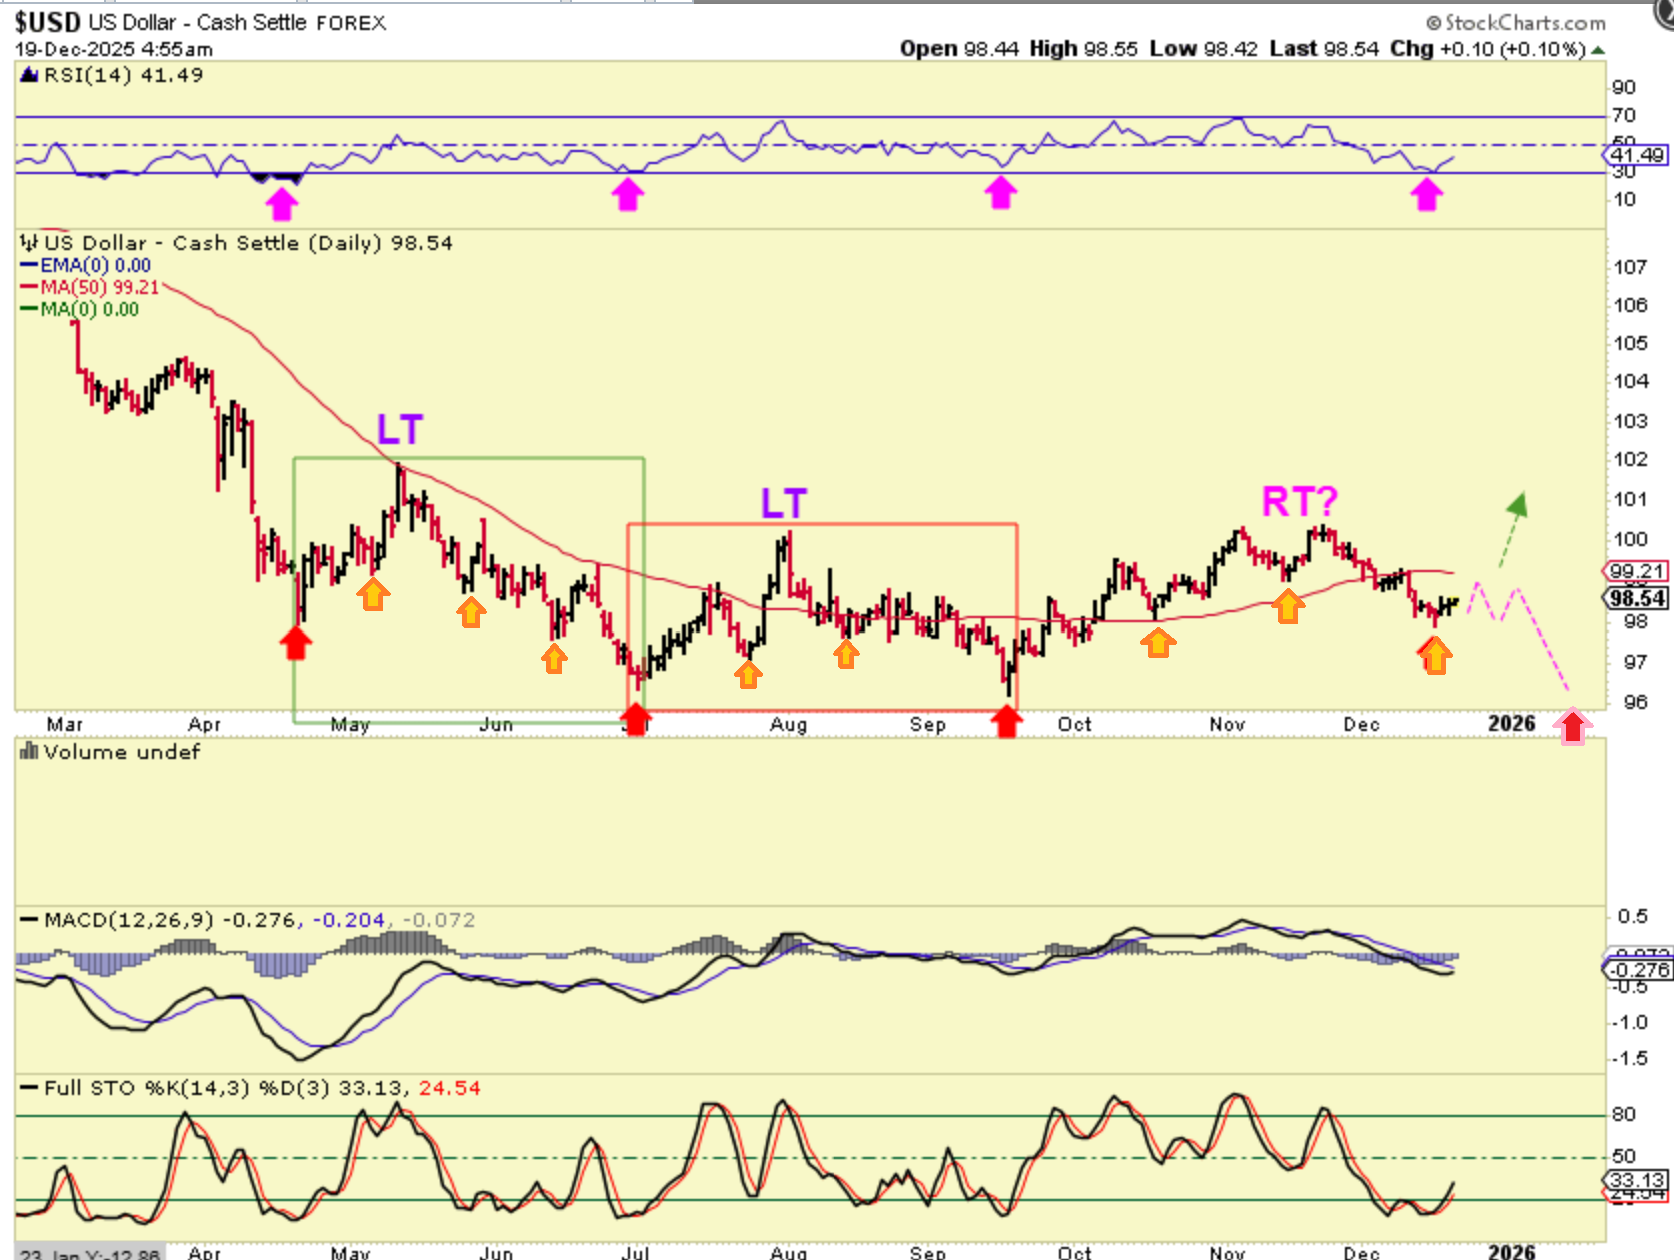
So far The USD has been unable to recover that break down and former support has become resistance, so keep that in mind (Actually, I’ll keep mentioning it in the reports over time 🙂 ) as the USD tries to run higher again. Is this a higher low or just a pause on the way down? We’ll see.
.
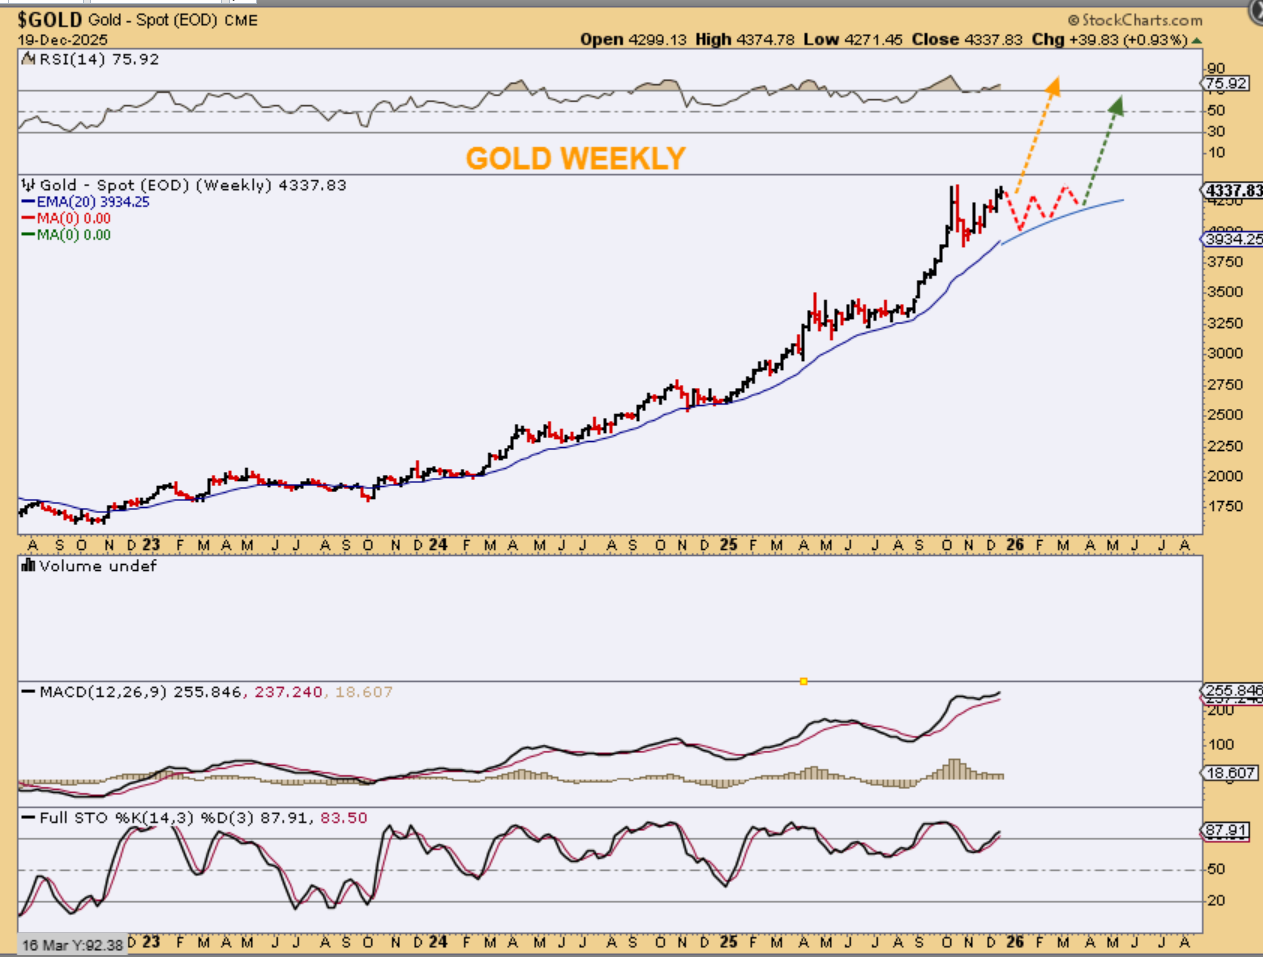
GOLD WEEKLY: Gold is either ready to breakout or will continue this bullish consolidation. It has not been able to do what Silver did, which is to break from that cup and rally strongly. Notice the CUP here with Gold, and…
.
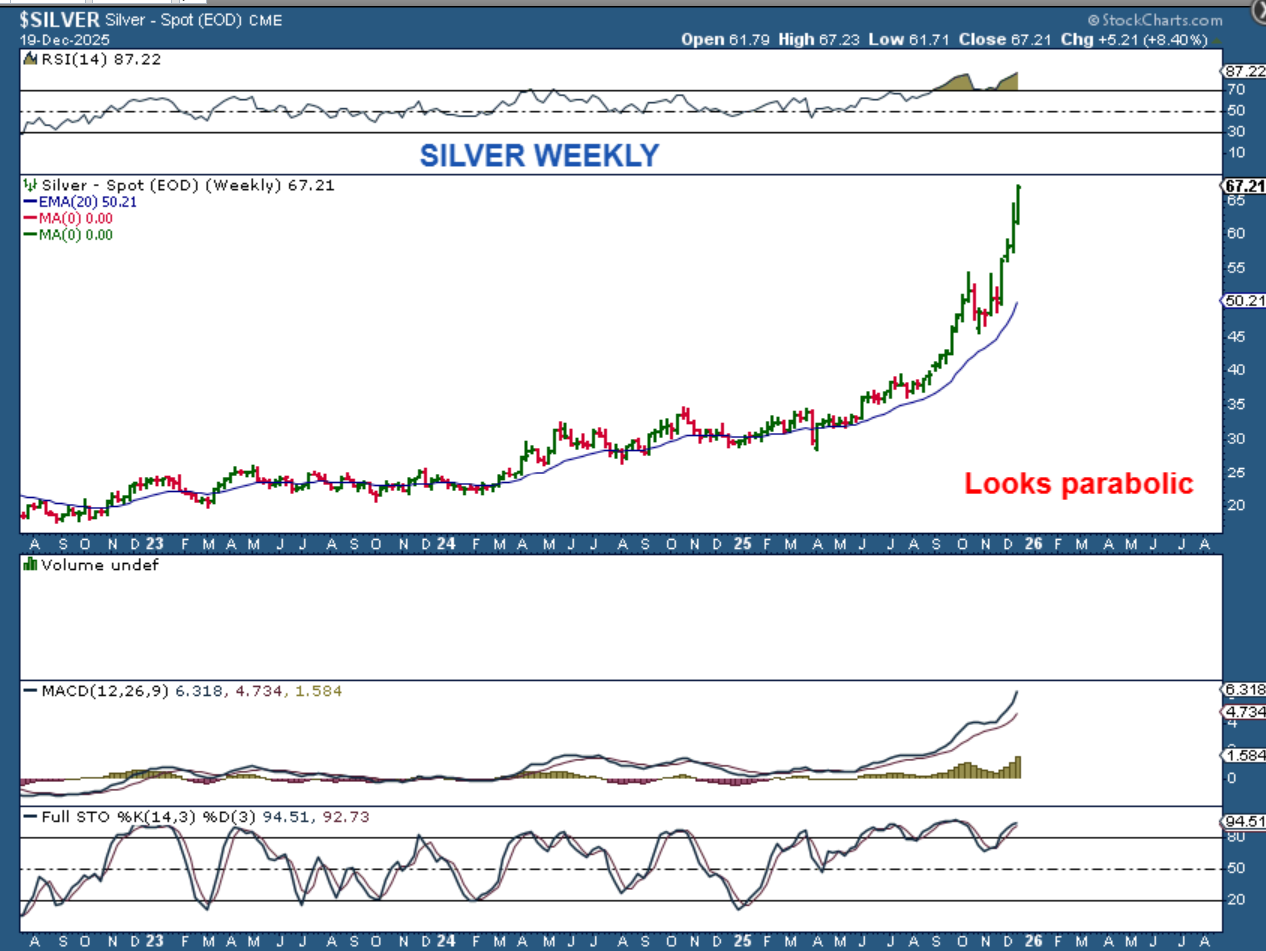
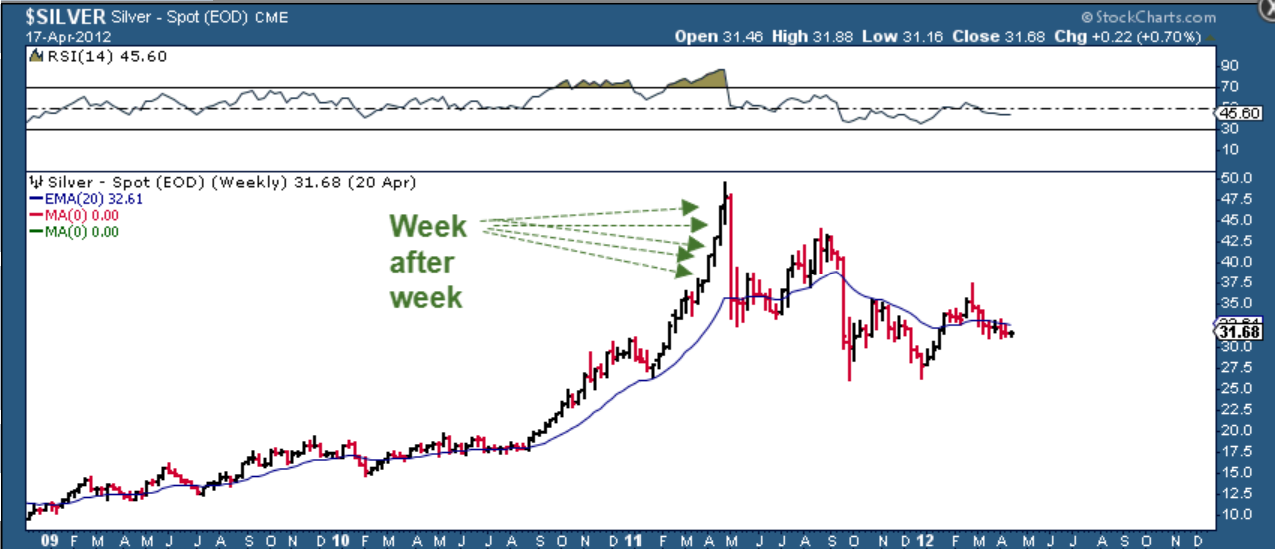
Notice the Cup here with SILVER. Silver has rallied strongly out of that cup. This is now starting to look parabolic though and a true parabolic run will eventually crash. Gold was up 8.40% last week alone.
.
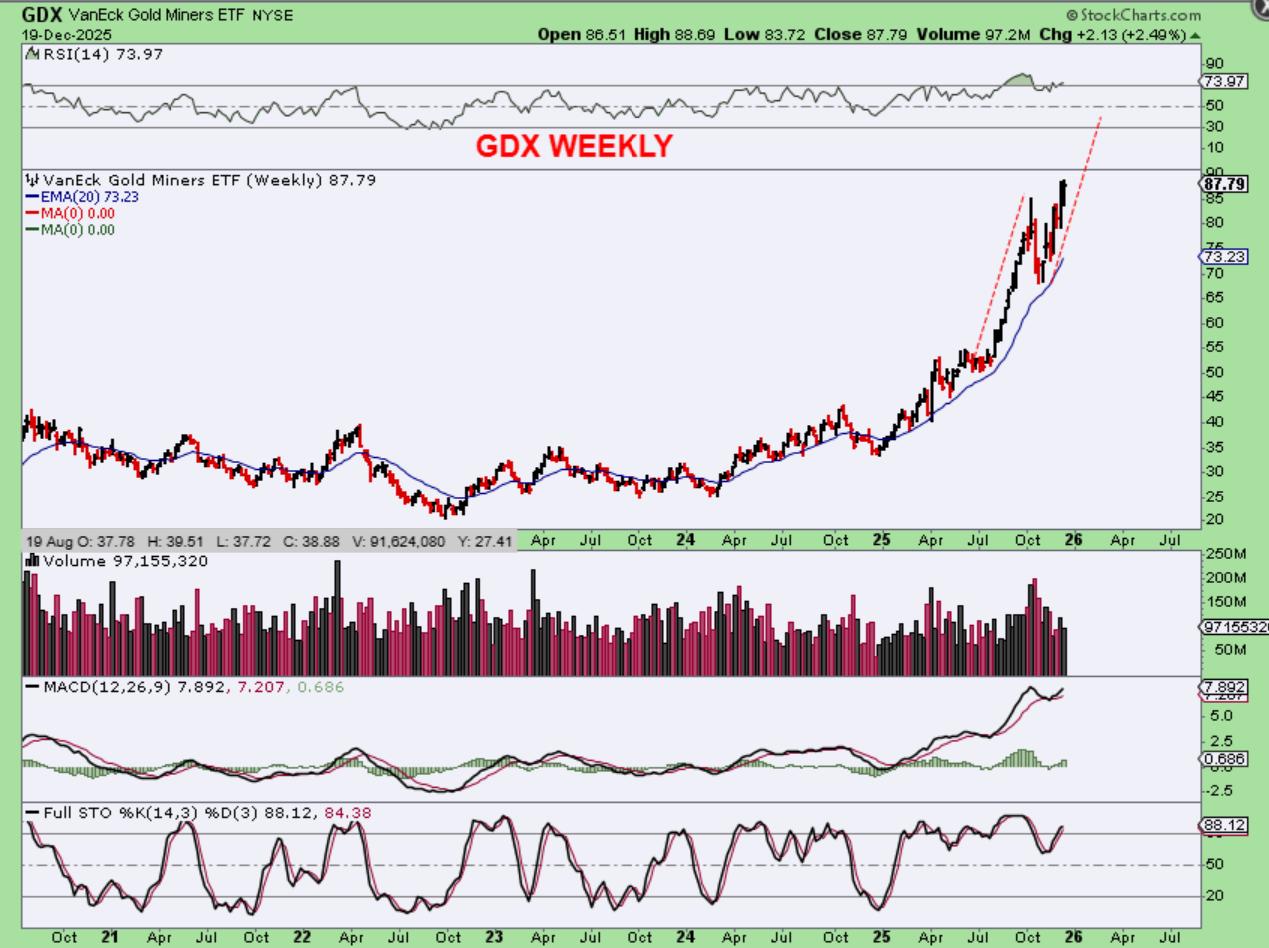
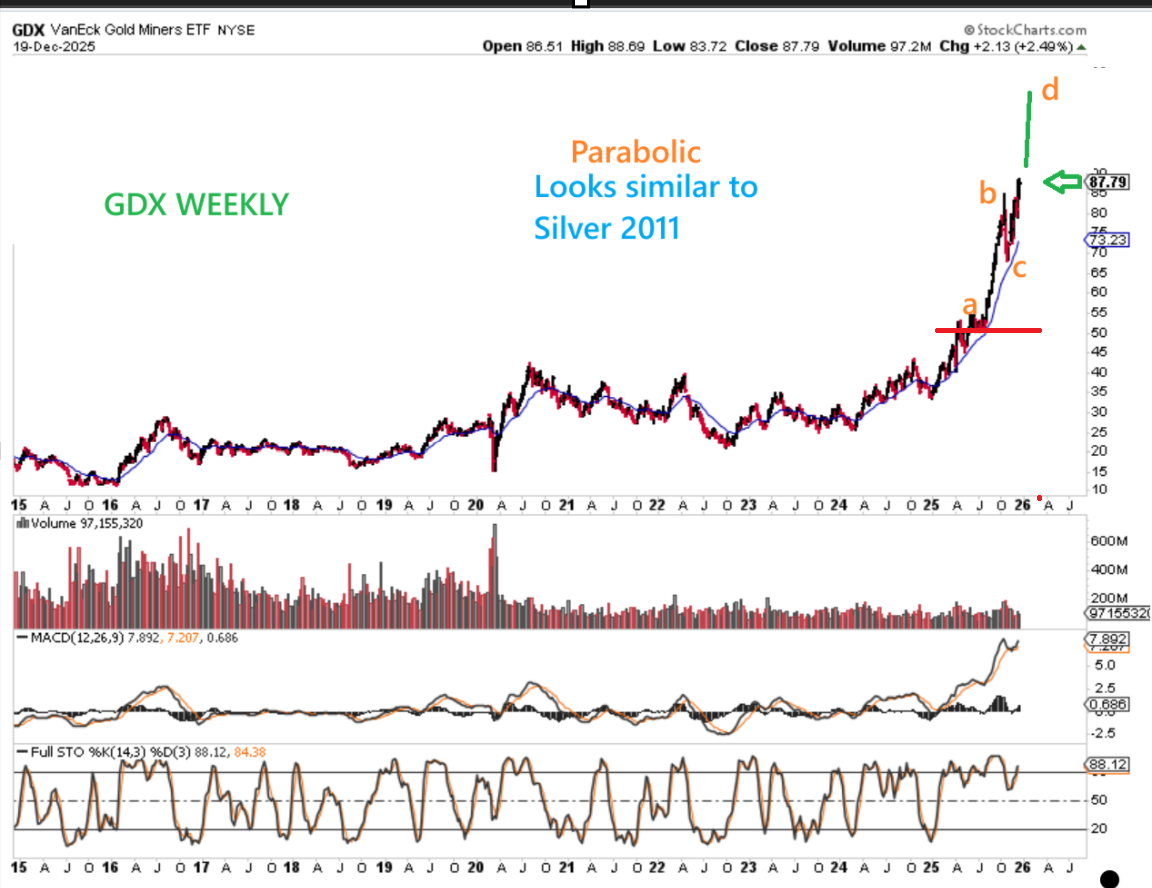
GDX actually looks to be just starting to break out from its’ cup. It resembles what Silver looked like 2 or 3 weeks ago. Let’s examine a possible ‘measured move’…
.
As a weekly chart, this would indicate that The GDX has about 15-20 more points to go, or to $105-$110.
That’s a possibility If-It-Runs.
.
.
Look at Silver in that 2011 parabolic run. At the end it ran up week after week after week, without rest. 13 weeks straight up from the end of January to late April, so the second run out of that dip was very strong. That would be where we are now with Silver and the GDX. If Gold breaks out, it could be weeks of a rally for it too.
.
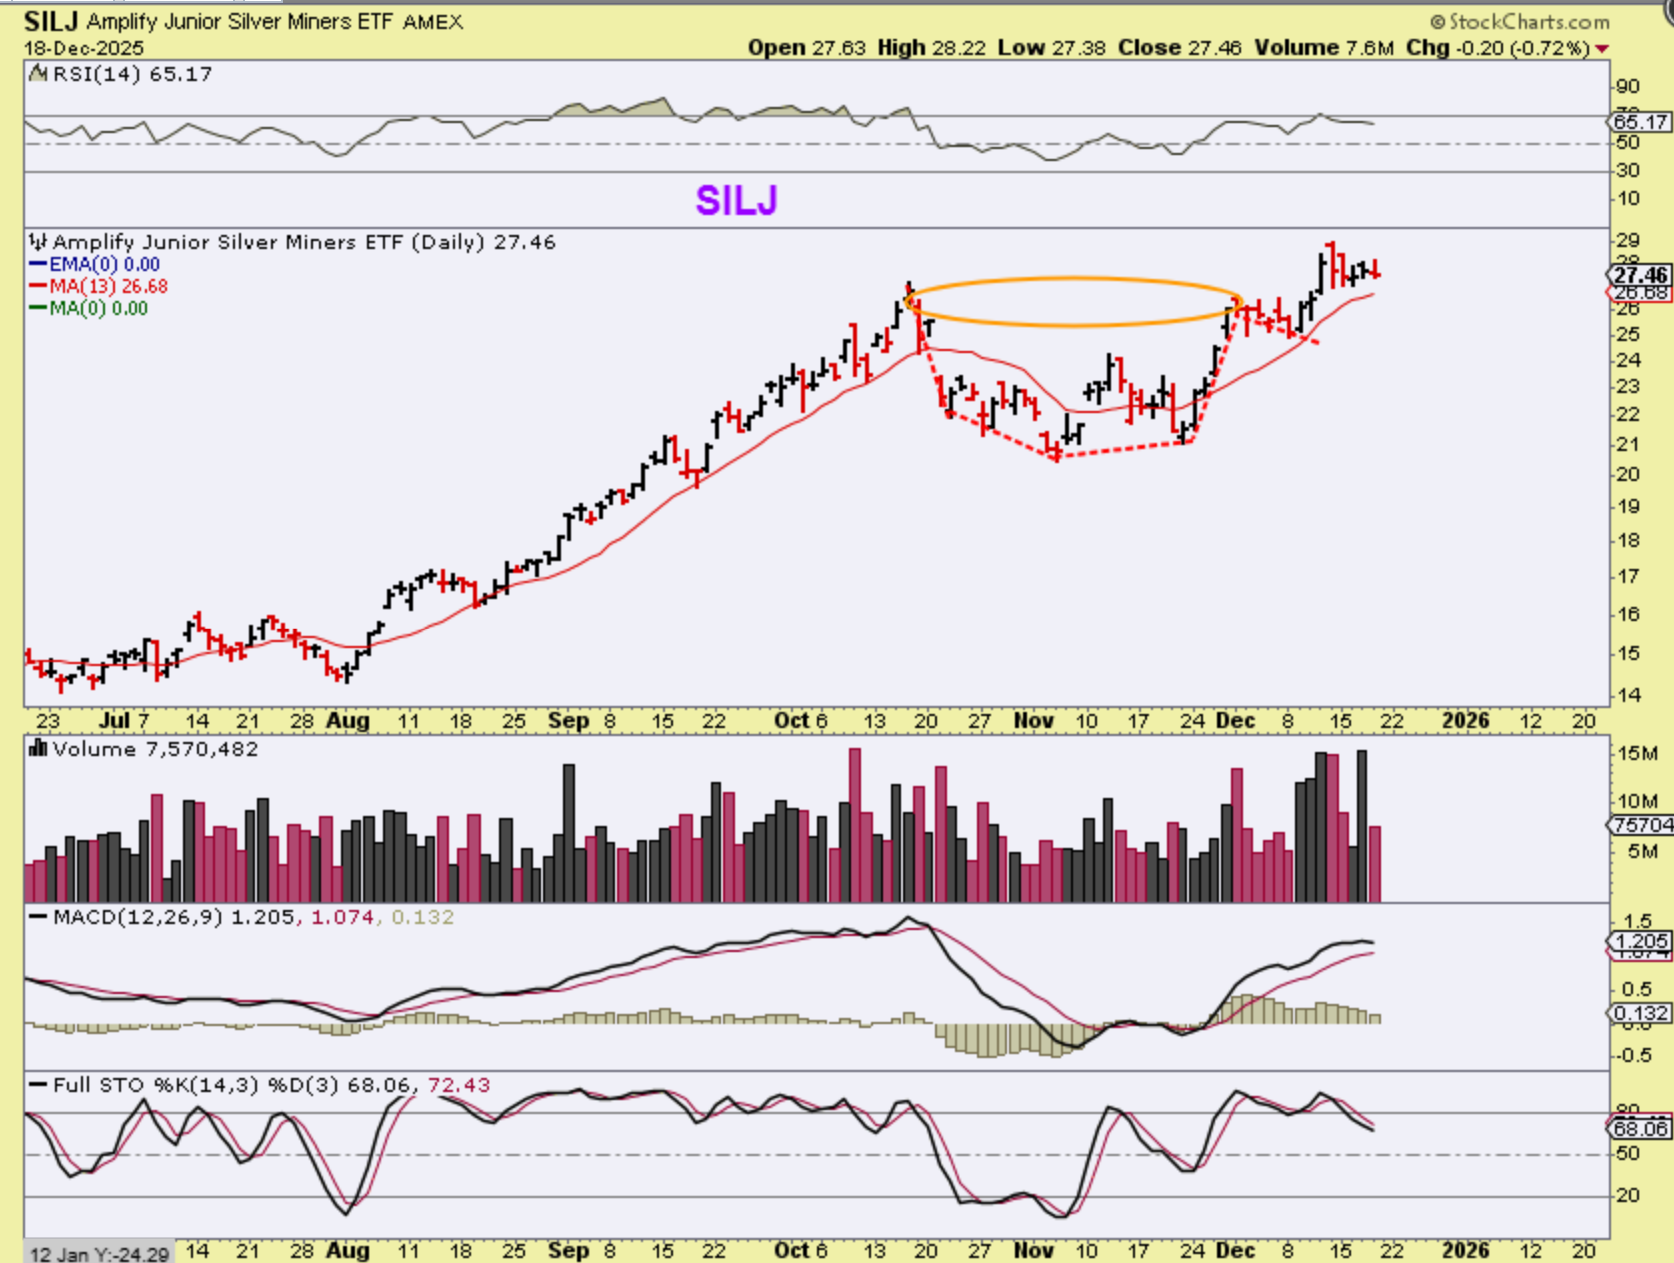
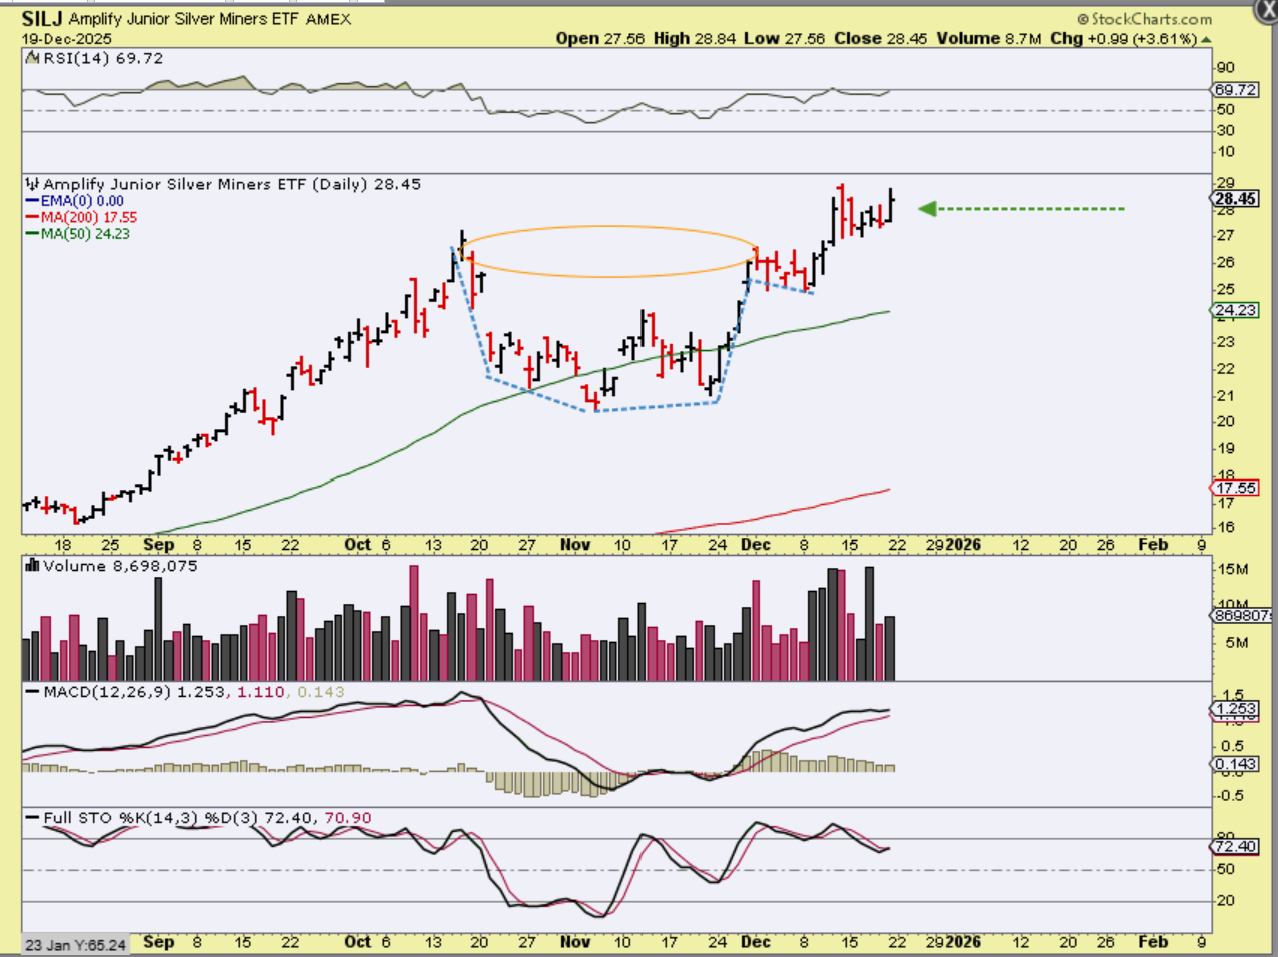
I had this chart in the Friday report.
The rally out of the August lows was exceptional, and it then formed a cup as a consolidation. Silver formed a cup too, but it sprinted higher, so hopefully Silver Miners will start to move steadily higher soon. One thing that we do know however, is that if Silver Miners wanted to play catch up, they could quickly sprint higher.
.
SILJ may be starting the next leg up too.
.
The Bulls do seem to have gained full control. 😉 Now we could get that so-called Santa Rally into the end of the year. Enjoy the rest of your weekend, it looks like next week may lead to some nice trading and investment gains.
.
~ALEX
.
AS A REVIEW FROM FRIDAY:
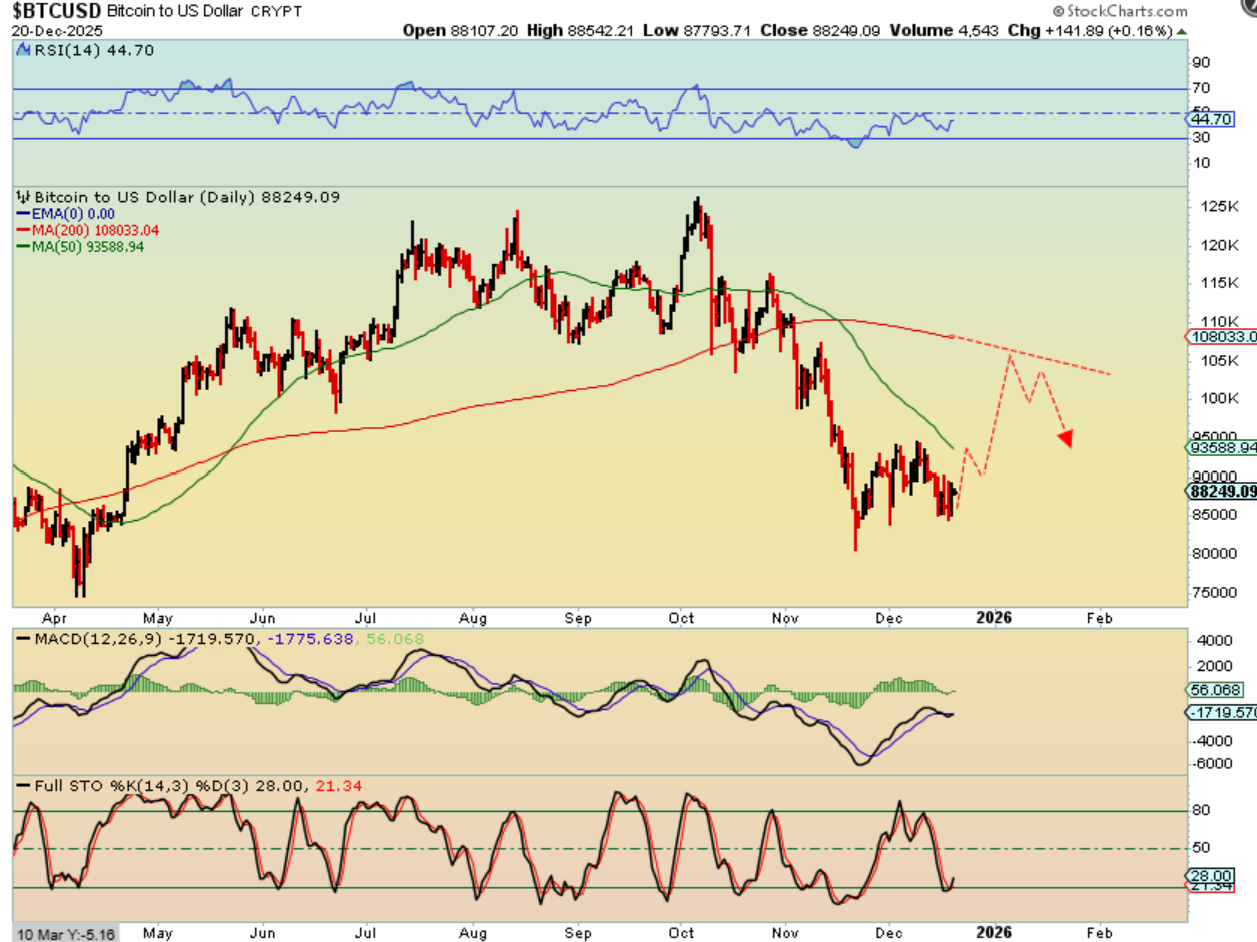
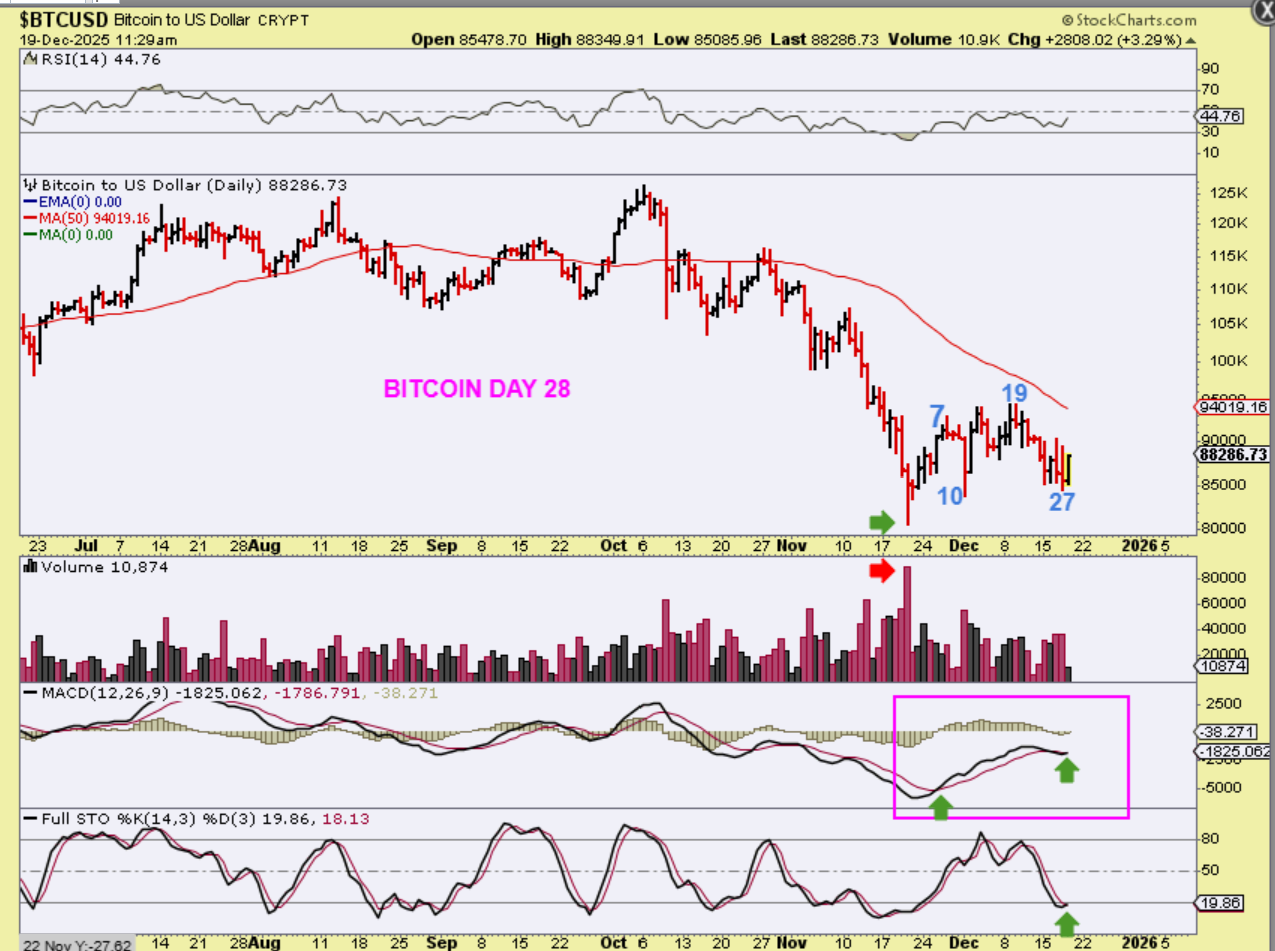
This finally does look like it can run higher, so let me show you how I am trying to picture this.
.
I could imagine this 60 day cycle as two 30-day cycles, where the first one almost back tested the low at day 27, and the 2nd one rallies. I DON’T KNOW IF THIS WILL PLAY OUT LIKE THIS FOR SURE, but the MACD looks fairly strong and we are oversold.
.
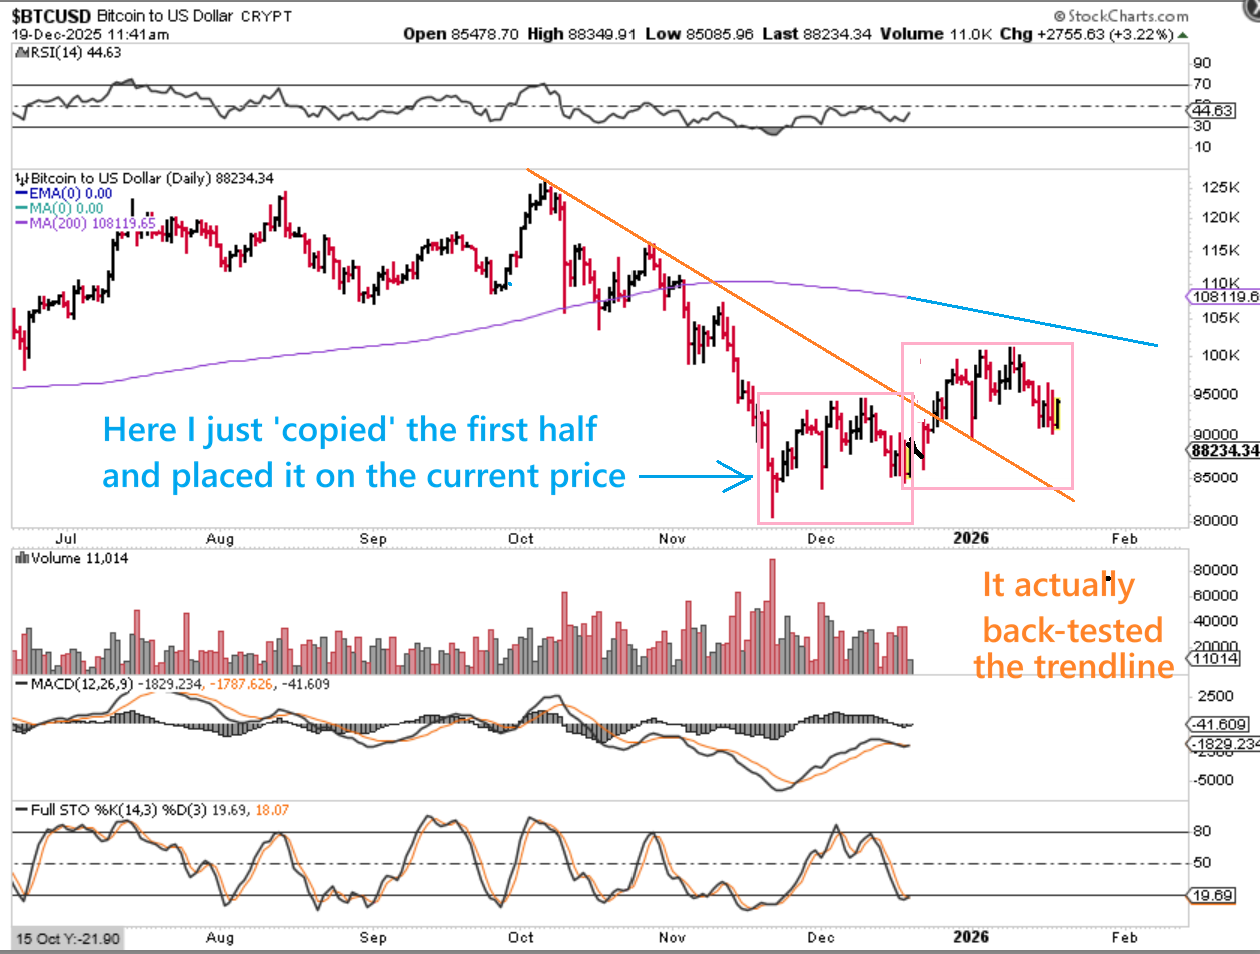
Bitcoin: When I copied the first half and added it to the 2nd half, we only reached $100,000, but again, we could see a run to the 200sma. It’s a total coincidence that when I overlaid it, the sharp dip in the first run ‘back-tested’ the trendline 🙂
.
BITCOIN – So maybe we’ll see something like this, now that the general markets seem ready to run higher too?