Wednesday November 26th – The Bounce Continues
Recent talk was that we would not get a rate cut until 2026. As of this week I am hearing more and more that several of the members of the Fed are voting for a December cut. The markets seem to be responding with a push higher. Will it last? Are there enough members that feel that way, or will we get a disappointing ‘no cut Wednesday’ on Dec 10th? We shall see, but let’s look at our current charts.

.
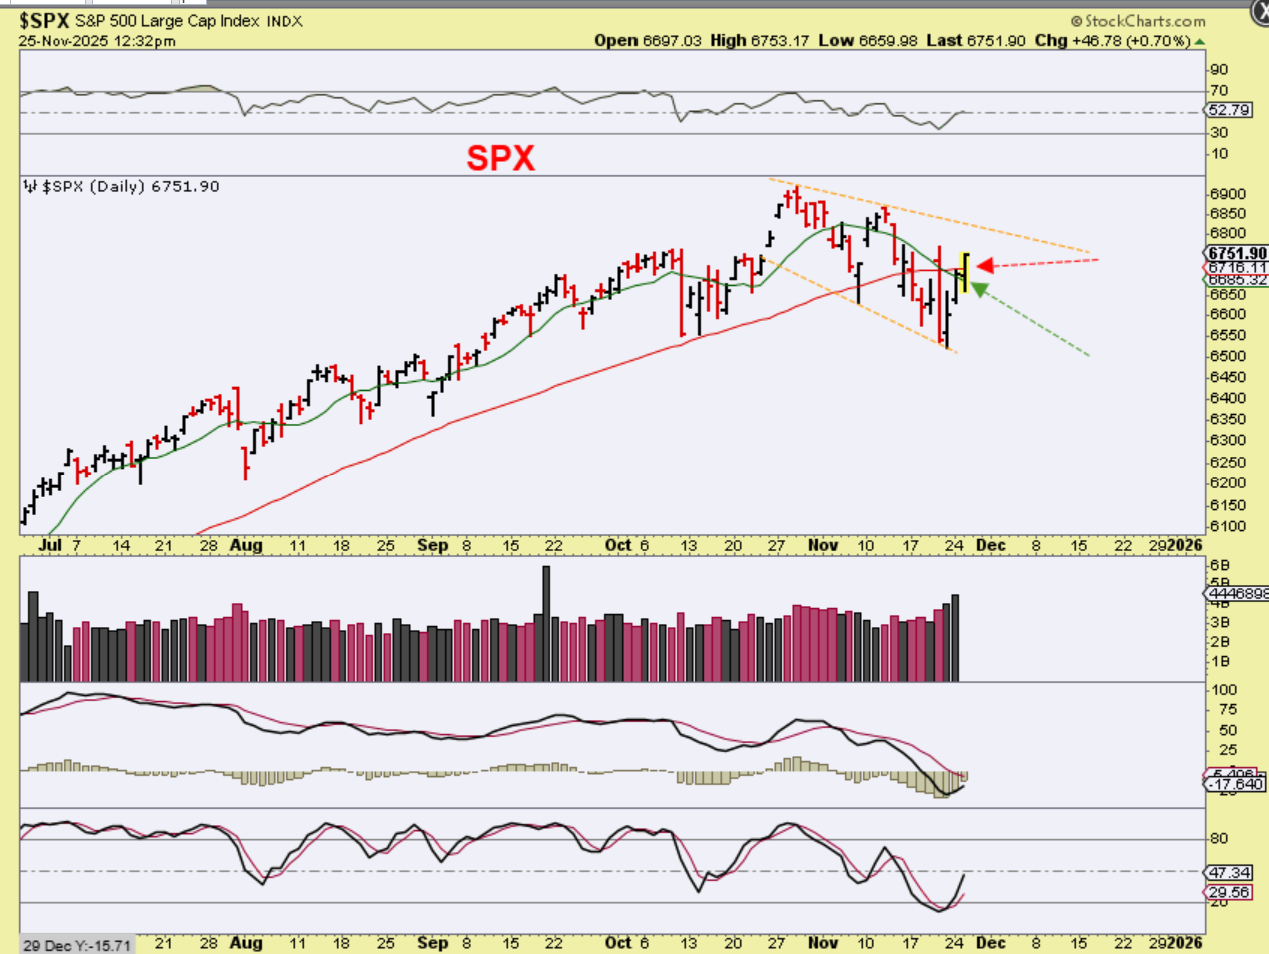
After a day 30 low, The SPX has bounced.
Yesterday the markets regained the 50sma as of midday, seen below, and they’re heading for that downtrend line. I have to admit that the volume is coming in heavier than I expected for a holiday week too. This ‘looks like’ a dcl, but I will show you something to keep in the back of our minds shortly.
.
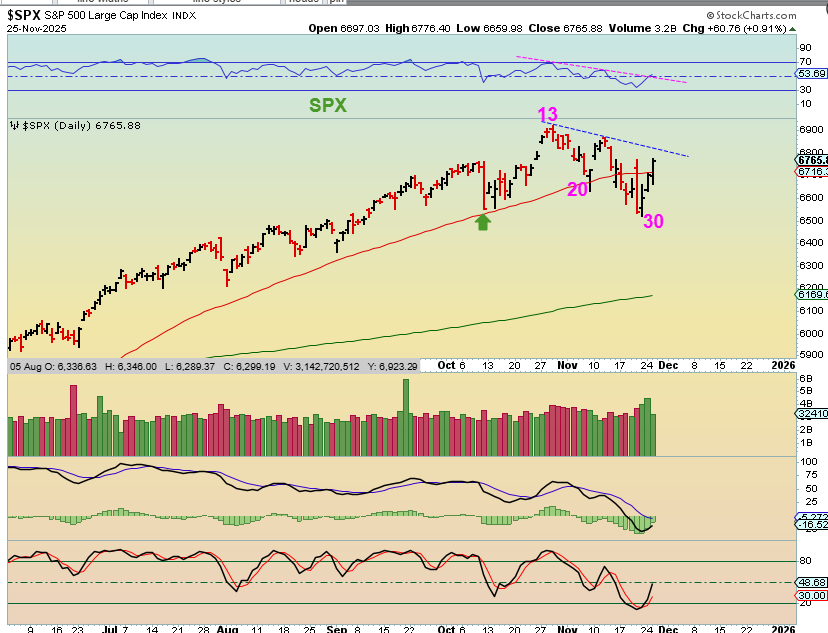
The day ended with The SPX holding its gains, and again, I admit that this looks like a dcl. We were due for an ICL though, which is one of those deeper a-b-c down drops that change sentiment. Did we have that? Not really, not with a 30 day dip, so I wanted to look through my charts and see if anything like this happened before —and yet we still got an ICL. I will discuss that with the Nasdaq…
.
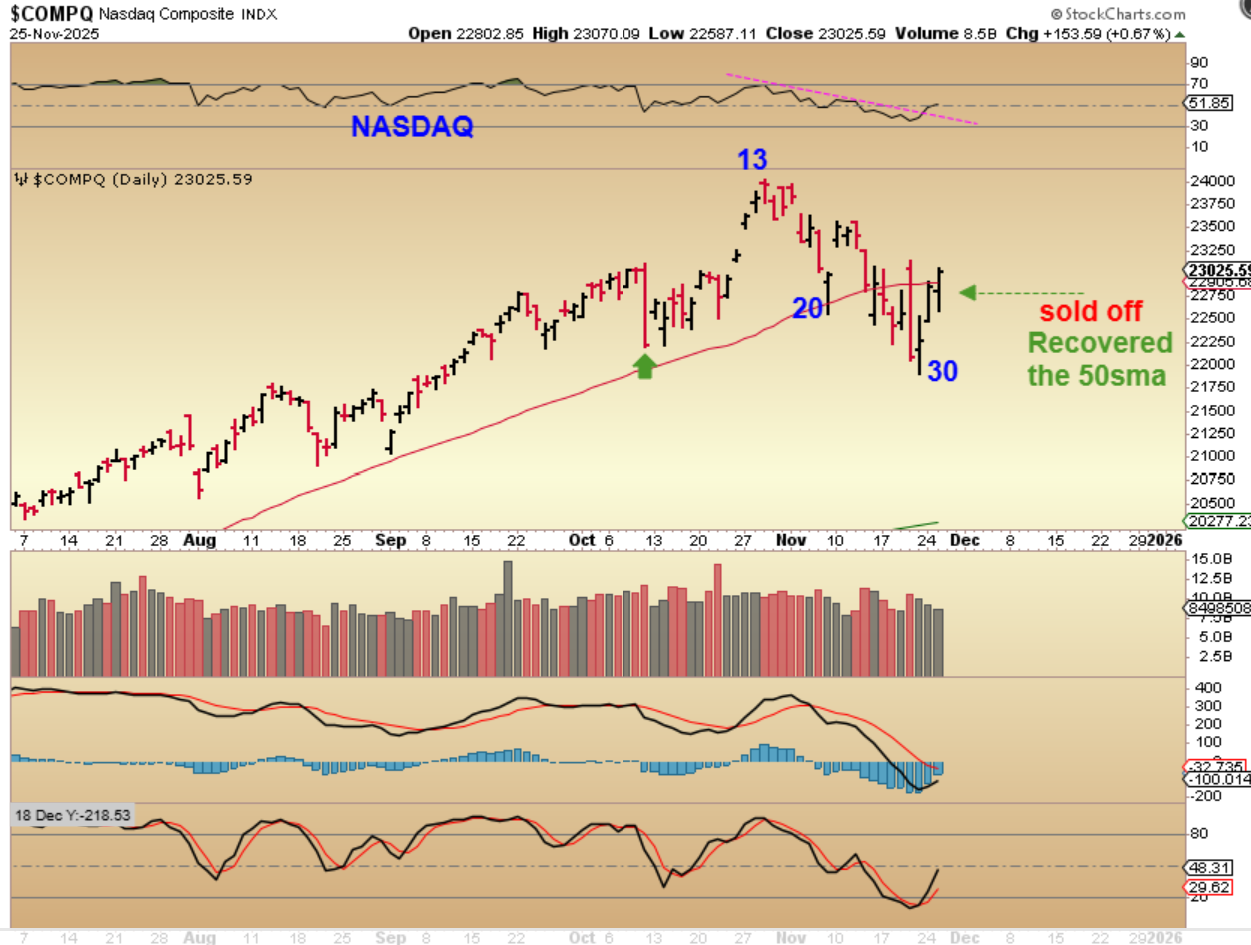
THE NASDAQ is bouncing out of that day 30 low too, and some of the ‘formerly bullish stocks’ that used to make great gains have perked up nicely. If you have time, look at OPEN, ONDS, BBAI, RR, Quants, etc are giving us 10-20% gains in a day, but will it last? Will I hold positions over the holiday weekend or over the weekend after the holiday? Well, as good as this looks, it just doesn’t feel like an ICL yet. This feels like it could be day 32 with another leg down coming, so..
.
I wanted to look through my charts and see if anything like this happened before —and yet we still got an ICL. I will discuss that with the Nasdaq…
.
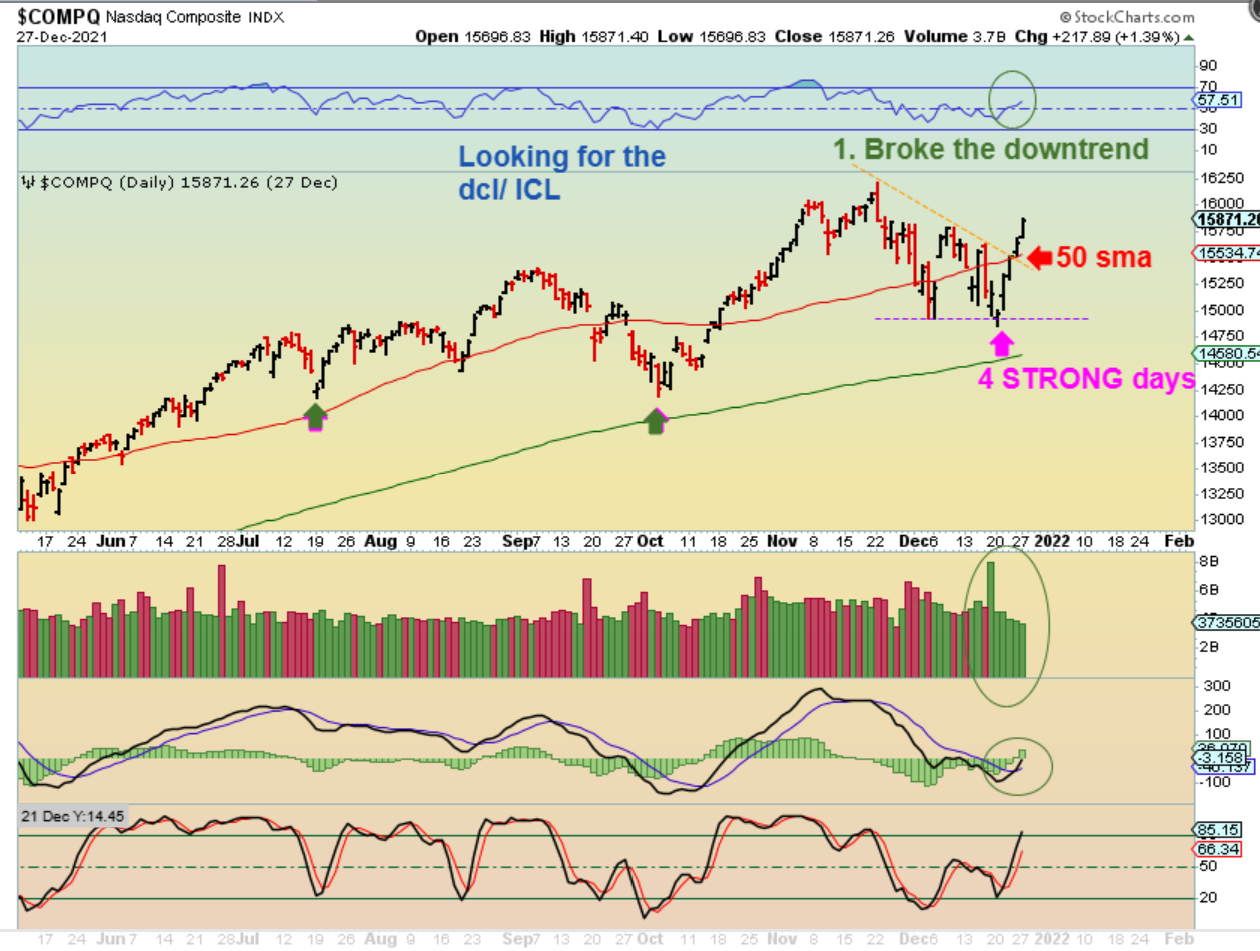
Take a look at this 4 day sprint out of the lows for The NASDAQ when a dcl / ICL was due. Notice
1. The RSI broke above 50%,
2. The downtrend of price was broken
3. Nice volume on the run up and the MACD crossed. This MUST be the dcl to buy and hold, right? And isn’t this better looking that what we have right now?
.
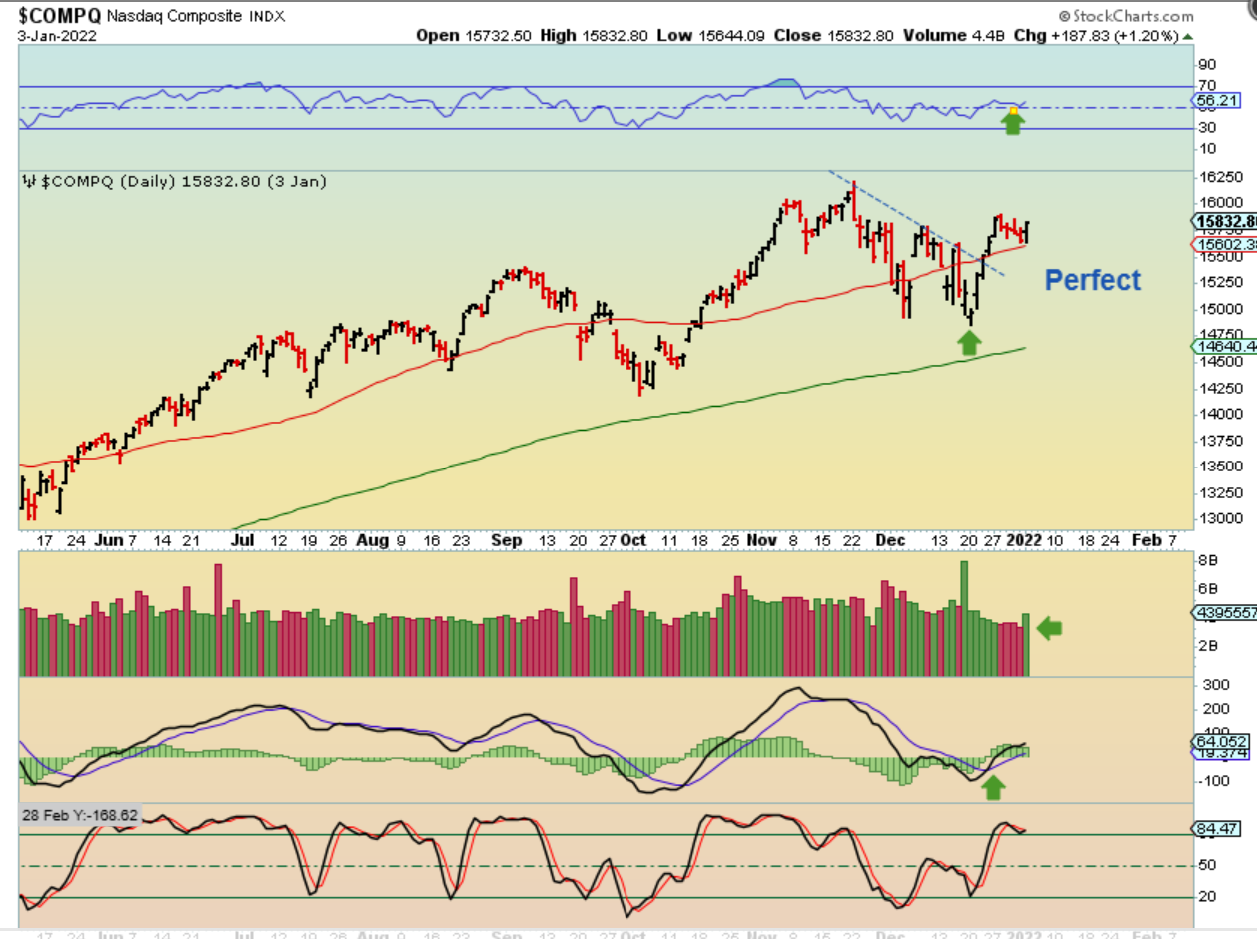
NASDAQ Day 9 and this is really looking better than what we have right now. It’s perfect! It broke above the 50sma and then it worked its way over to the 50sma and then reversed higher. Again, simply PERFECT with this pennant/flag!…
.
WHAT??? That Pop off of the 50sma promptly rolled over and crashed to the 200sma. At the 200sma we saw a strong reversal candle there too, followed by a bounce, but then we got crash number 2. This was due for an ICL and it just rolled over.
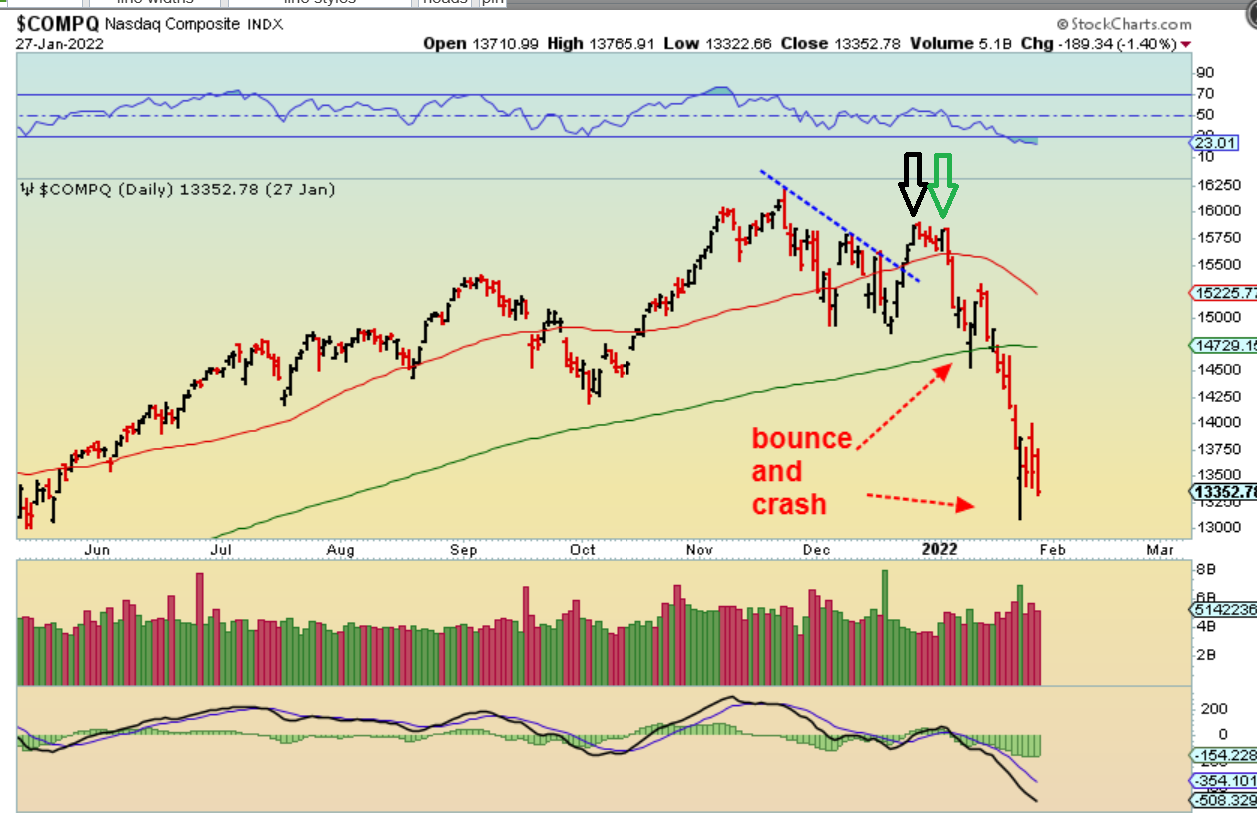
Moral of the story? I couldn’t help but notice that this was a year-end rally that rolled over in January. We MIGHT get one more daily cycle up- a ‘Santa clause rally’, and then the next one rolls over, but whatever you do – USE STOPS if you are buy and hold. Thankfully this did not gap down, it opened up and rolled over so a stop at the 50sma saved everyone. This was due for an ICL, and it just rolled over.
.
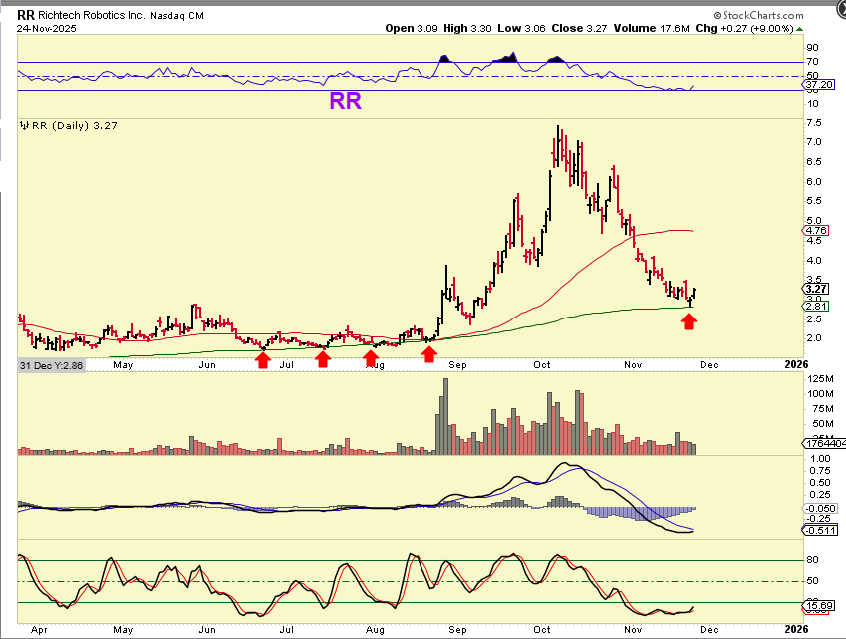
In the comments section I posted that RR is a perfect reversal right at the 200sma. I see this kind of price action all the time and it still amazes me. So I bought this, it ran up 10% and I sold it as a scalp trade. It is VERY oversold, so many of these ‘stocks’ do look like they put in an ICL. I see an a-b-c here, so some stocks may have found their lows and if the general markets roll over, it may rally for now and land ofn the 200sma as a buy again. Double bottom like we saw in June-August.
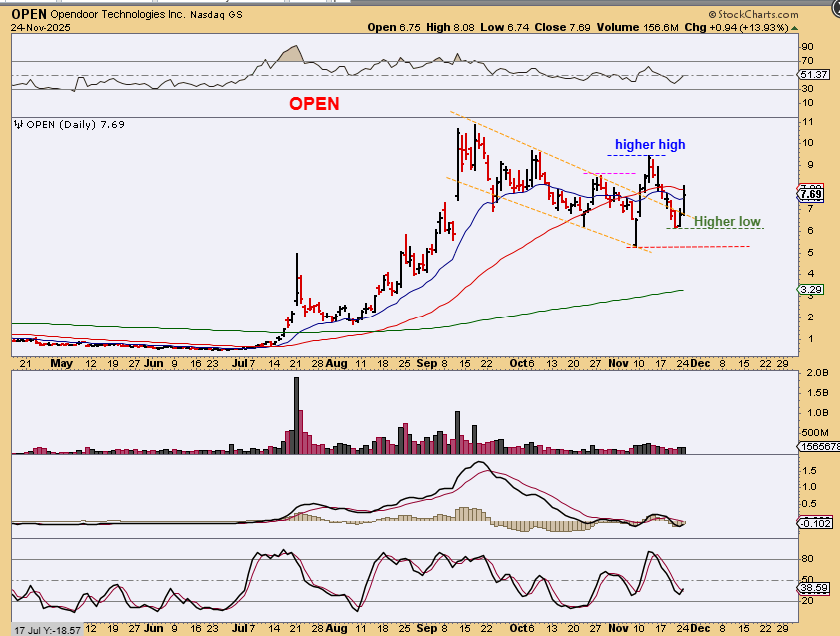
Yesterday I pointed out ‘OPEN‘.
It started to slowly move higher (no gap up) and ran up 14% on Monday. When I look at OPEN, it looks like it may be leading the way, because it actually already has a higher low and a higher high, so THIS caught my eye too. If the markets sell off again, a stock like this may rally even higher now and then just dip down and back test that upper trend line.
.
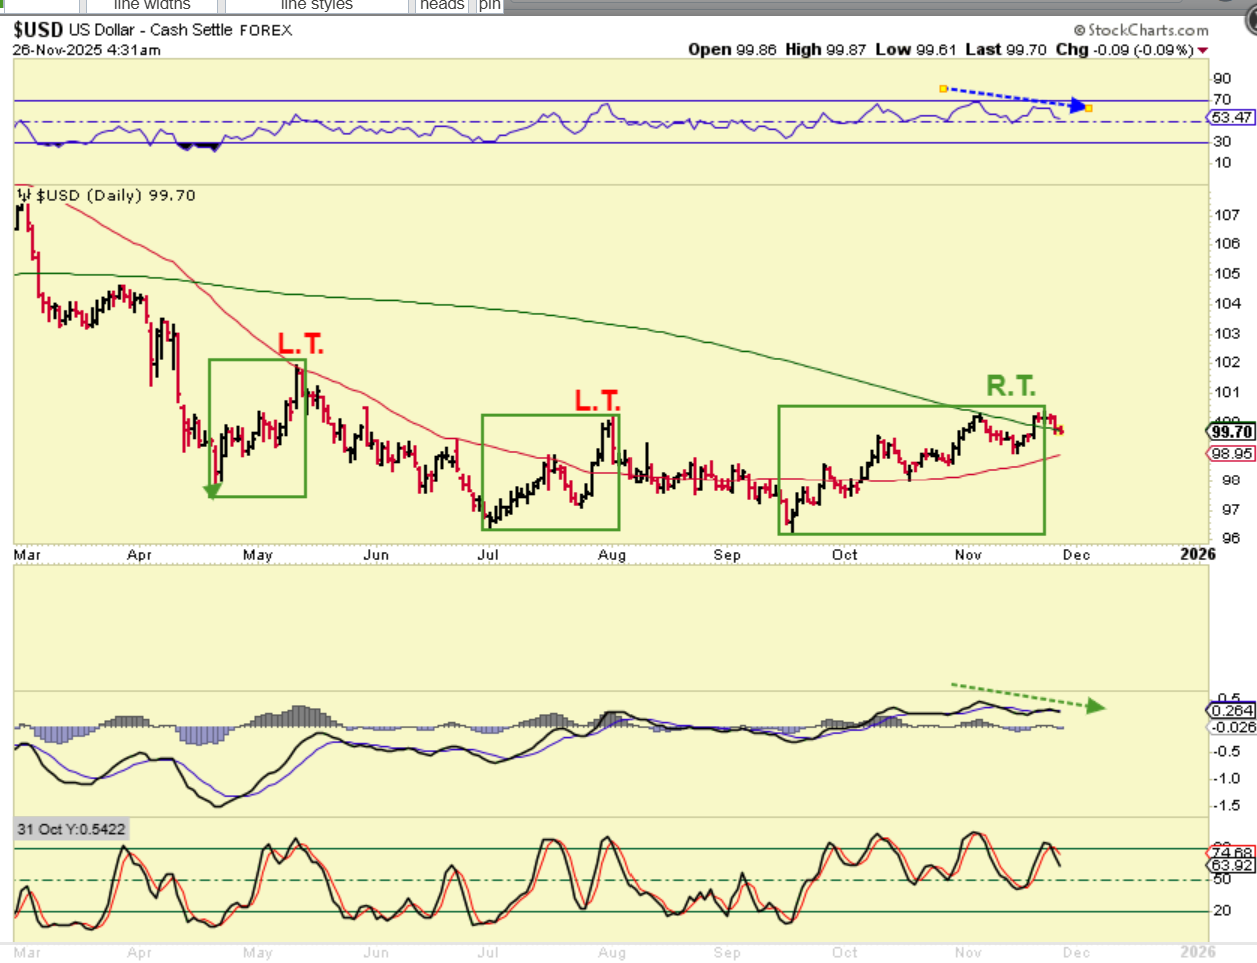
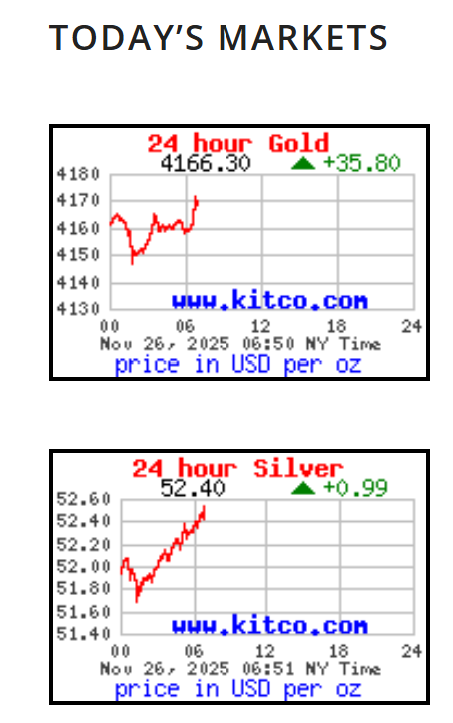
The USD dropped a bit to the 200sma. Gold popped a bit.
.
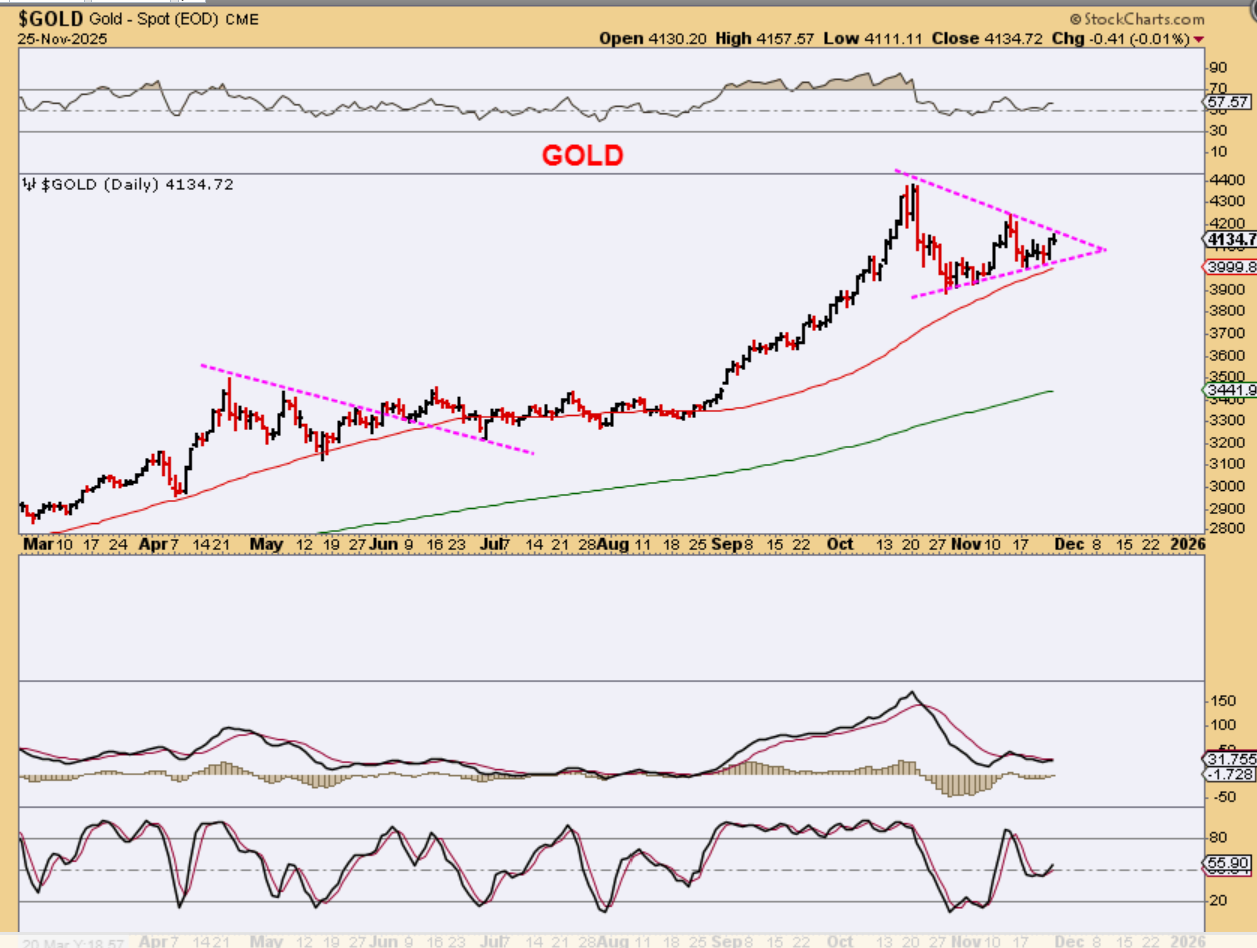
GOLD is forming a triangle and an ICL can form in an ICL. This was day 20 for Gold, and notice that Gold did NOT get to $4245 yet. Why does $4245 matter?
.
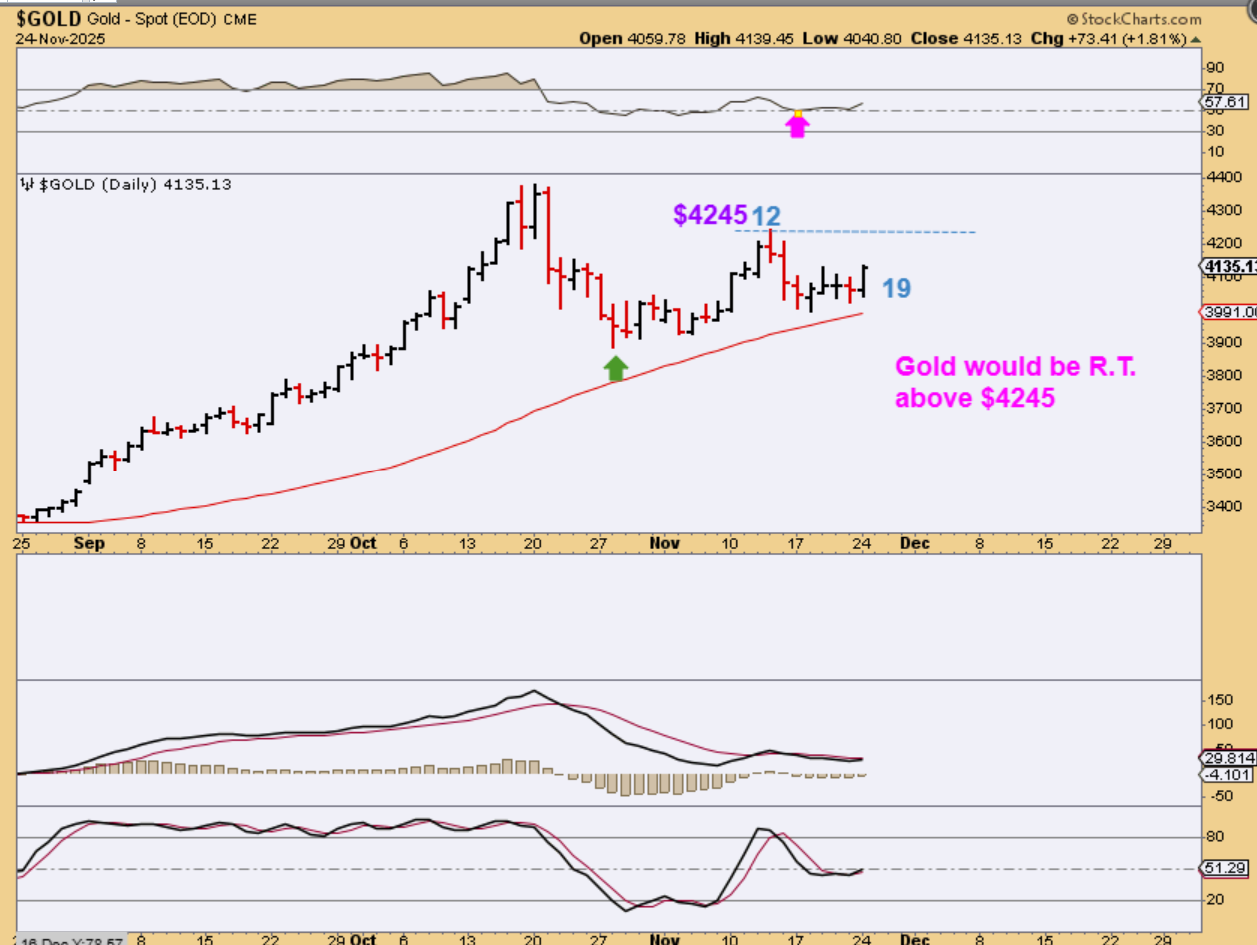
YESTERDAY I SAID TO WATCH $4245 to make Gold R.T.: We aren’t there yet
GOLD – has a day 12 peak at $4245. Day 19 popped higher. If Gold breaks above that day 12, it becomes R.T. and breaks out of that triangle. That would mean that this choppy drop lower in October and triangle formation likely formed an ICL. let’s examine Silver and the Miners.
.
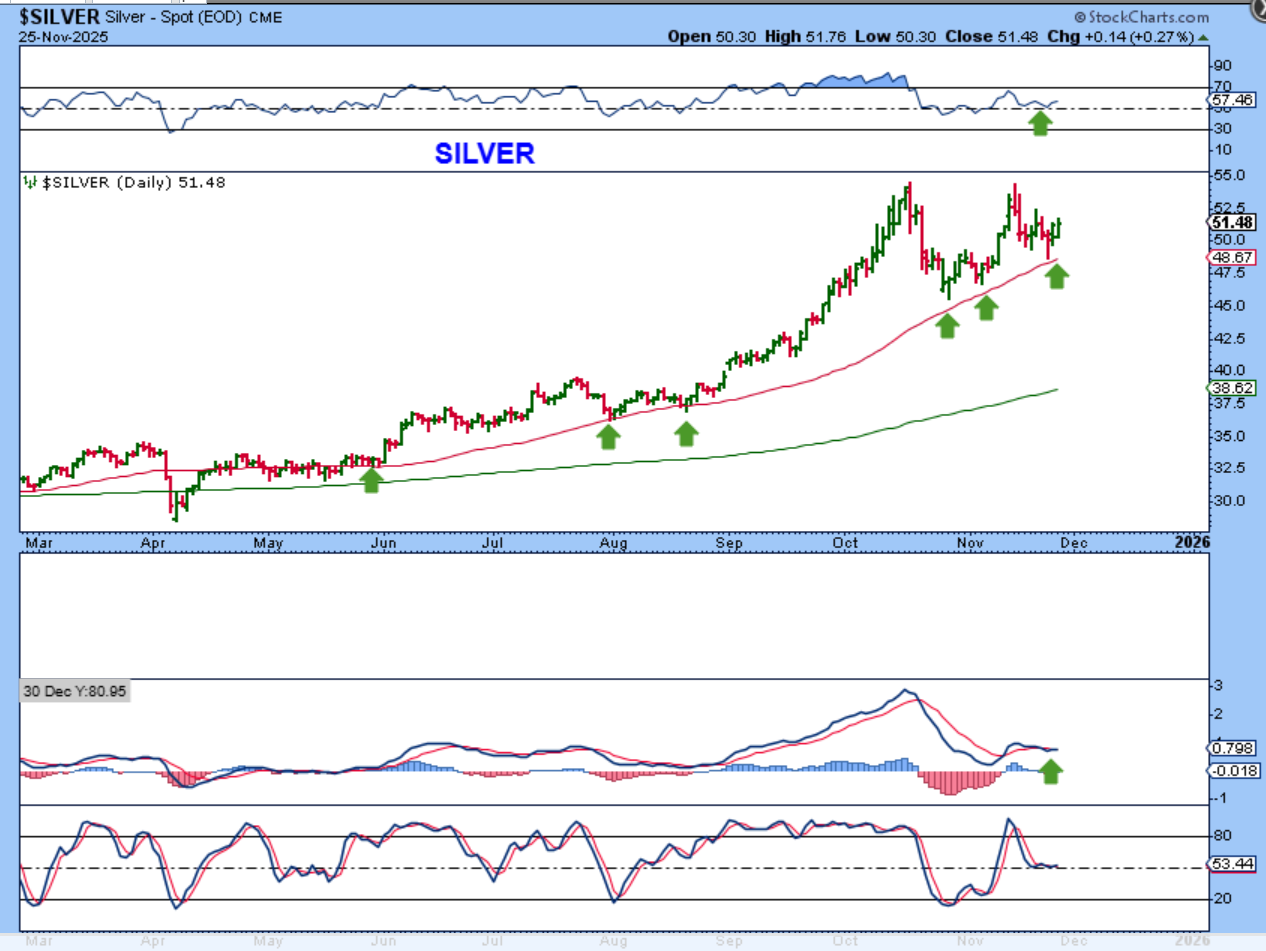
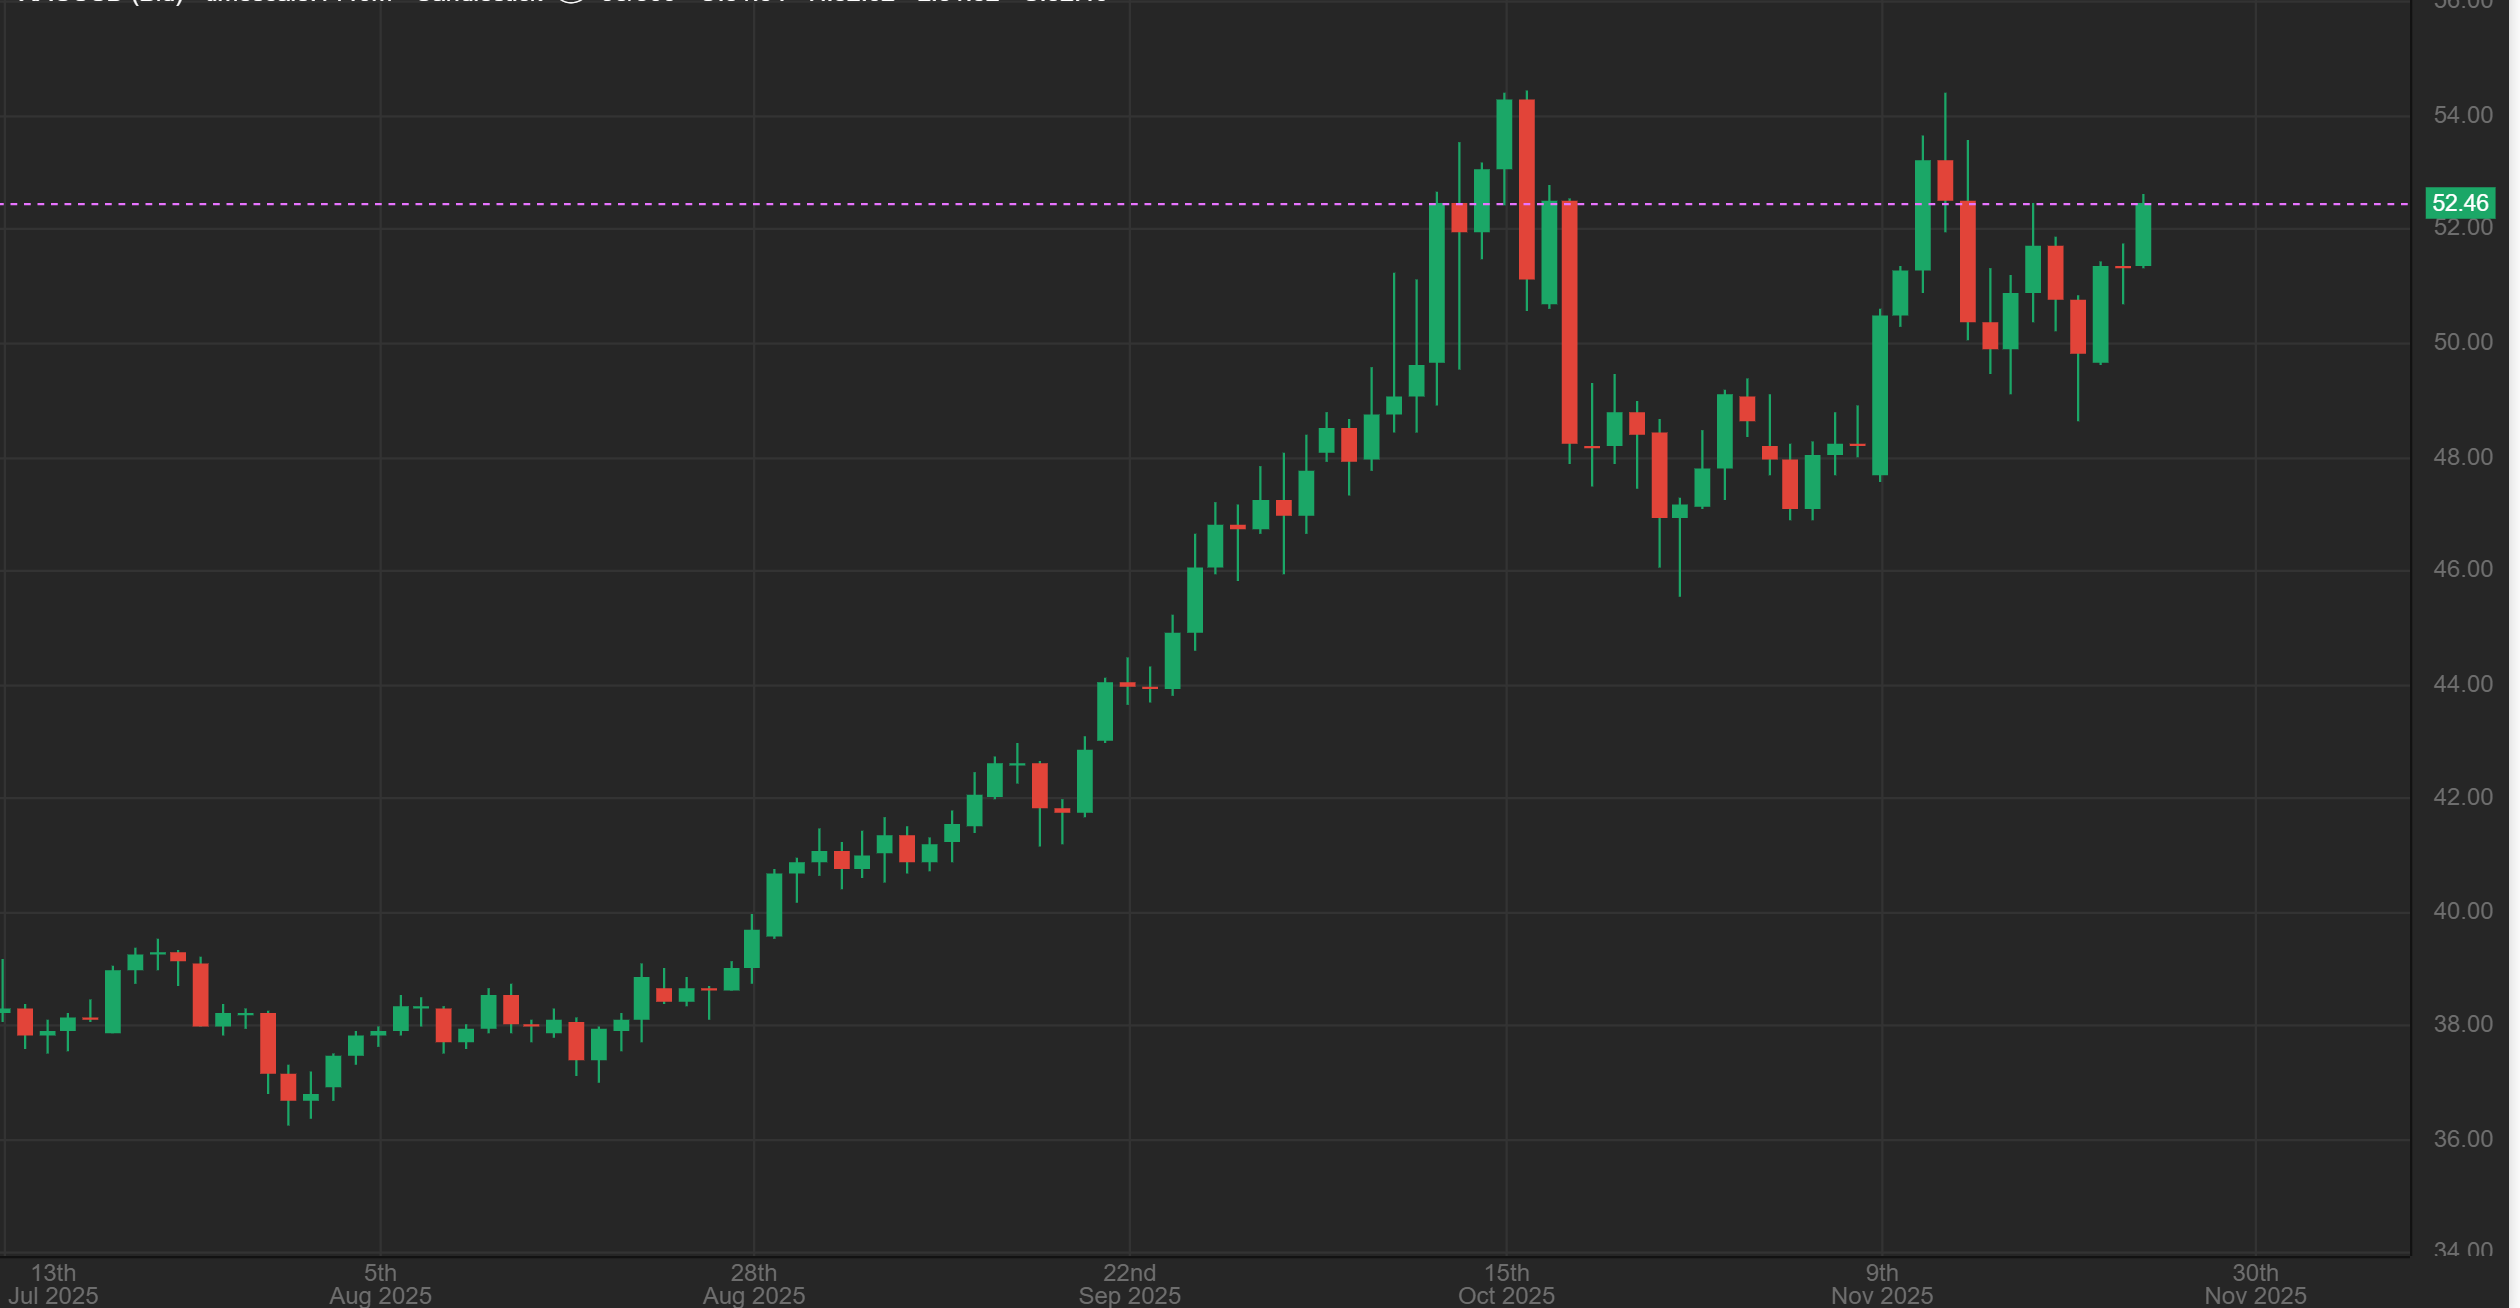
SILVER is also a bullish looking set up that may be ready to run higher. So far it is holding the 50sma with higher lows too.
.
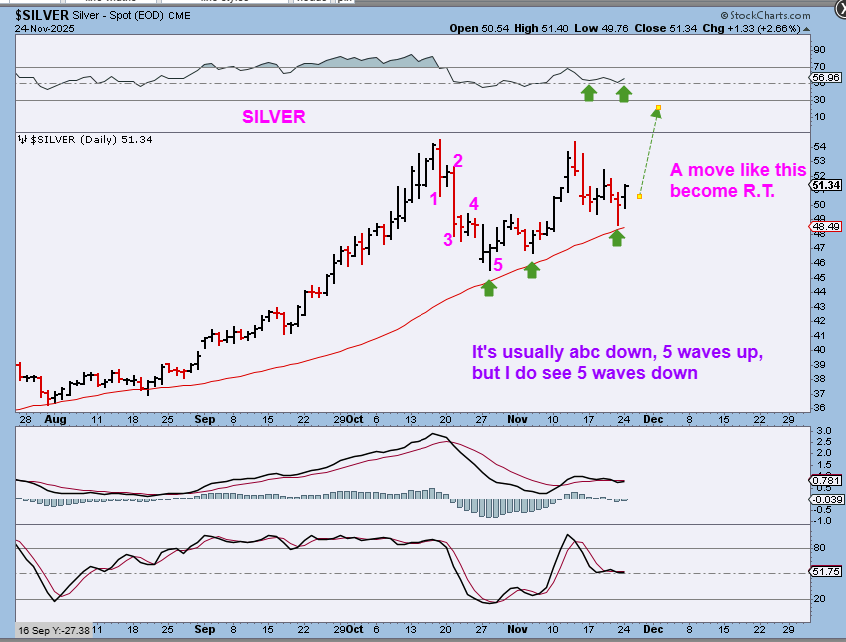
FROM YESTERDAYS REPORT:
SILVER – For does show a 5 wave drop (which could also be viewed as an A-B-C Down. It could move above its day 12 peak, and if it does? It would become R.T., and very bullish. Why? We would have a break to new all-time highs, so let’s look at Miners.
.
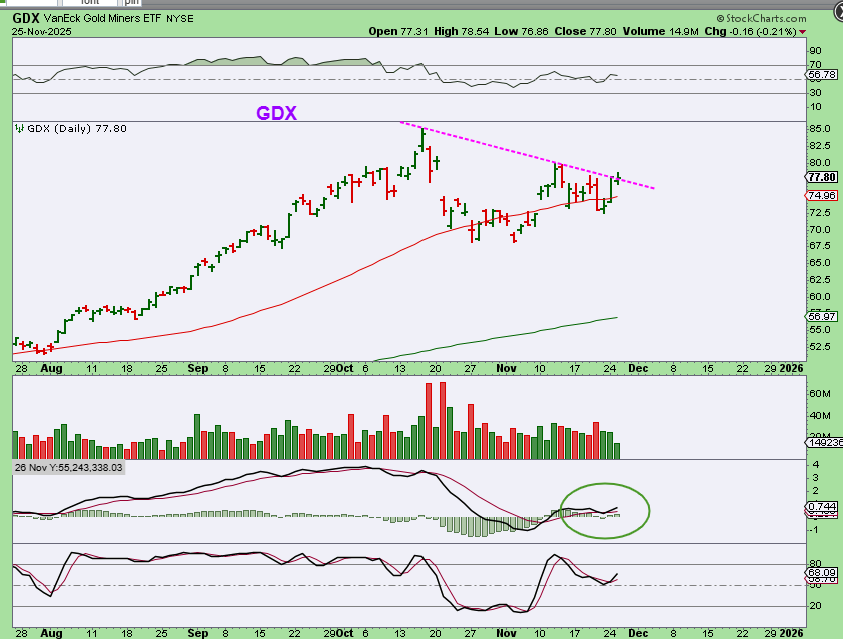
GDX was a bit stifled, but the chart looks bullishly set up and a few Miners looked very good.
.
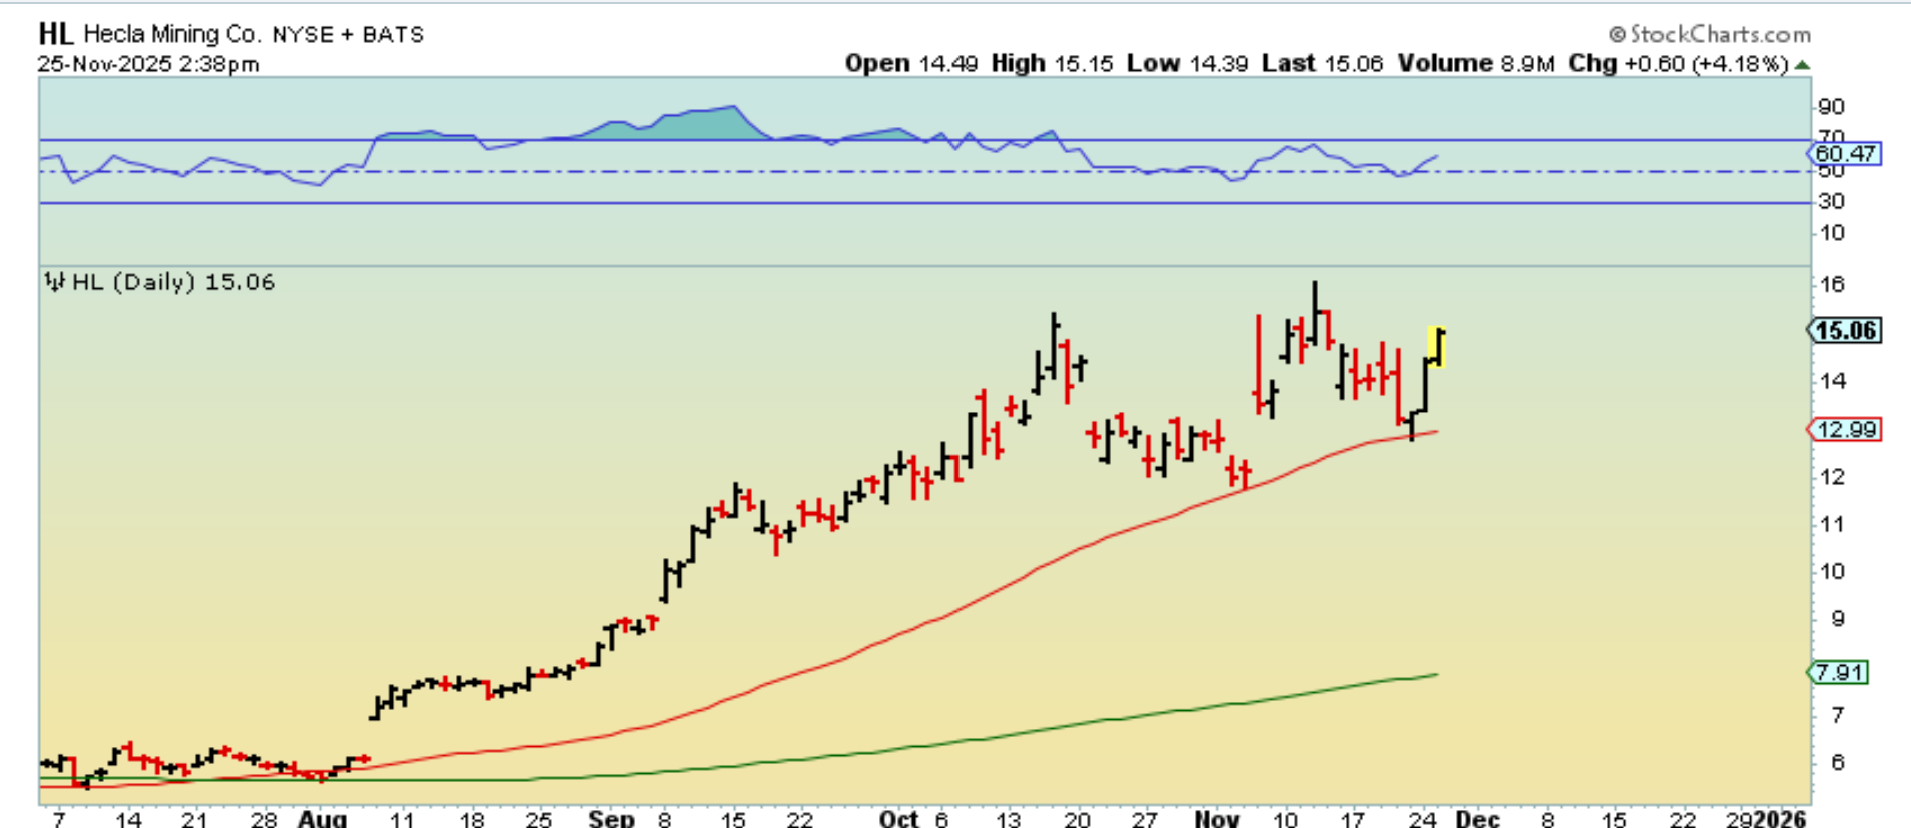
HL was pushing higher, up 4% by 2:30 p.m. ET after bouncing right off of the 50sma twice.
.
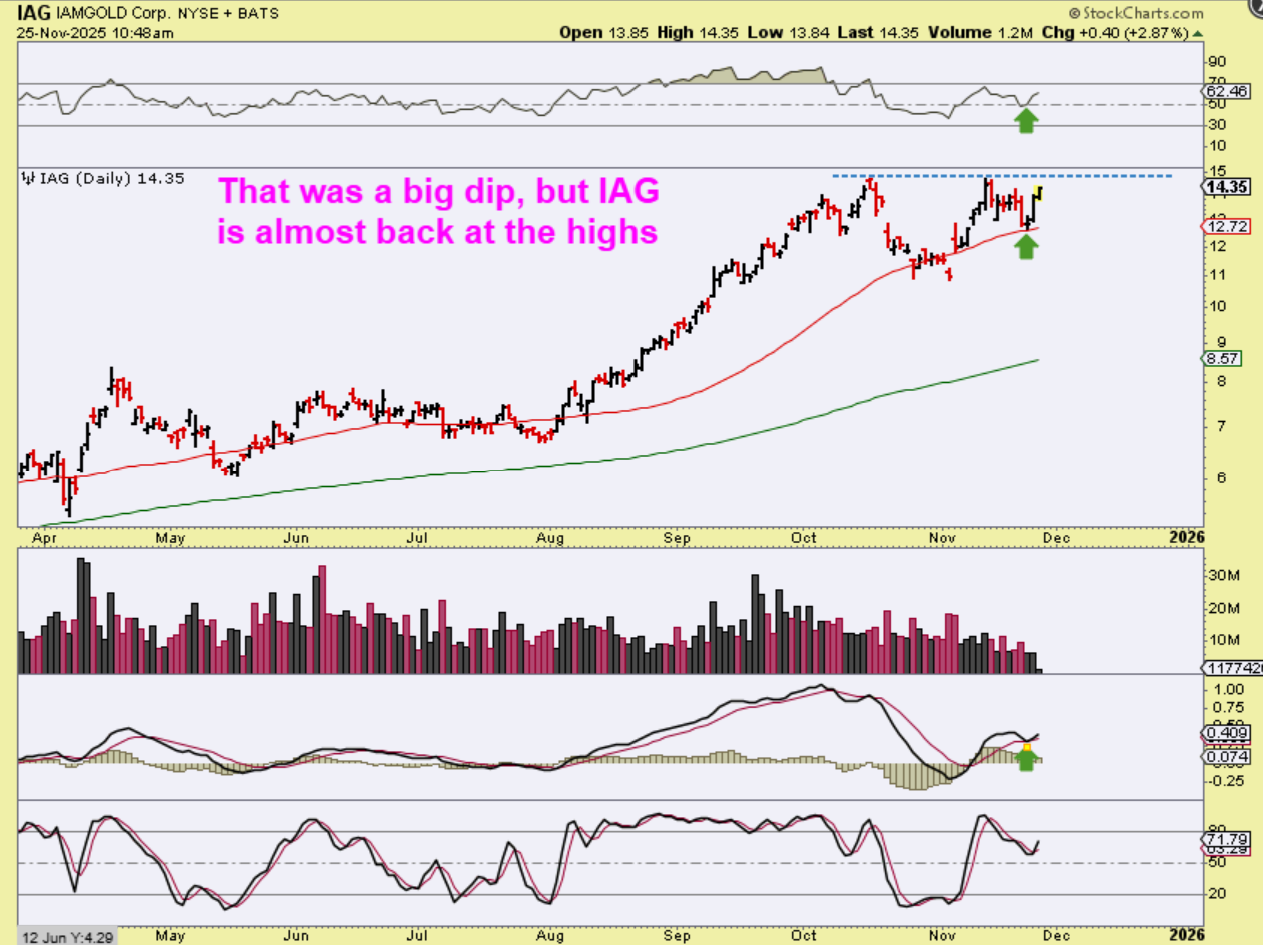
I pointed out IAG after the first hour of trading as being almost back at the 2025 highs. It moved from a reversal at the 50sma to …
.
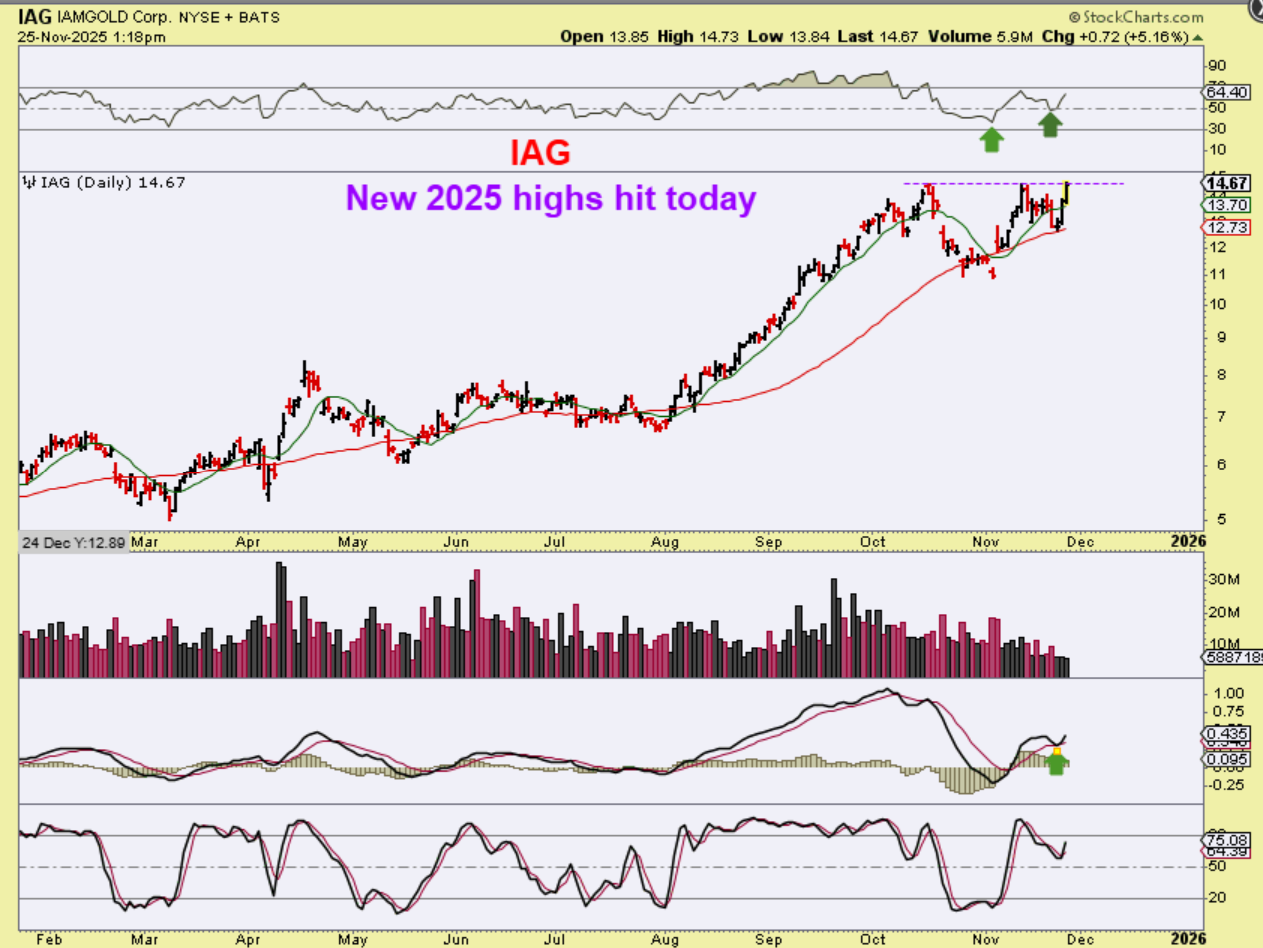
IAG moved to 2025 highs by midday. As a trader or buy & hold at support, a trade like this (Say you bought 500 to 1000 shares), ran from $11 when we saw the dcl or even $12.70 from the 50sma reversal Friday, to $14.70. at $2 / share with 1000 shares, you’d make $2000 on this stock alone. IAG looks like an odd cup and handle now, but obviously you would want a stop in place at the 50sma at this point.
.
As I write this report, Gold is up $35, but Silver is up almost $1. The bounce continues.
.
.
Silver actually looks like a nice cup and handle. Like I said, if this breaks the day 12 peak, it is in new all-time high territory. I mentioned buying that dcl and raising stops along the way. You could easily raise stops now if you haven’t.
.
Has the recent talk of the need for a rate cut in December by several of the Fed Members changed the markets to bullish? It has definitely had that affect short term, and it is possible that the lows came in with a milder than normal dip. We won’t know that until we break to new highs, so buying with a stop is important. Trading has been good this week and buy and hold would be working for now too, but I personally have simply been buying in the morning and selling toward the end of the day. Fortunately, the morning has had prices open ‘even’ or ‘down’ and then using intraday charts things start to find buyers and they run higher. Like I said though, buy and hold has been pushing higher on this holiday shortened week too. MARKETS ARE CLOSED TOMORROW, and we have HALF A DAY on FRIDAY, and these may be green days too, as the sellers seem to have taken a break this week 🙂 I have a doctors appointment this morning, so I will be away for a few hrs. I hope that I will be back to trade & discuss the markets in the comments by 11 am ET. Let me know if you see anything interesting in any sector. Enjoy your Wednesday trading!
.
~ALEX
.
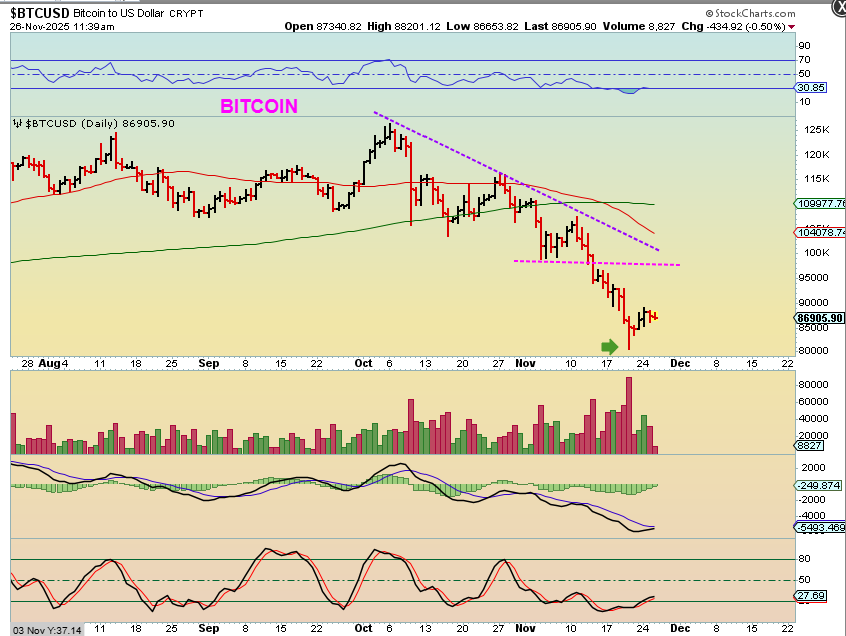
BITCOIN looked to have a dcl in the 60 day area (magenta line), and suddenly it just sold off sharply. We now have a reversal and a small bounce. If that was our dcl, I would expect this bounce to last for a couple of weeks, but it may just be choppy and lack-luster. Even with this weak bounce, some of the crypto stocks are doing well. I’ll show you…
.
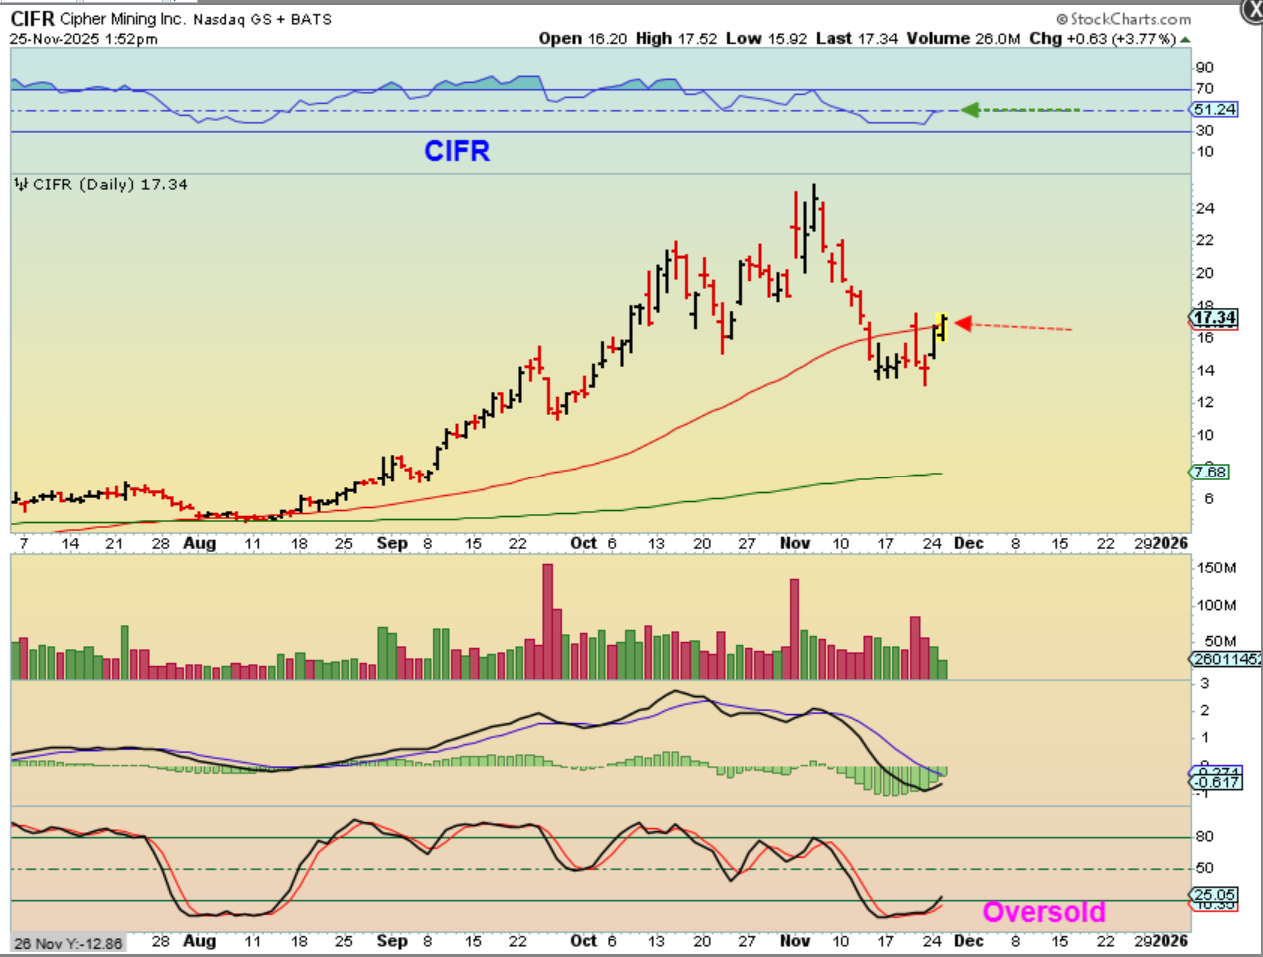
CIFR started to break the 50sma, but this has been a move from under $14 to over $17 and it can continue.
.
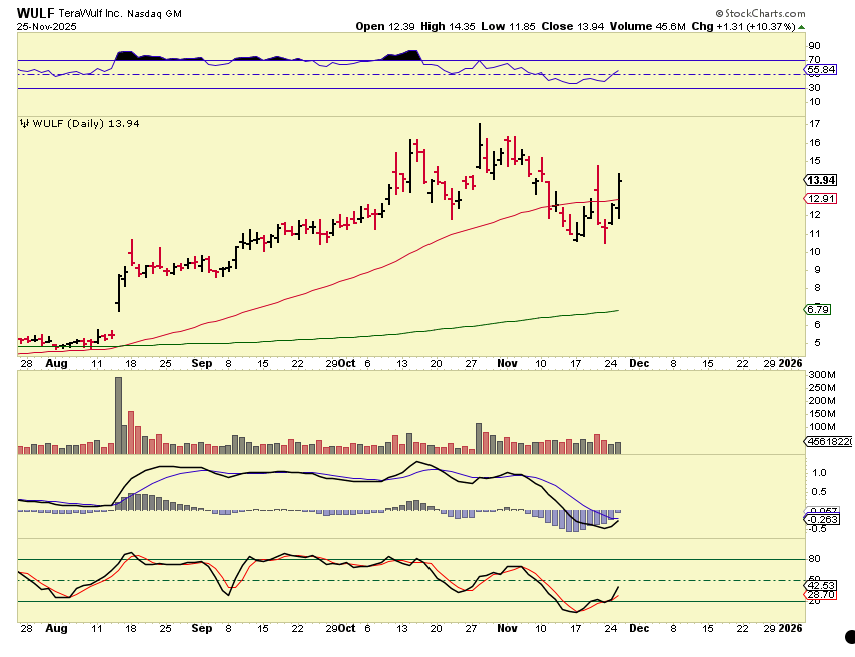
WULF was up 10% and regained the 50sma. It has moved from close to $10 to $14. HUT has moved from $30 to $40. So the bounce so far is profitable. I have traded this area too.