November 23 Weekend Report – Happy Landings
Hey all, Welcome to the weekend report!
I just want to mention, not for sympathy, but just to explain, that it was a week ago Saturday that my father was in a car accident. He died on Thanksgiving several days later. This weekend I spent time with family, and it was very nice. We are all doing well and in a good place, but the report is later than usual, so that is why. Thanks for your patience. That said, I will also be in and out of the comments this week. I DO plan on trading, maybe a full days on Monday and Tuesday, but I know that I will be away Wednesday morning for a follow up Dr. appt, and I May be with family parts of Wednesday afternoon, Thursday and Friday. All is good though, my family likes to laugh a lot, so we are in a good place. Let’s get to our markets!
.
AS A REMINDER:
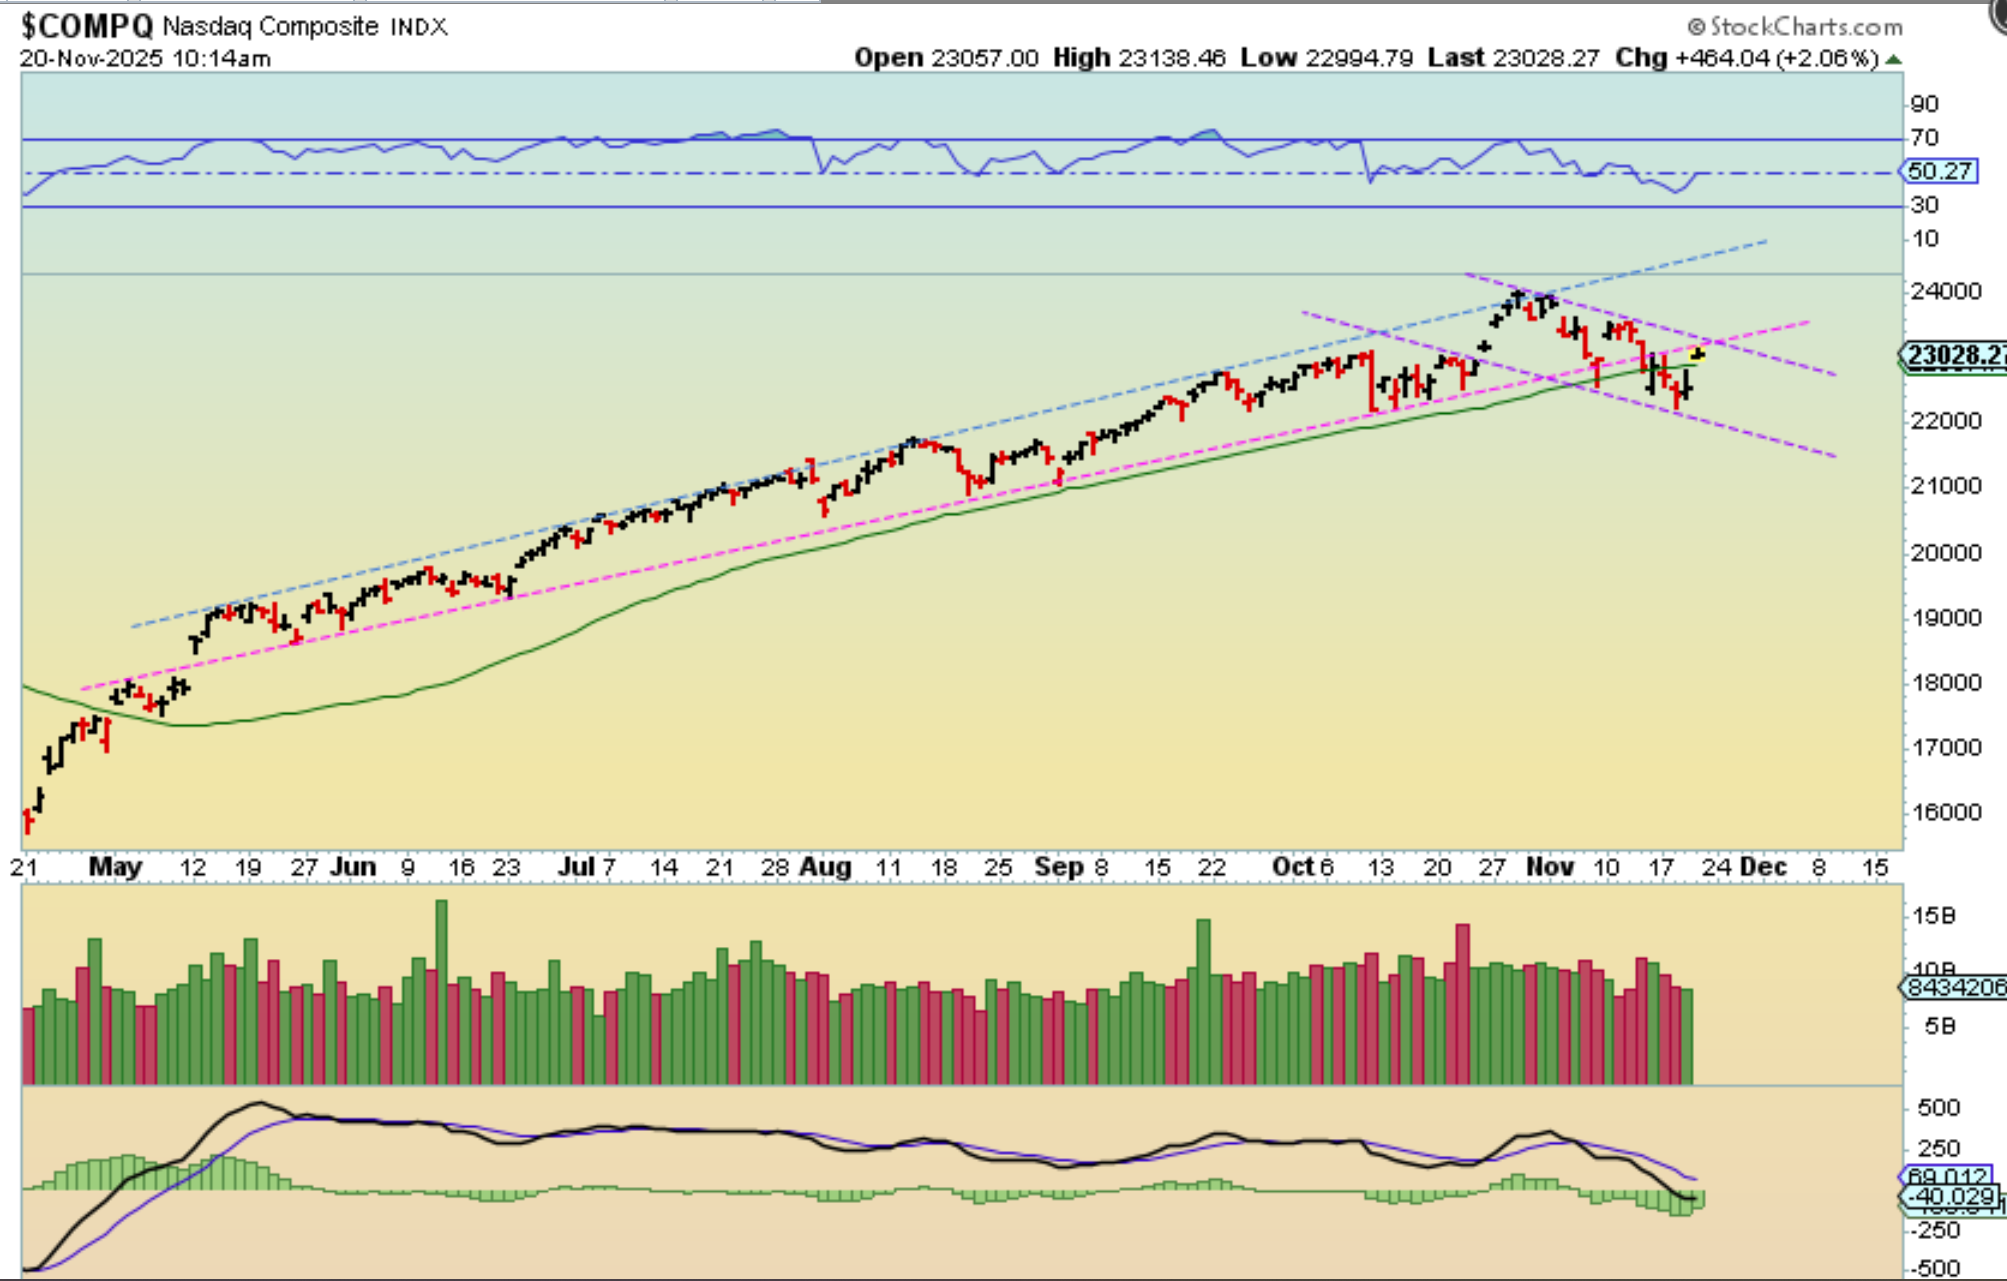
On Thursdays Jobless Claims Report, The NASDAQ gapped up to the top of a downtrend line and the underside of an uptrend line. It stopped there…
.
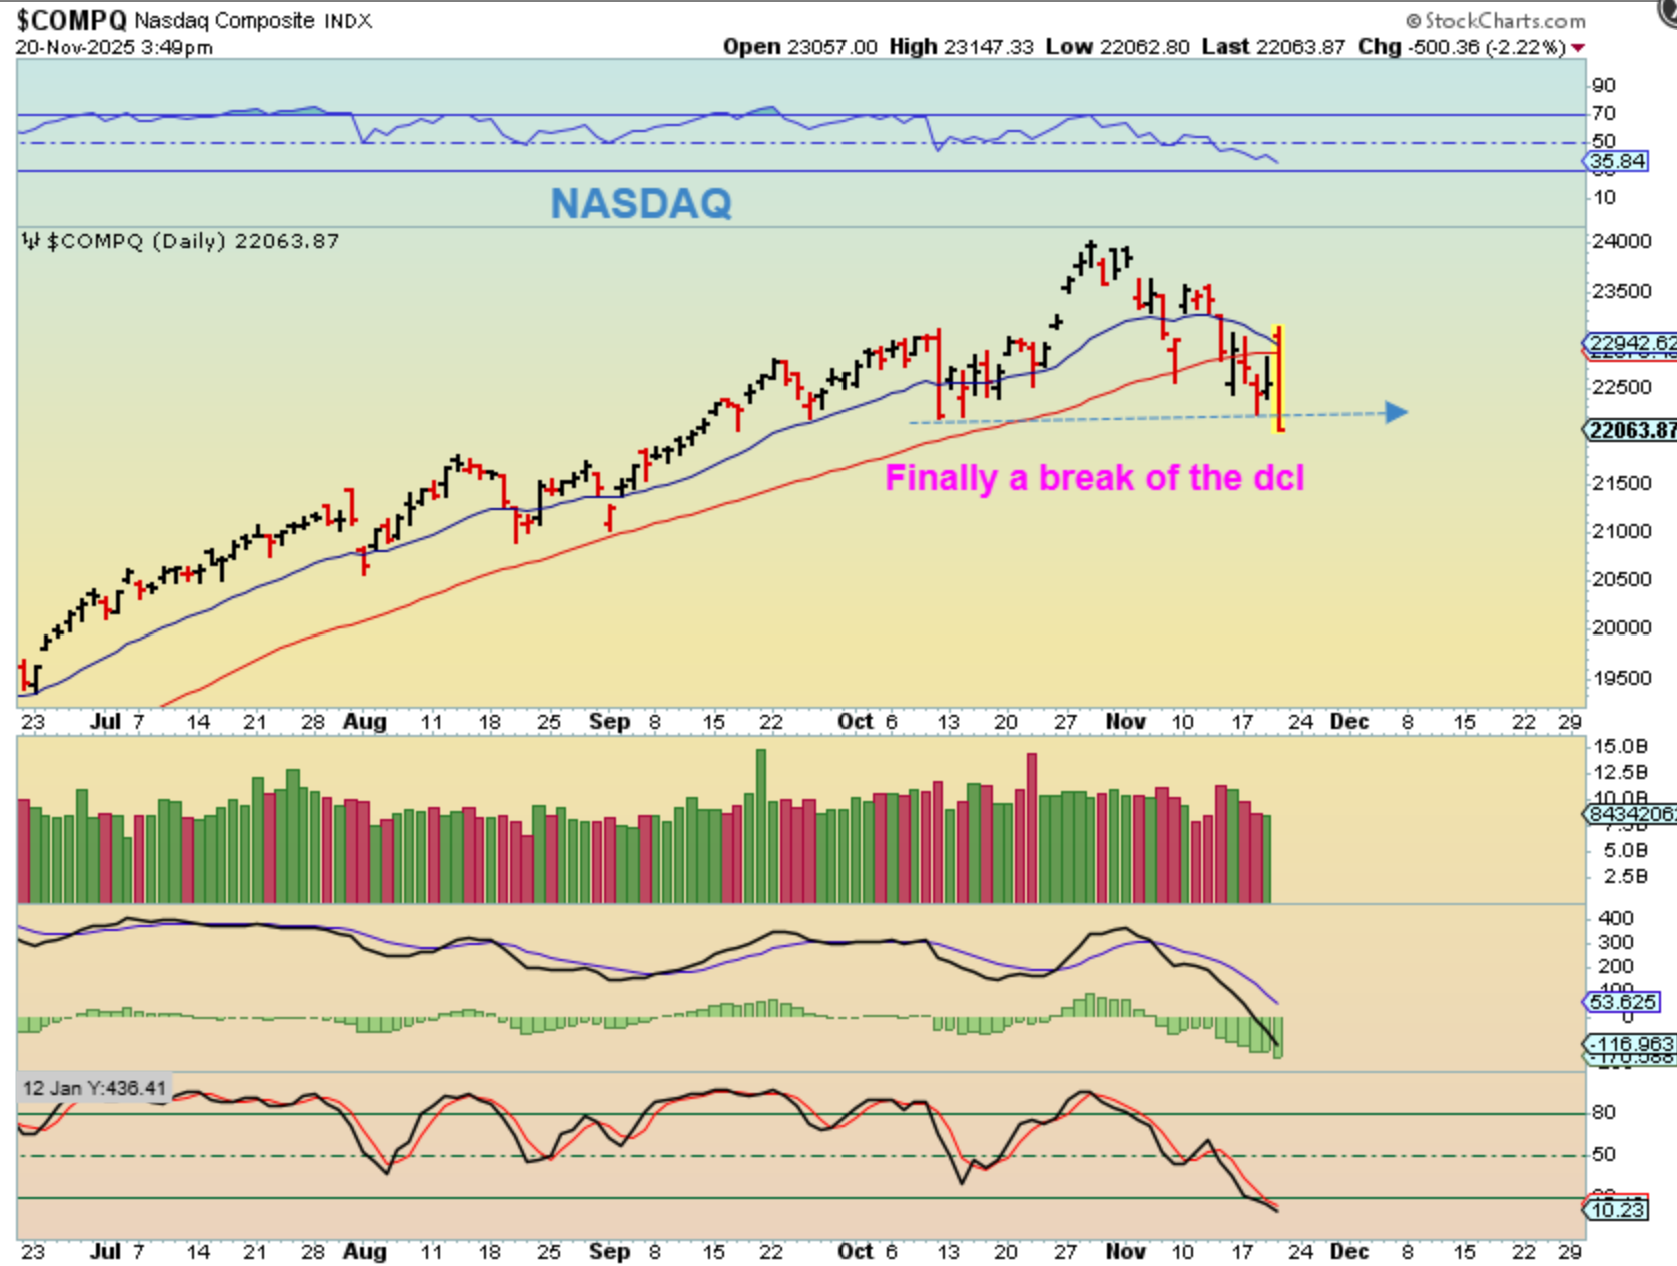
And it then dropped sharply, this was still on Friday. So we now had a failed daily cycle this week and that more often than not, leads to more downside. It is not exactly too late in the daily cycle count. So where are we now after Fridays trading?
.
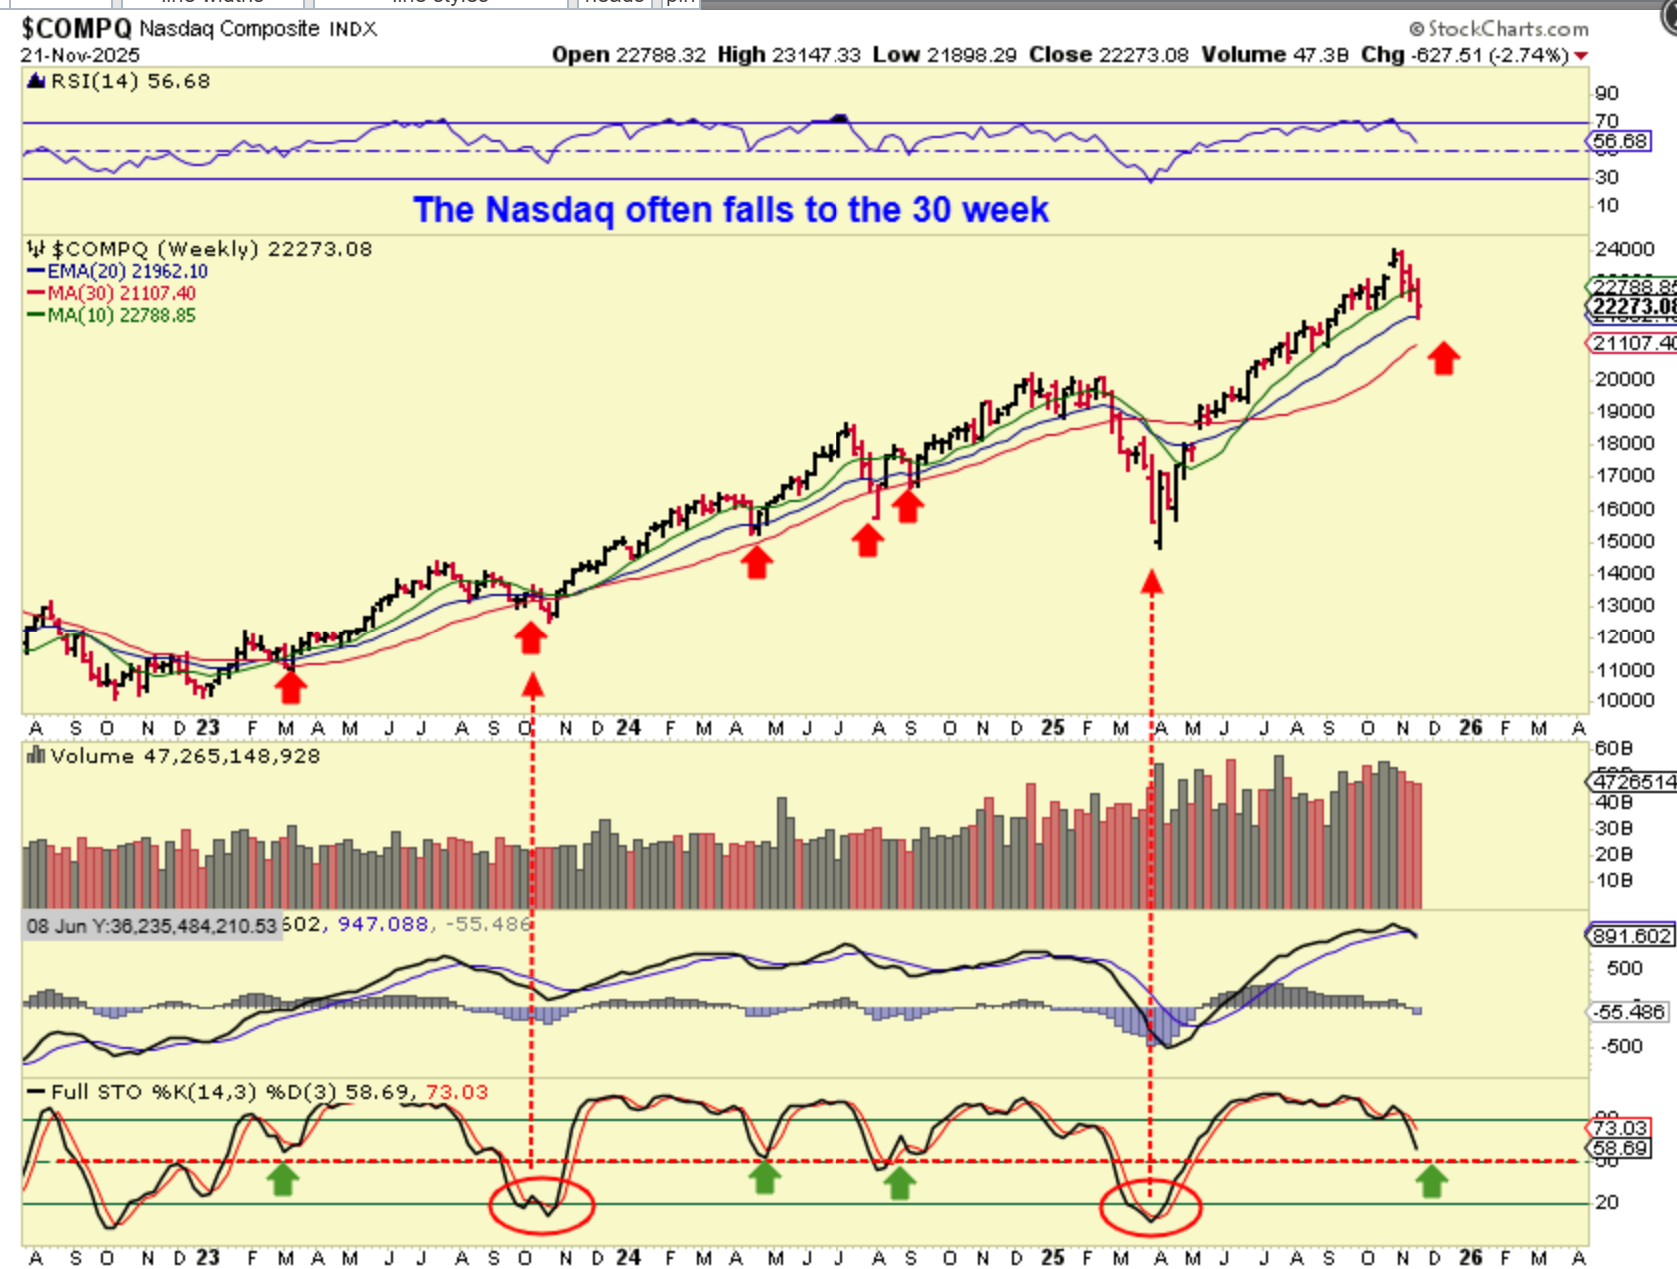
THE NASDAQ WEEKLY fell to the blue 20 week ma and bounced, but with the daily cycle on day 30, we could bounce and drop one more time. Notice the red line. That often caught the price drop. Notice the stochastics too. We have shallow ICLs and DEEP ICls. I’m thinking that this should be shallow.
.
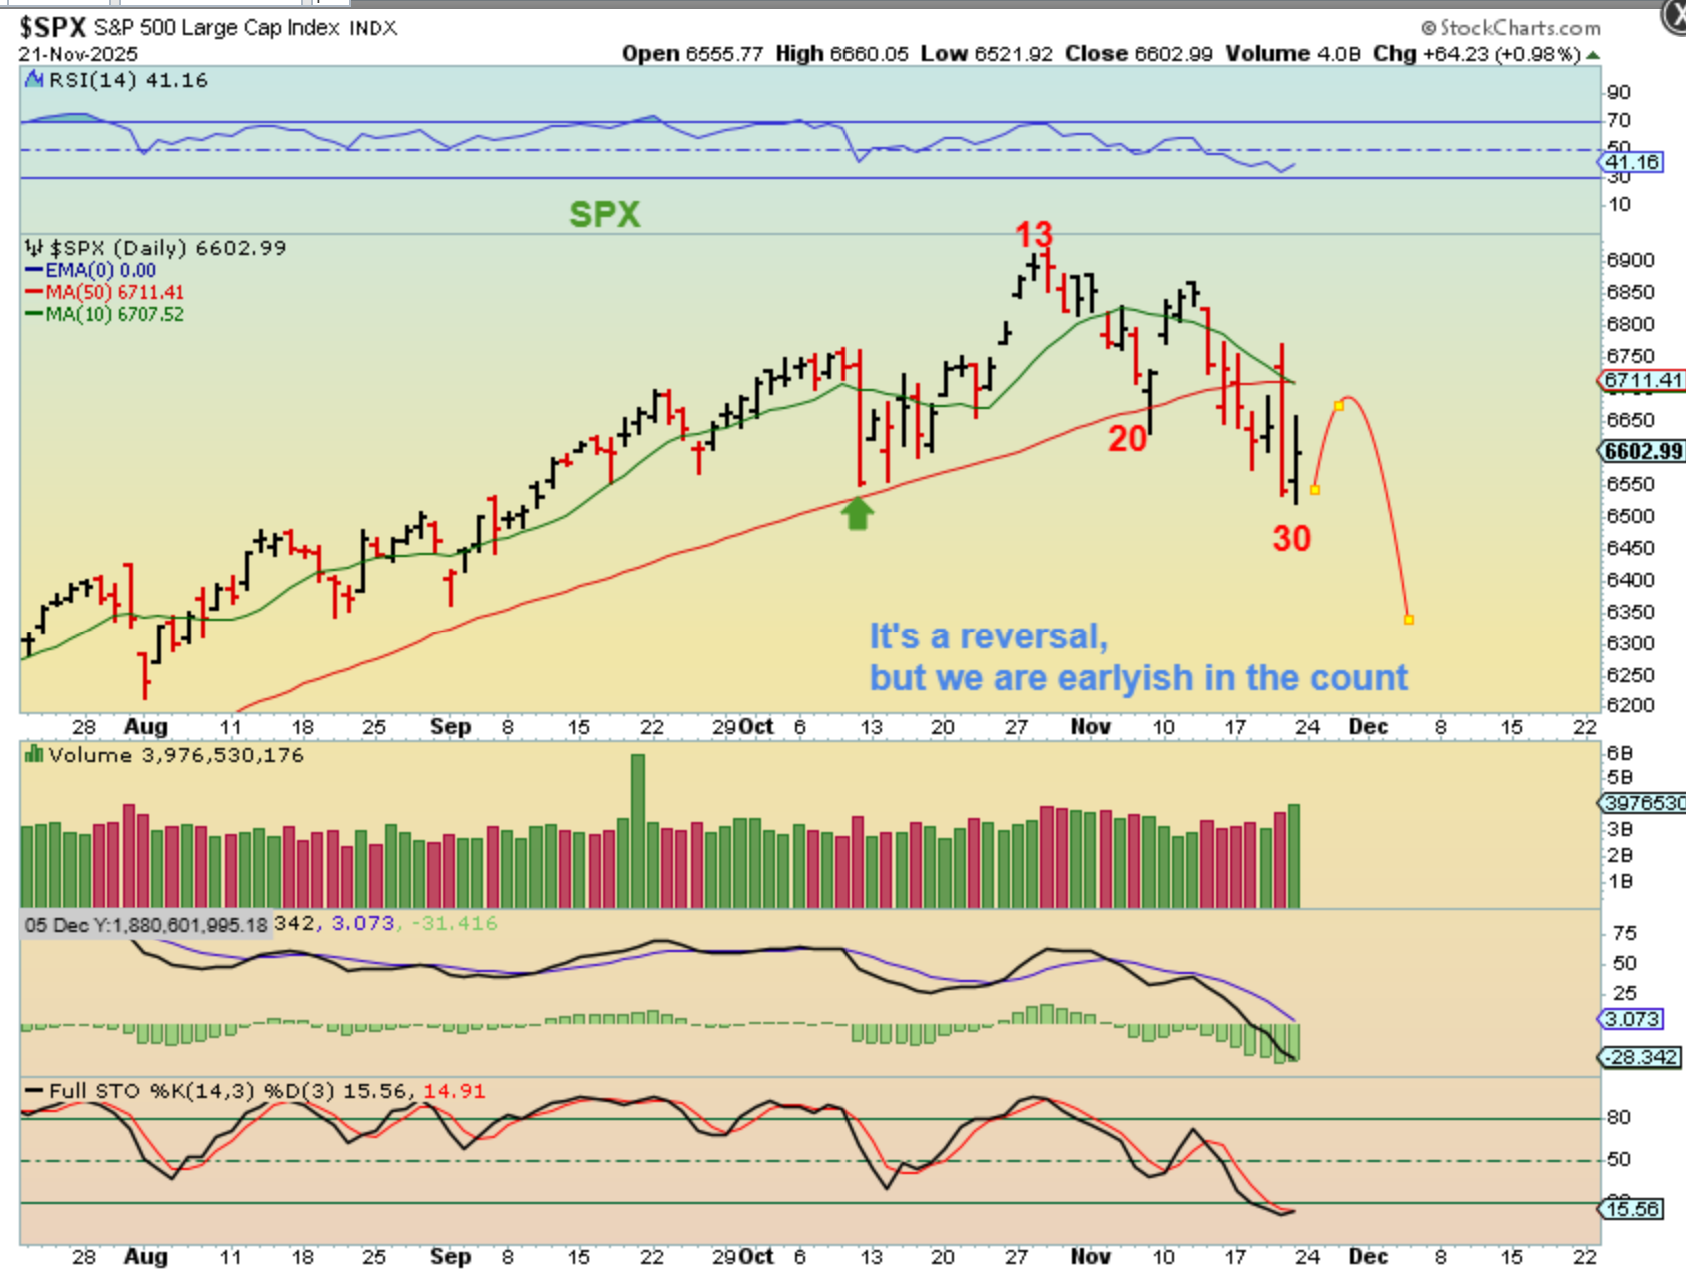
SPX DAILY – The general markets did have a strong reversal on day 30, and a bounce can follow. A bounce for a couple of days can follow, but is it a dcl? I tend to doubt it at day 30. What if the markets go to a 40 day daily cycle? We could bounce this week and crash next week. You can buy any reversal candle with a stop under the lows, but I’m watching the 50sma.
.
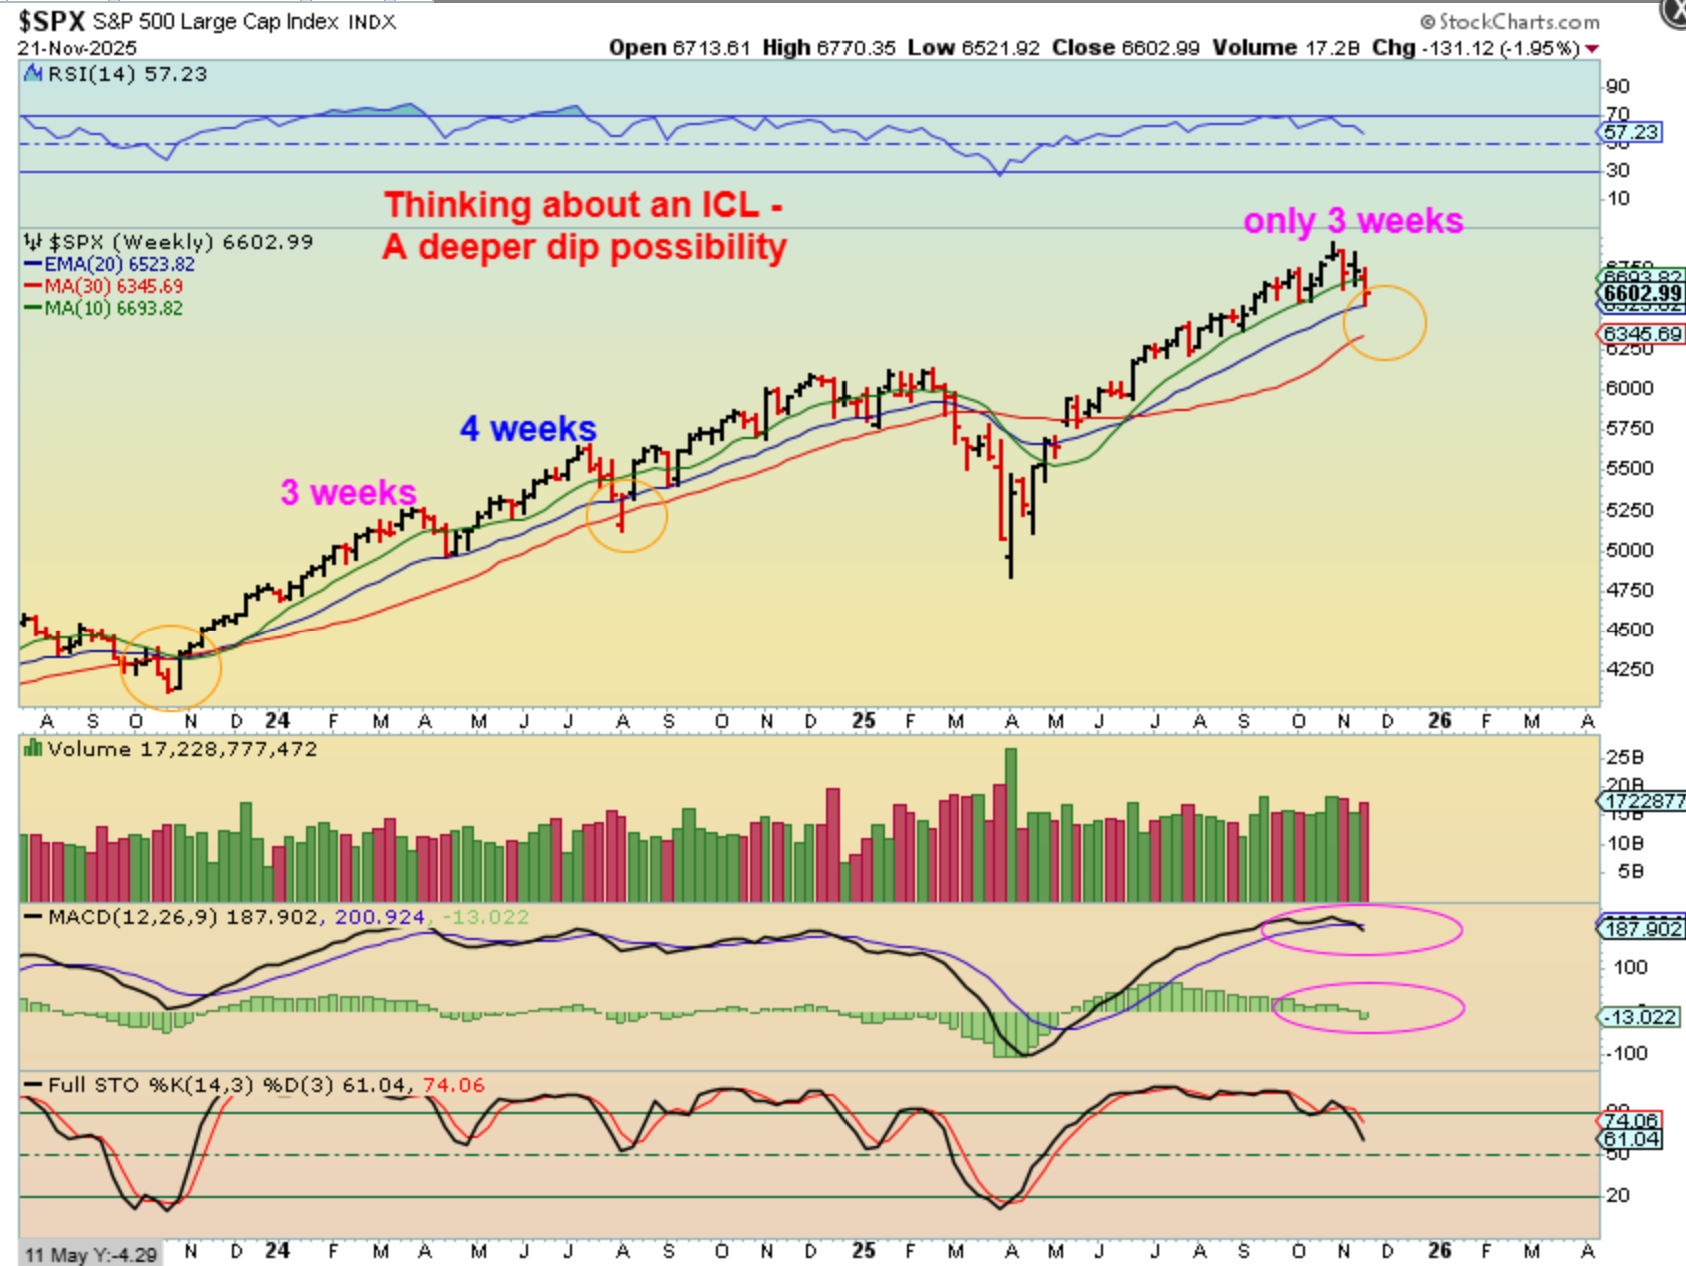
THE SPX WEEKLY – A drop to the blue 20 ema has been support in the past at dcls, but are we looking for an ICL? At month 7 we would be, so we may bounce and then drop again to the red line. I am pointing out 3 & 4 week drops in the past too. If we bounce and drop to that red line, the bounce is our next ‘short’ possibility.
.
The next 2 charts were in Fridays report and I think that they are important and they still apply, ESPECIALLY when you consider that these daily cycles often differ in length, so…
.
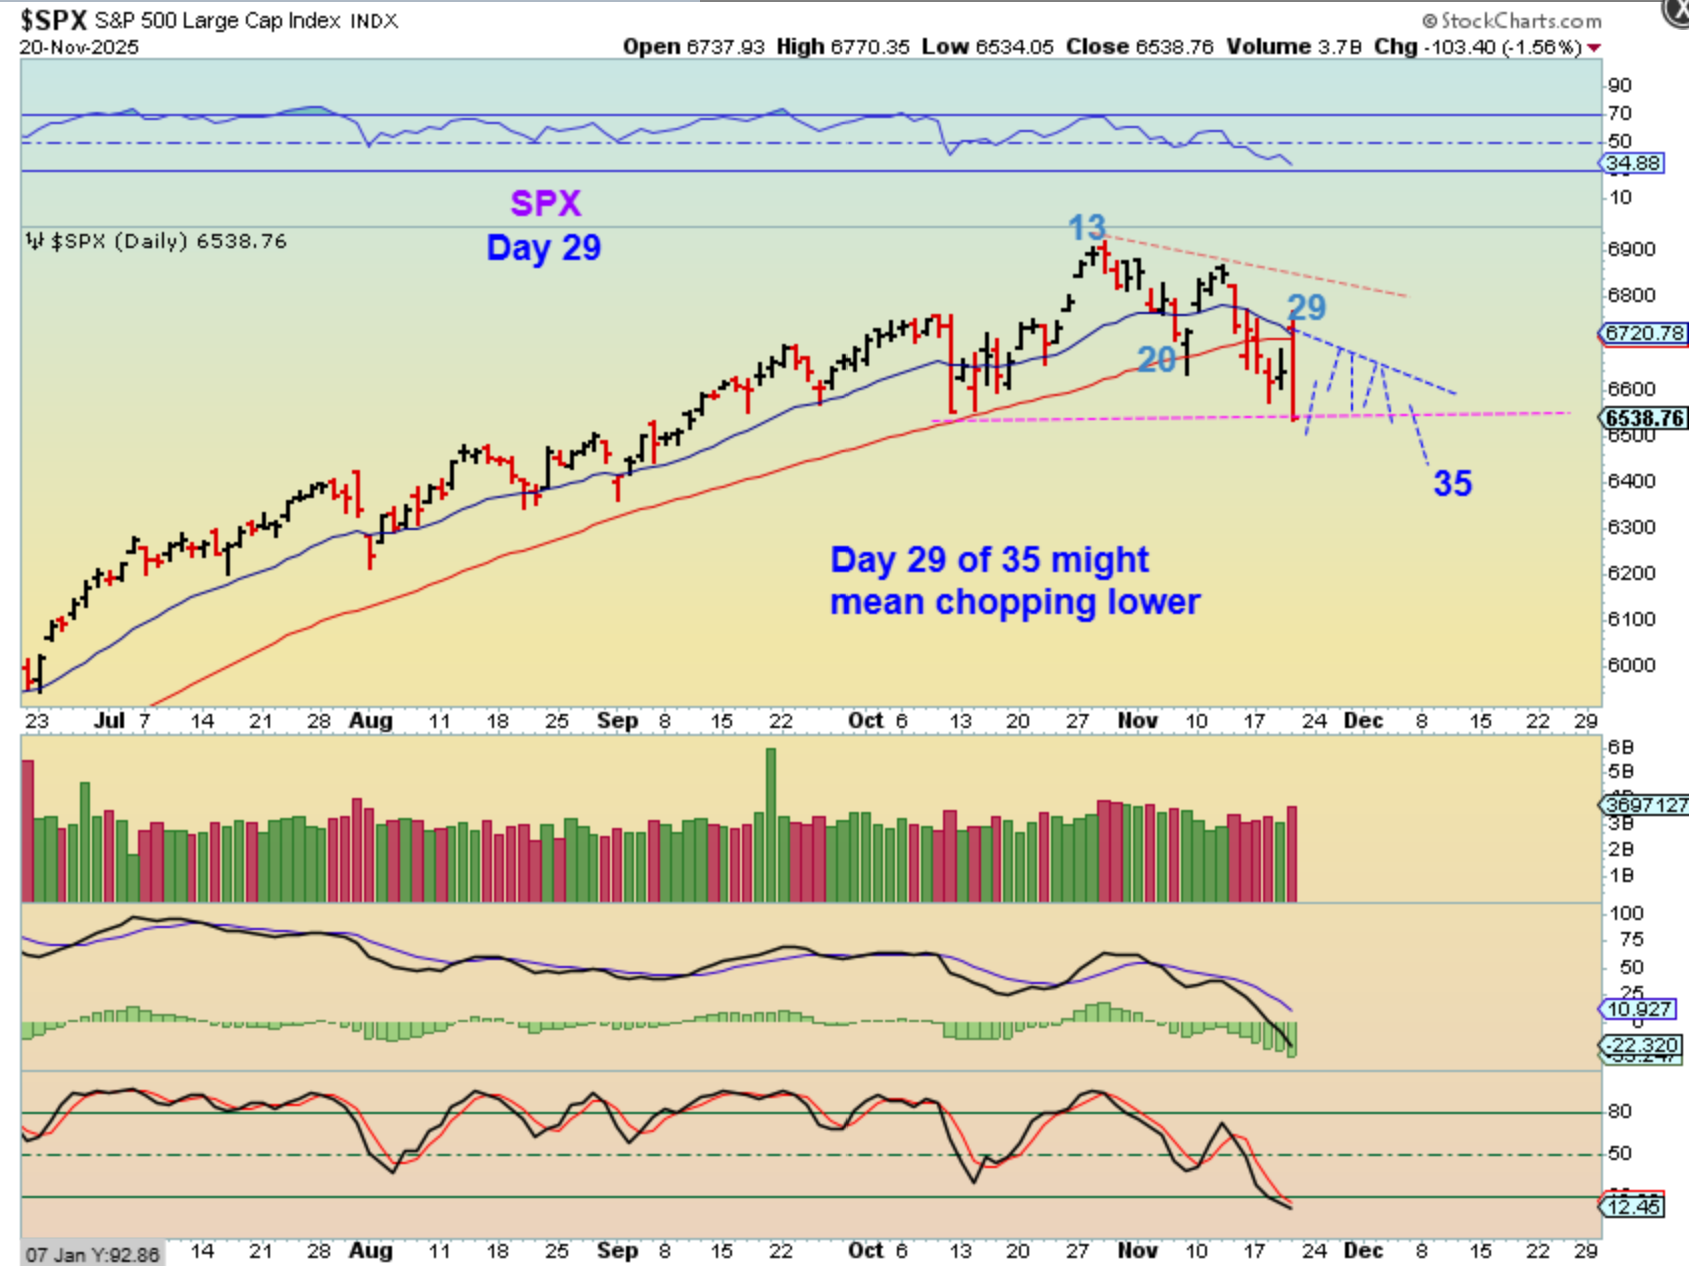
#1 Let’s just say that we get 35- 40 days for The SPX daily cycle: It may not be drop, drop, drop. It may be chop, chop, chop. That is hard to short, however
.
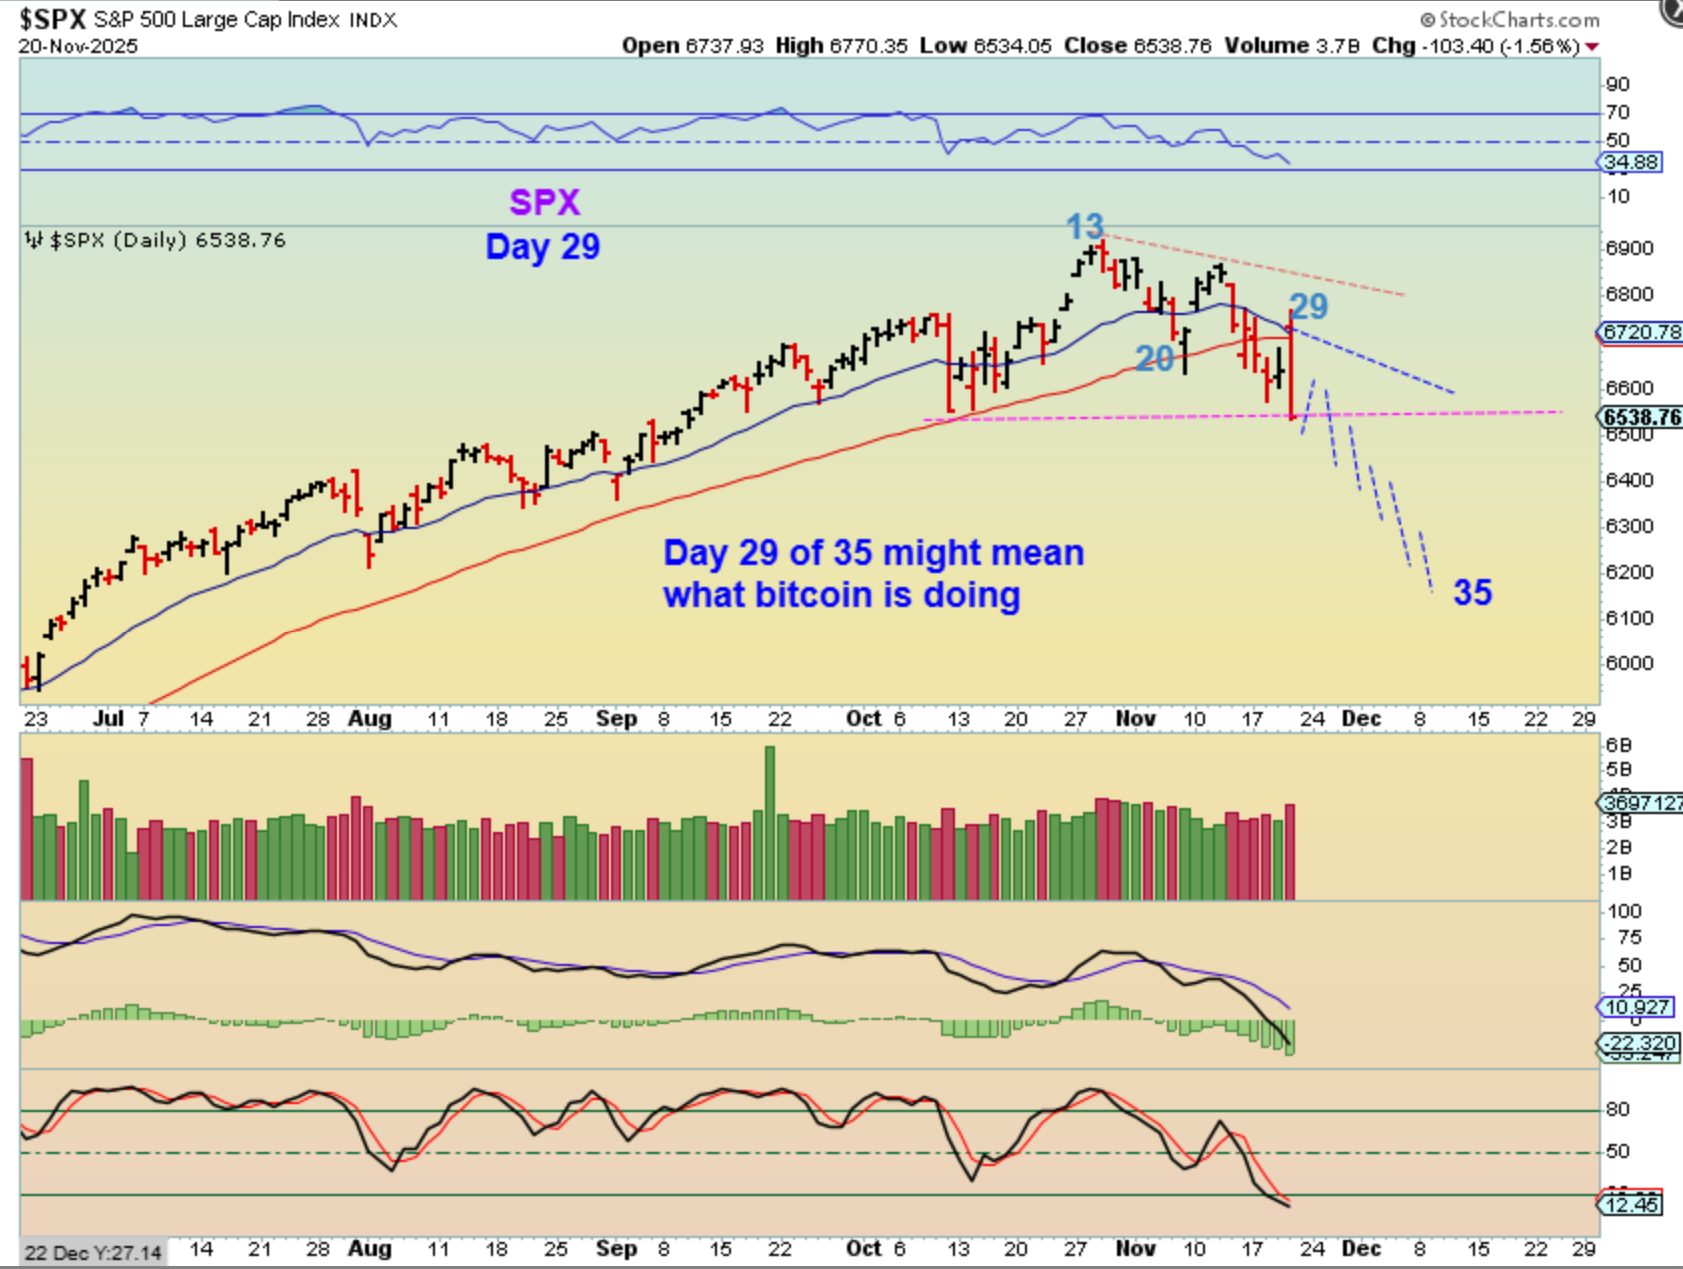
#2 The SPX daily cycle MIGHT do what Bitcoin is doing with so much time left. Now that the lows of the dcl have been broken, some retail traders may see this as a ‘lower high, lower low’ and stop buying dips. They may instead start to sell positions along with smart money. You could short with a stop using SQQQ, SOXS, etc.
.
So now that we got our reversal on Friday, this may be what we see this week. Sideways bounce and more selling on the following week.
.
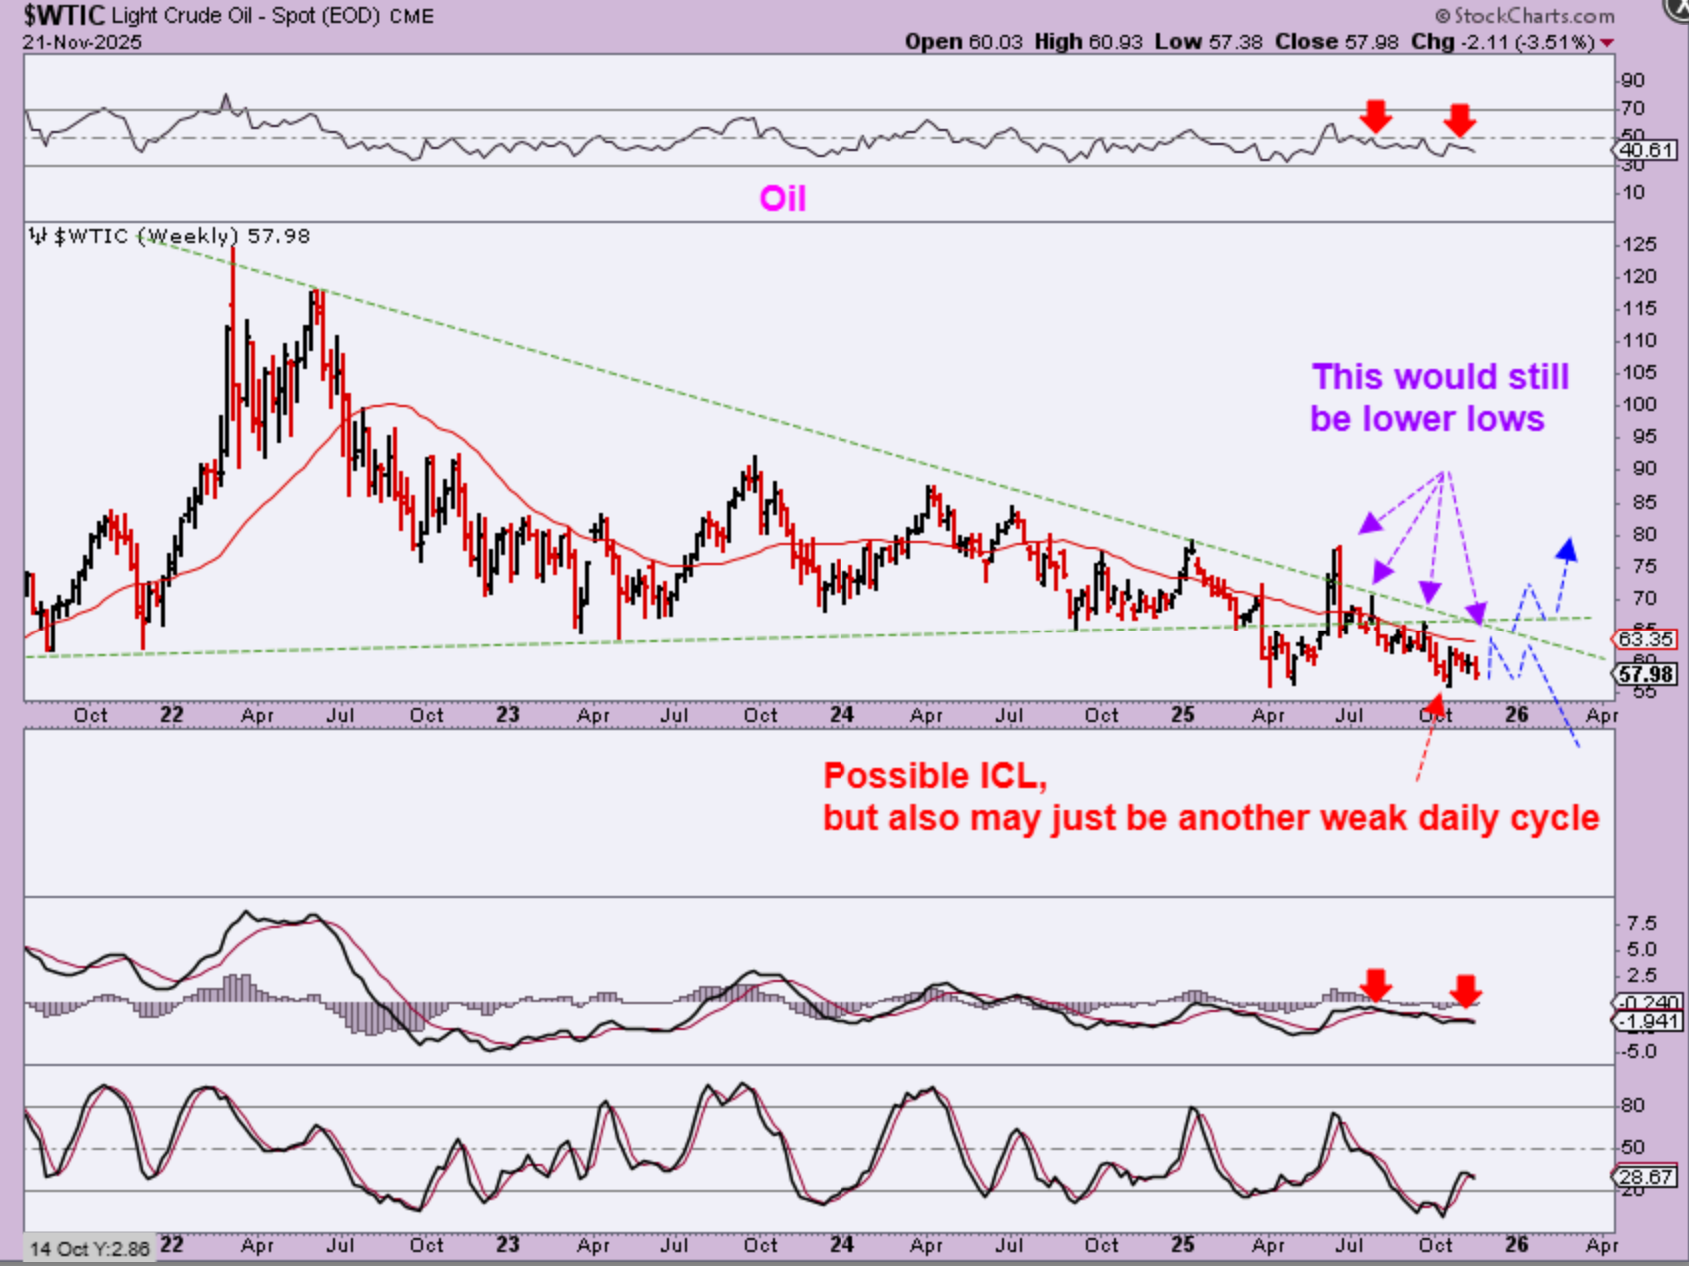
WTIC – Choppy – choppy Oil. Nothing has changed here. I thought that we might have an ICL and we would crawl under the 50sma and pop. So far, no pop. We ended the week down 3.5%.
.
BY REQUEST:
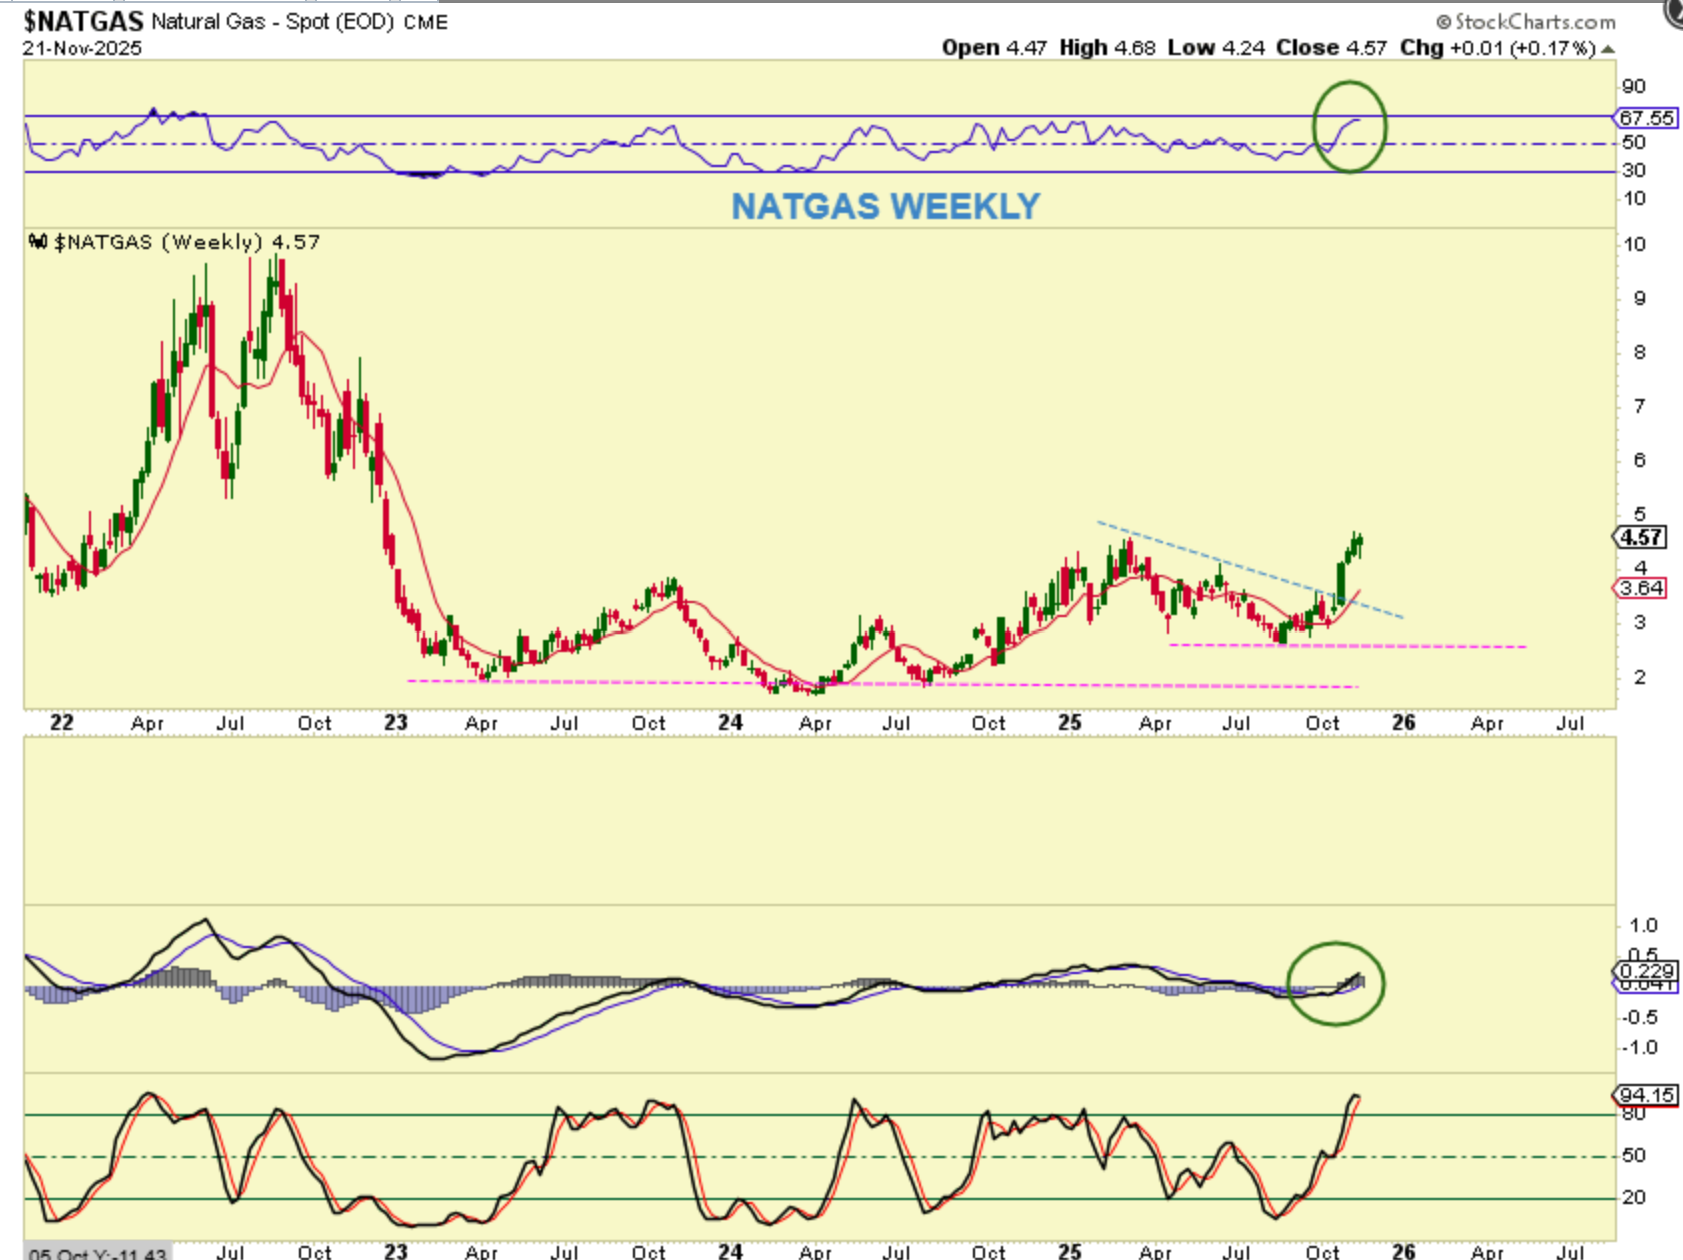
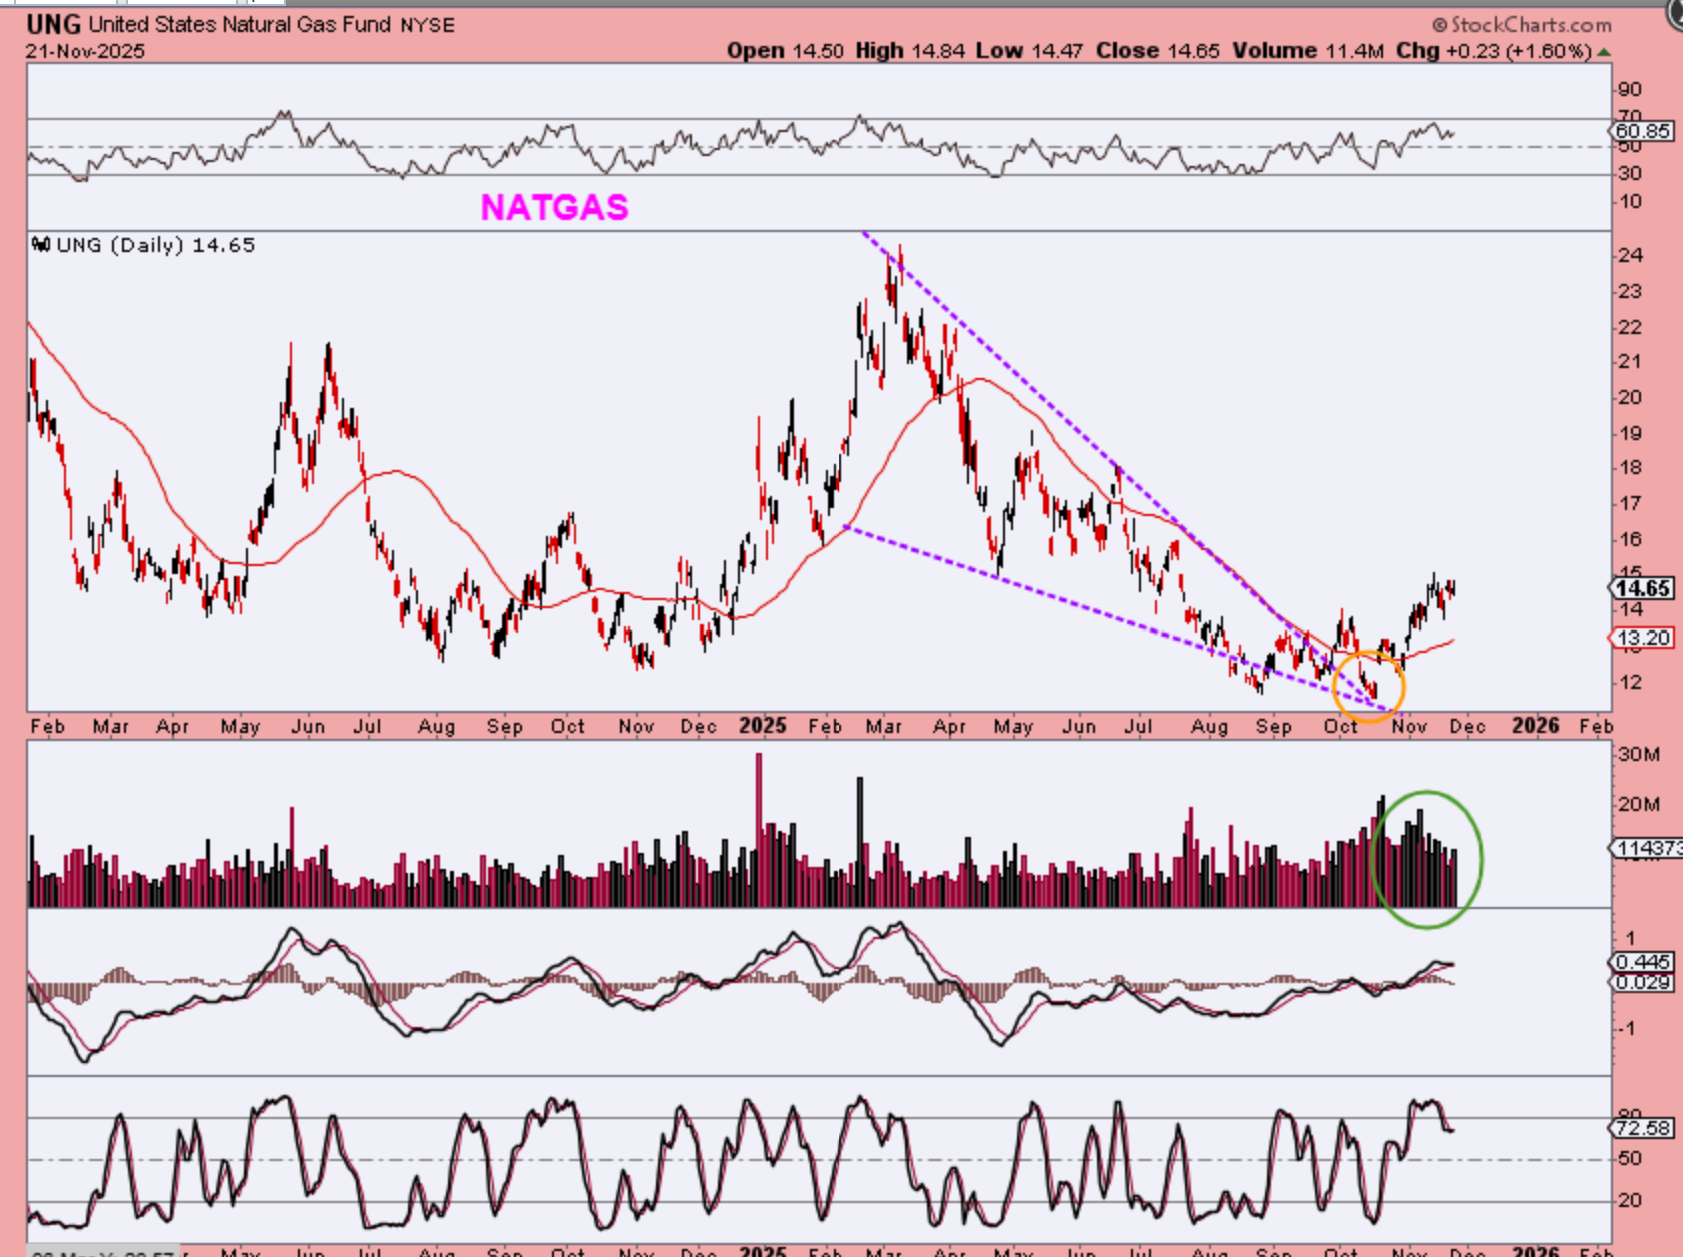
NATGAS blasted off and has a higher low in a multi-year base formation. Notice the lows in August. NATGAS has done very well over the last few months out of the August lows, but what about UNG. UNG has not followed NATGAS, it actually made a new low lower than the 2023-2024 lows!…
.
UNG made new lows in October, and these lows broke the 2024 lows. UNG has NOT followed NATGAS, but volume does seem to be piling in, so I do wonder if this will play catch up?
1. UNG broke a descending wedge, tested the lows again in October, making it look extremely weak, but
2. UNG has now shot up higher with volume. This may surprise to the upside.
3. BUY THE DIP? I think so. A drop to $13.50 or maybe $14 would be nice.
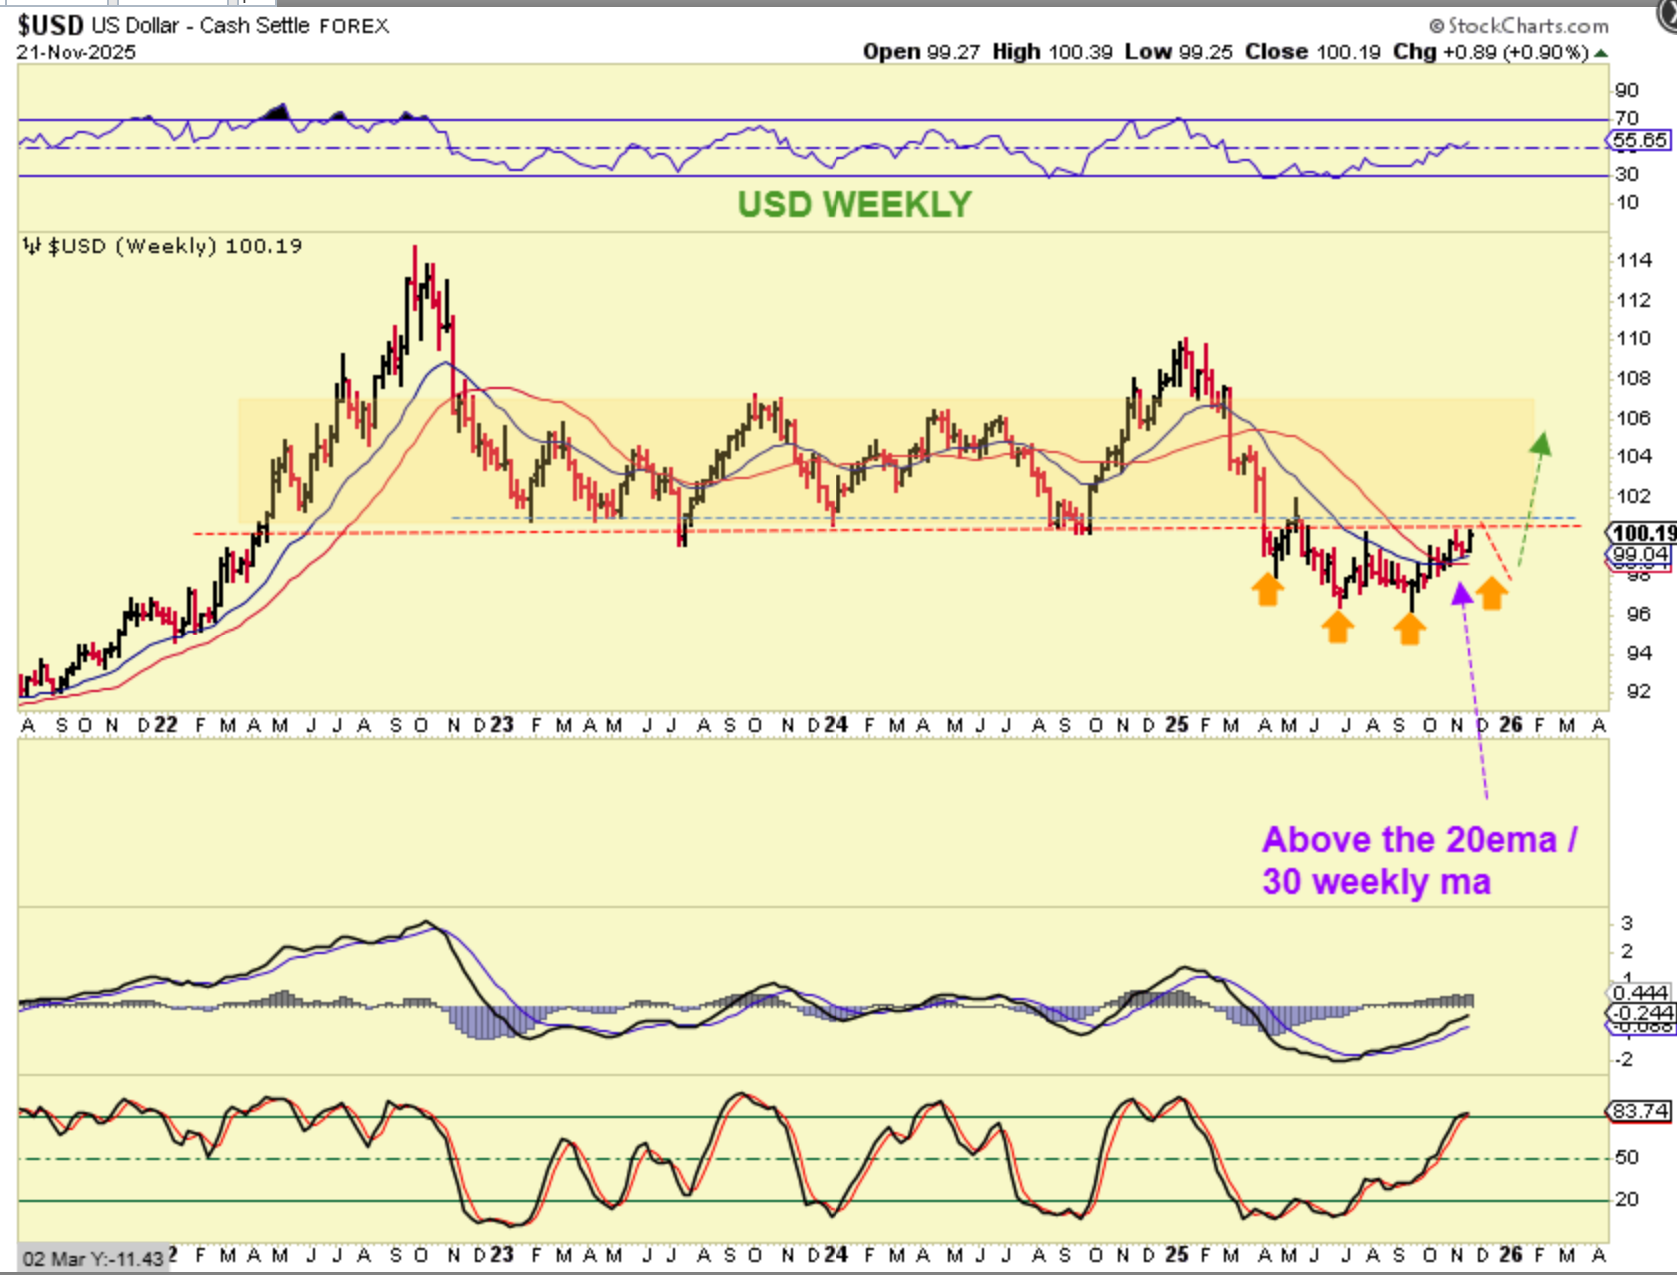
THE USD continues to put in the rounding bottom that I assumed that it would, and it should now start to make higher lows and higher highs. I have pointed out in past reports that Gold has been able to resist the USD’s strength, so we’ll see if that can continue(?), or does this mean that the USD bottomed and Gold has ‘peaked’? We shall see.
.
LET’s TAKE A GOOD LONG LOOK AT THE PRECIOUS METALS:
.
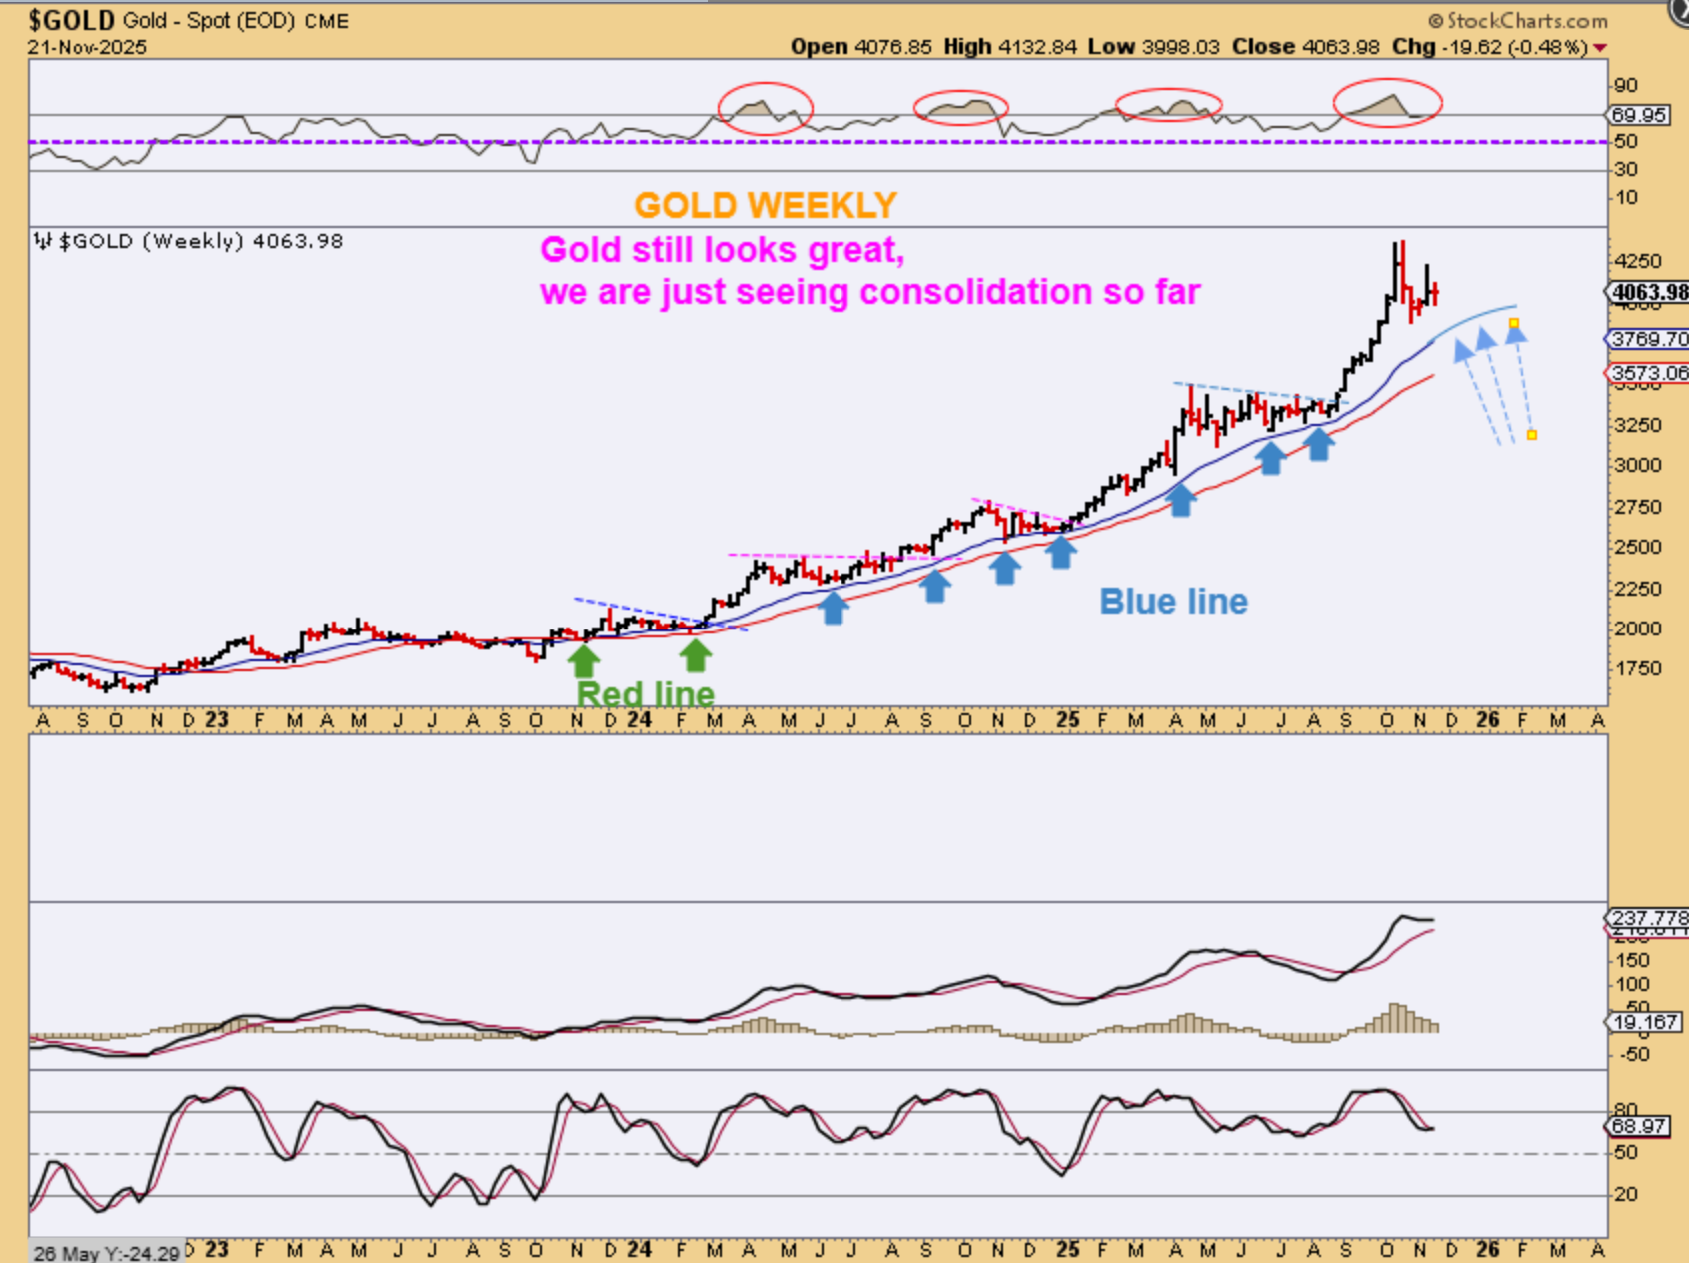
GOLD WEEKLY– Just take a good look at the blue line. Gold has not lost that line on a closing basis since 2023, so if we go below $3800, then we may need to start to take a really close look at Golds dip. A change in character would present itself in the form of weakness. Gold is at $4063 and the daily cycle is coming due for a dip to a dcl soon. I’ll show you that in more detail with Silver.
.
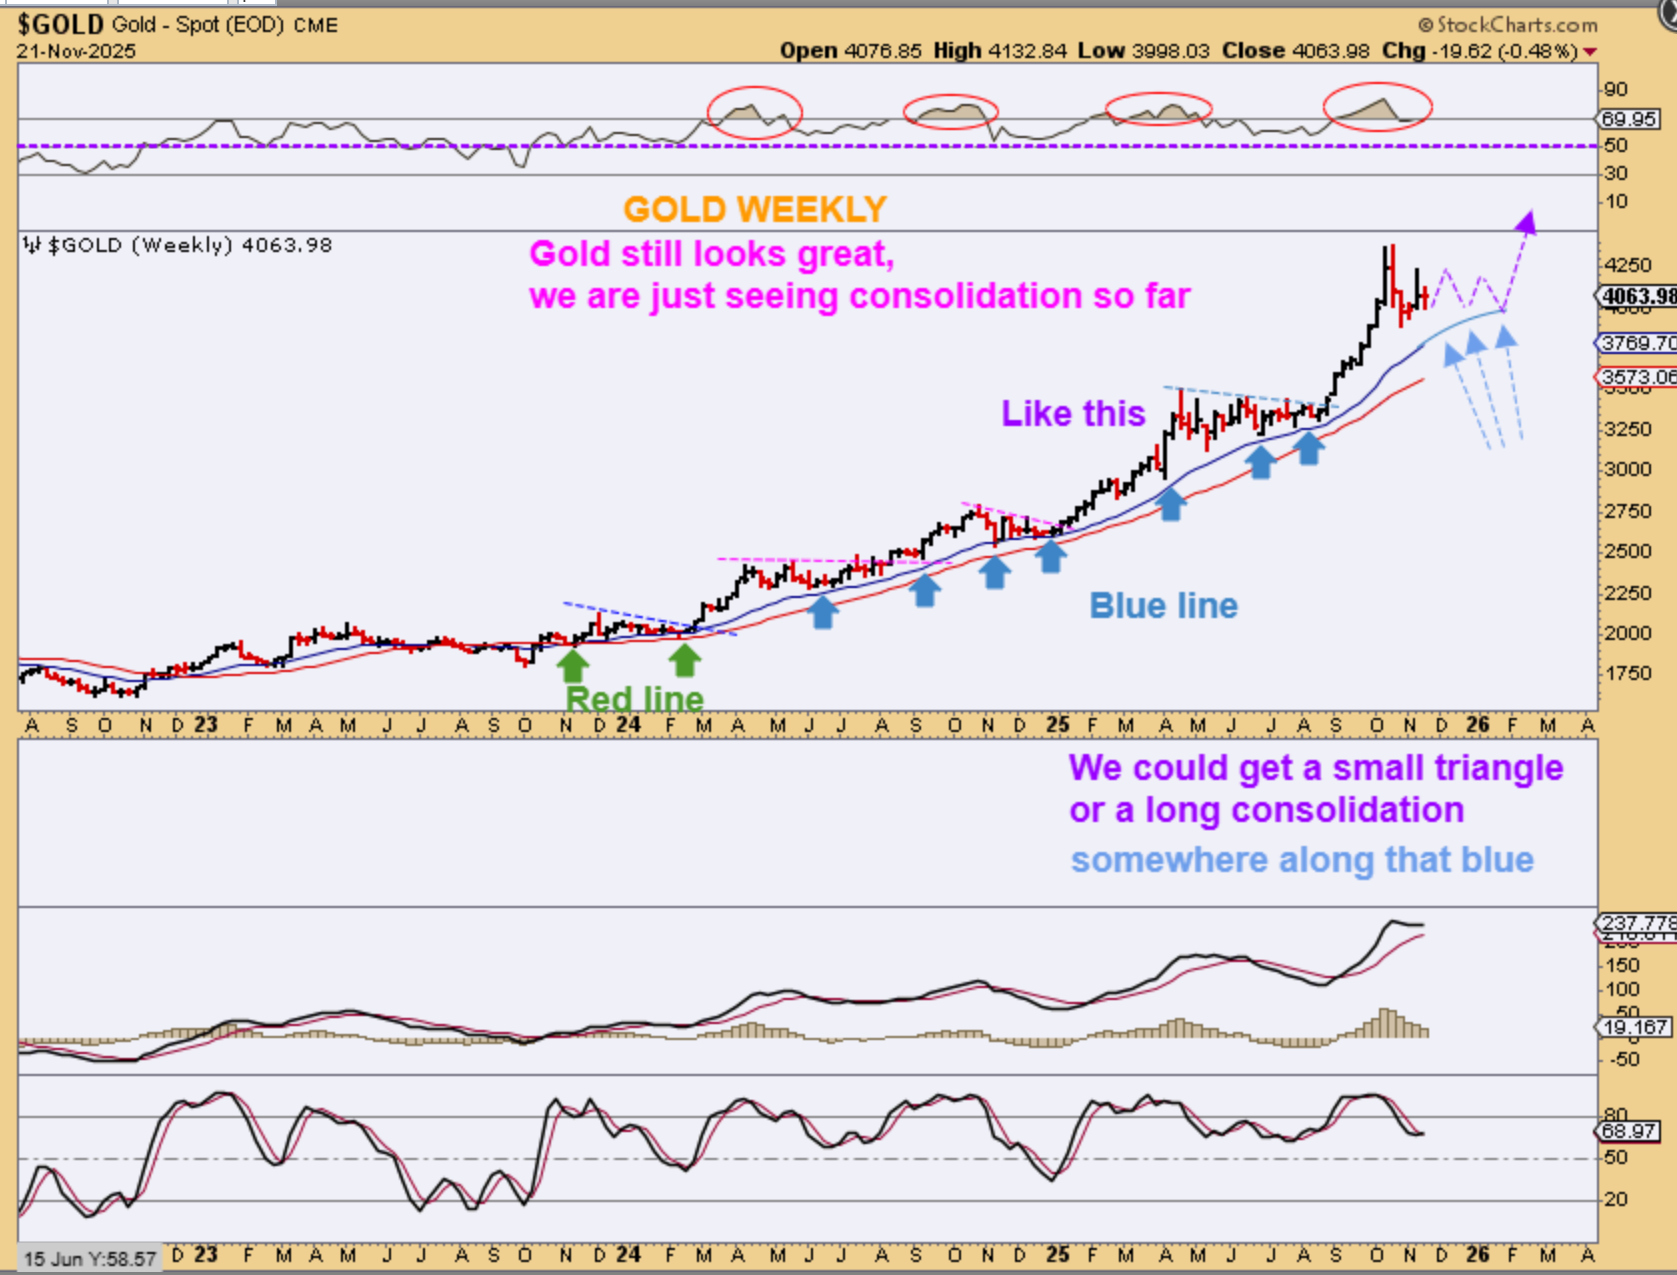
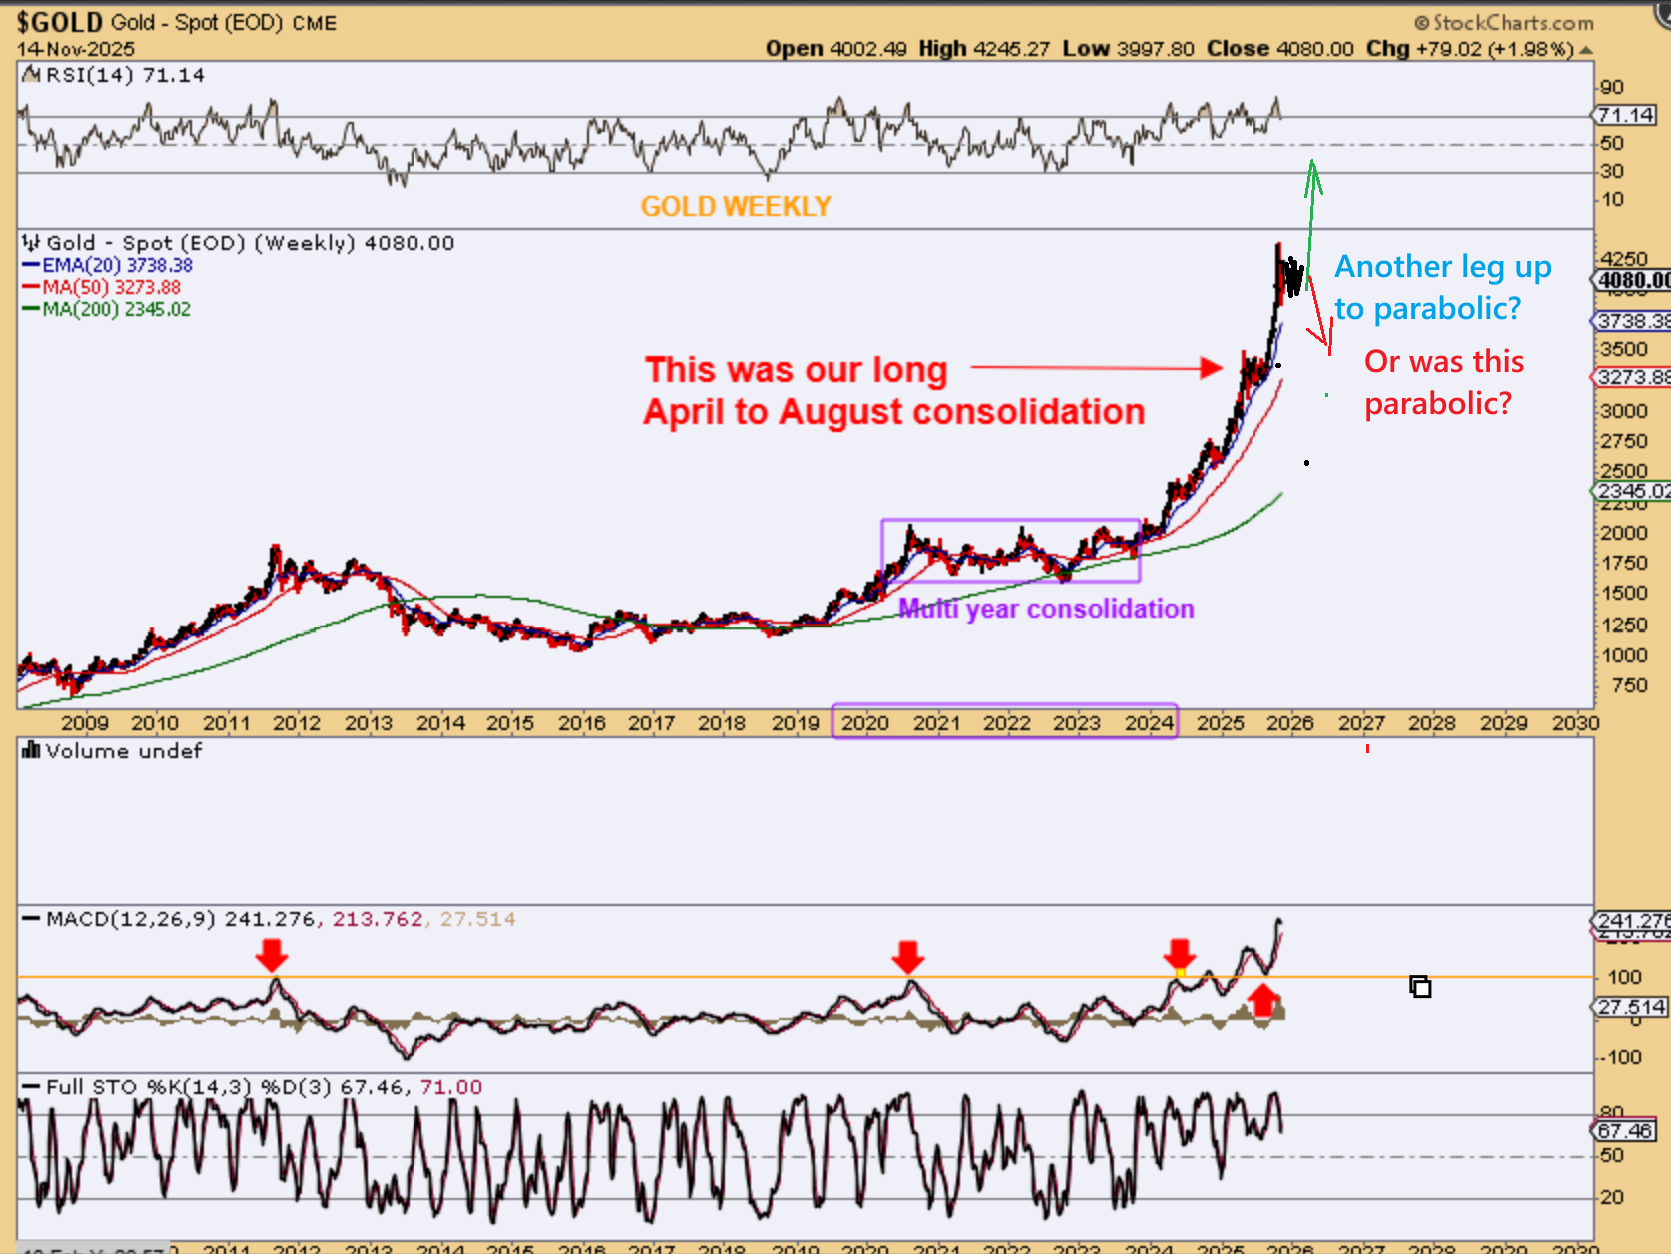
GOLD has chopped sideways in recent consolidations, and we may be seeing the start of that here, as pointed out last week. So using that blue line, we could chop sideways, form a triangle, etc. Read the chart please. Also look at the long April to Augst consolidation…
.
GOLD – That long April to August consolidation looks tiny in the big picture, which means that we could put in another one and resume the run higher (I drew on in here). So we are at a point, when we take the USD into consideration, where we could just go parabolic…or drop. I have mentioned that in this case., we buy the reversal dcl with a stop.
.
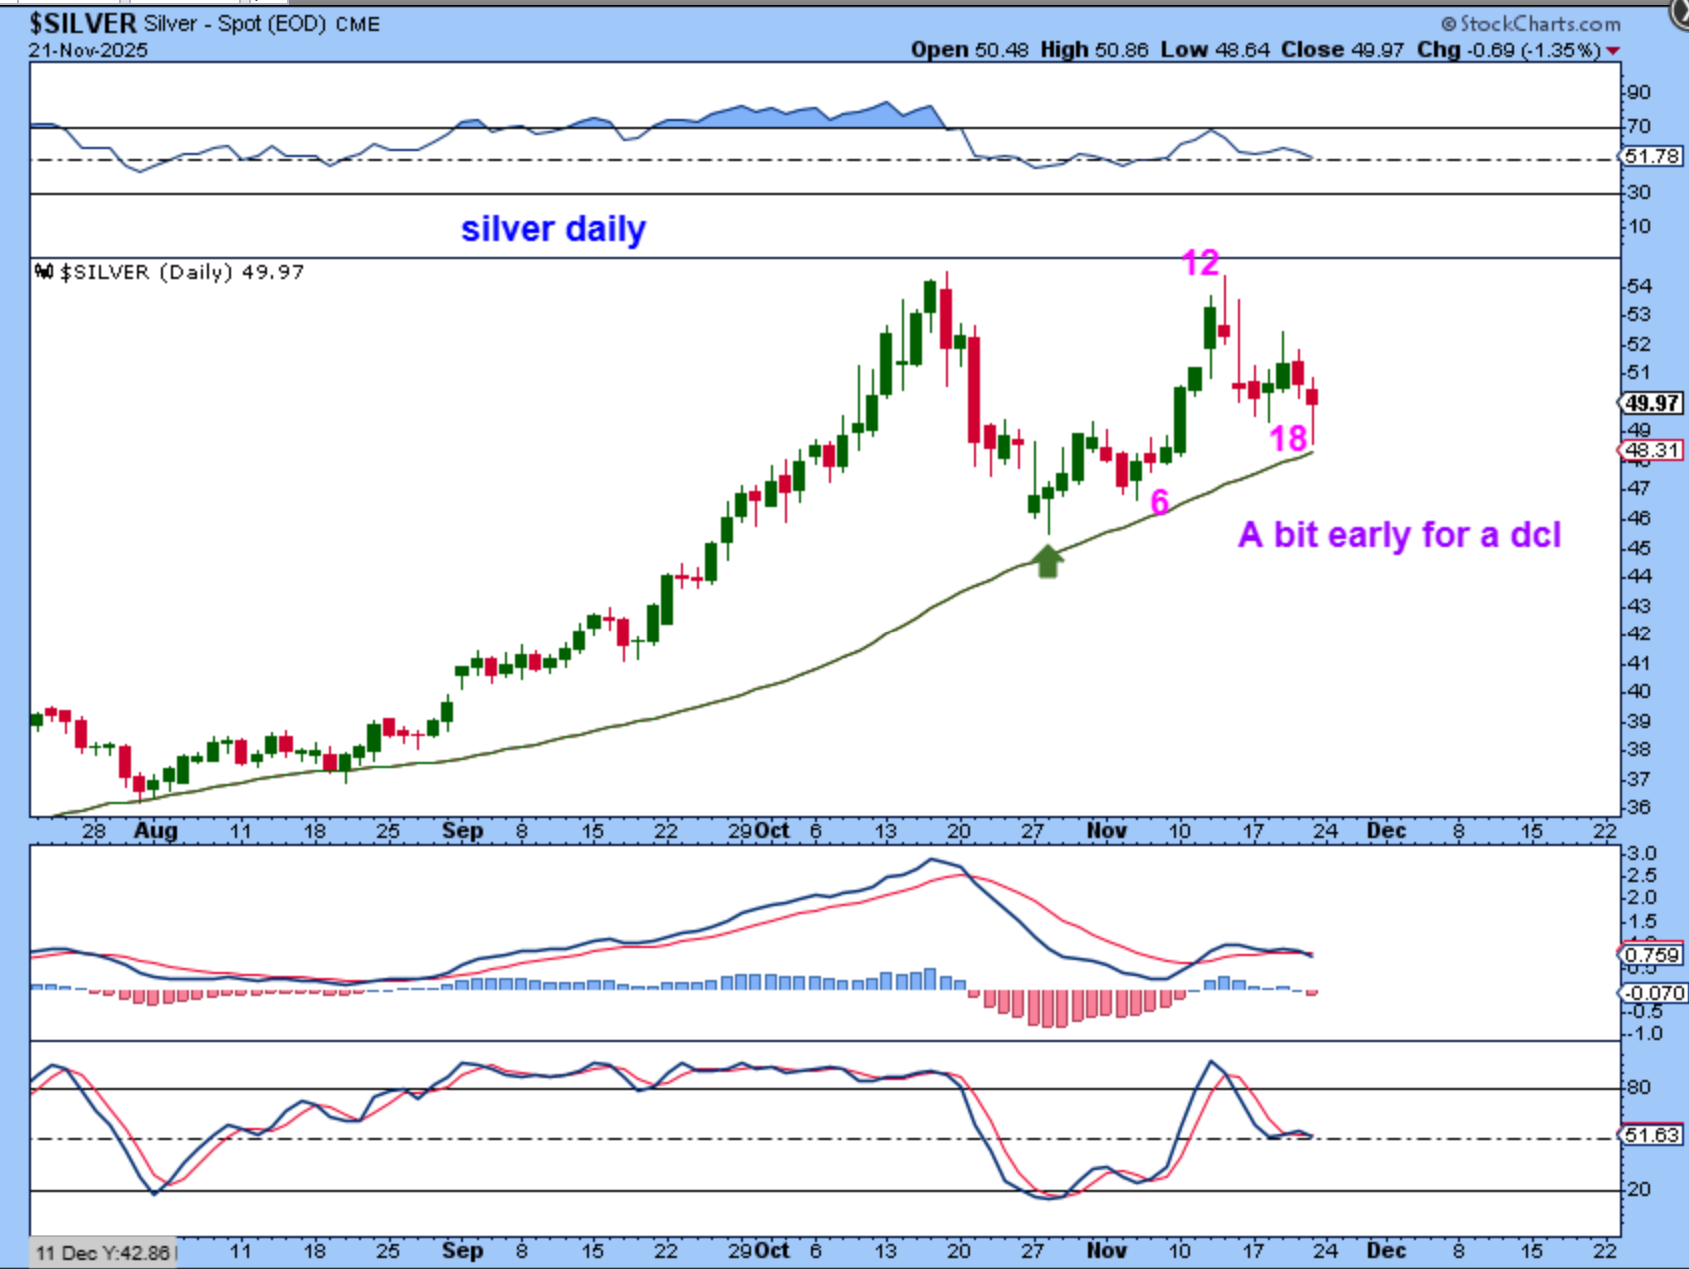
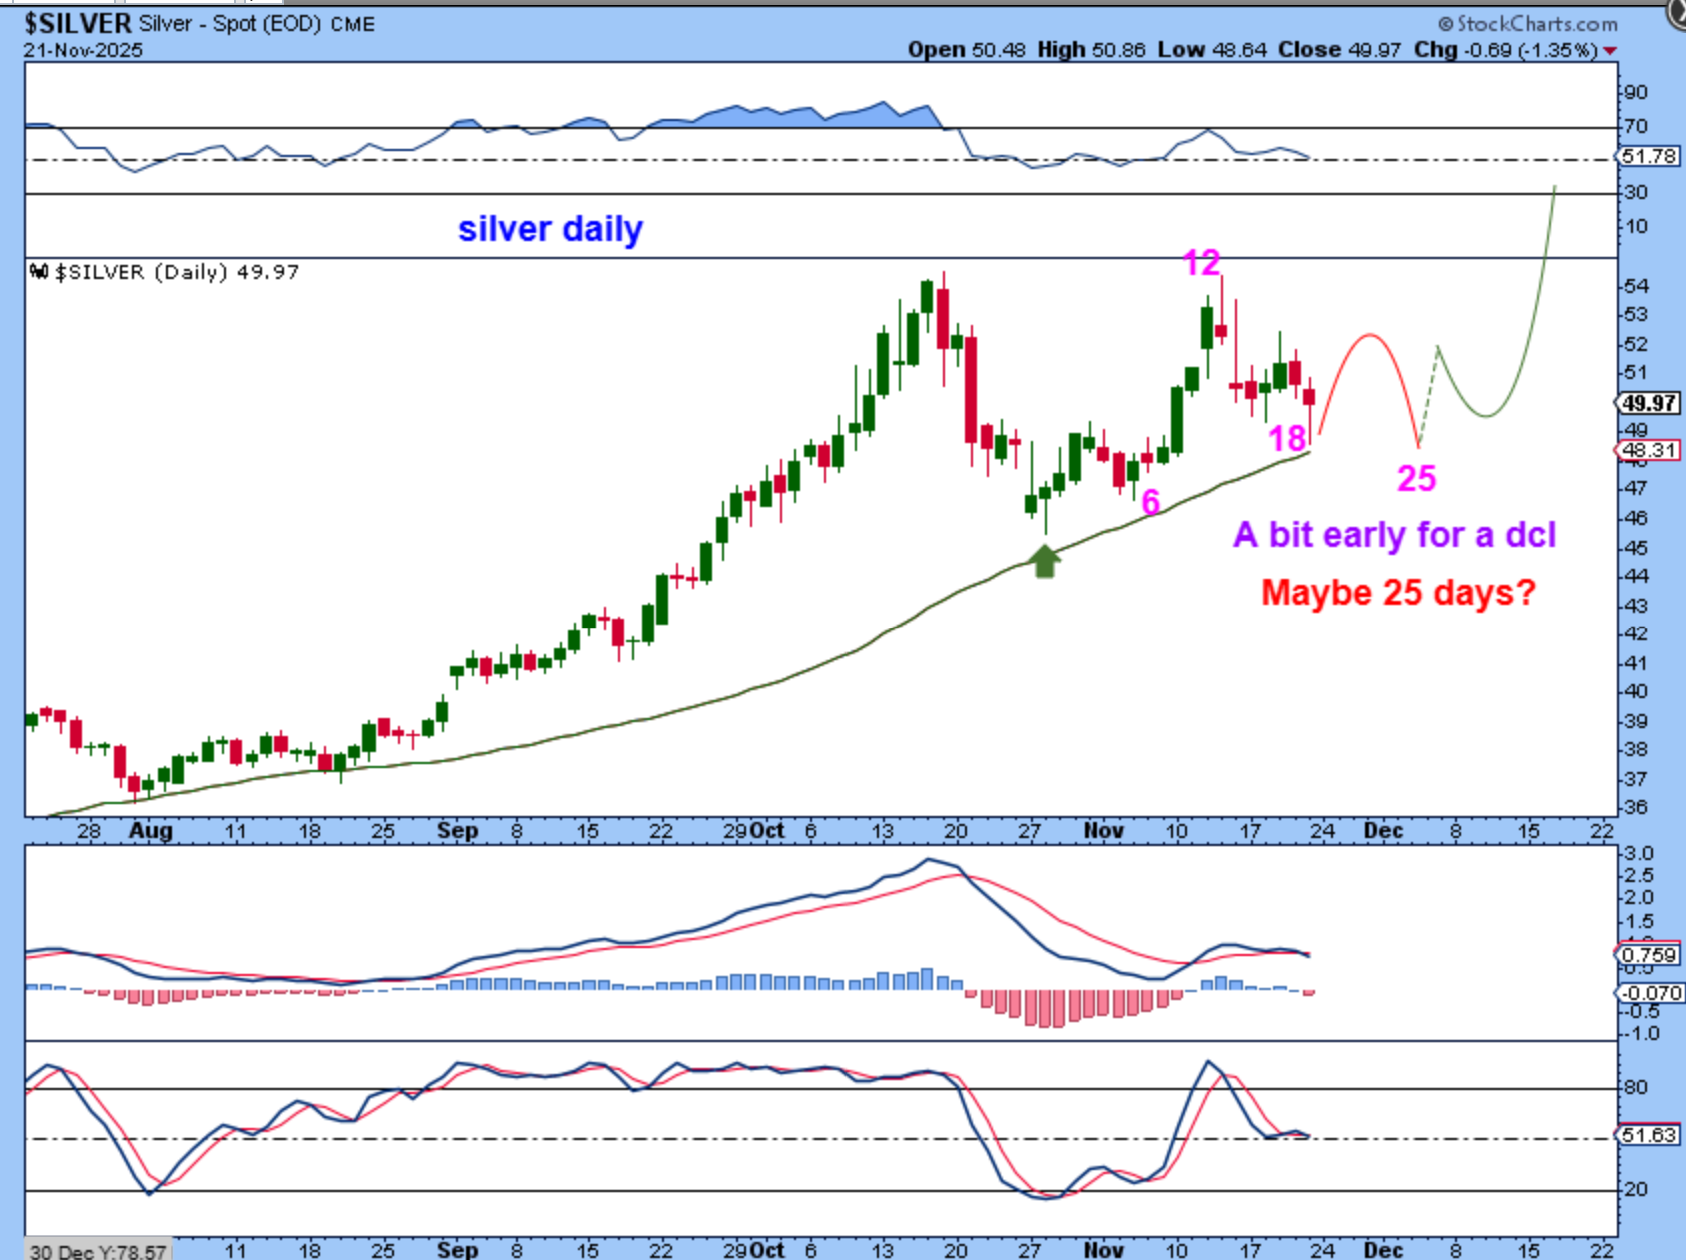
SILVER DAILY had a reversal candle on Friday. It is day 18 and most daily cycles are 25 to 35 days long lately, so I assume that this is too early for a dcl. We can bounce this week, however, since this could be a half cycle dip or just a choppy daily cycle. So far the 50sma is supportive.
.
So if SILVER bounces at day 18, it may be brief and it could then drop into a dcl. So here I am drawing the idea that we bounce during the holiday week of trading, and sell down into a dcl next week. THIS IS JUST AN IDEA OF HOW THIS SET UP can play out. We know that this has been choppy and can remain choppy too.
.
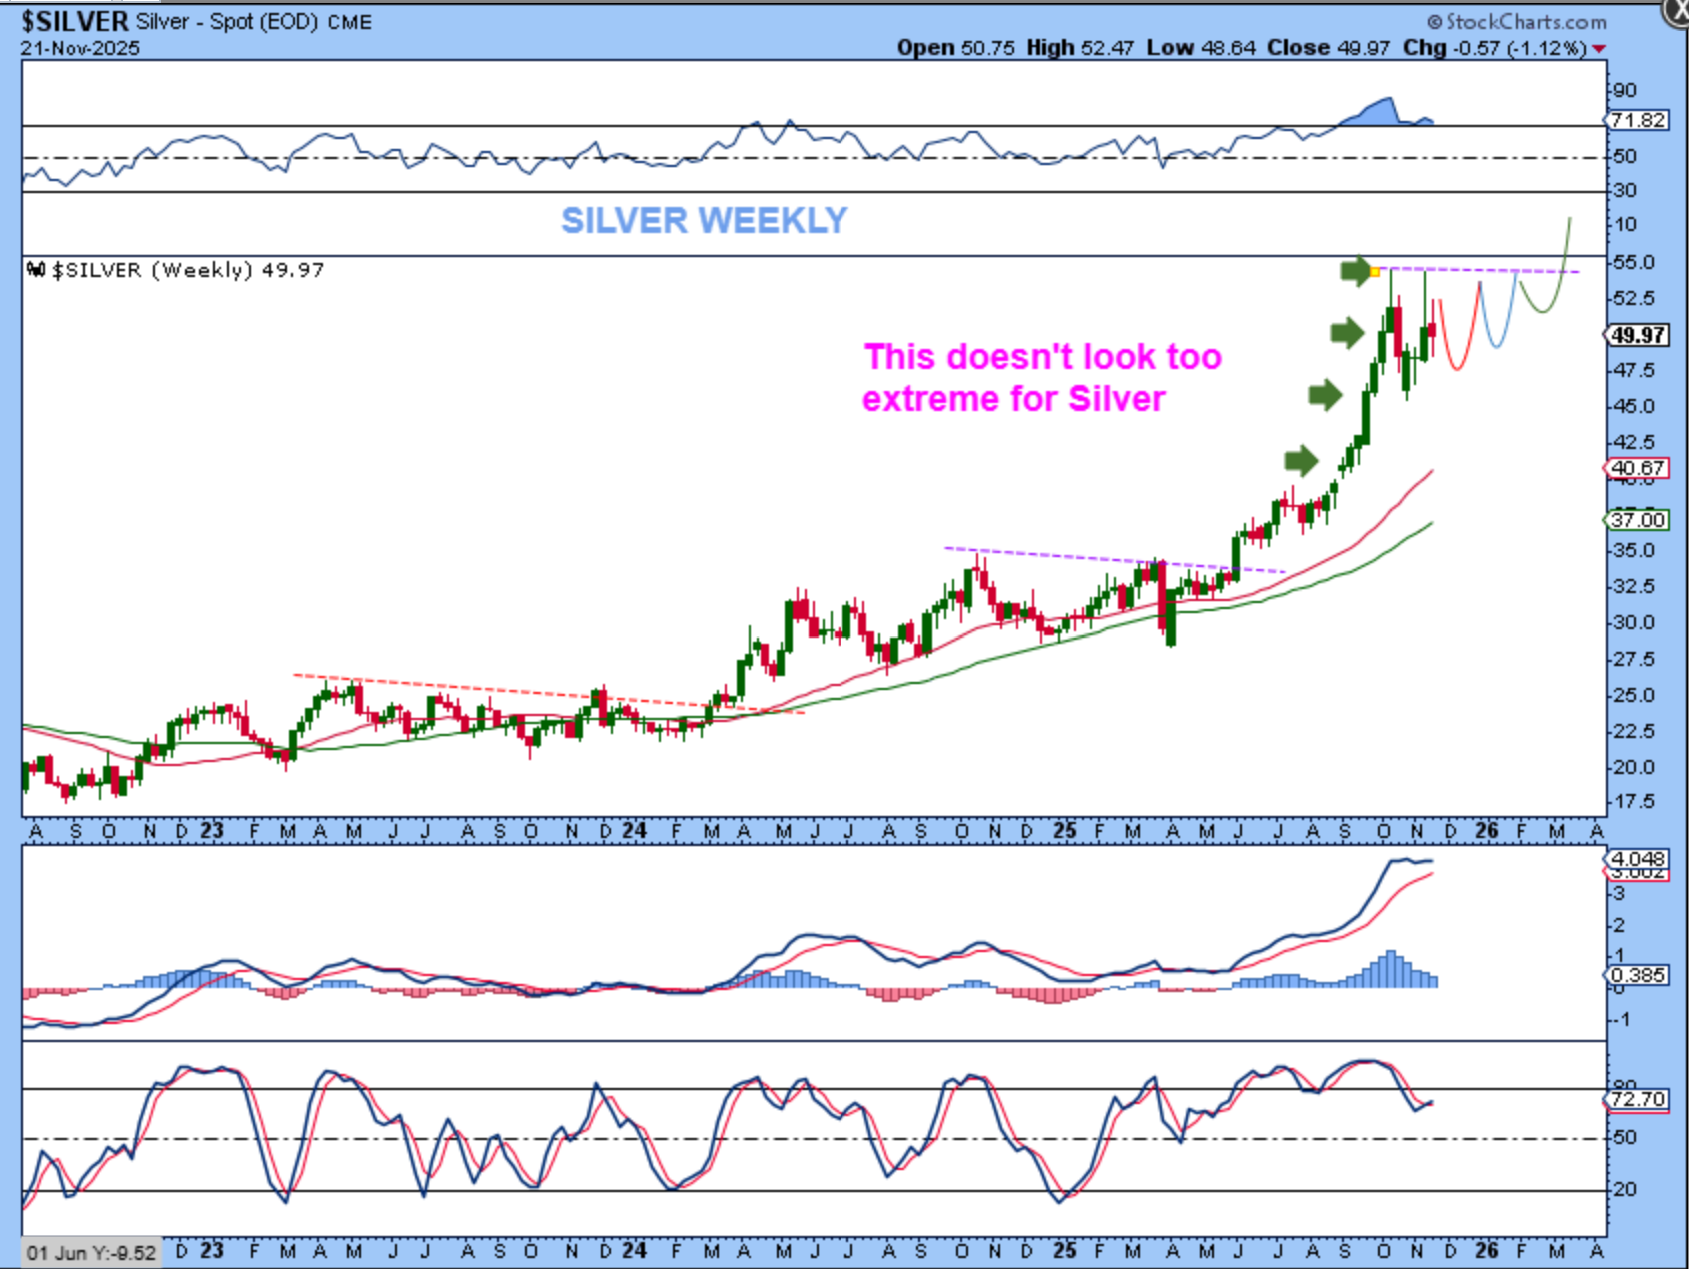
Silver really doesn’t look parabolic yet, so I would love to see the choppiness in SILVER turn into a bullish weekly set up of some sort. A triangle, a pennant, a small descending wedge, or a flat-topped wedge, as drawn here. We’ll see.
.
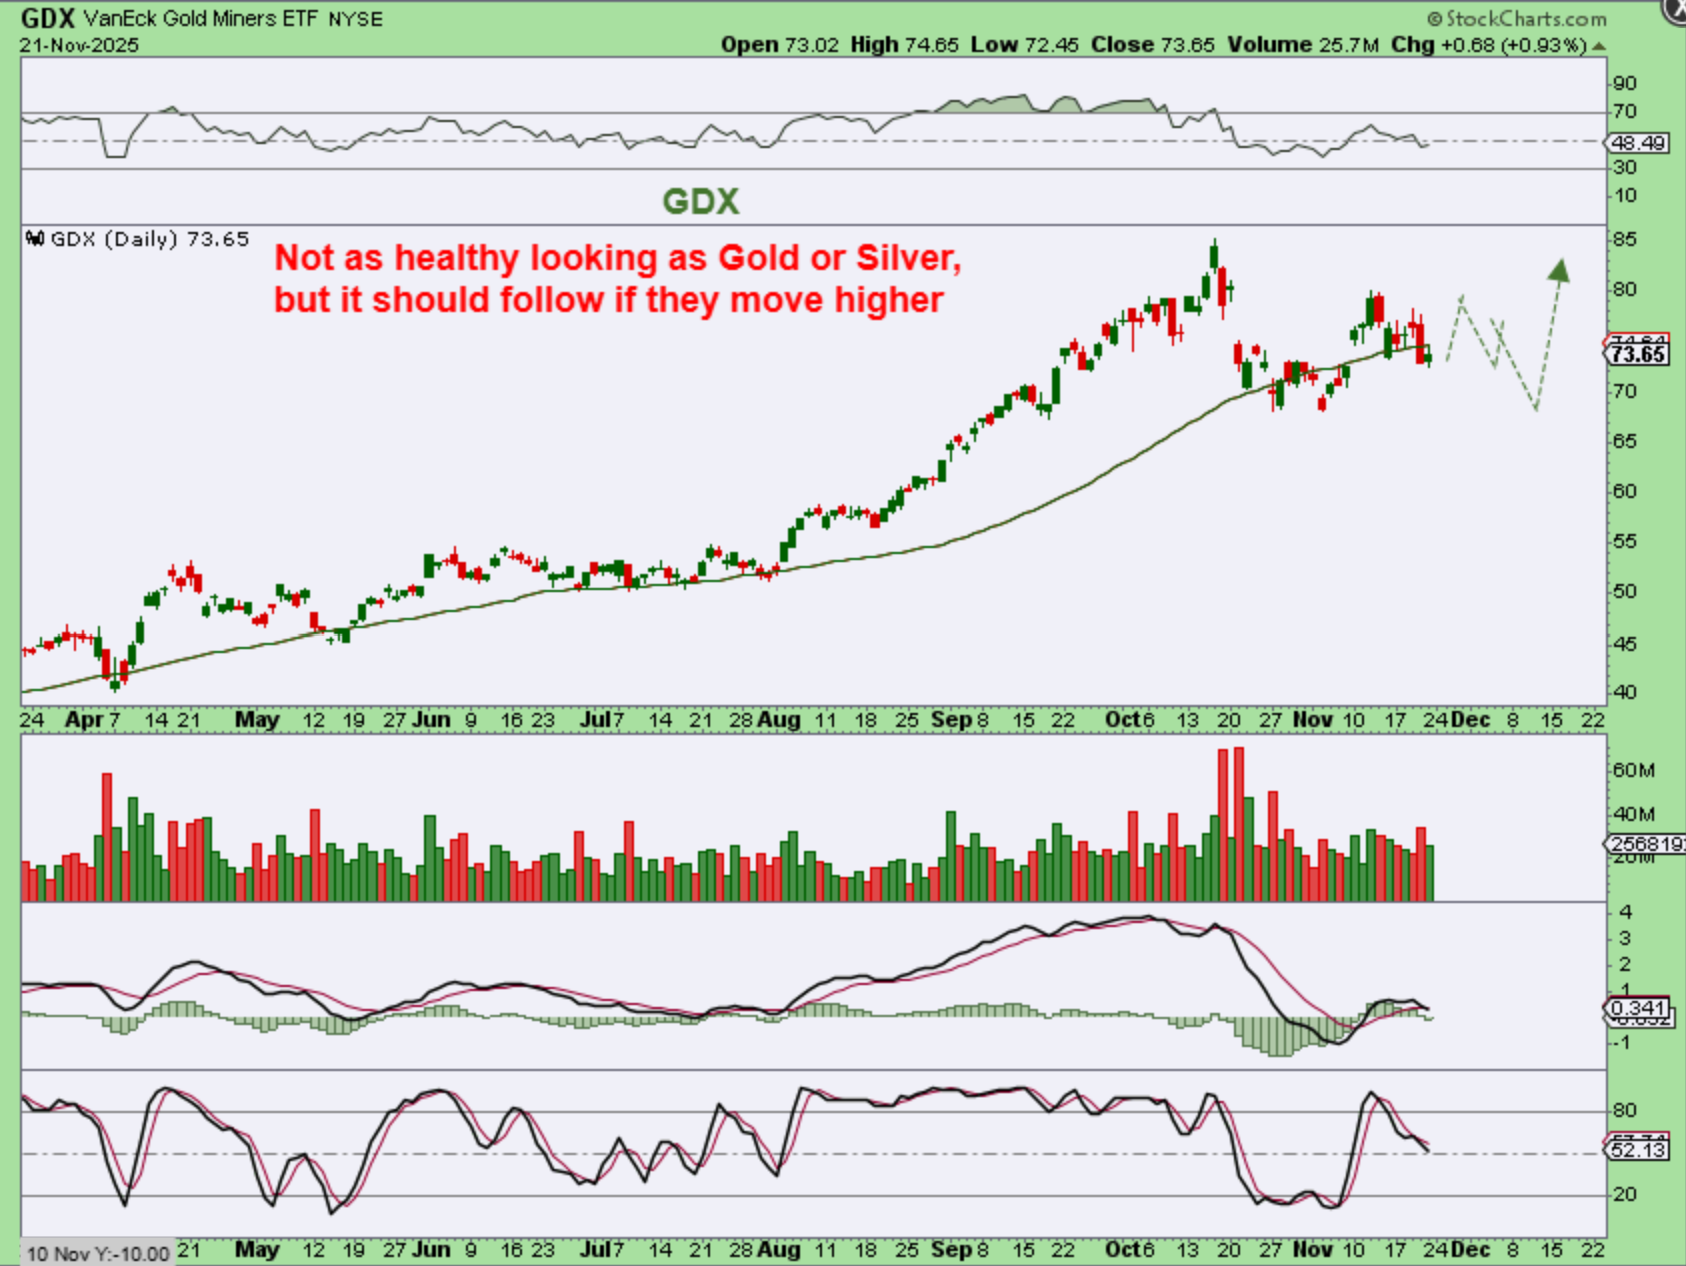
GDX tends to go where Gold goes when it is running strong, but it has been a little weaker lately (GDX closed below the 50sma on a daily chart for the last 2 days for example). We like to see Miners lead the metals higher, but they seem to be leading in weakness right now. If Gold & Silver do follow through higher with those Friday reversals, I would expect Miners to bounce this holiday shortened week, but then drop into a dcl, since the daily cycle is getting late.
.
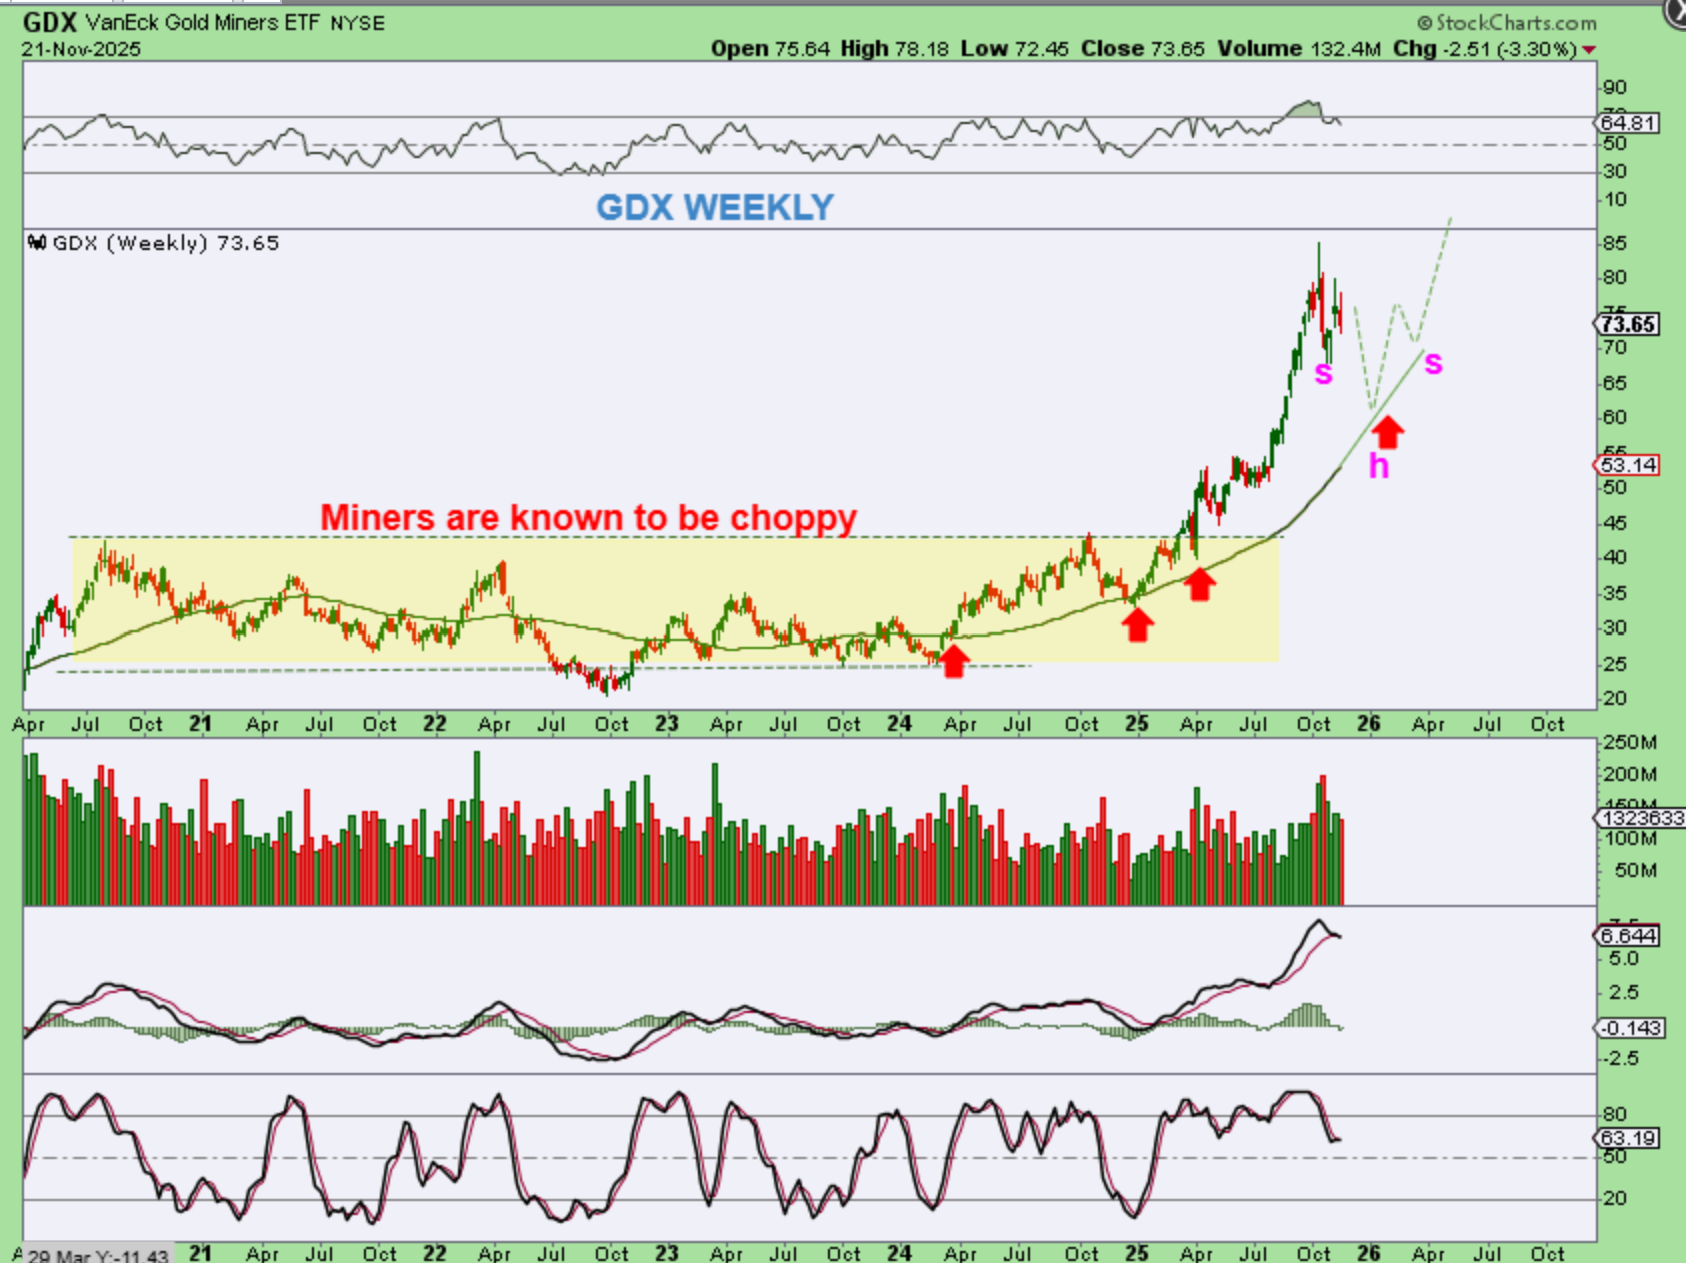
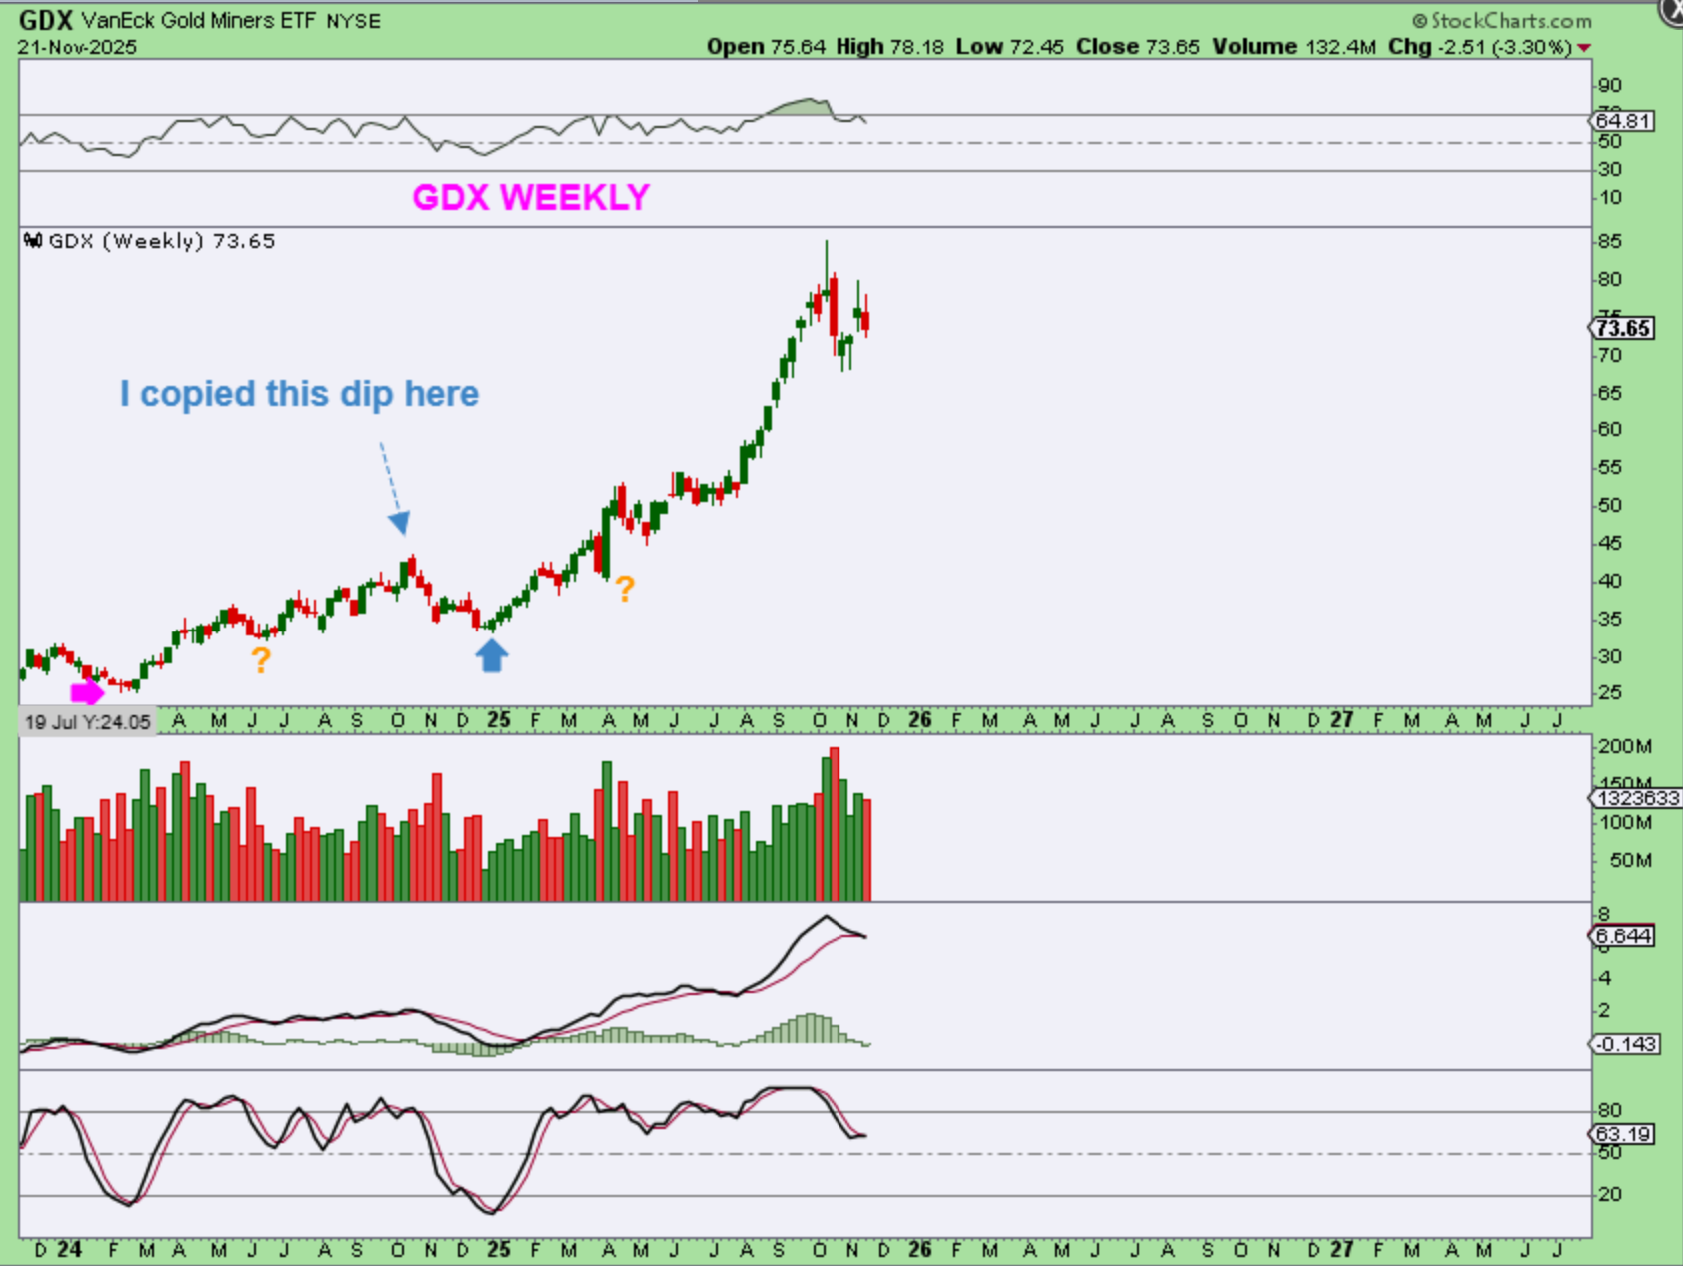
GDX WEEKLY – So the miners looked to be going parabolic and then we saw that big reversal candle at the top. Now we have to see how things play out. I have mentioned that the reversal top candle COULD BE THE TOP. I expected a drop and said that we’d buy the dcl and use a stop, so now we have our bounce. An ICL drop is usually an a-b-c drop, so THAT could lead to an inverse H&S if we get it (as drawn here).
.
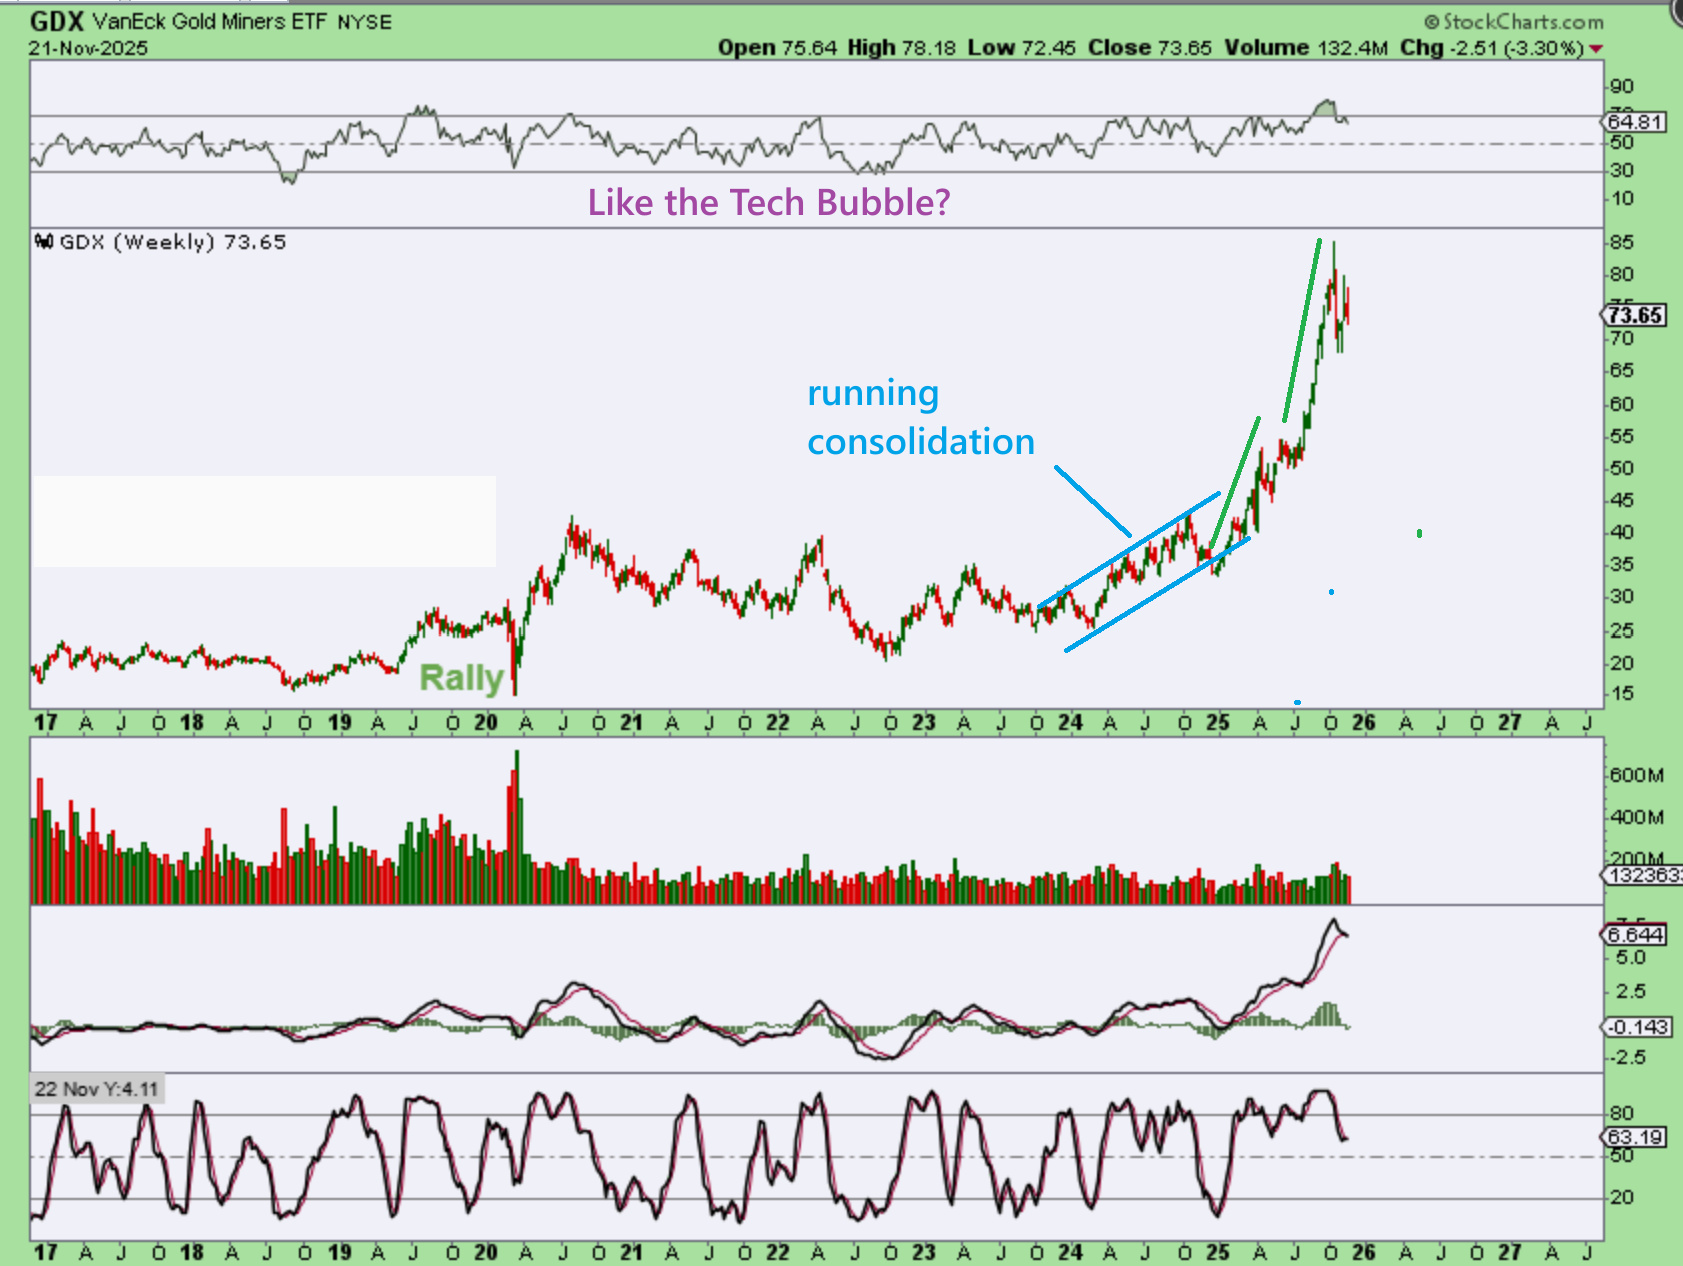
Stepping back, this is where The GDX ETF really does look parabolic. I’ll show you a bullish set up shortly, but I compared this run to the NASDAQ 2000 bubble weeks ago, so we need to keep that in mind to keep us balanced.
Notice the choppy running correction, and then that steep run up to a peak. Now after a dip, it is running up again, but…
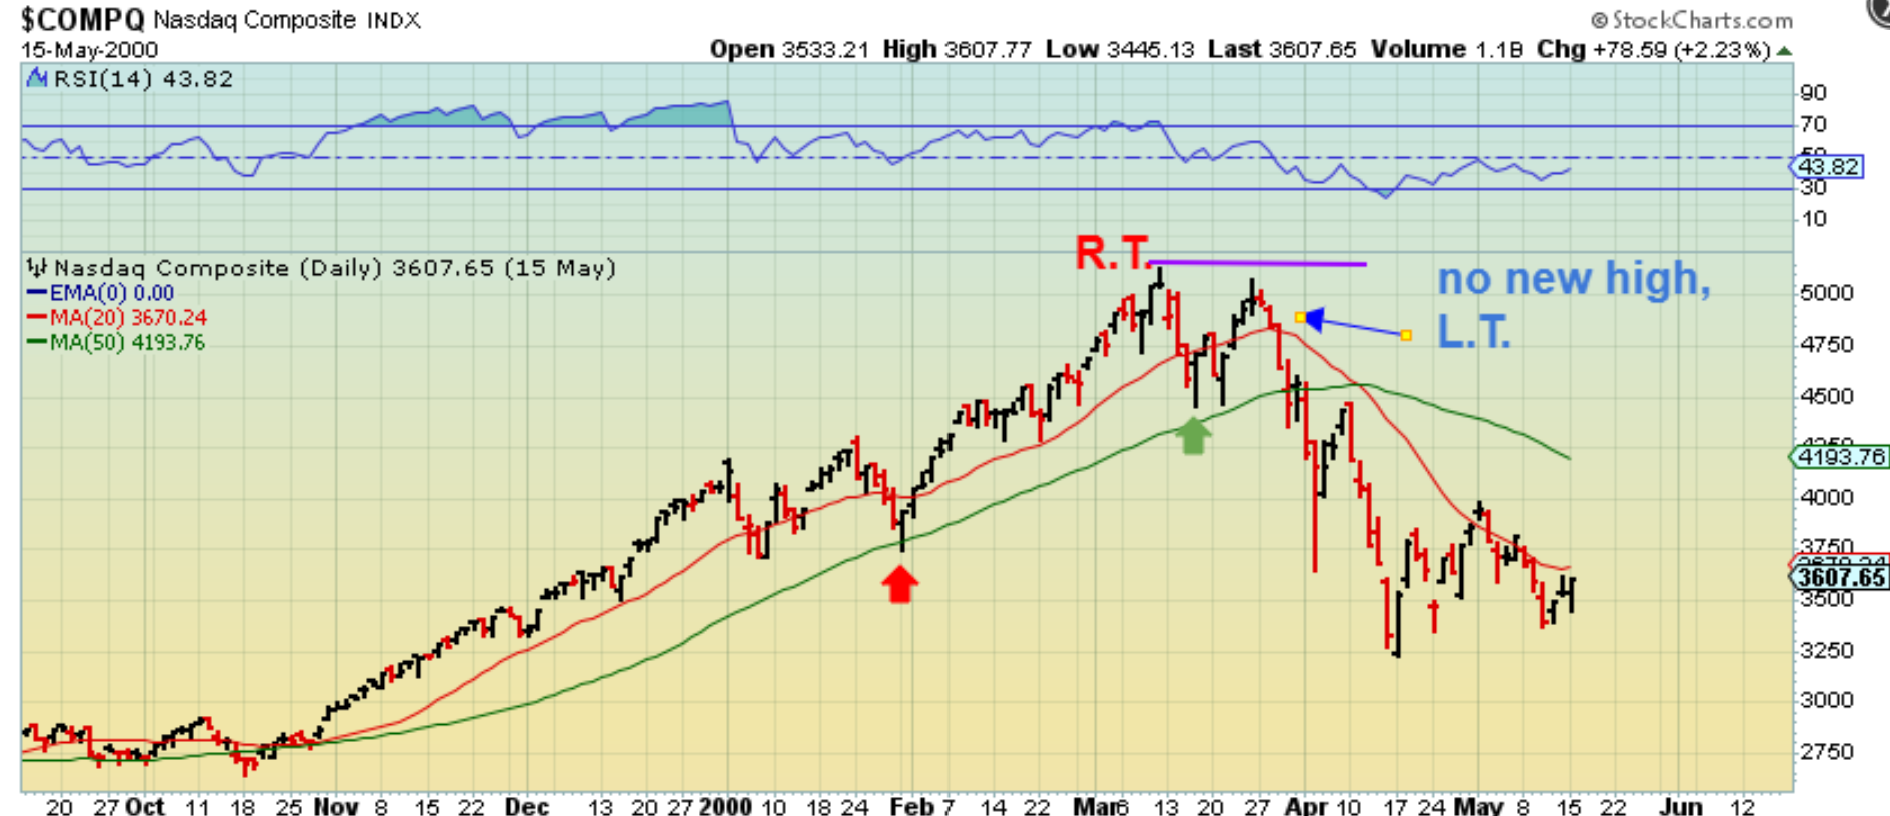
Do you remember where the Nasdaq bull of 2000 bounced convincingly (like this) and then sold off?
.
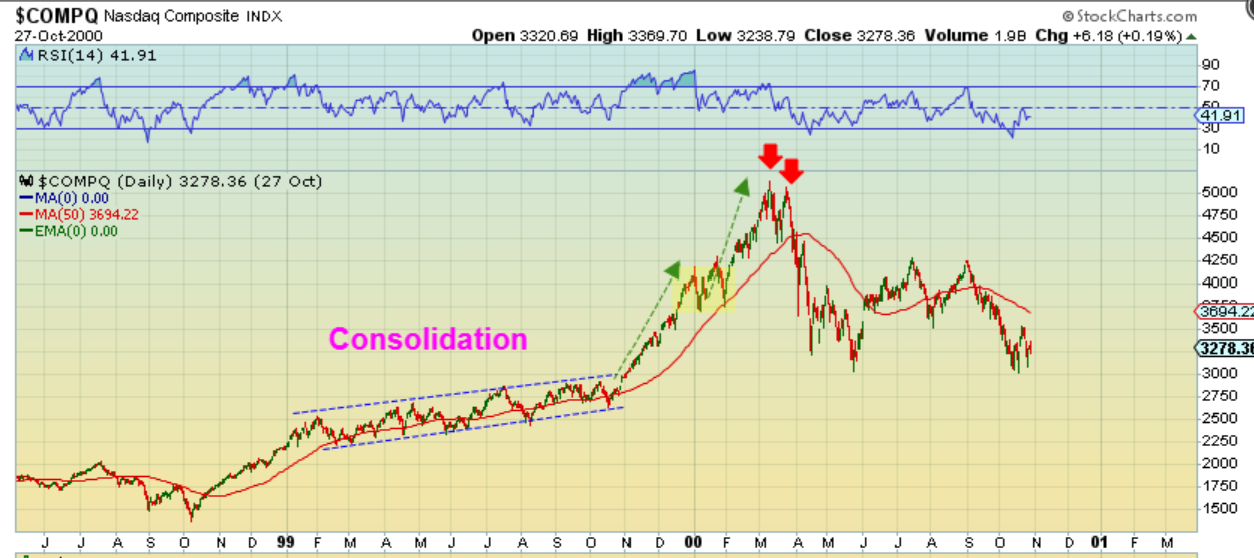
Do you remember when I showed you that the Nasdaq bull of 2000 also had a choppy consolidation (running correction), then it also ramped up steeply, peaked, dipped, and then bounced convincingly and almost even made new highs (like we have with Silver now), but then it sold off. It double topped and crashed. Let’s zoom in…
.
That Tech Bubble looked very normal in that daily cycle, but it crashed through the 50sma and never recovered it. I like to keep this fresh in my mind, because Silver and Gold both look to have a convincing bounce, but we use stops because of this chart.
.
This consolidation, ramp up, ‘peak’, and double top is similar to that 2000 bubble peak in several ways.
.
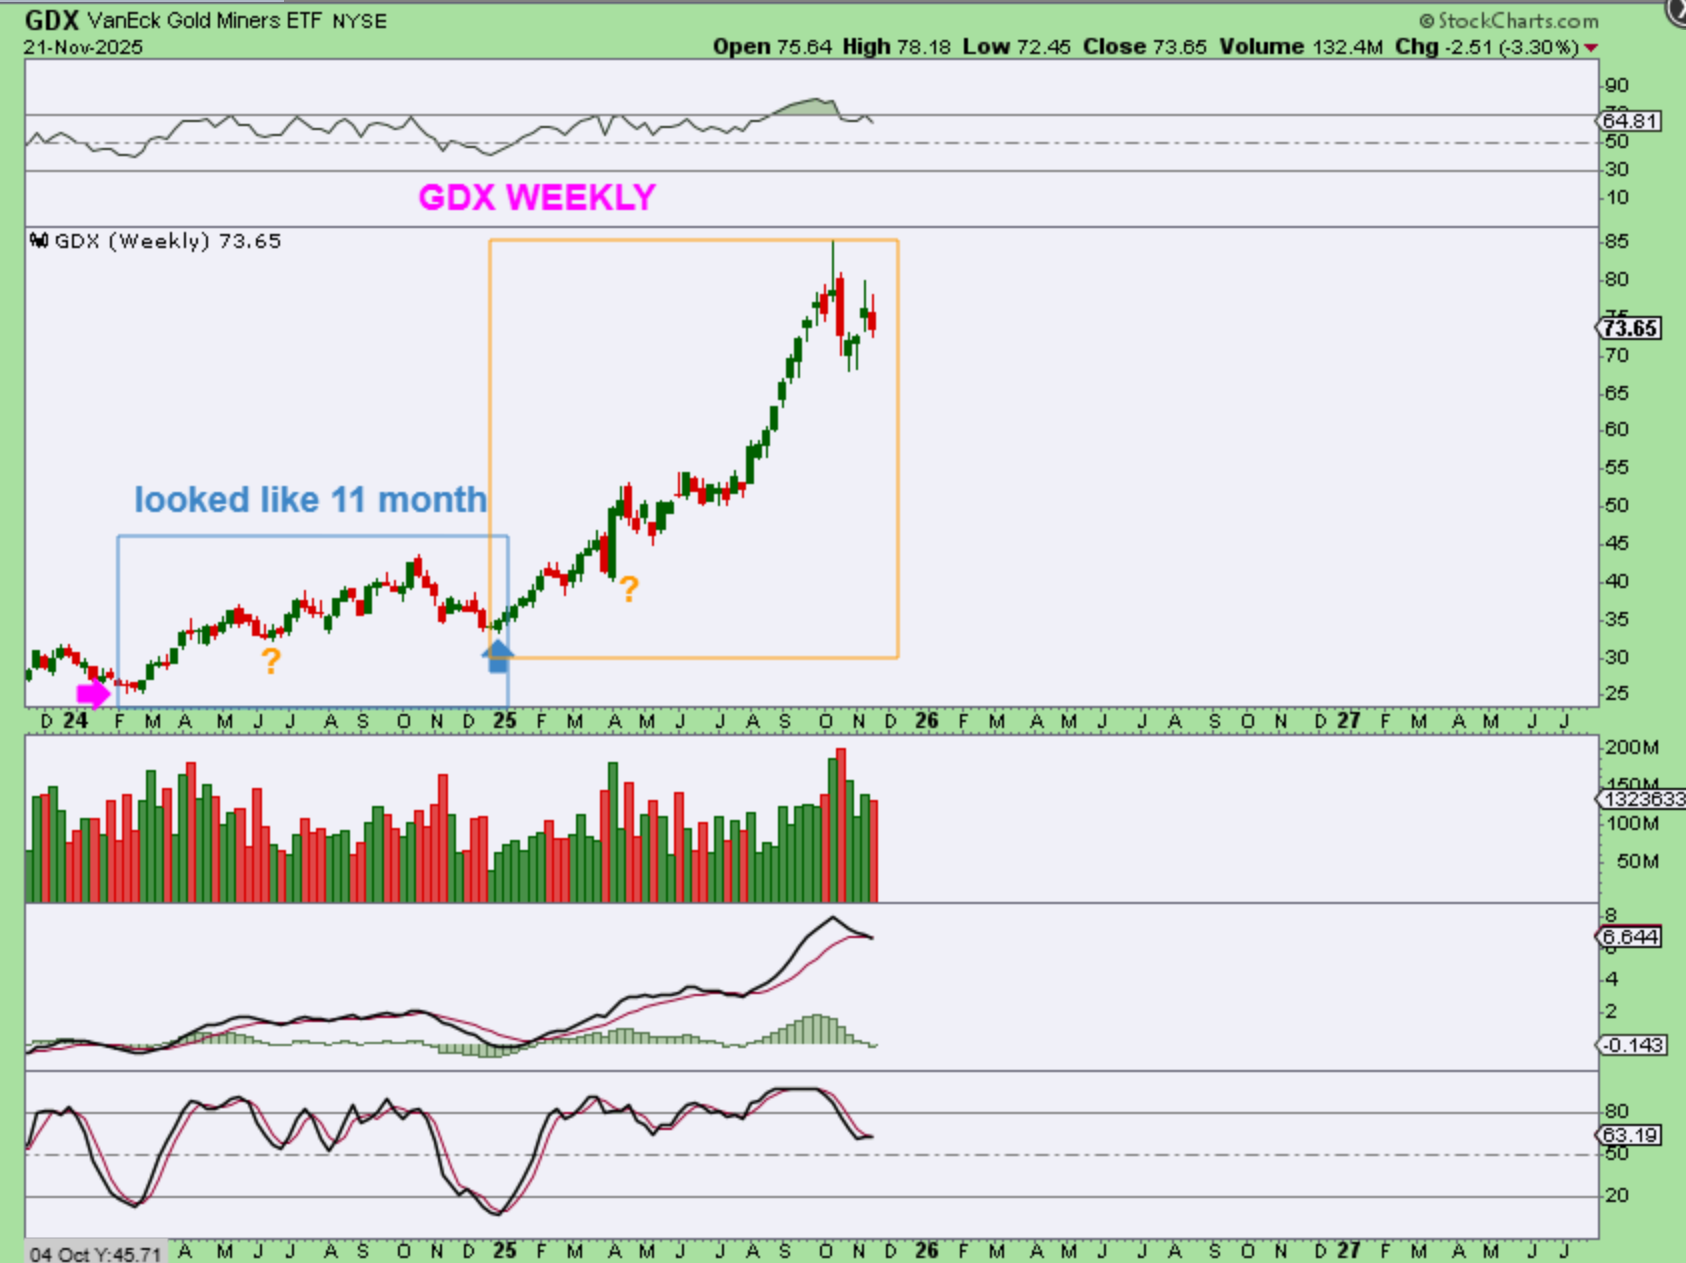
I noticed that The GDX in 2024 ran up for months, it peaked in October, and then dipped for a total of 11 months from Low to Low. We could be doing that now too. I thought that it was interesting that the 2024 peak was mid-October and 2025 was mid-October too.
.
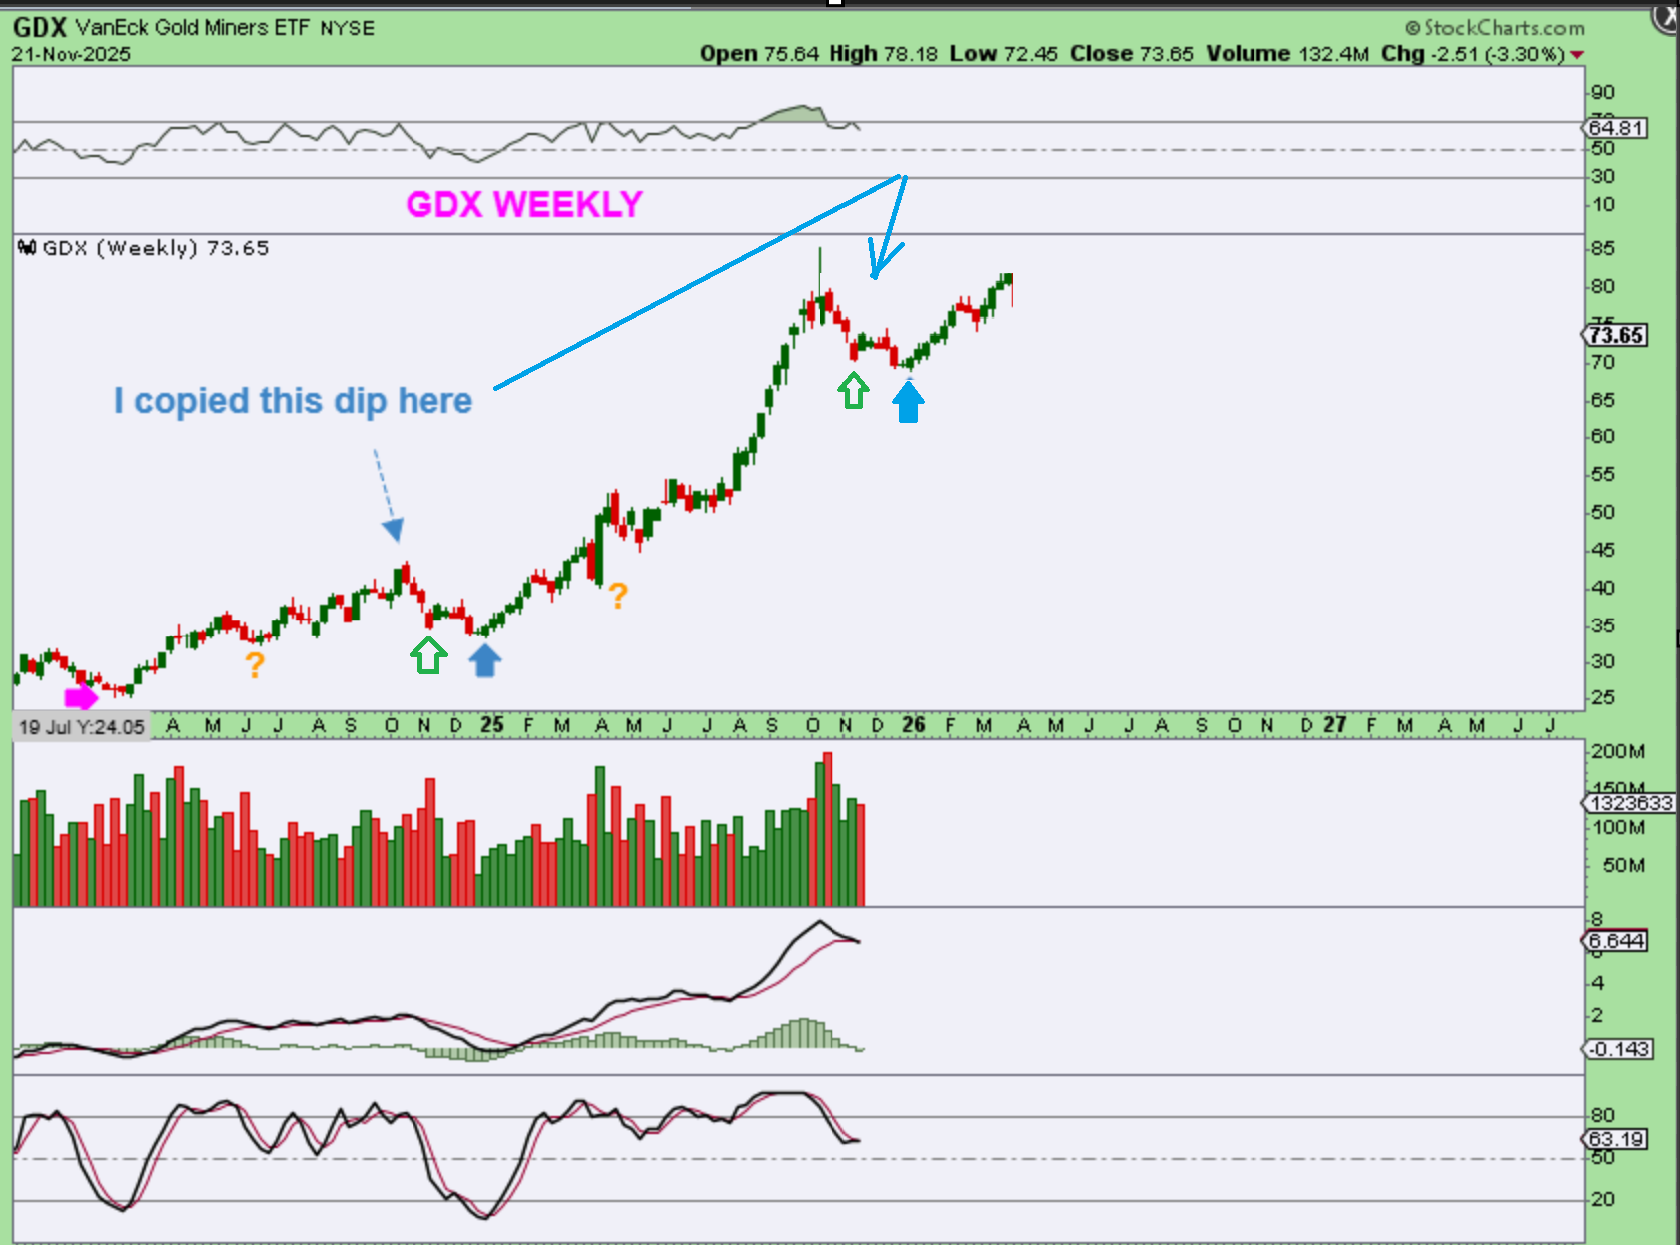
So we have our first dip off of the top & have started that bounce. Now let me copy that 2024 peak and dip to where we are now…
.
If we were to repeat that drop, we have our first dip off of the top, and have started our bounce. Next, the GDX dipped to a bottom in December after a 5-6 week bounce.
.
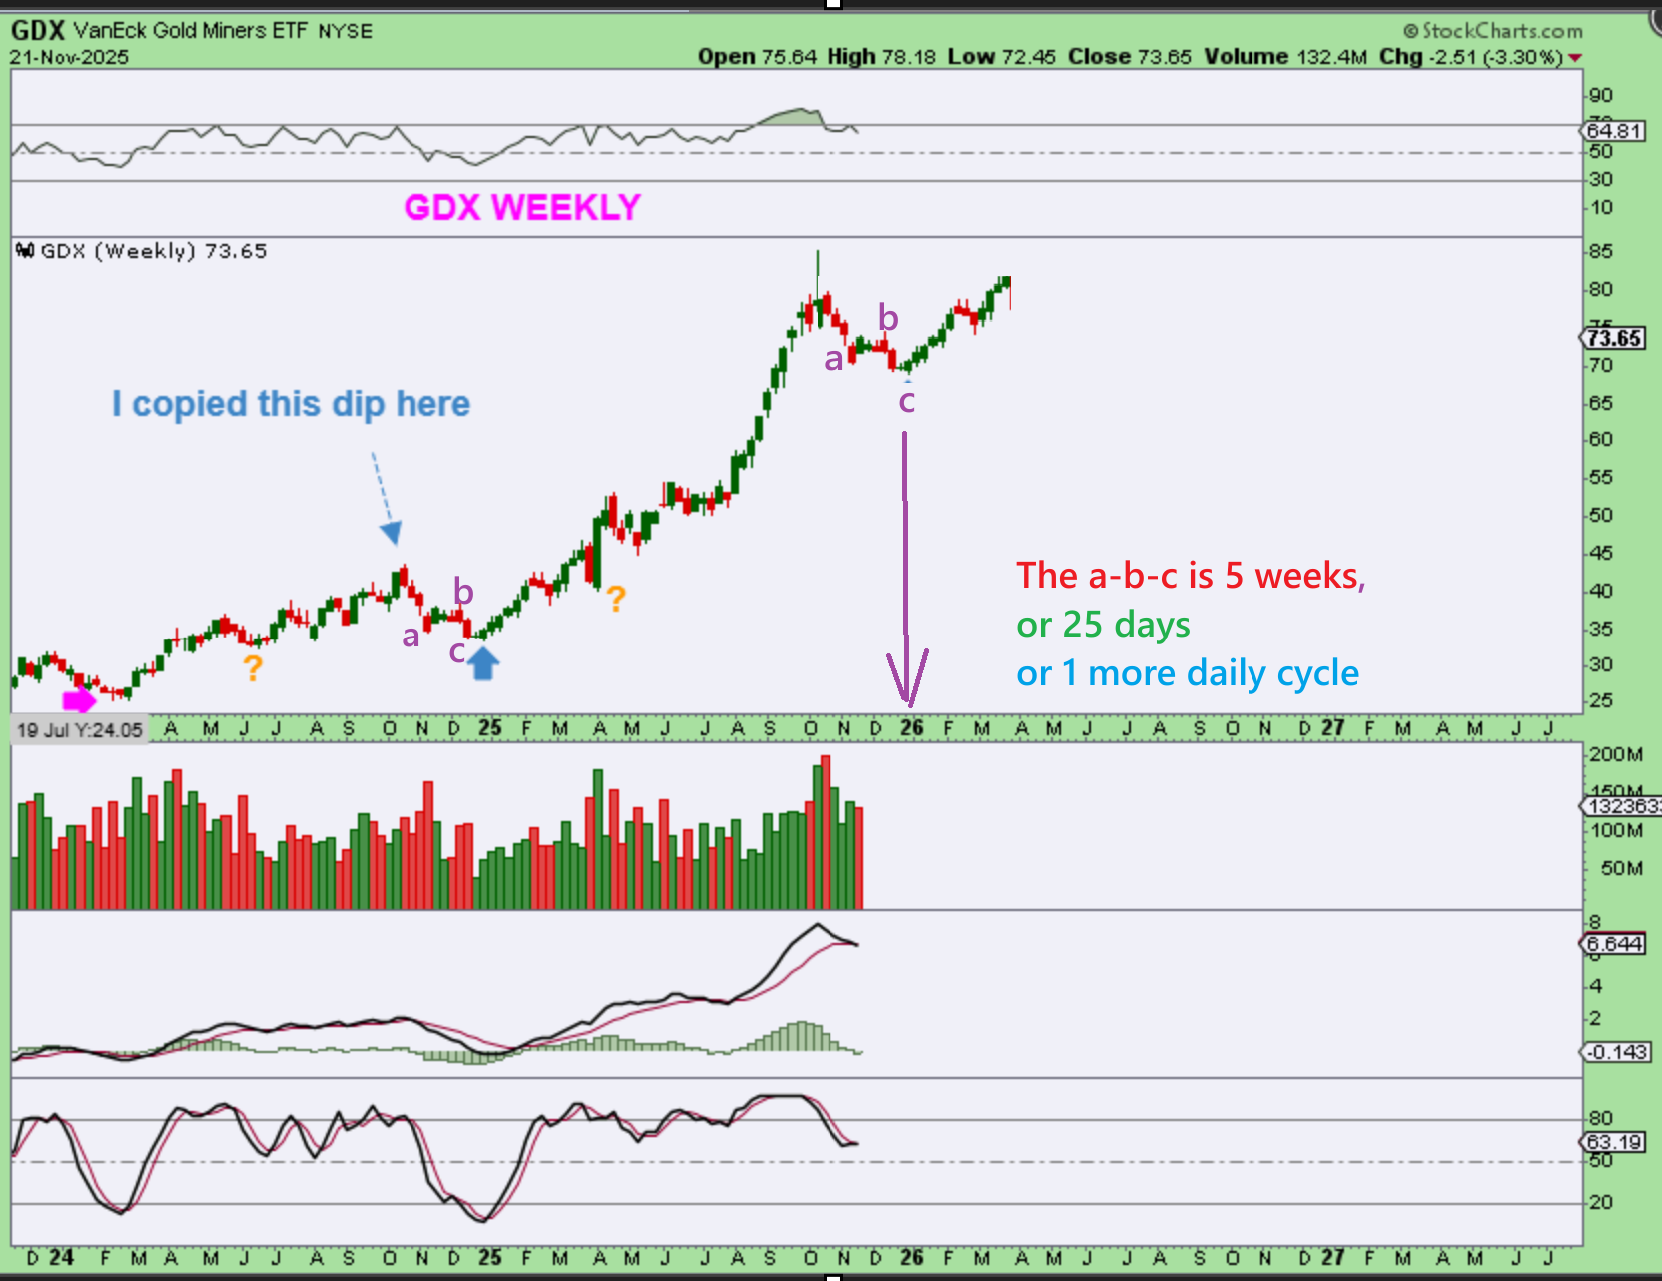
GDX – That dip became an a-b-c down and a rally followed in December 2024 onward.
Again: If it repeats, we’d get a final low (mild a-b-c style dip) in December too.
1. Our recent dcl would be the ‘a’, and the bounce is 3 weeks to ‘b’. The a-b-c run was a total of 5-6 weeks, as seen on this weekly chart. That means that 5 or 6 weeks after the dcl adds up to one daily cycle. Then we bottom into ‘c’, the ICL.
.
The dips have started and it wasn’t unexpected. We are due for dcls and even ICLs. Along with the selling, we do get bounces and multi day rallies, because we still have more time left in the daily cycles. We could bounce during the holiday week, but I anticipate that the lows should still be ahead. I’ll cover Bitcoin, the falling knife, below. I hope all had a nice weekend!
.
~ALEX
.
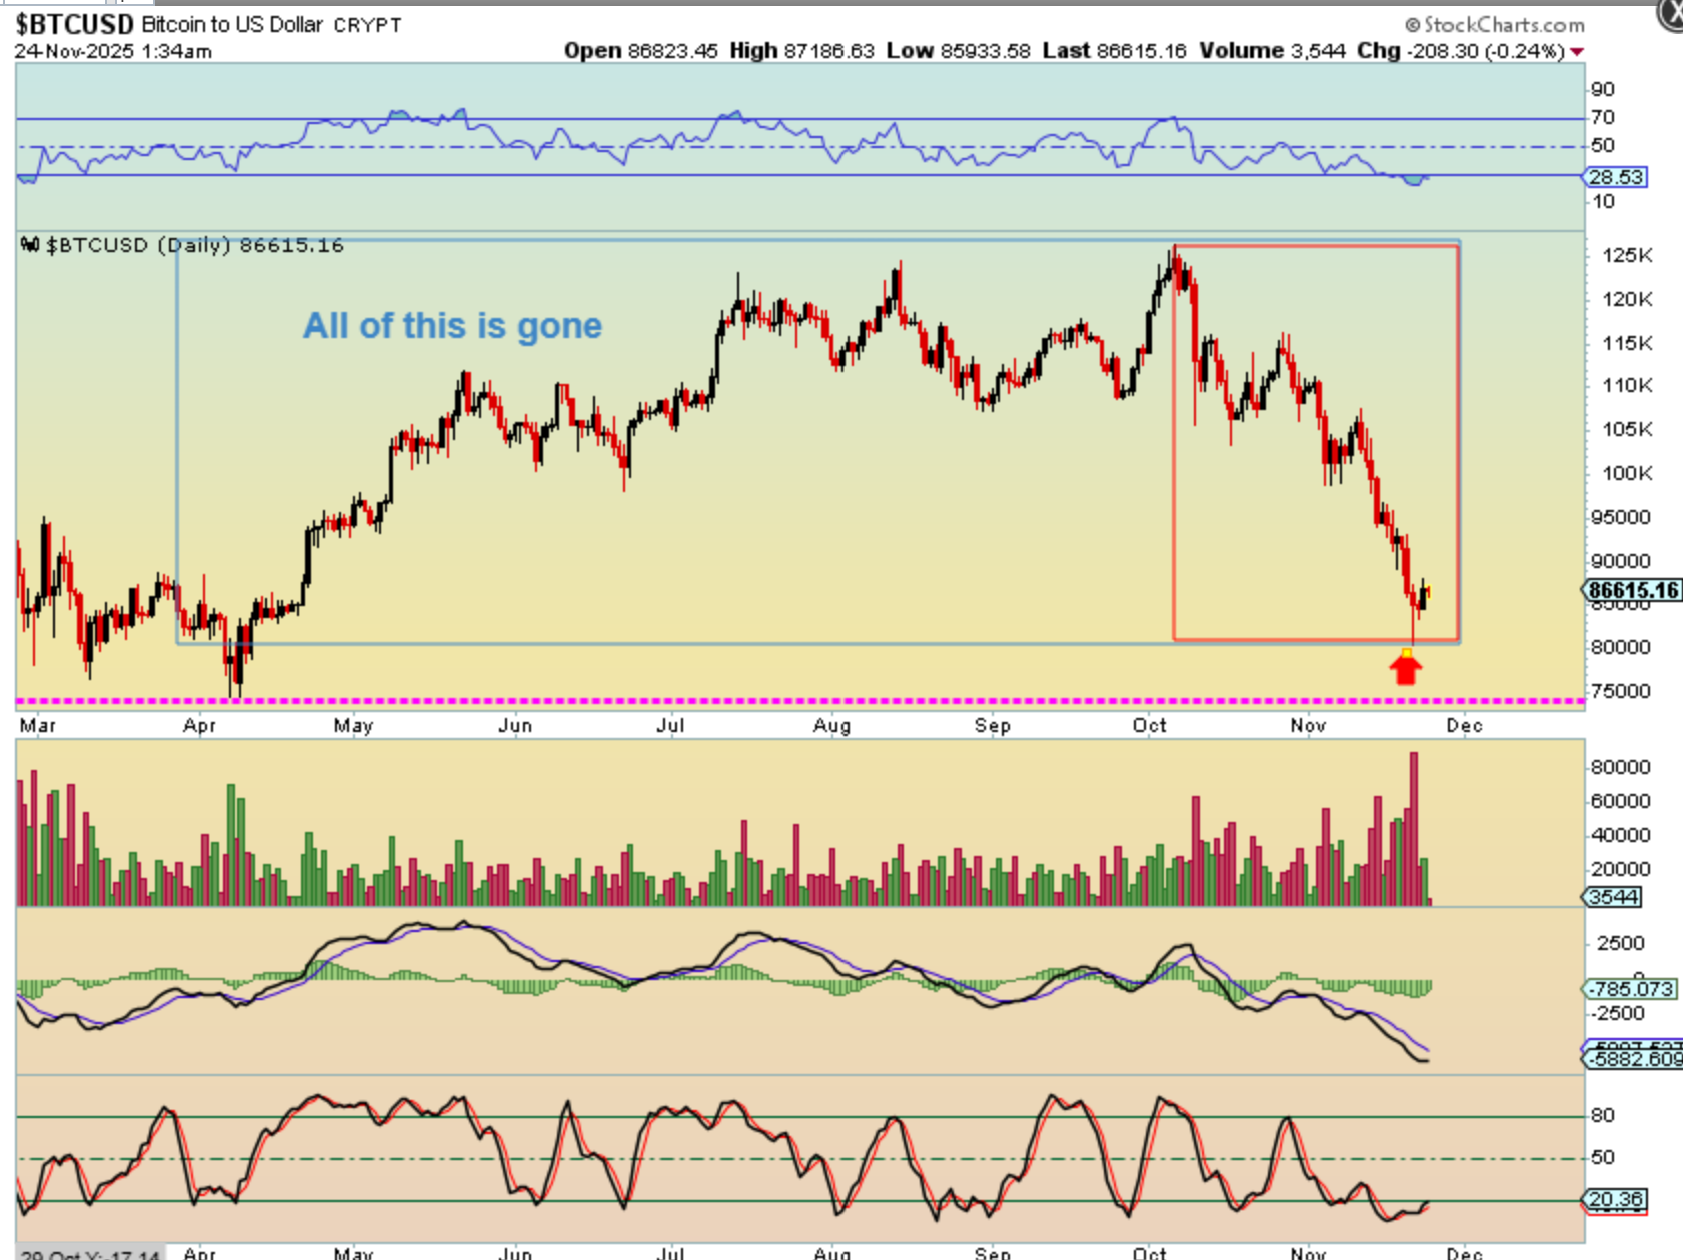
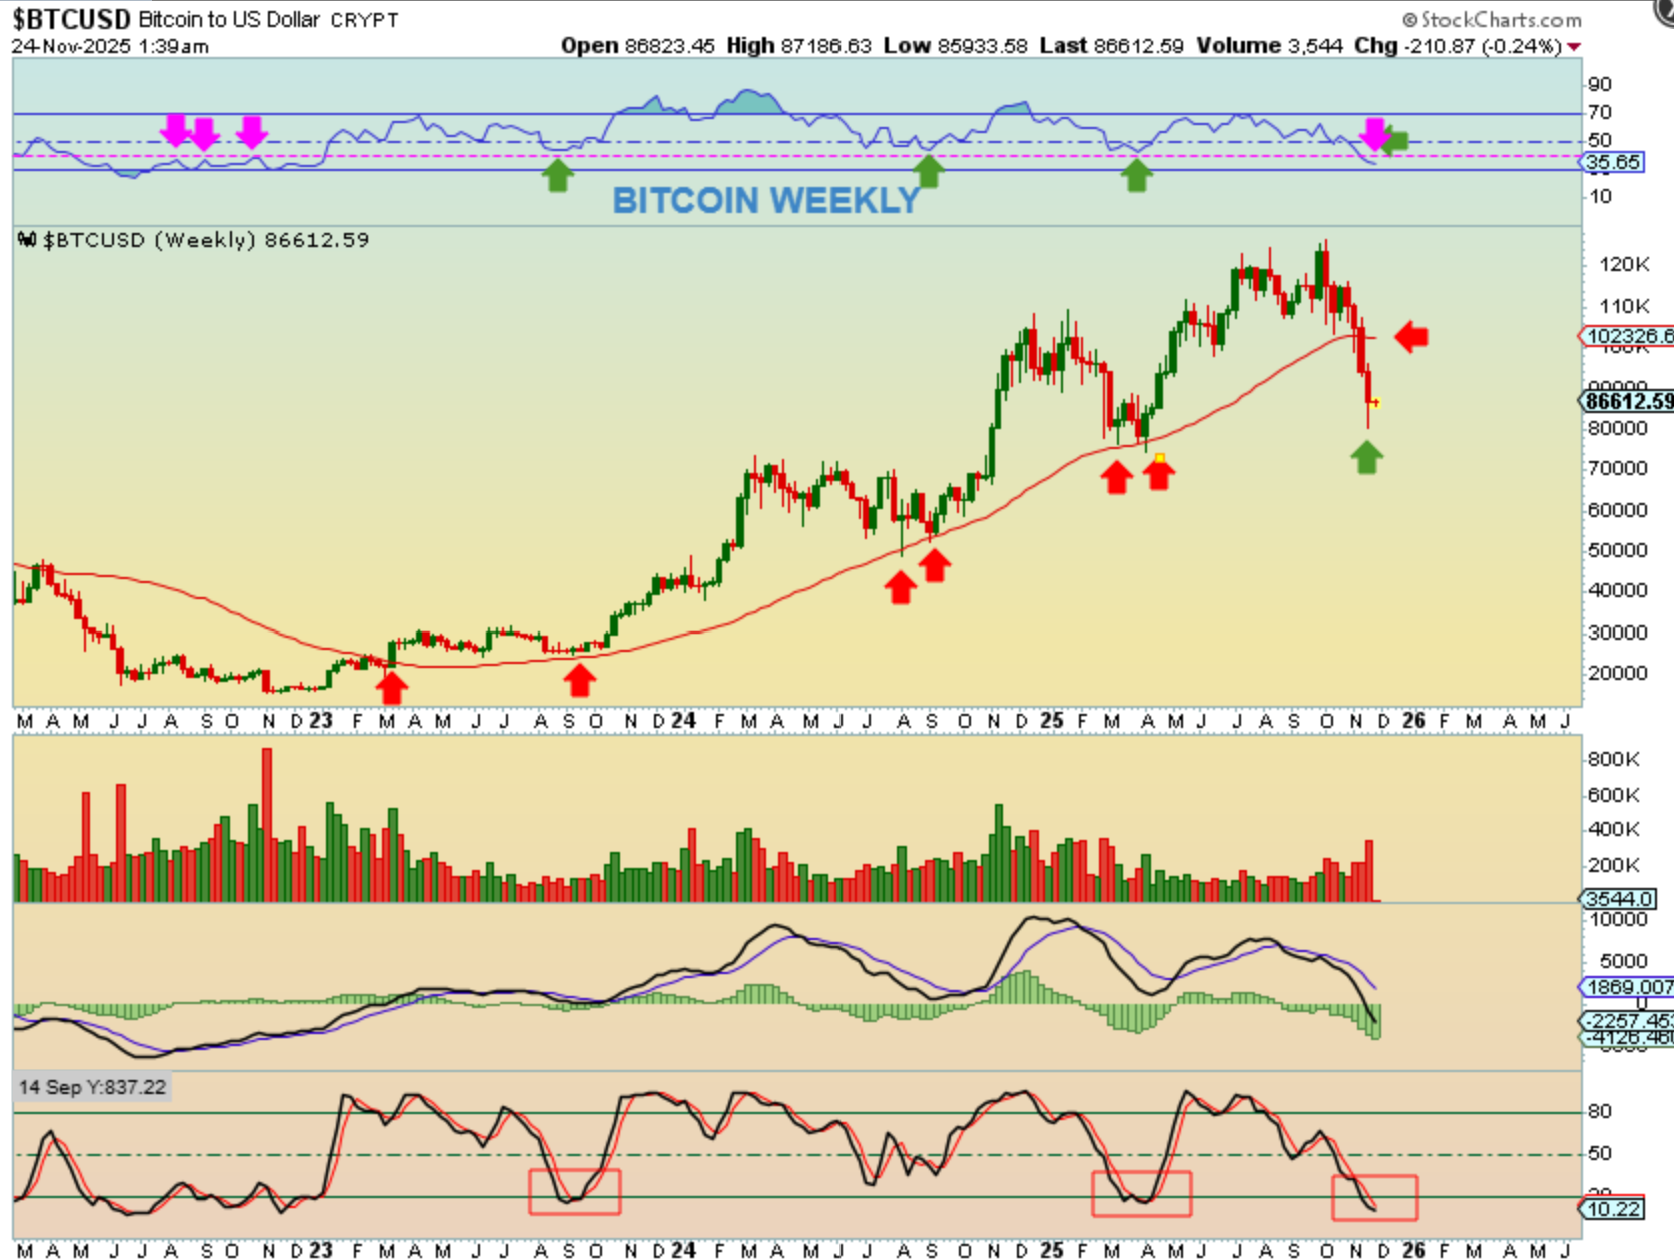
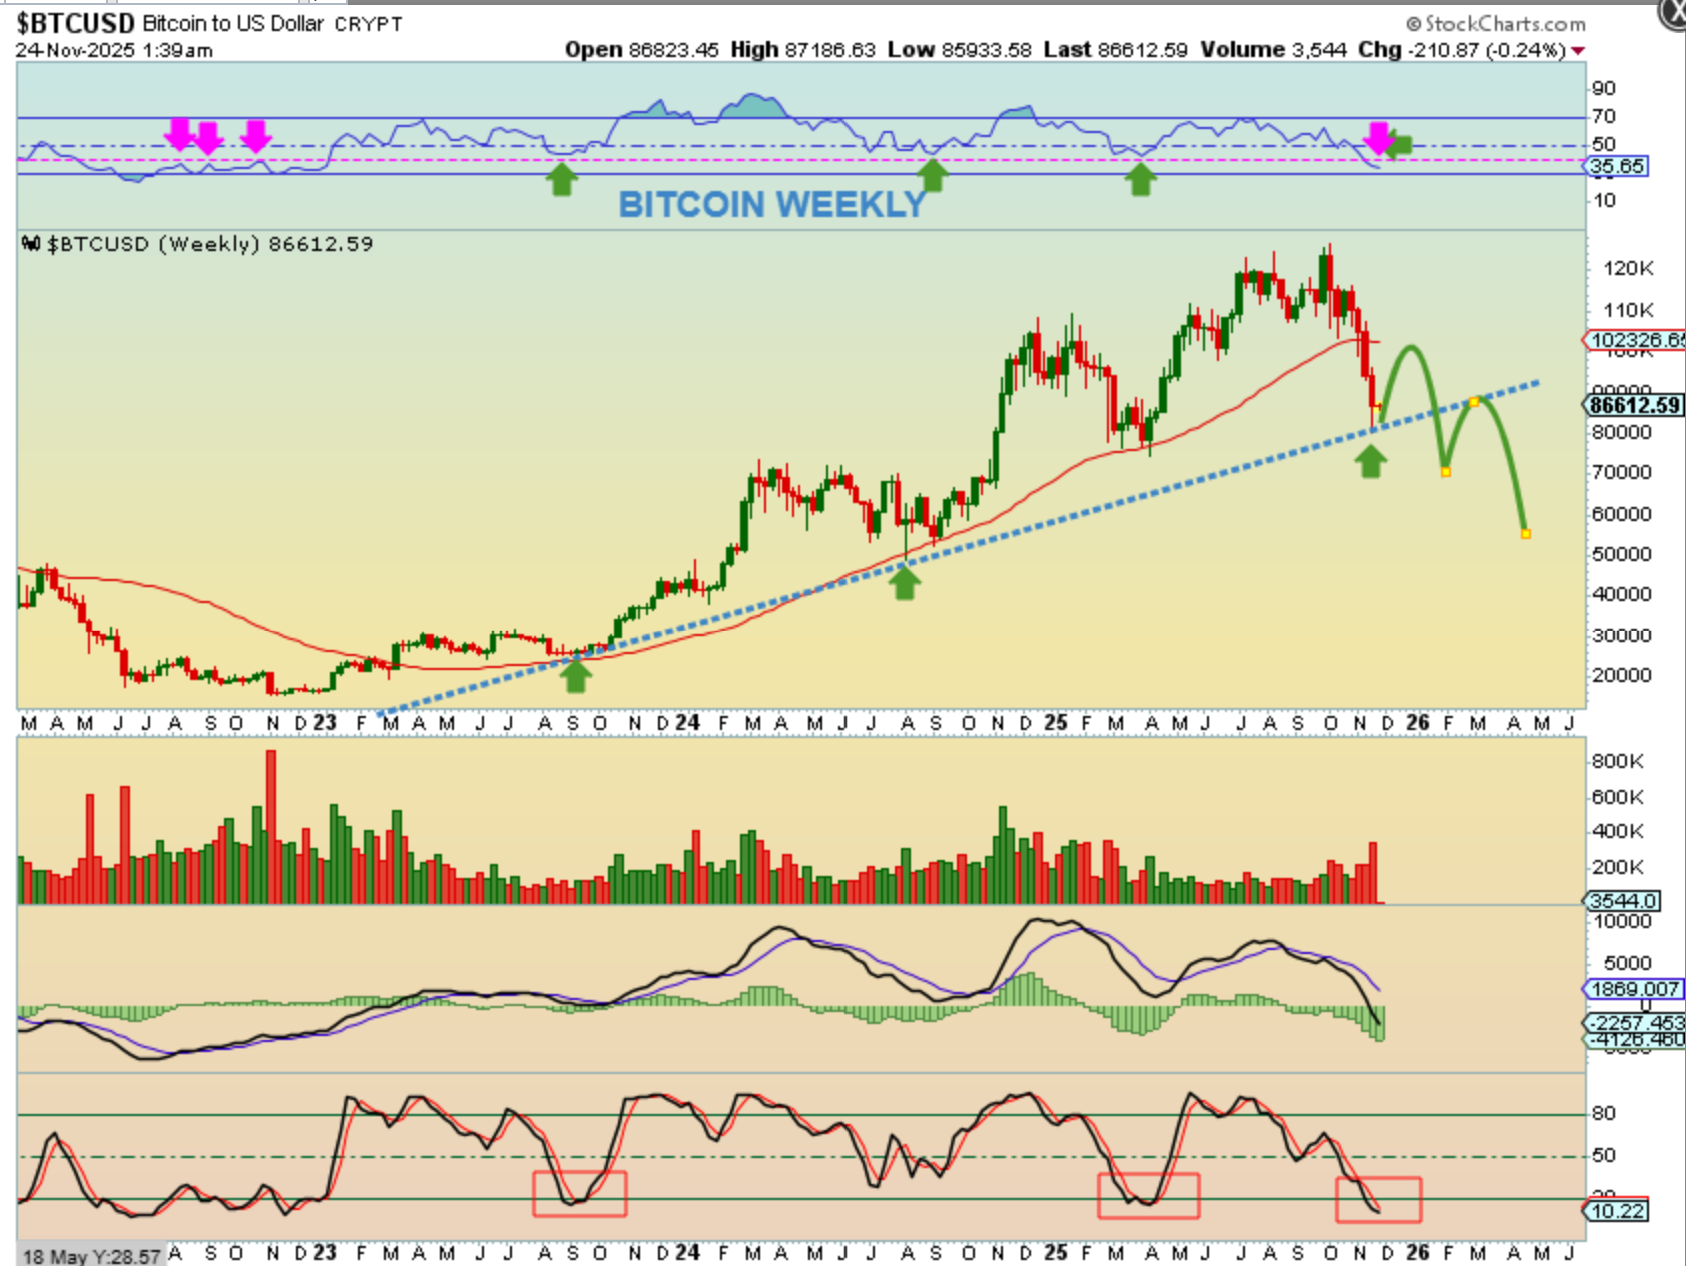
BITCOIN just plunged straight down over the past 4 weeks. Our daily cycle got stretched in a big way and Bitcoin closed well below the 50 week ma for 2 weeks in a row now. We do have a reversal candle and the weekly chart reached oversold, so Bitcoin also may rally next week, during the holiday week. Take a look at the weekly RSI
.
Take a look at the weekly RSI. This is the first time that it fell that far below the 50% mark since the 4 year cycle lows! My magenta line shows that. We can bounce, but as I have been saying, I think that Bitcoins 3 year rally is done, and the 4 yr drop has started.
.
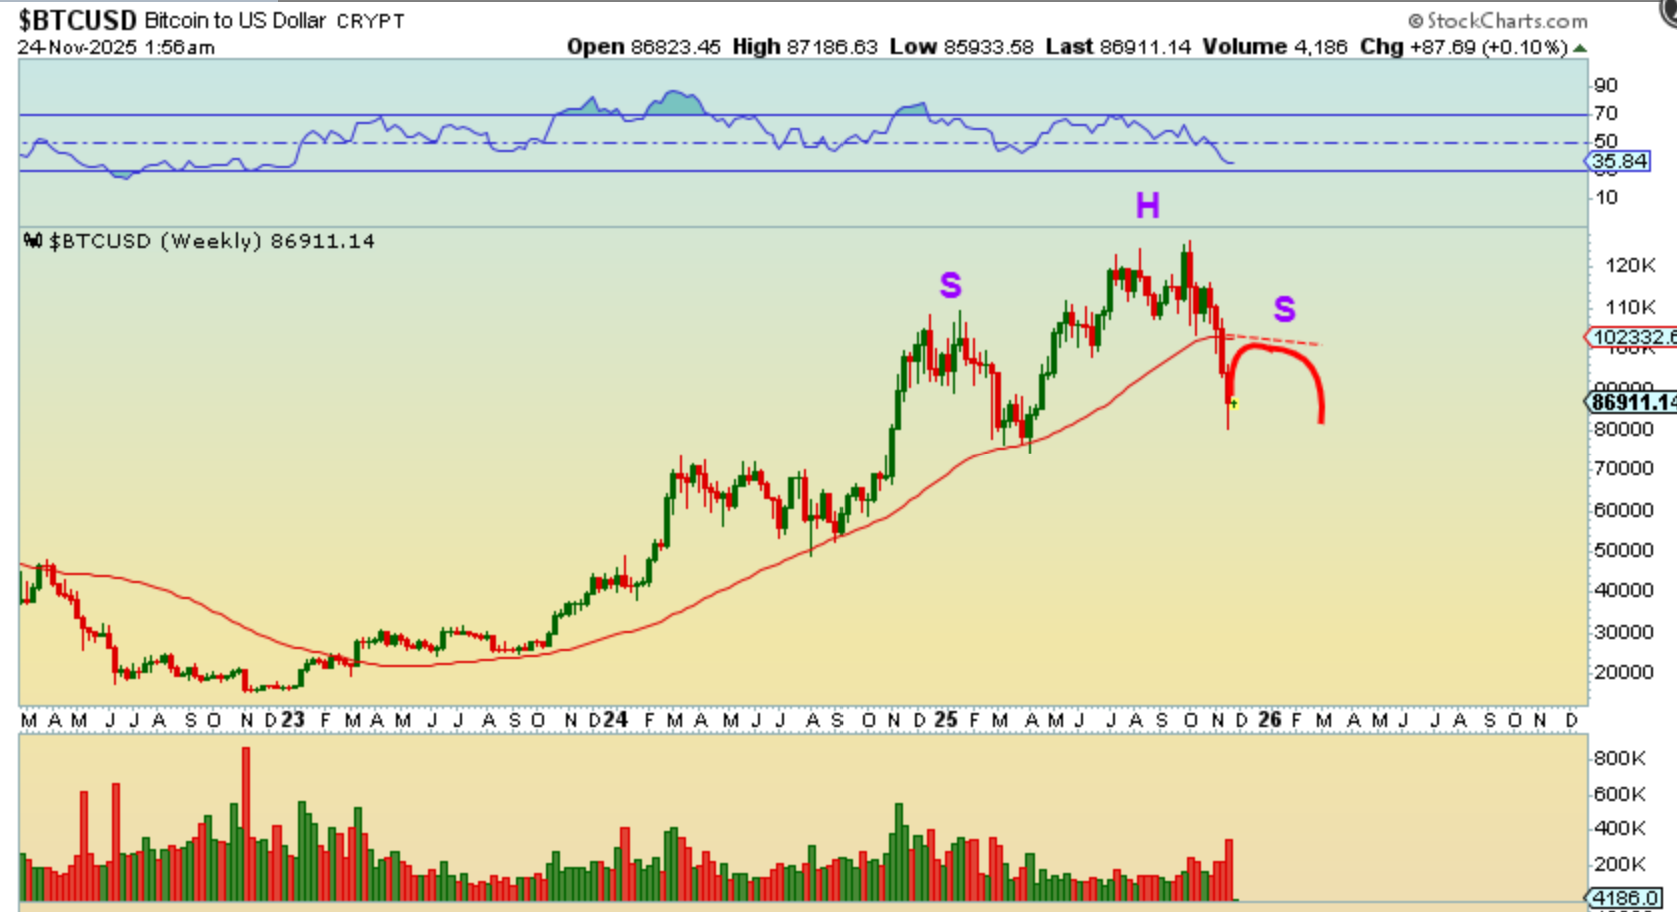
So yes, I think that BITCOIN can bounce here, but that 50 week ma may be all that we see. It could even run up, chop sideways and then drop, giving us a clear H&S.
.
Bitcoin could even run up toward $100,000 again, chop sideways and then drop, giving us a clear H&S before rolling over.
.
Just to show how much of a sell off it was that we just witnessed, BITCOIN pretty much gave back all of 2025’s gains since the peak in October! Wow! That may be a capitulation high volume low and a reversal that rallies higher, but again, we may get a H&S pattern and roll over after a few weeks. You could try a long trade here, and if you happen to own any crypto stocks now, you could sell the bounce to $100,000 (or more).