Friday November 14th – A Sea of Red
We’ve been looking for clues and this is starting to look really clear. Yesterday we had a sea of red, since all sectors started to sell off in the afternoon.
.
SPX –
1. We are on month 7, and an ICL is due.
2. It is day 24, we have a day 13 peak, this will very likely remain L.T.
3. The MACD is weak, and price dropped back below the 20 ema. Yes, this may just chop around but it could also just sell off. Also…
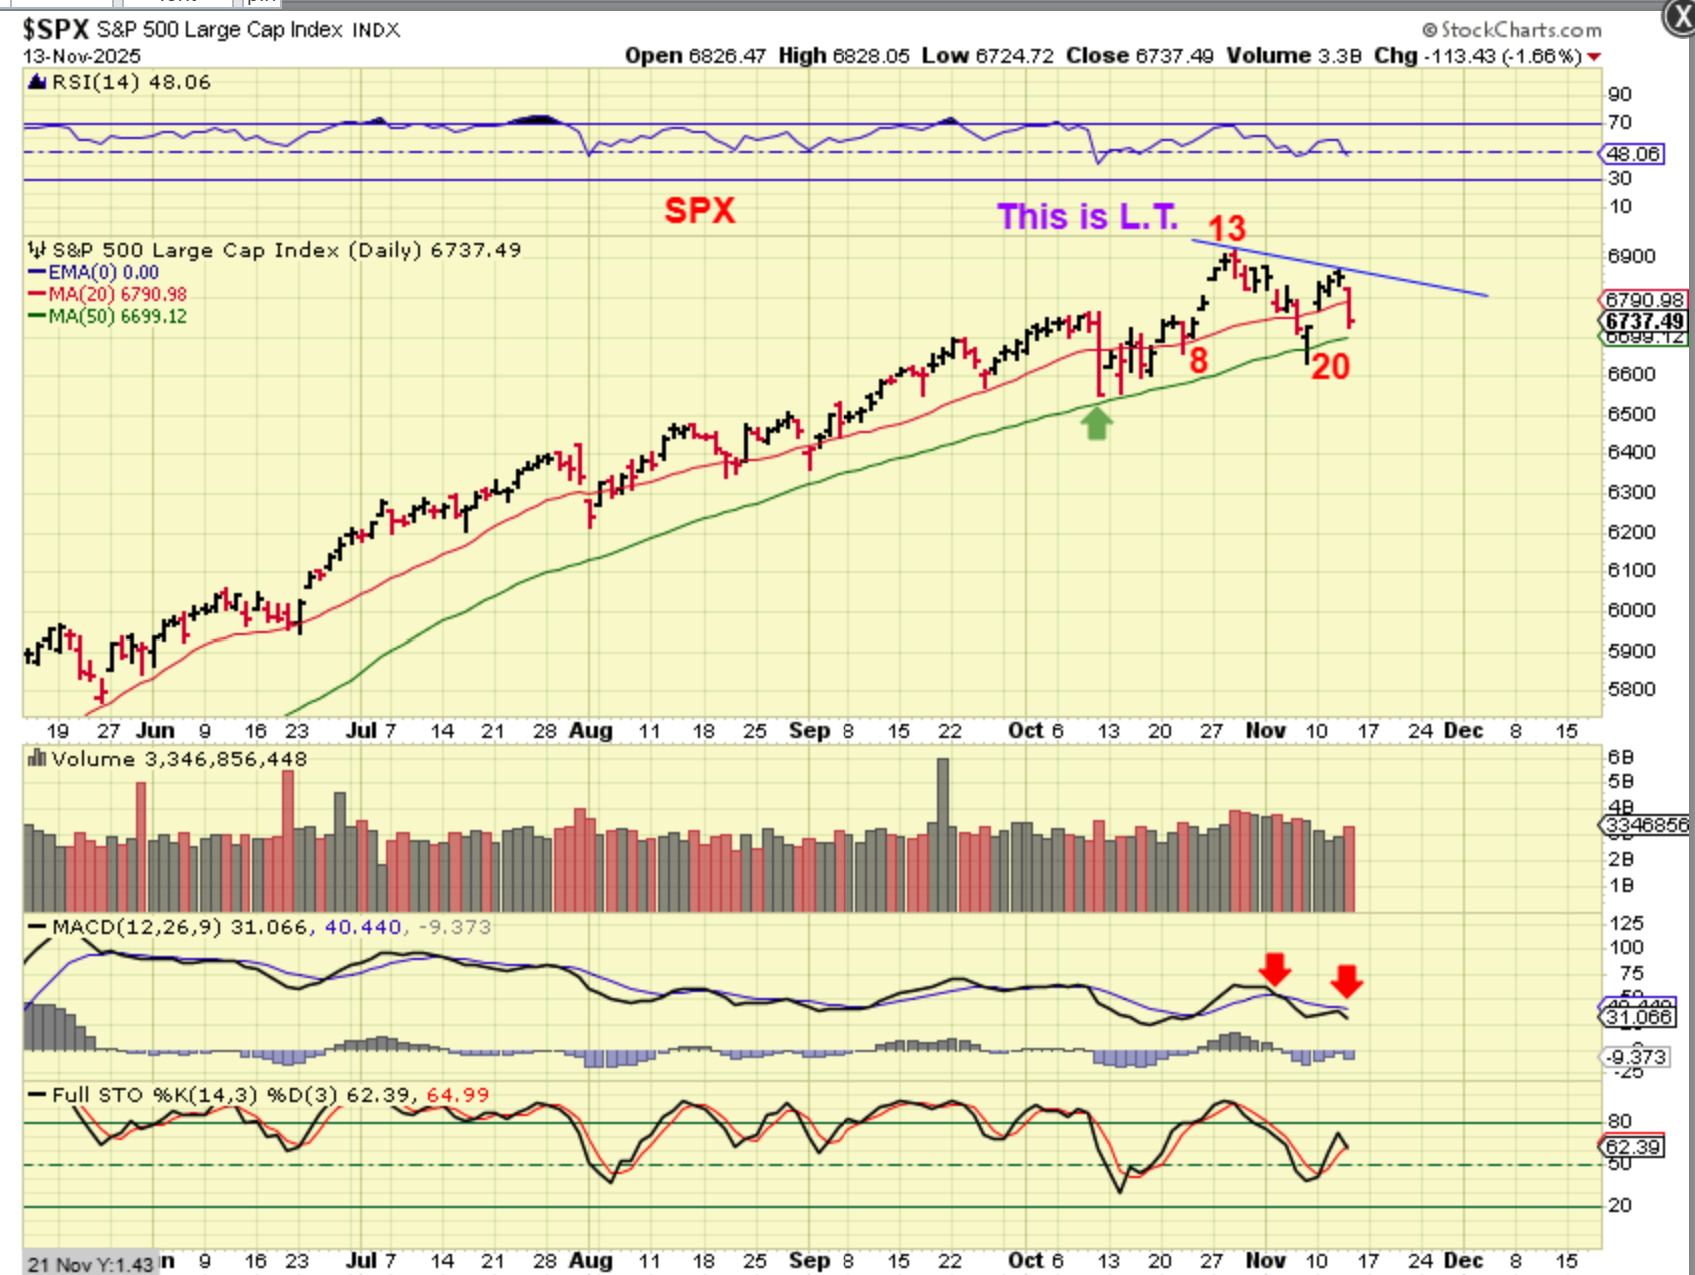
.
As mentioned in prior reports, I am also seeing some of the stronger stocks closing below the 50sma. I view that as another sign of weakness.
.
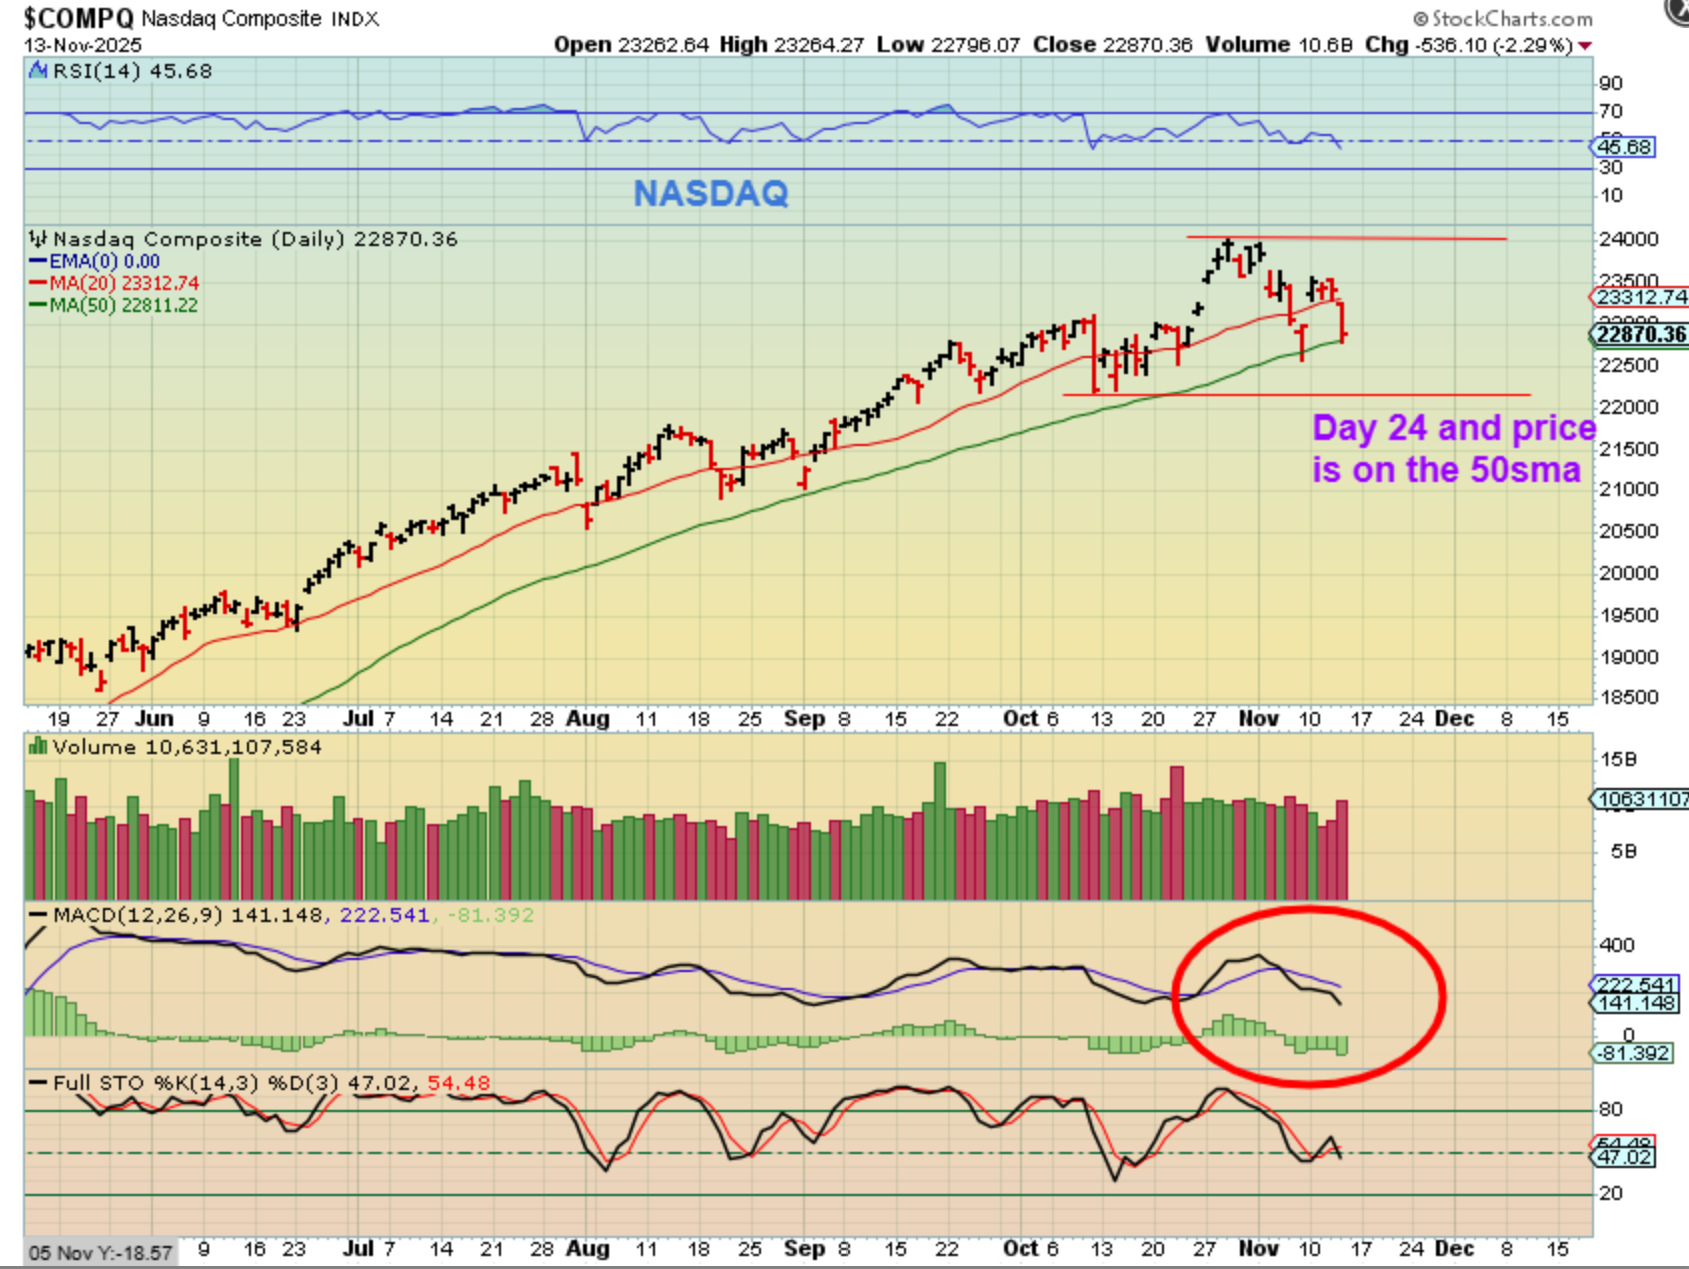
THE NASDAQ dropped to the 50sma again, and we are on day 24. The RSI lost the 50% line and the MACD is quite weak. This looks ready to break down, but…
.
.
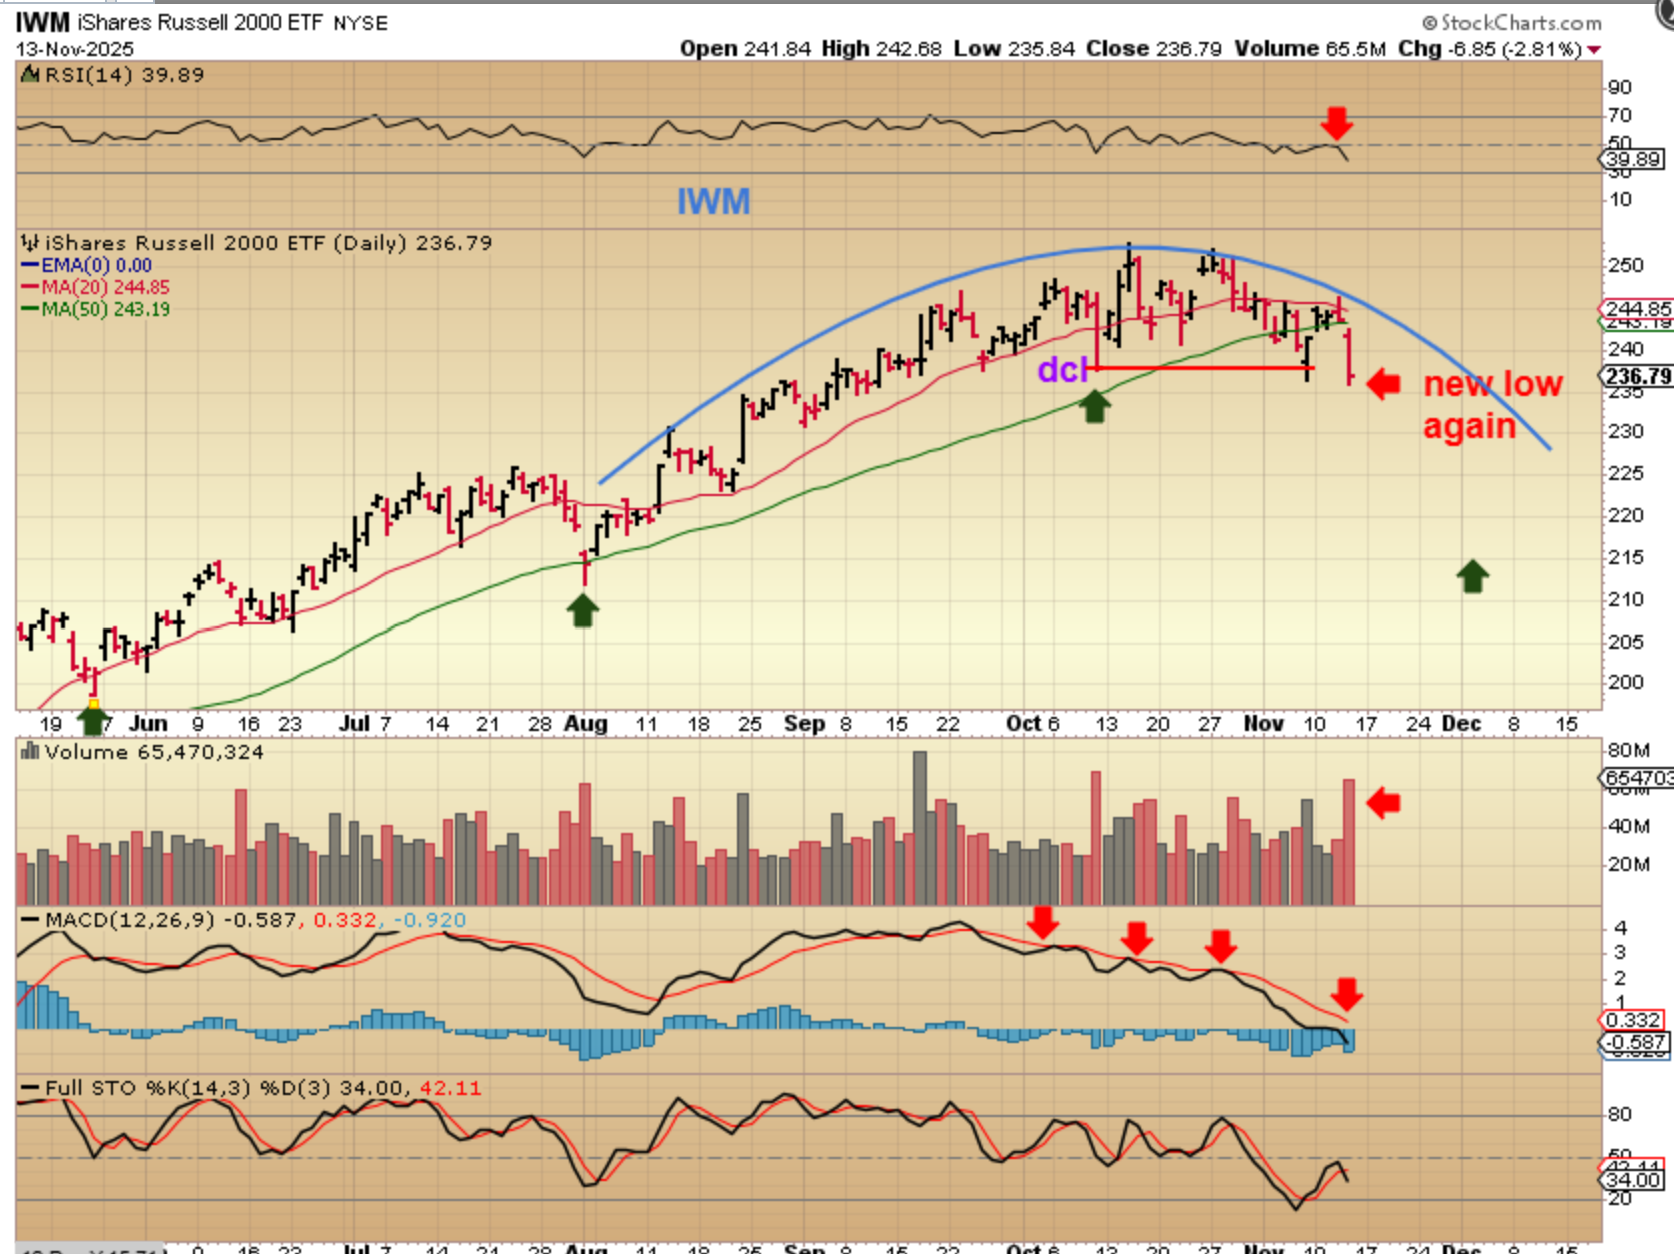
.. But take a look at the IWM. I pointed out that it had a failed daily cycle last week as a warning sign for us. On Thursday it actually broke below that failed daily cycle days lows too. Volume spiked and this looks quite bearish to me.
.
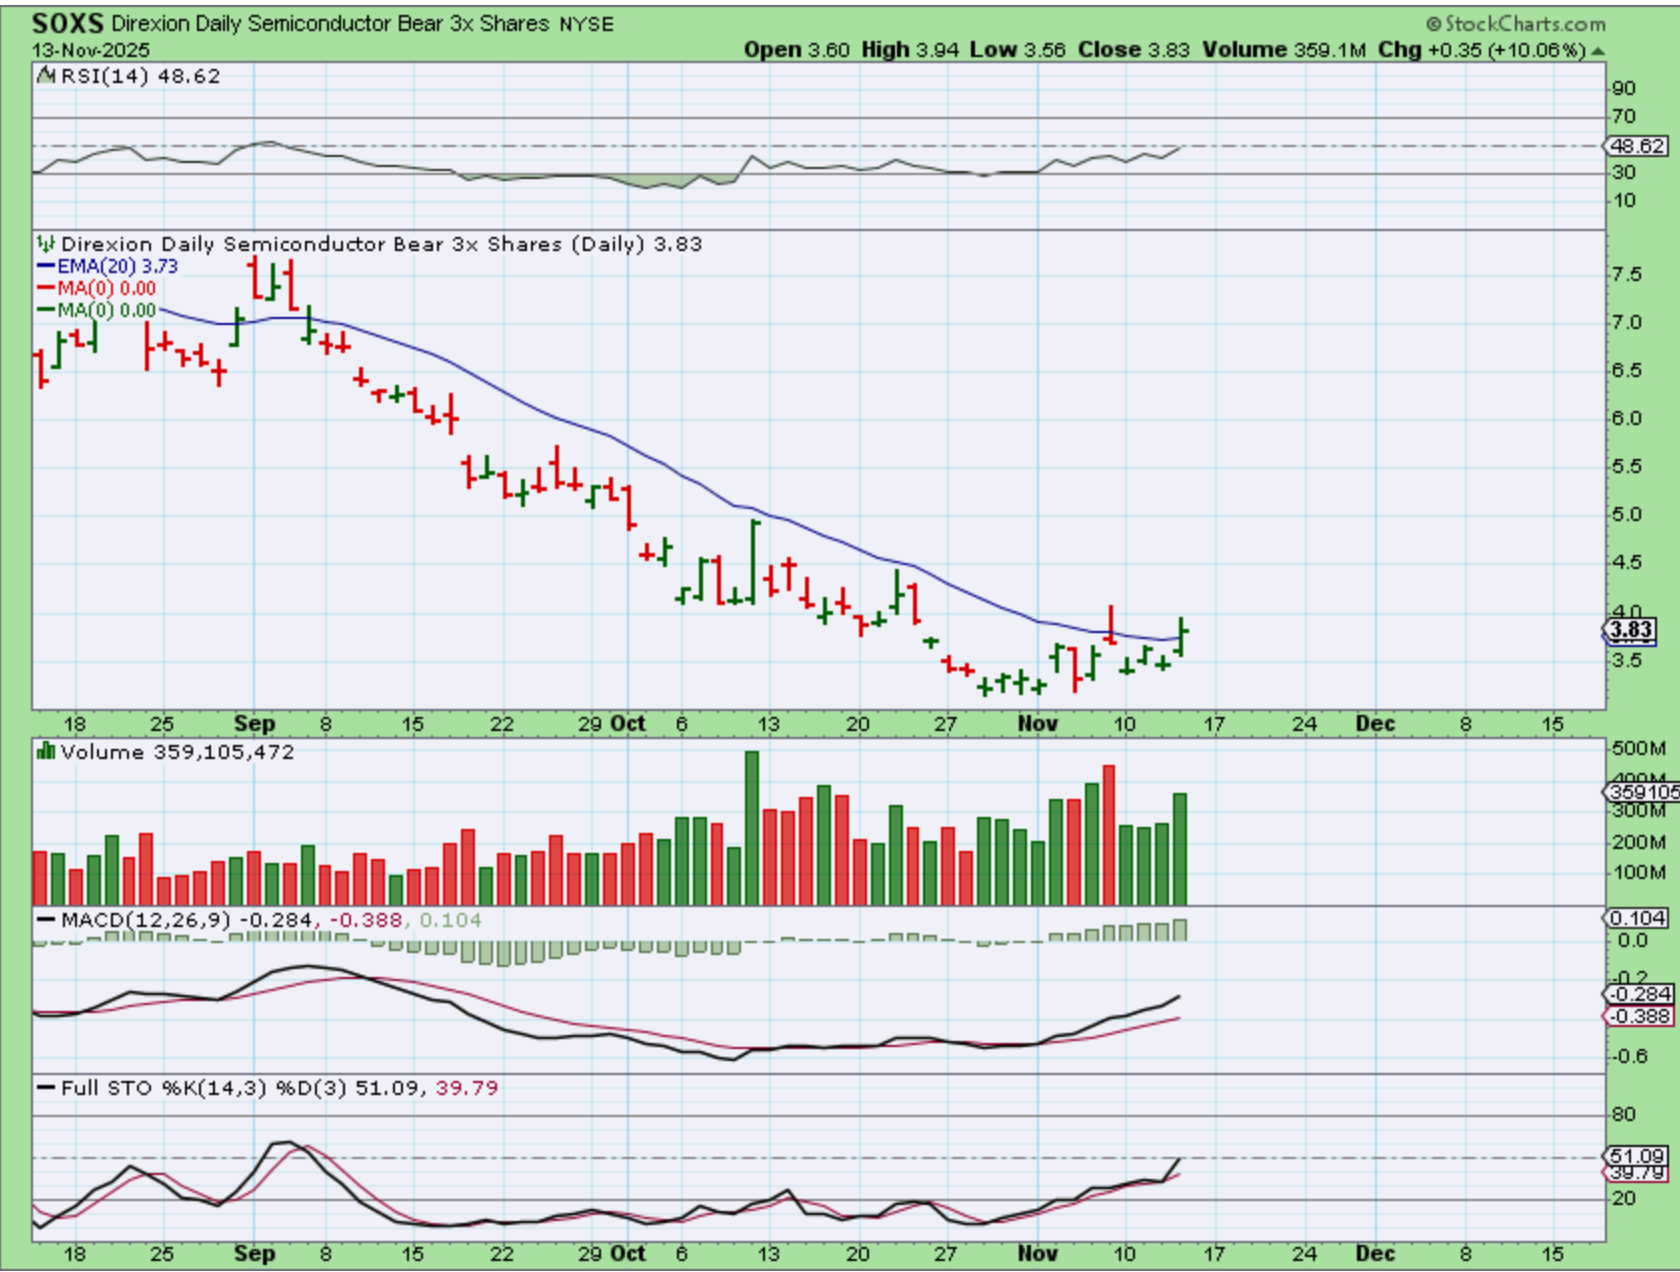
So we know that for traders, SOXS, SQQQ, and a few other ETFs that can be used to make gains on a drop (to short the markets). They can be hard to hold, because they are leveraged 2x & 3x and can bounce 8-10%. That can be difficult to stomach, especially if you get a 2 day bounce.
.
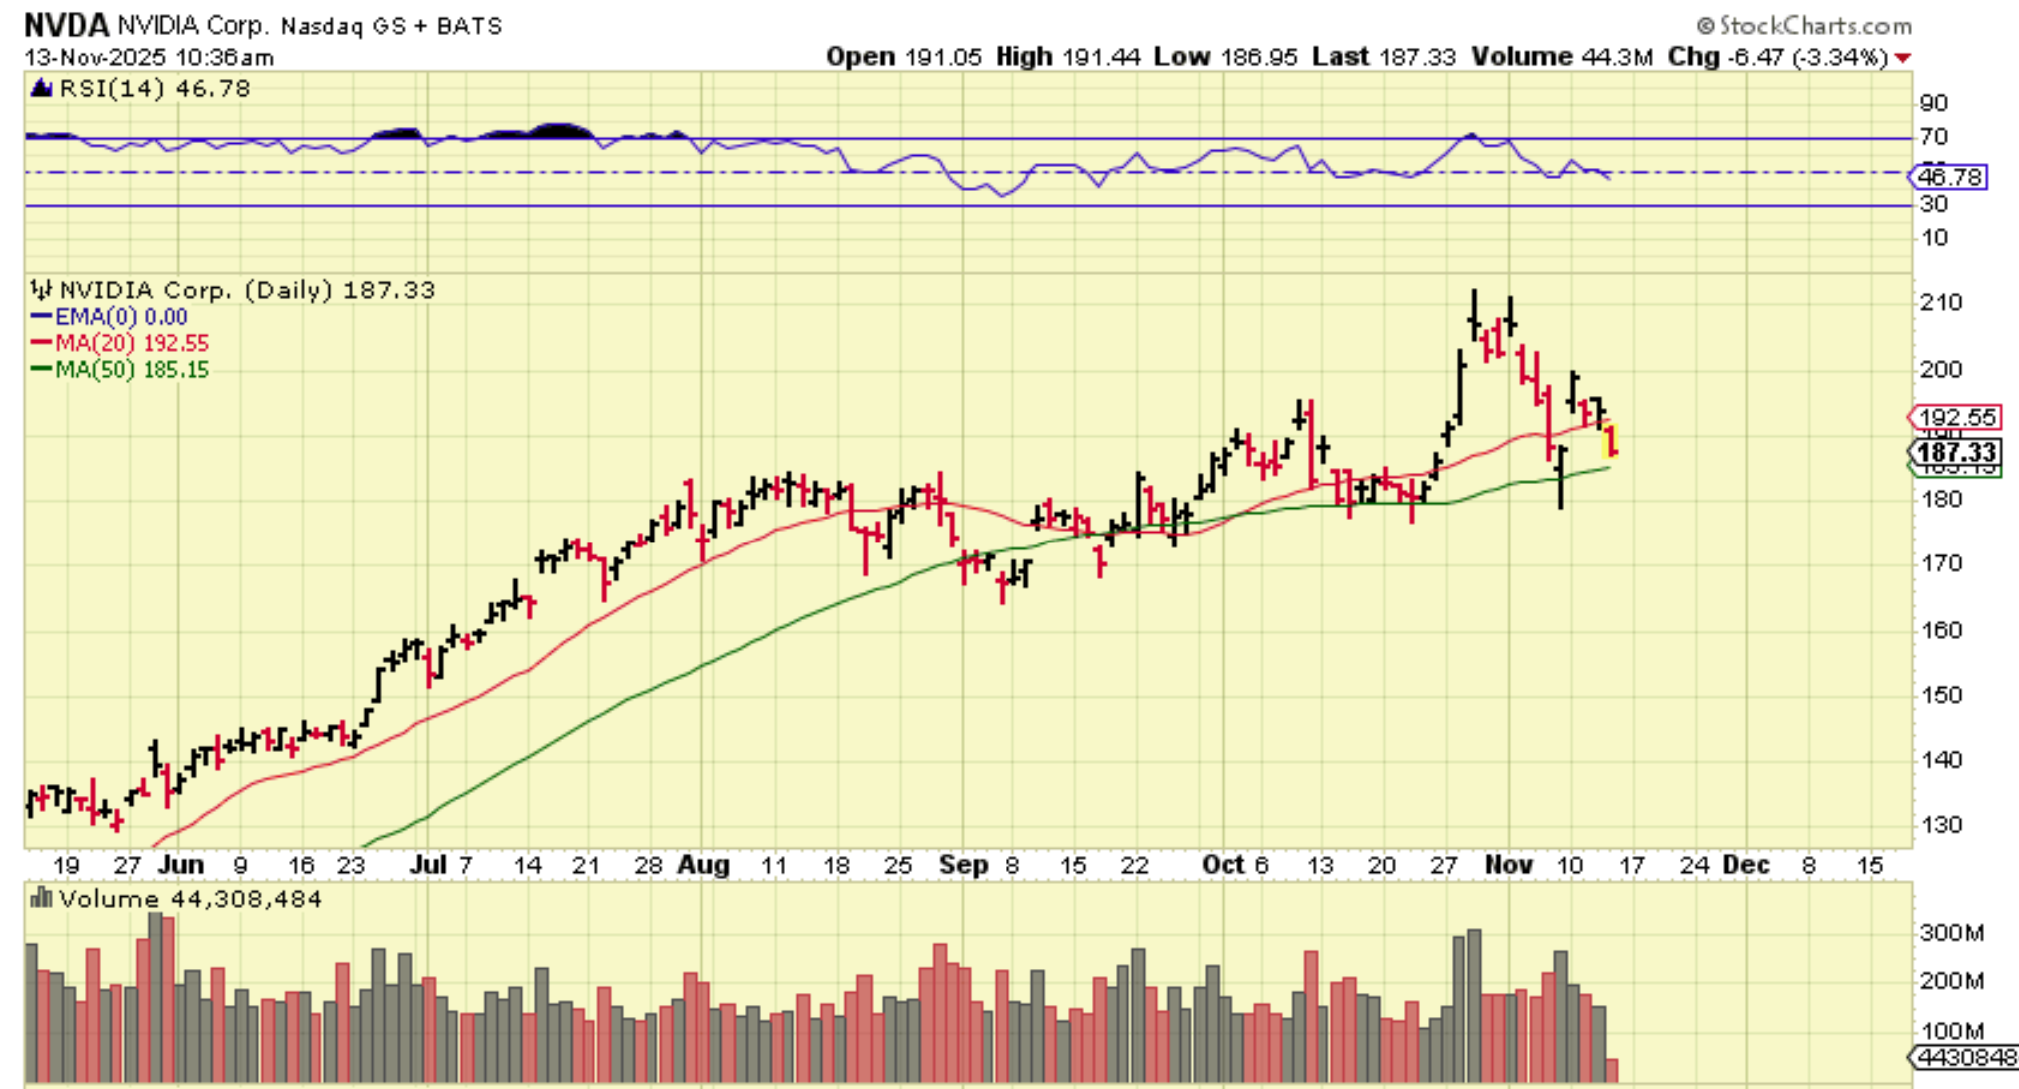
NVDA – So we look at our stronger stocks and see that they are selling off now too. If this was going to get caught up in an ICL sell off, then…
.
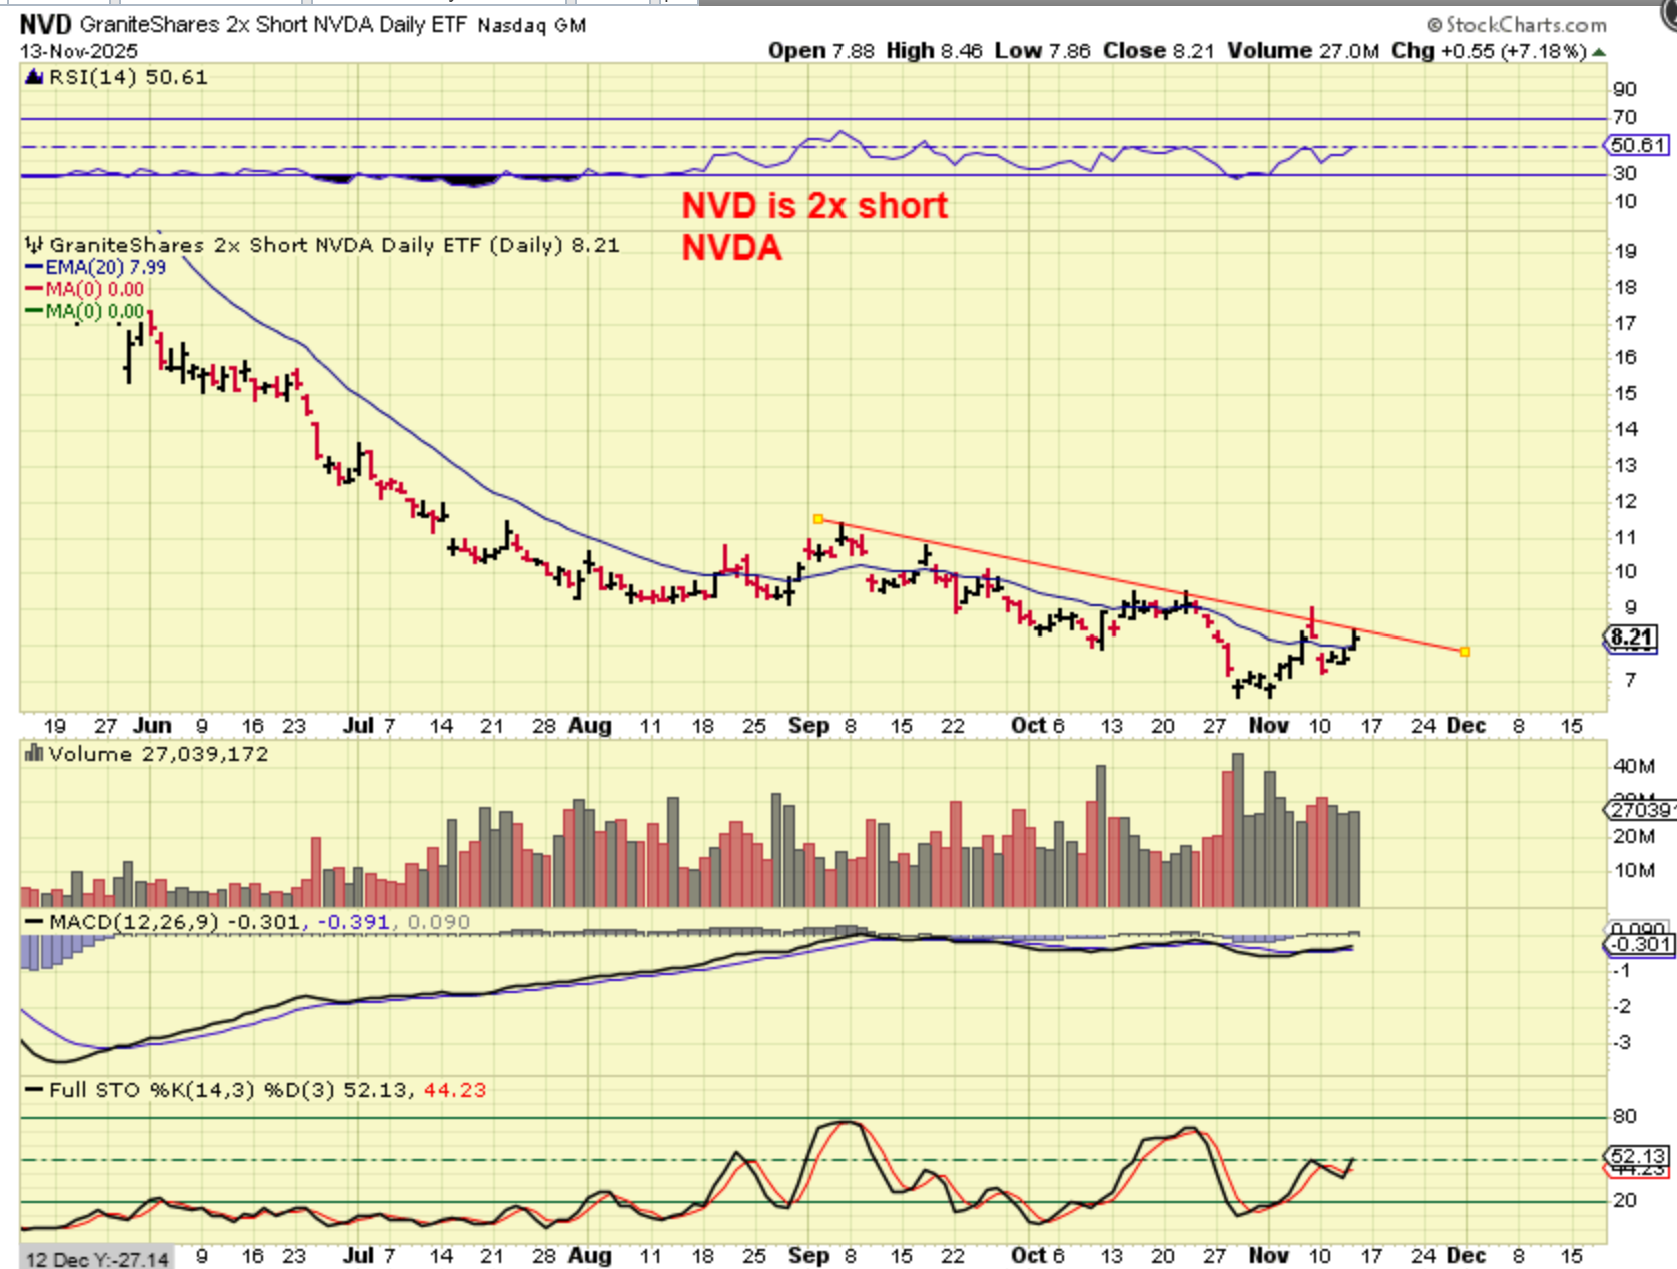
NVD (2x short NVDA) may rally as the markets sell off. Volume seems to be increasing.
.
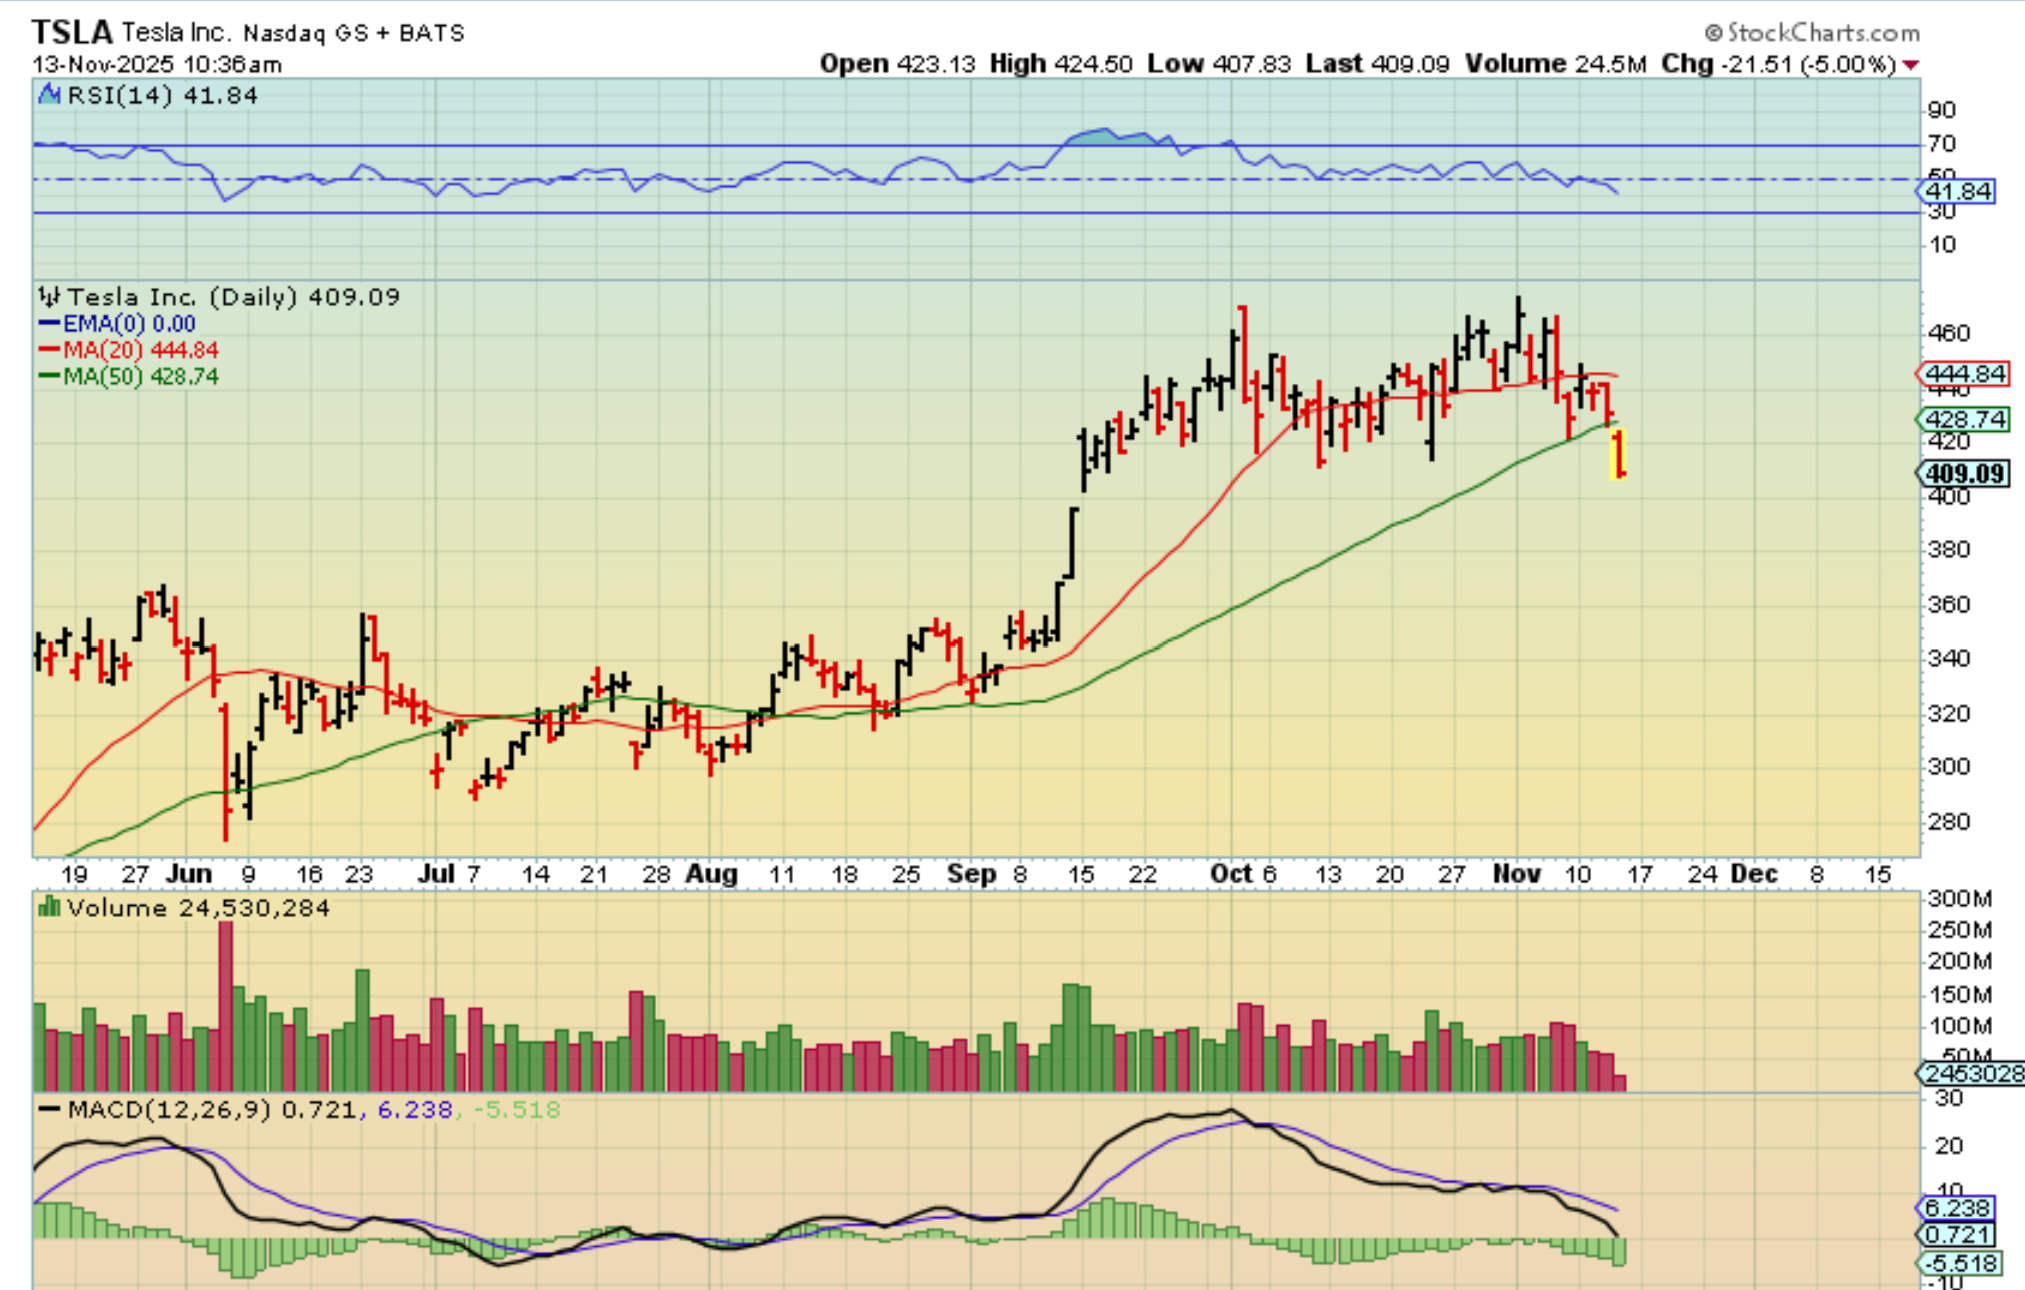
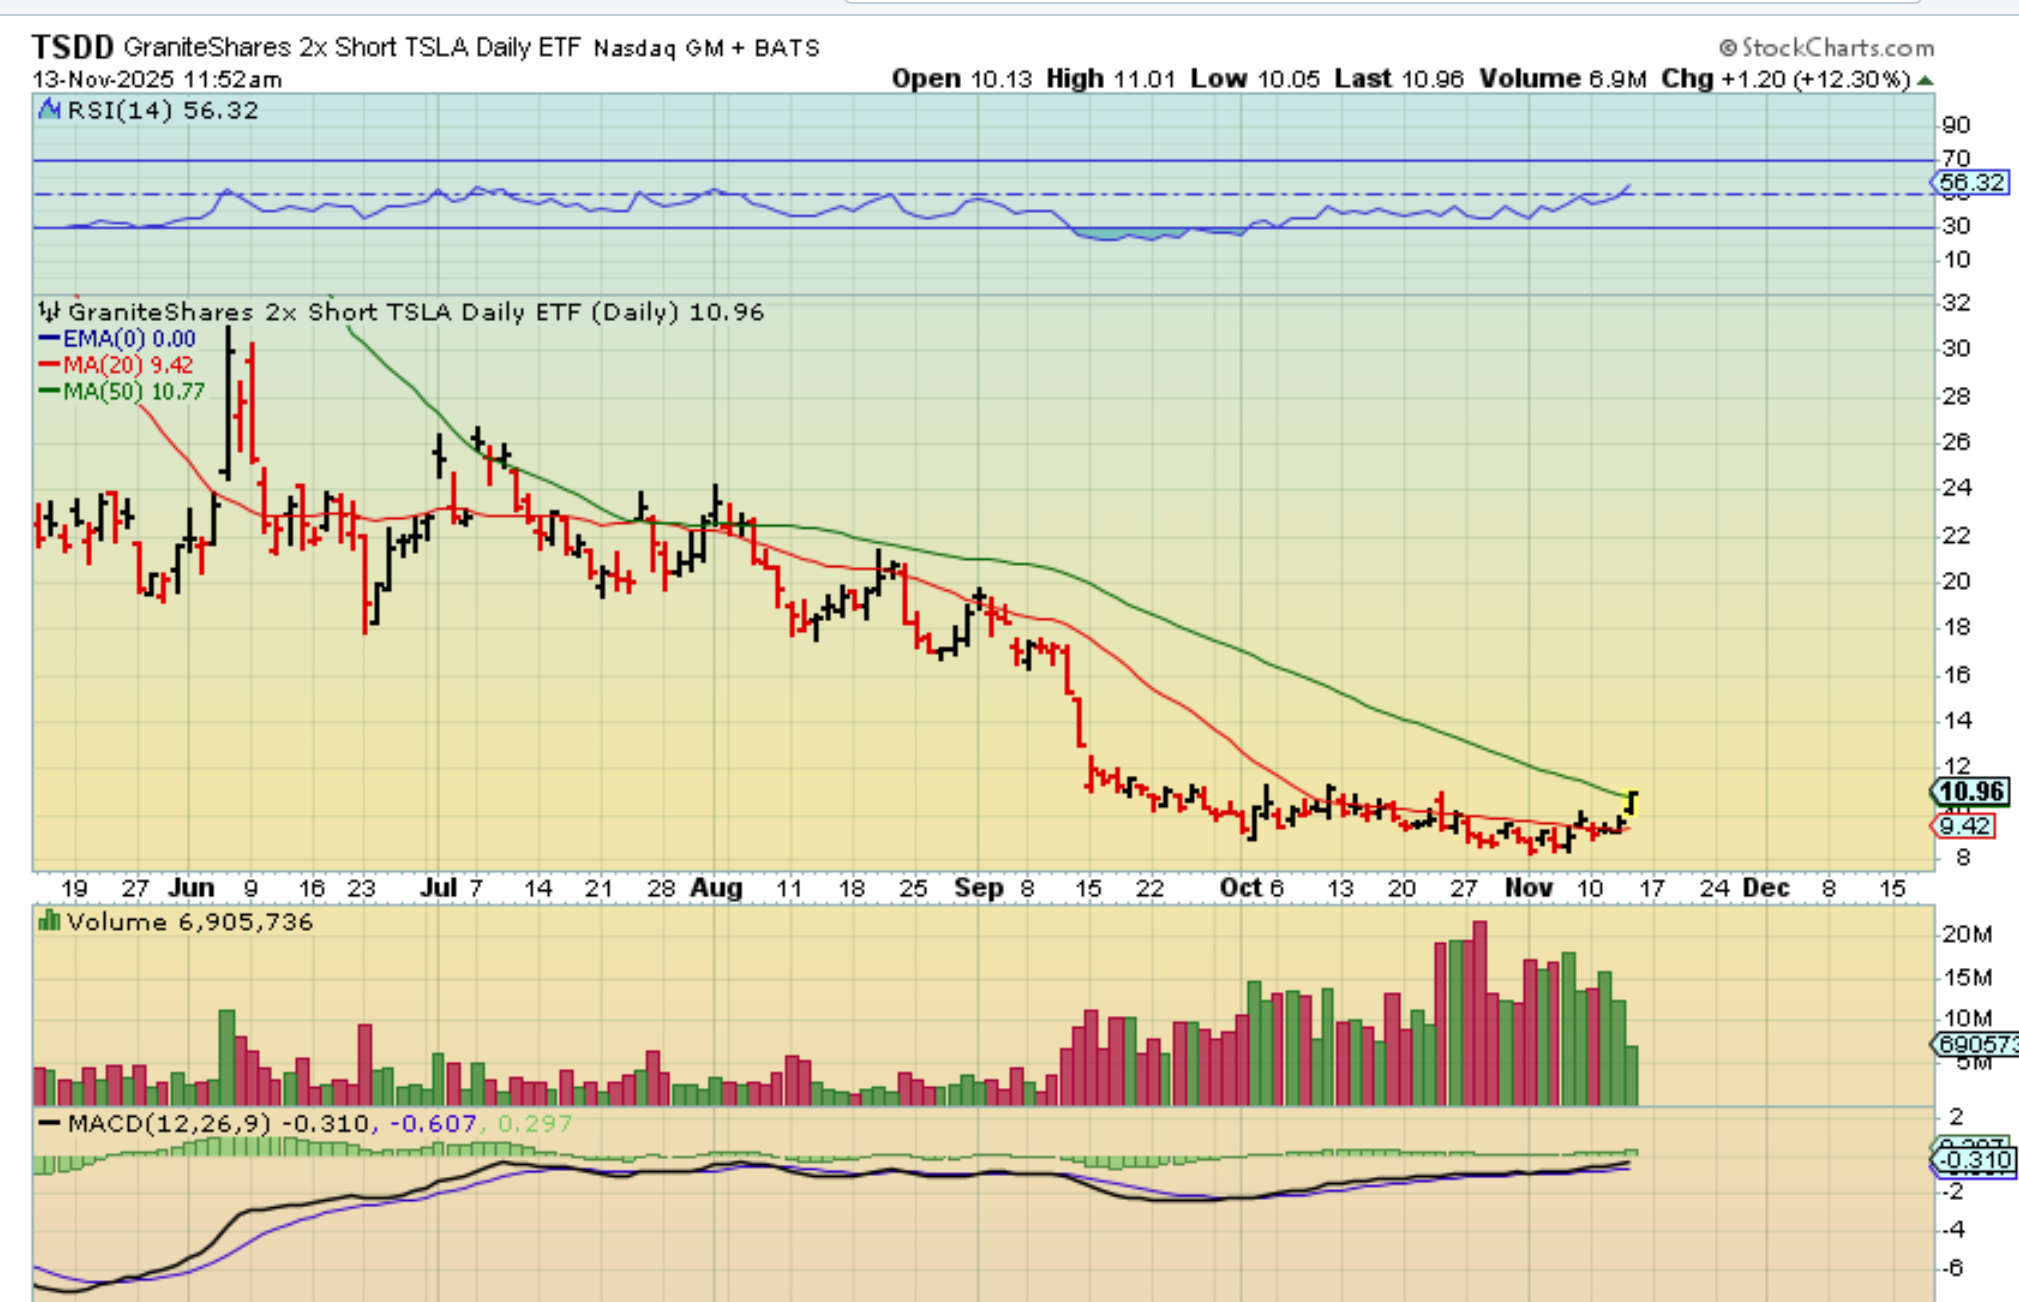
TSLA dropped and lost the 50sma, so we see the selling affecting many areas.
.
TSDD -is the 2x short for TSLA, and you can see that as TSLA dropped through the 50sma, TSDD Popped through the 50sma and closed up over 13%. This chart was captured in the morning.
.
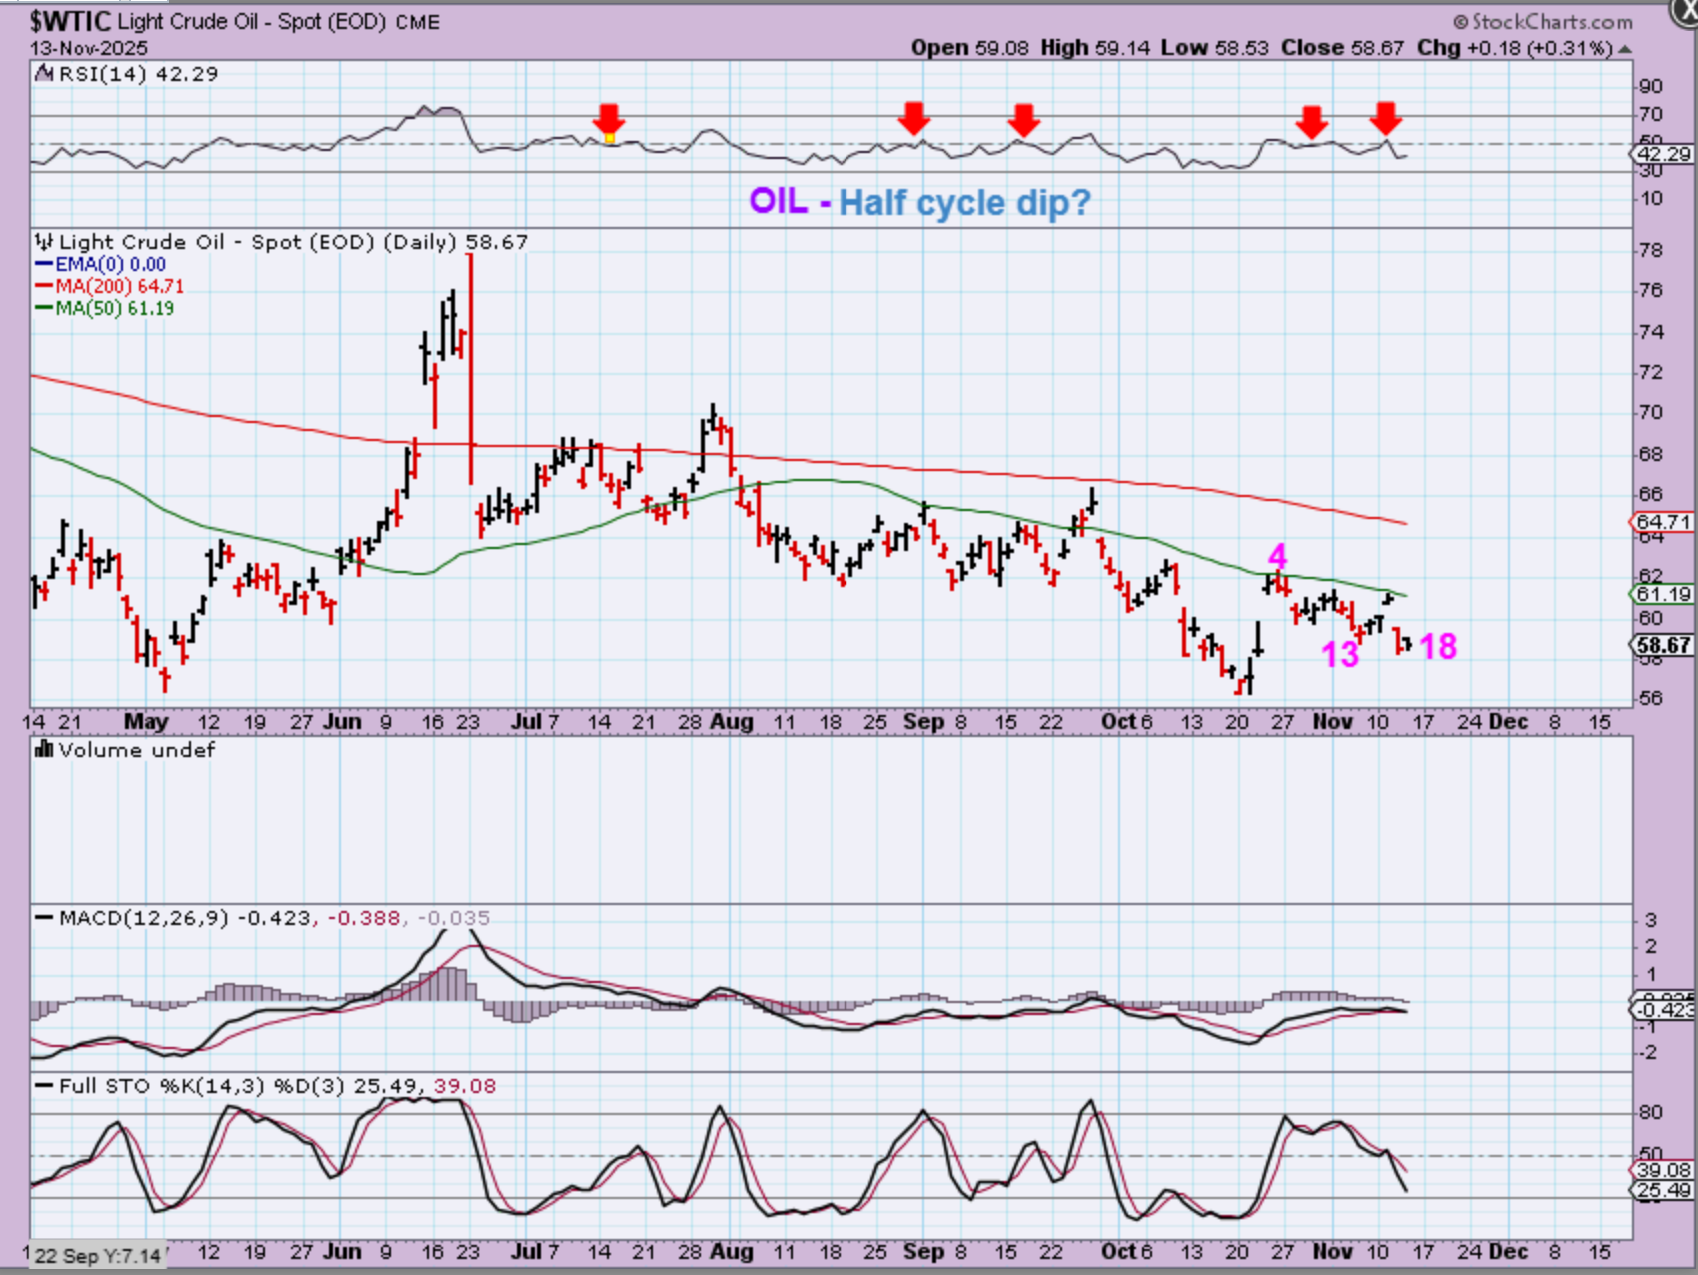
WTIC – Oil dropped sharply on Wednesday and paused on Thursday. If this is an ICL, then price should go higher, so this may be a half cycle drop before price reverses higher. If Oil sells off below the October low, then this was obviously not an ICL. We would still have a lower high and lower low.
.
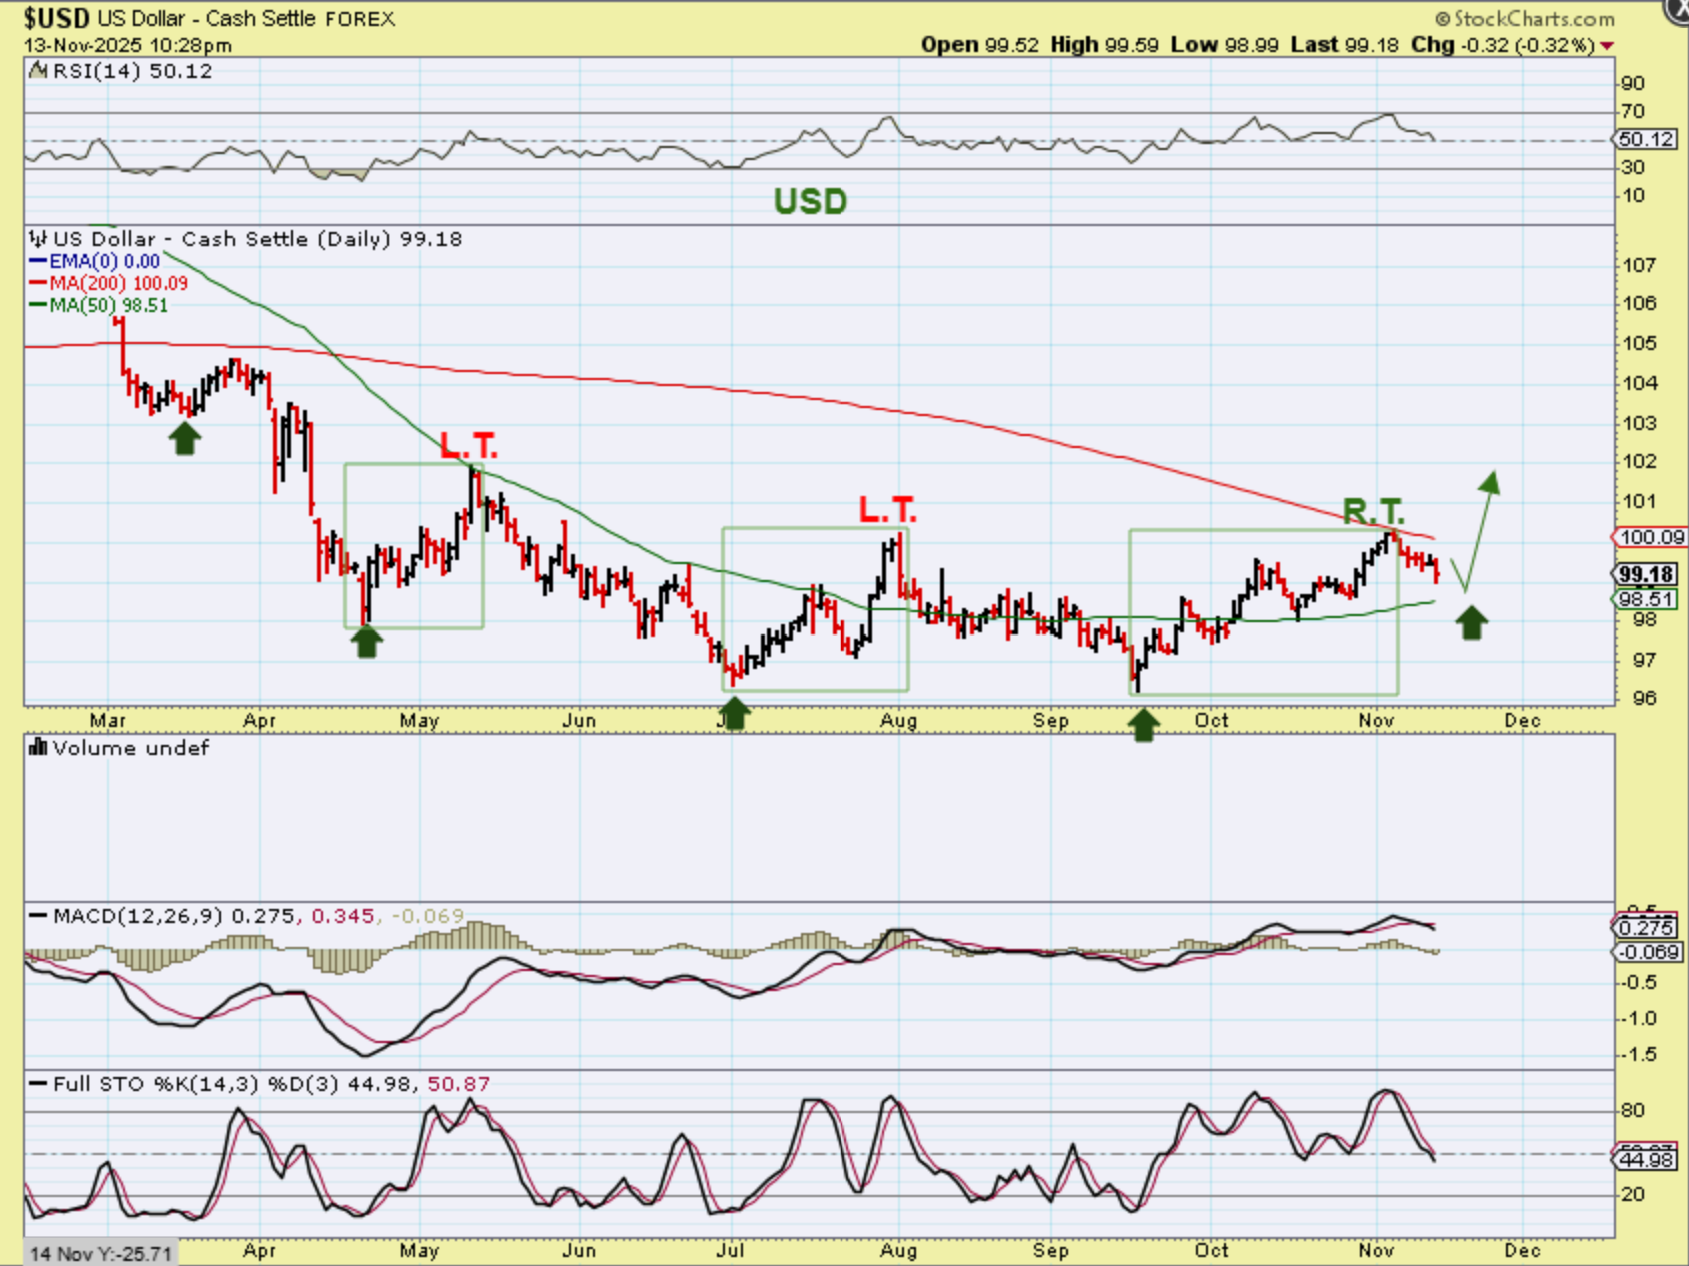
THE USD did put in a slightly higher high and a R.T. daily cycle. It is at resistance and pulled back, but this crawl under the 200sma could build energy for the next push higher.
.
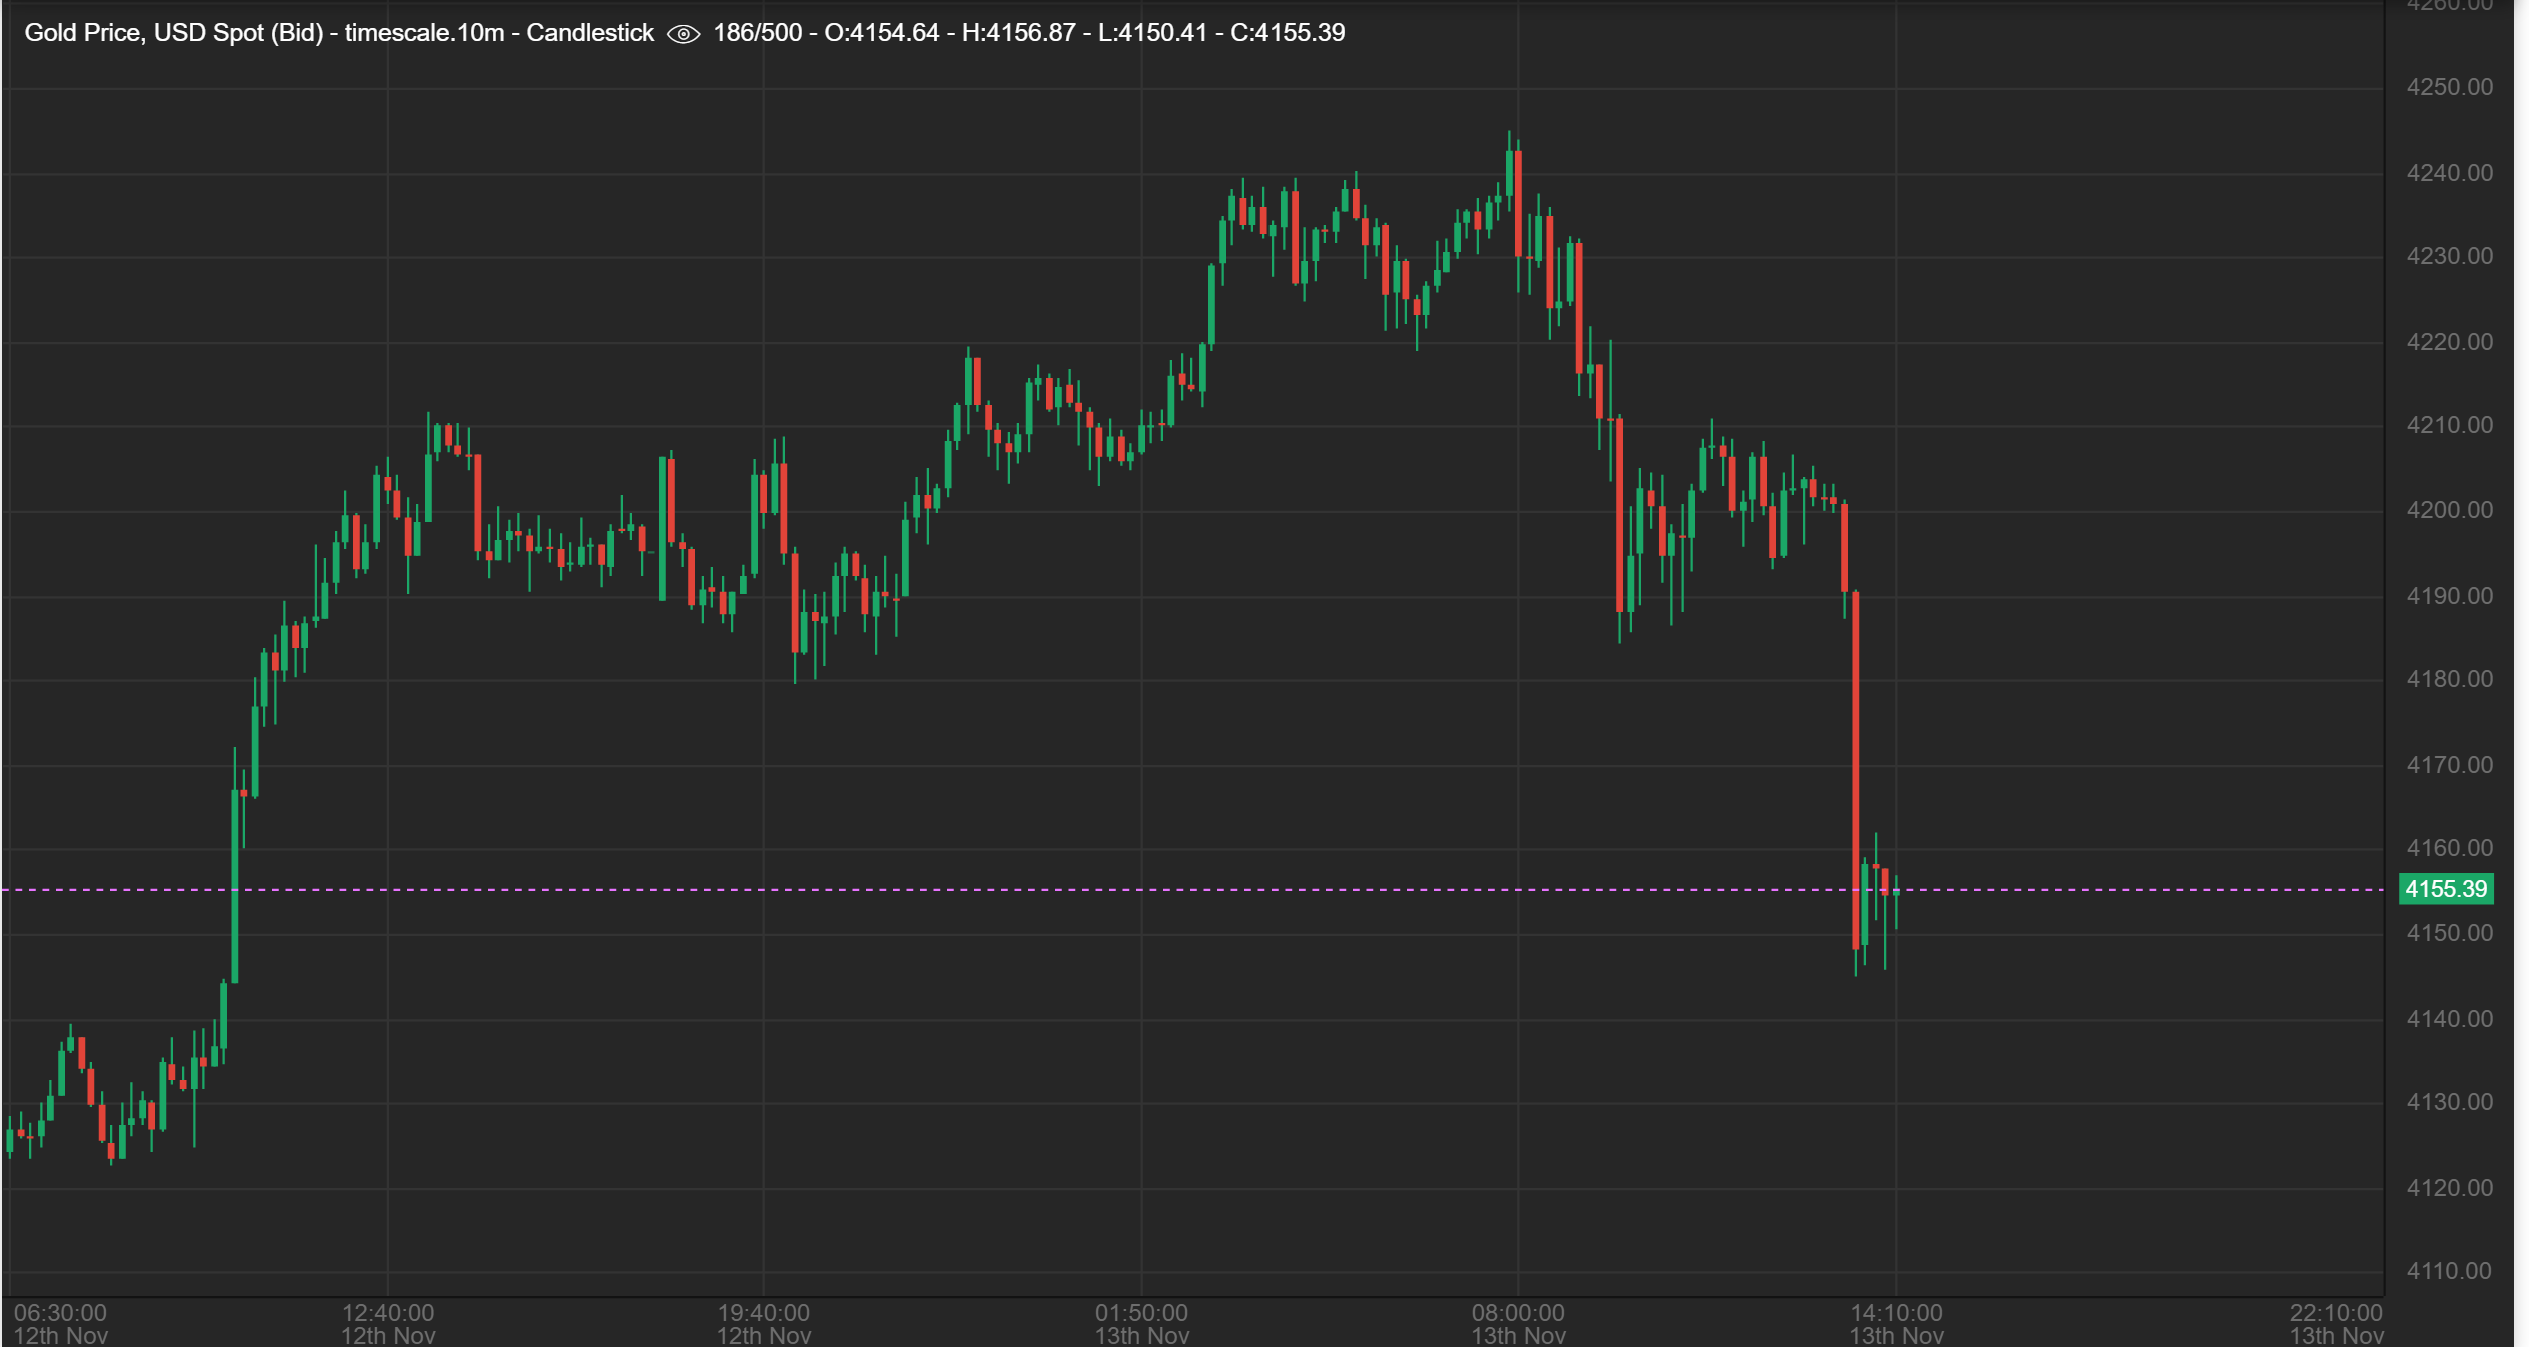
GOLD rallied but then it sold off, so that gave us a ‘Doji’ or indecision candle. When Gold sold off lower, it was not a mild selling…
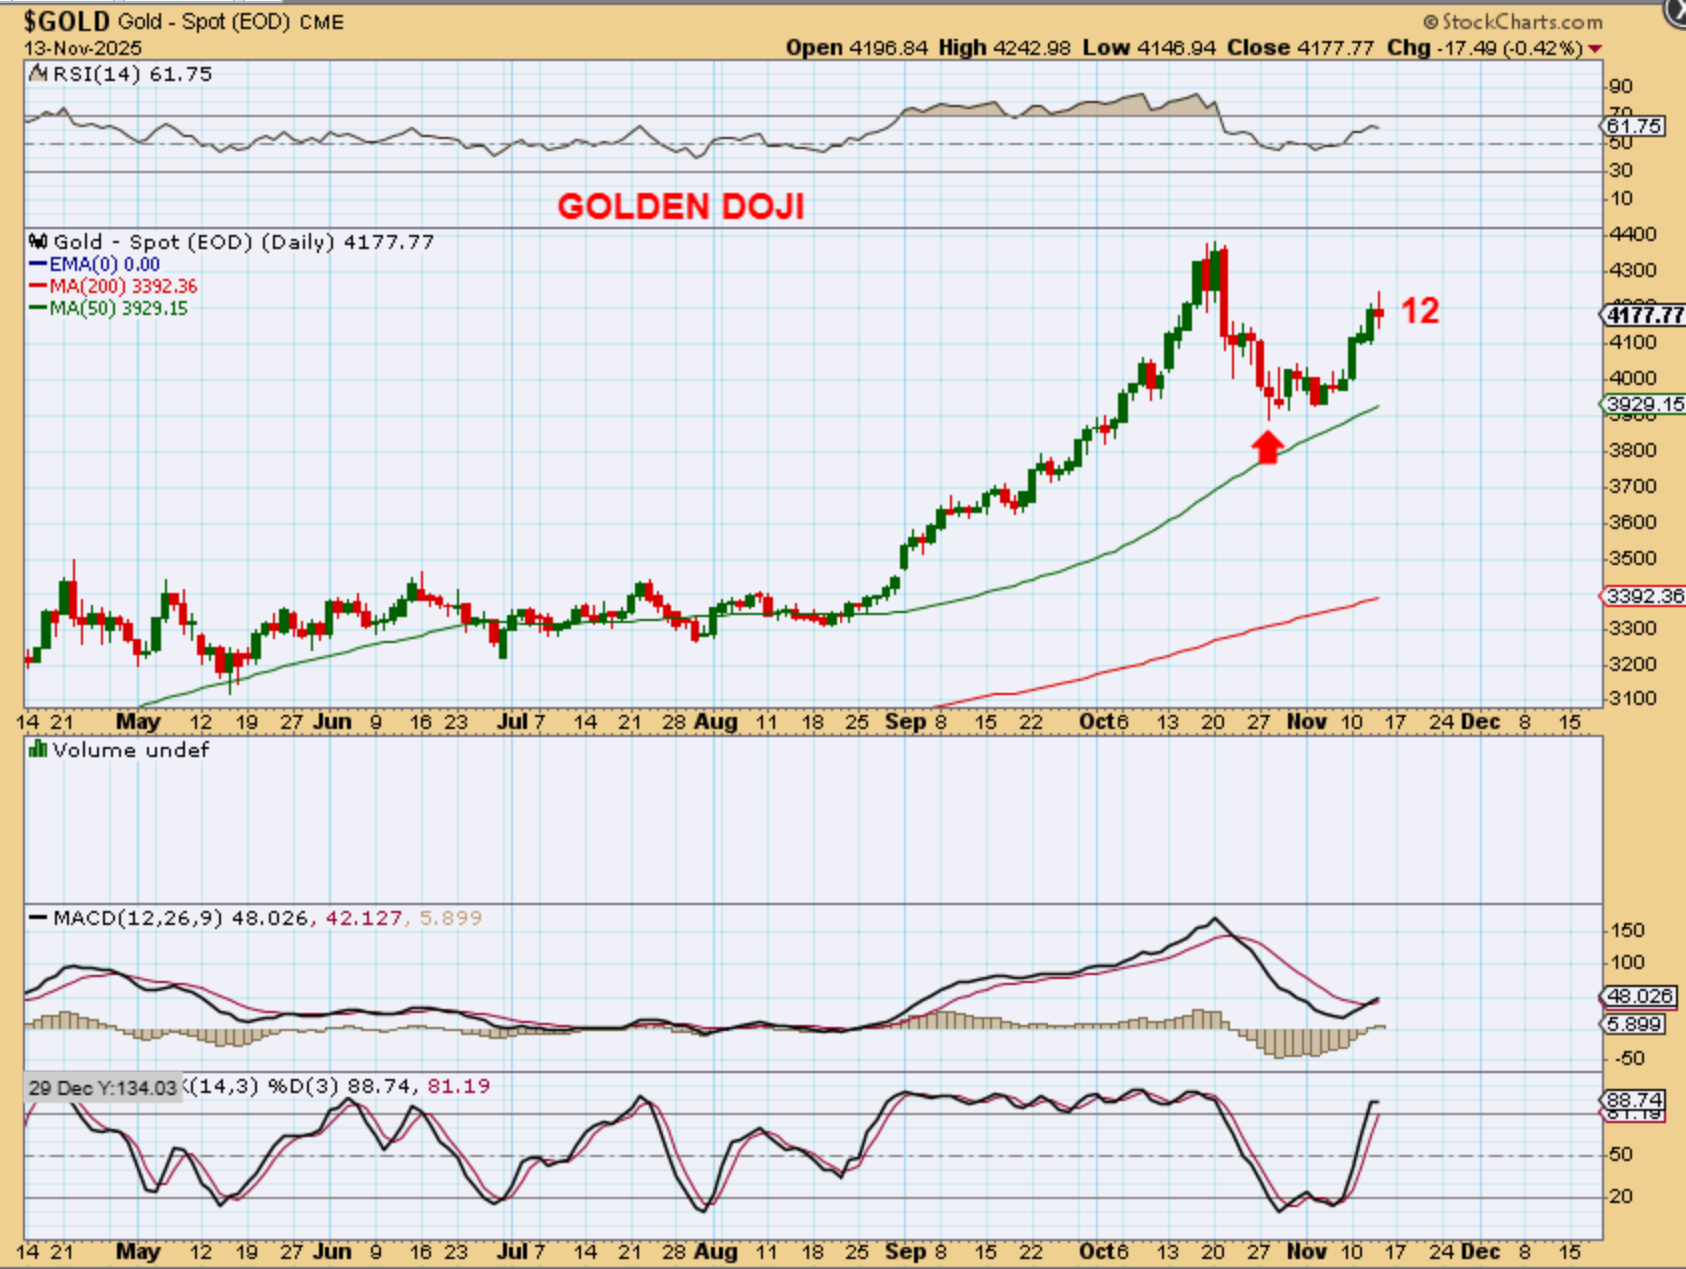
.
Take a look at this:
When Gold sold off, it wasn’t just a gradual sell down. It was a quick sell off from the highs (this is a 5 minute chart) and then a sharp crash of a price drop. Silver did this too. I wondered why this happened and all I could find in any reports was that the Fed may not do a rate cut at the next meeting without complete data due to the Gov’t shutdown. Everything sold off at this time.
.
As a reminder, I wanted to show you this again too:
TAKE A LOOK AT HOW THE NASDAQ BLOW OFF TOP TRADED: After the ‘peak’ developed as Right Translated, it dipped into a dcl (like Gold and Silver now). It rallied almost to the highs, but then put in a doji and sold off to a new low and that was it. The top was in and we started to see new lower highs and new lower lows.
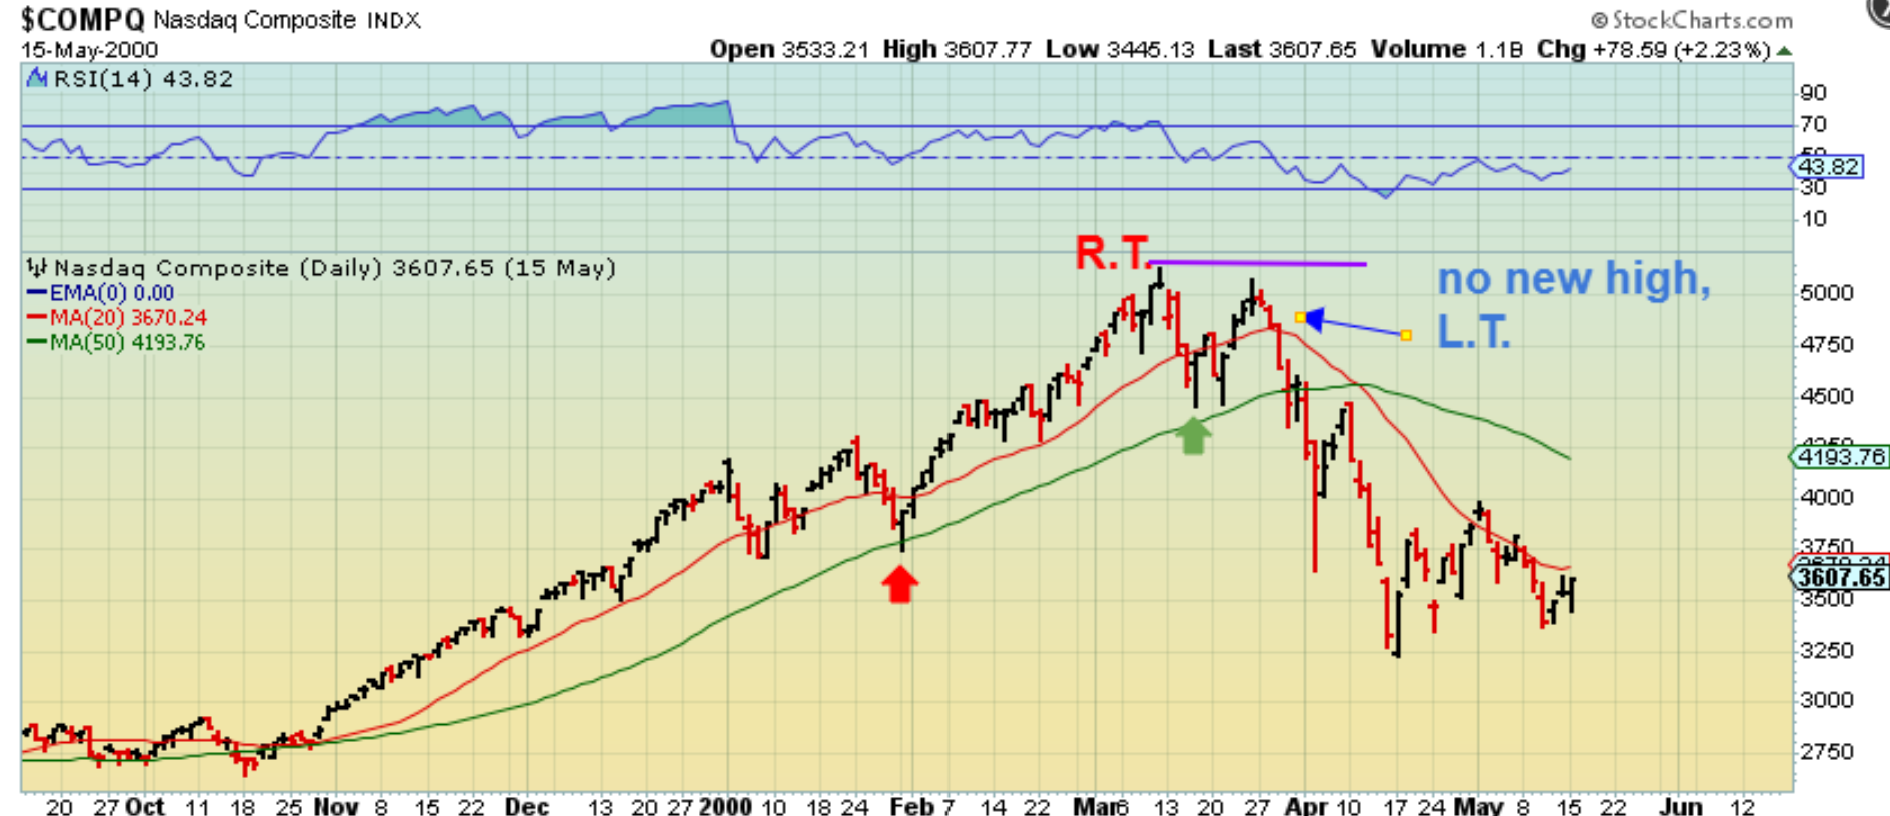
Same Chart: I have been saying all along that this was possible. The NASDAQ didn’t look like a blow off top this close up, but it was. Gold looks very similar, so stay alert, stay frosty. If the selling continues and we lose the dcl, then Gold peaked.
.
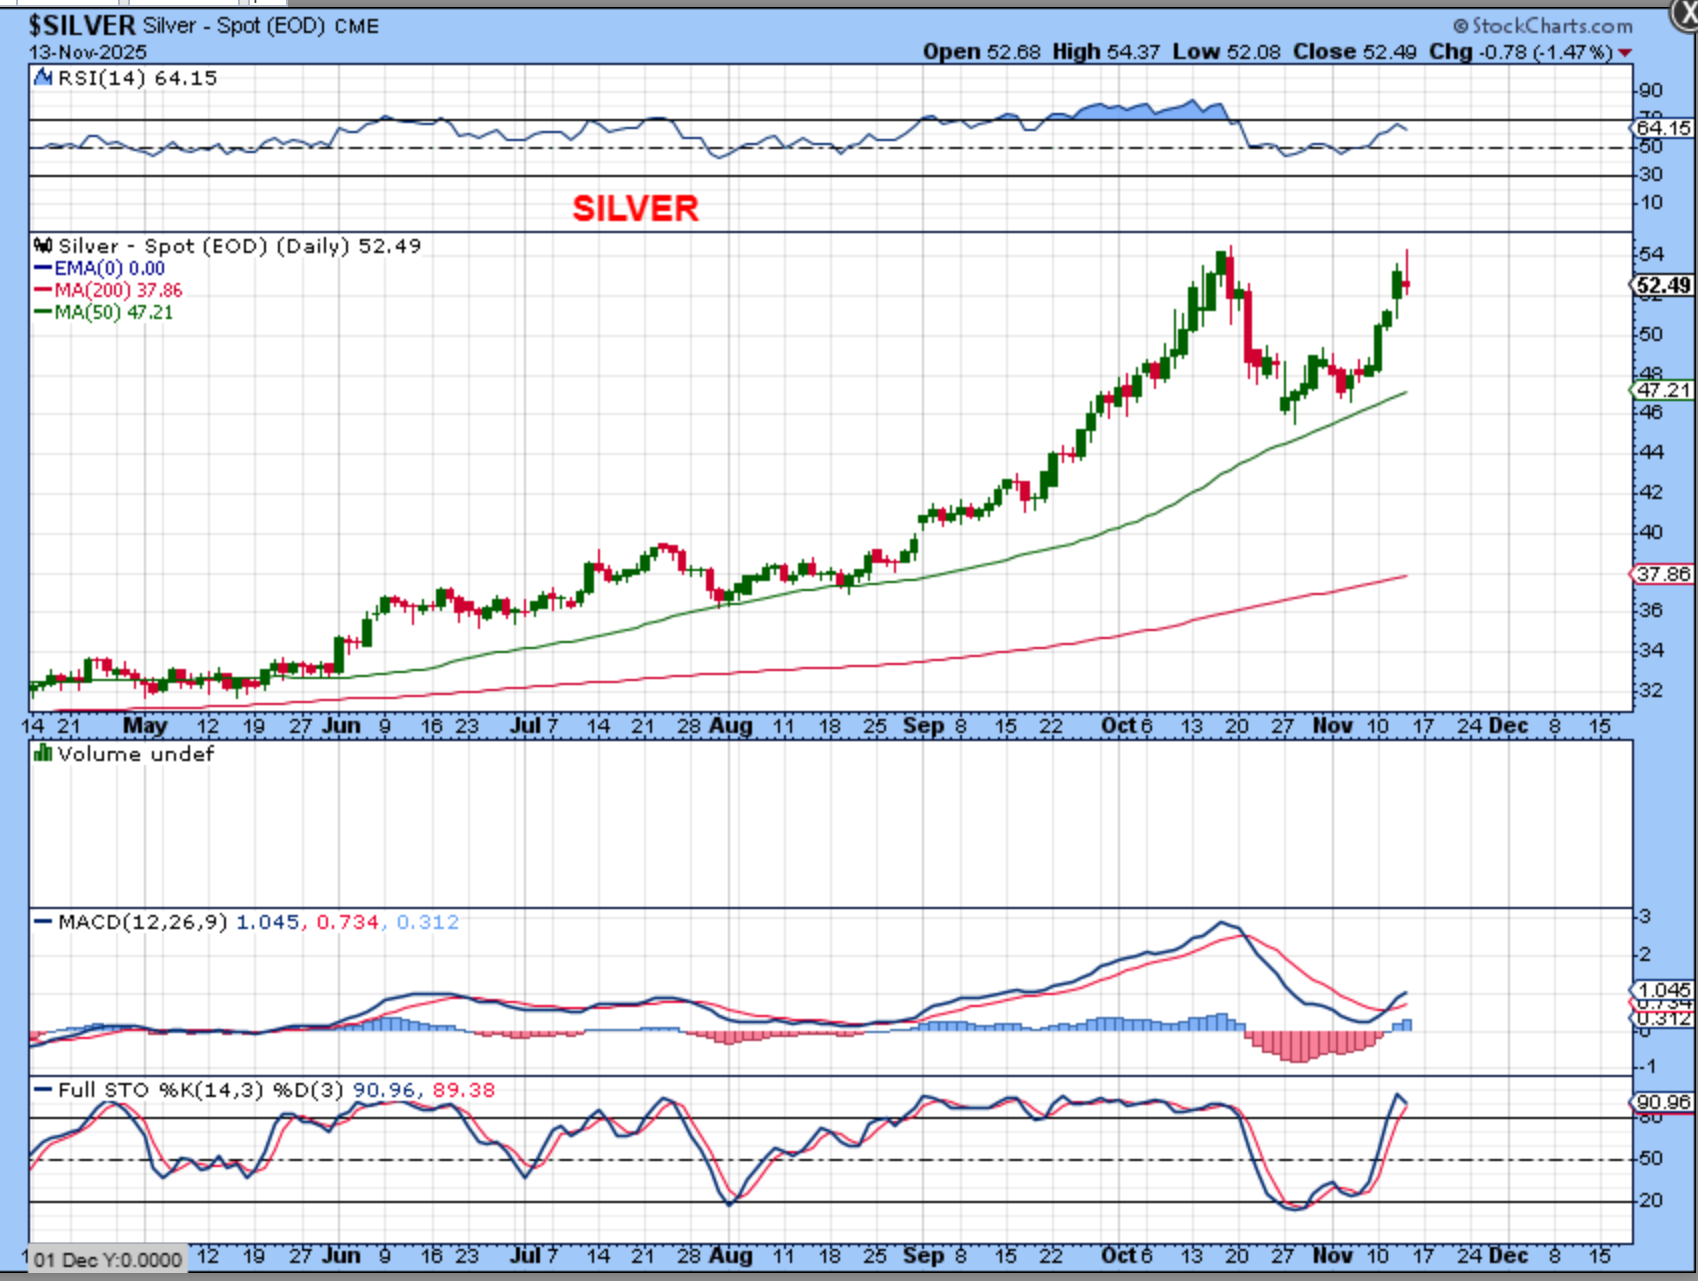
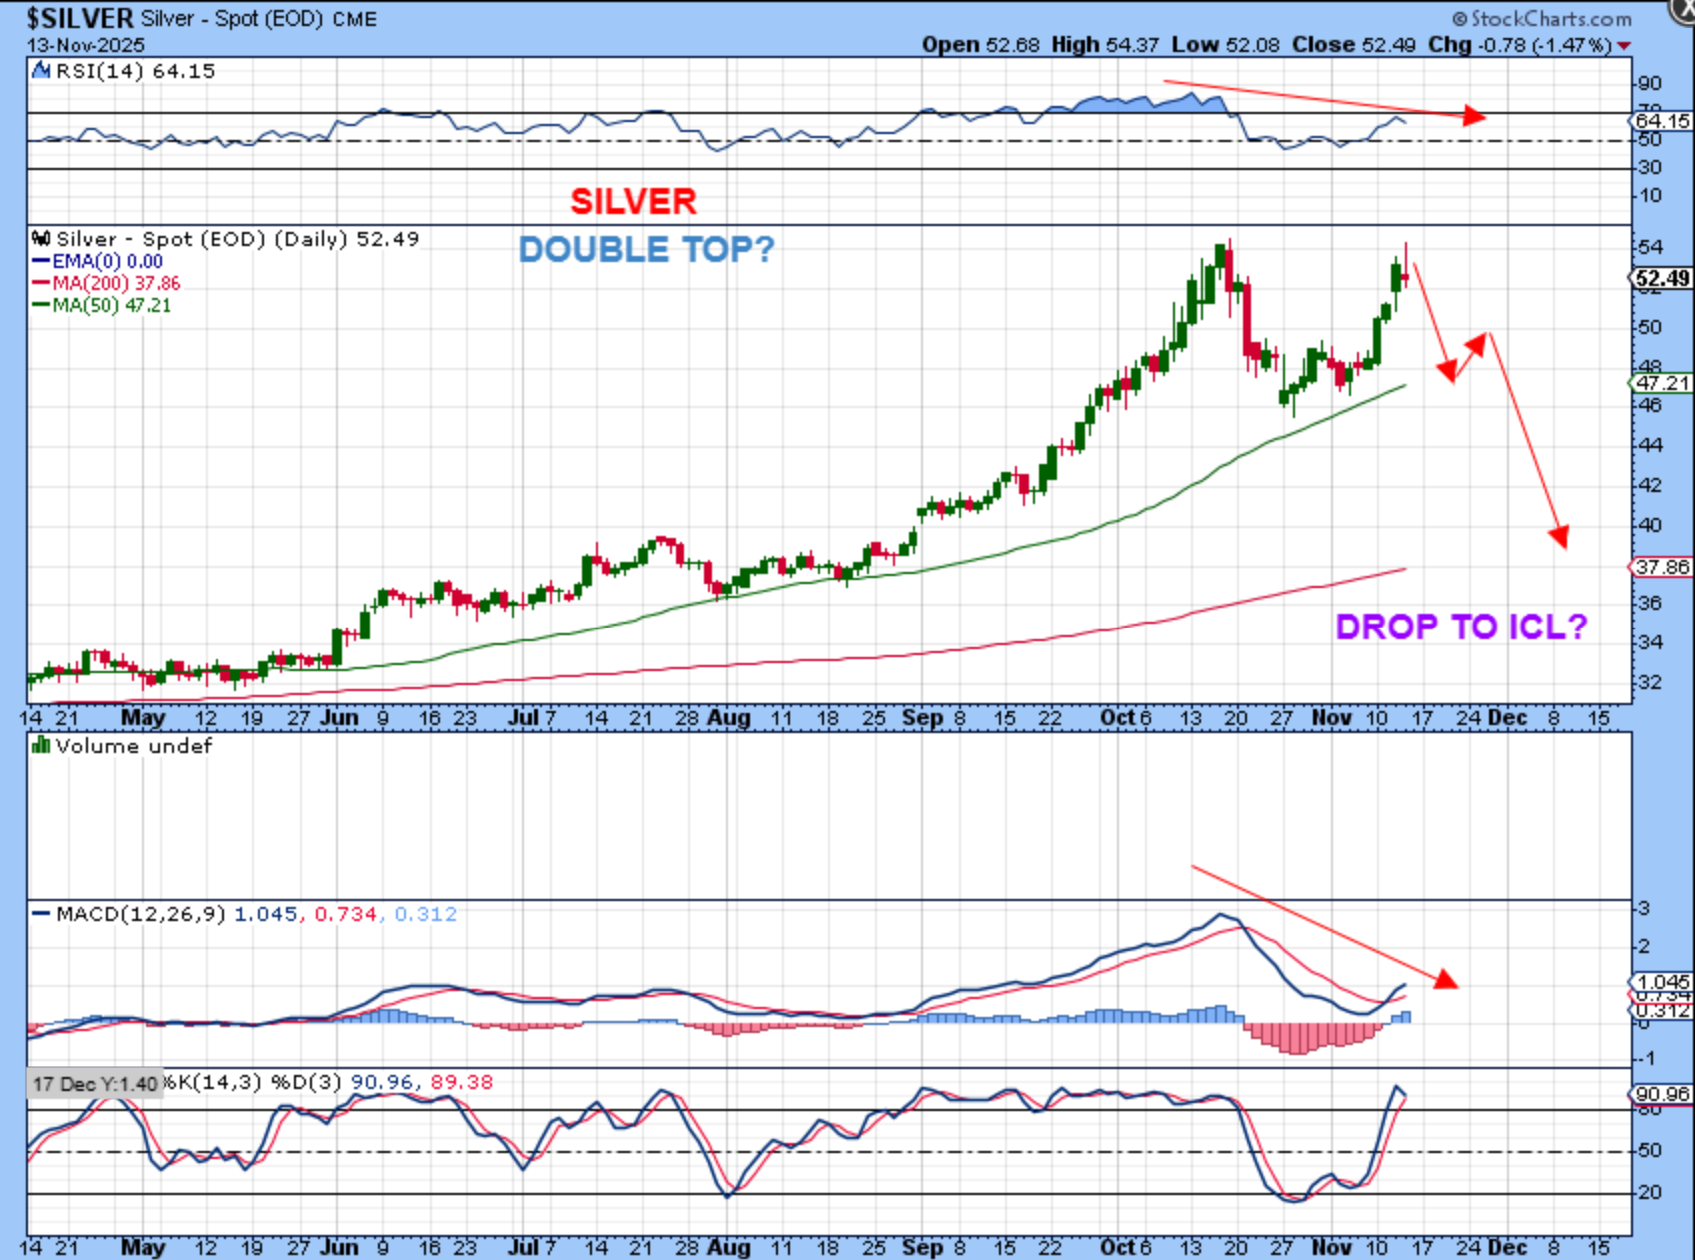
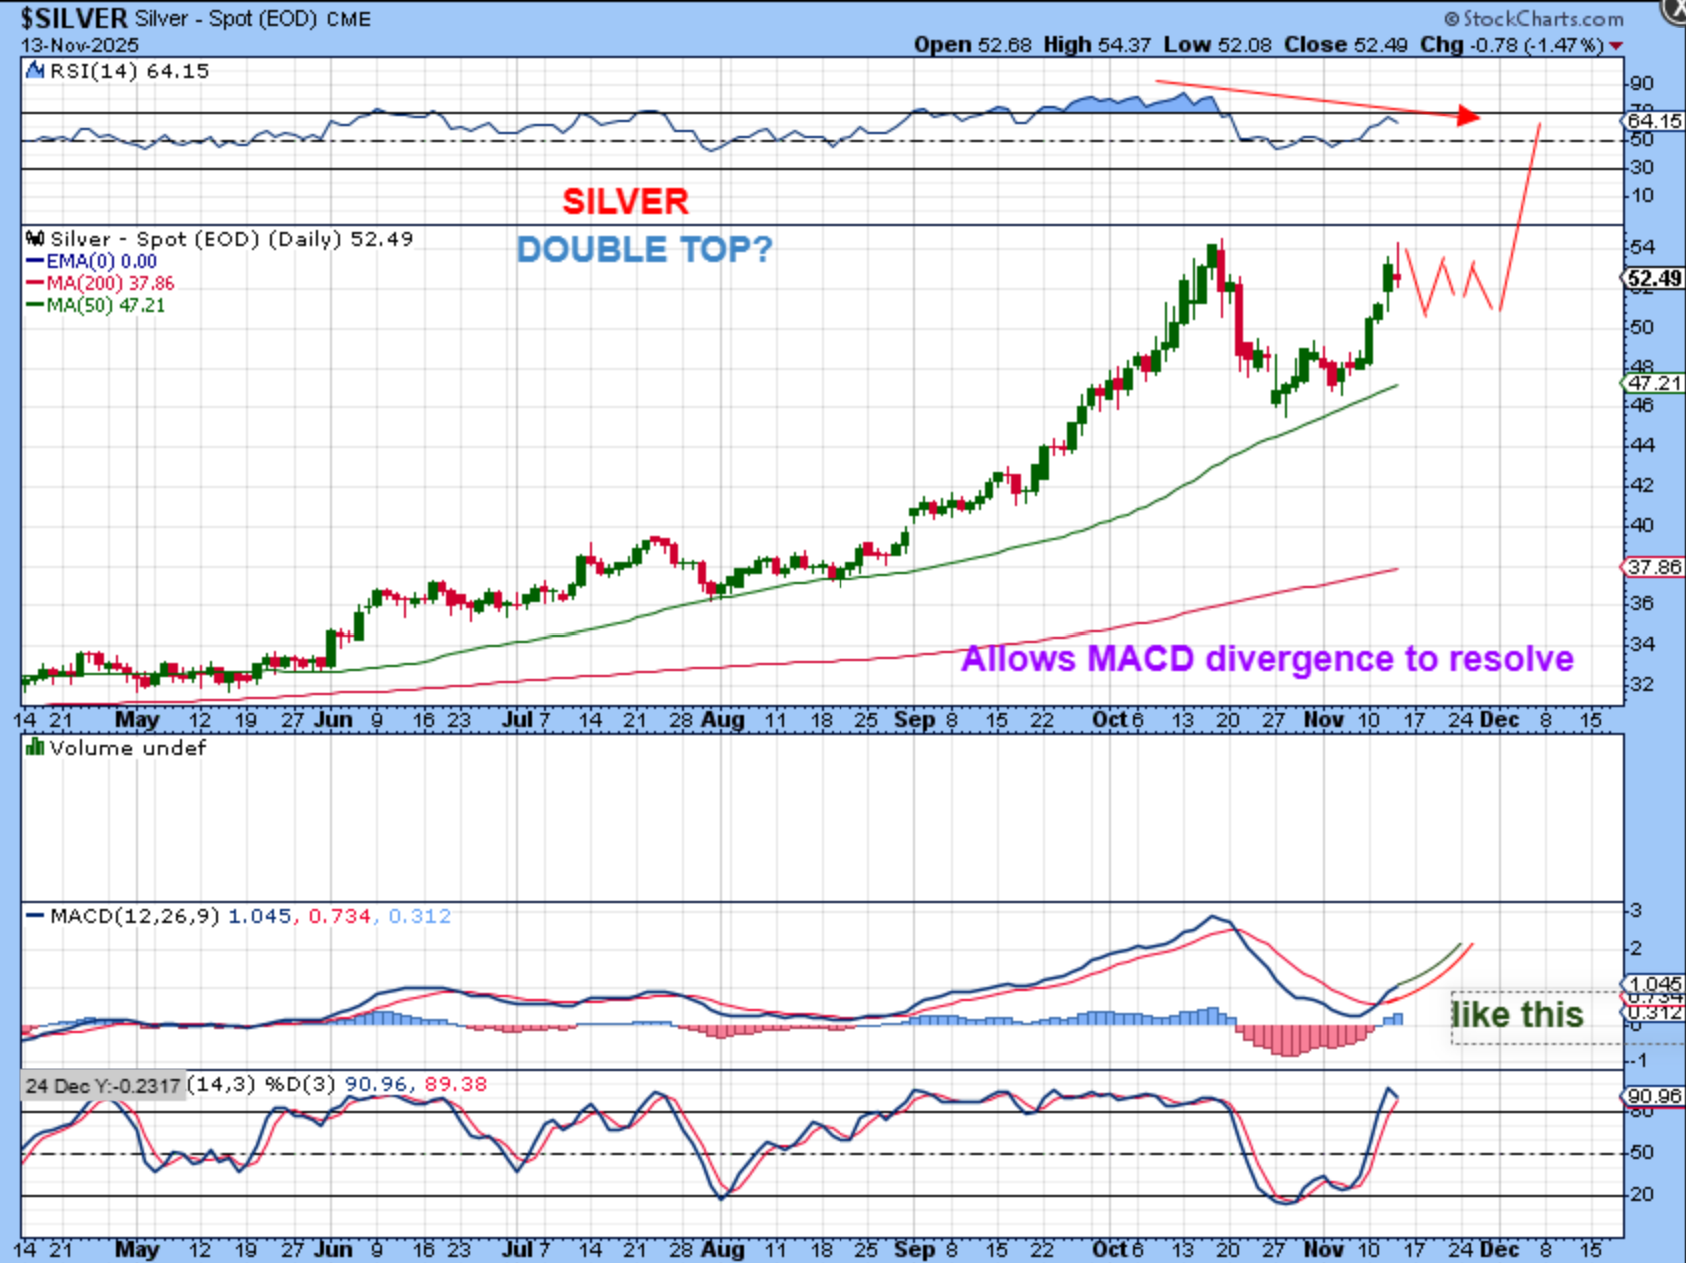
SILVER also sold off and gave us a doji. It rallied pennies from the former highs and then sold off. IS THIS A DOUBLE TOP? It couldn’t hold the highs and sellers stepped in, so it may be ready to drop…
.
We do have divergence at the highs, but that alone isn’t a sell signal, it is a warning though. In this case, SILVER returned to the highs very quickly, so that divergence could mean that it will pull back into an ICL drop, or…
.
SILVER formed a ‘cup’ and divergence is often done away with when price chops sideways. I drew the MACD rising as price chops sideways here. We could see that if it stays strong, but if rumors of no rate cut persist, Precious metals could seek out that ICL too..
.
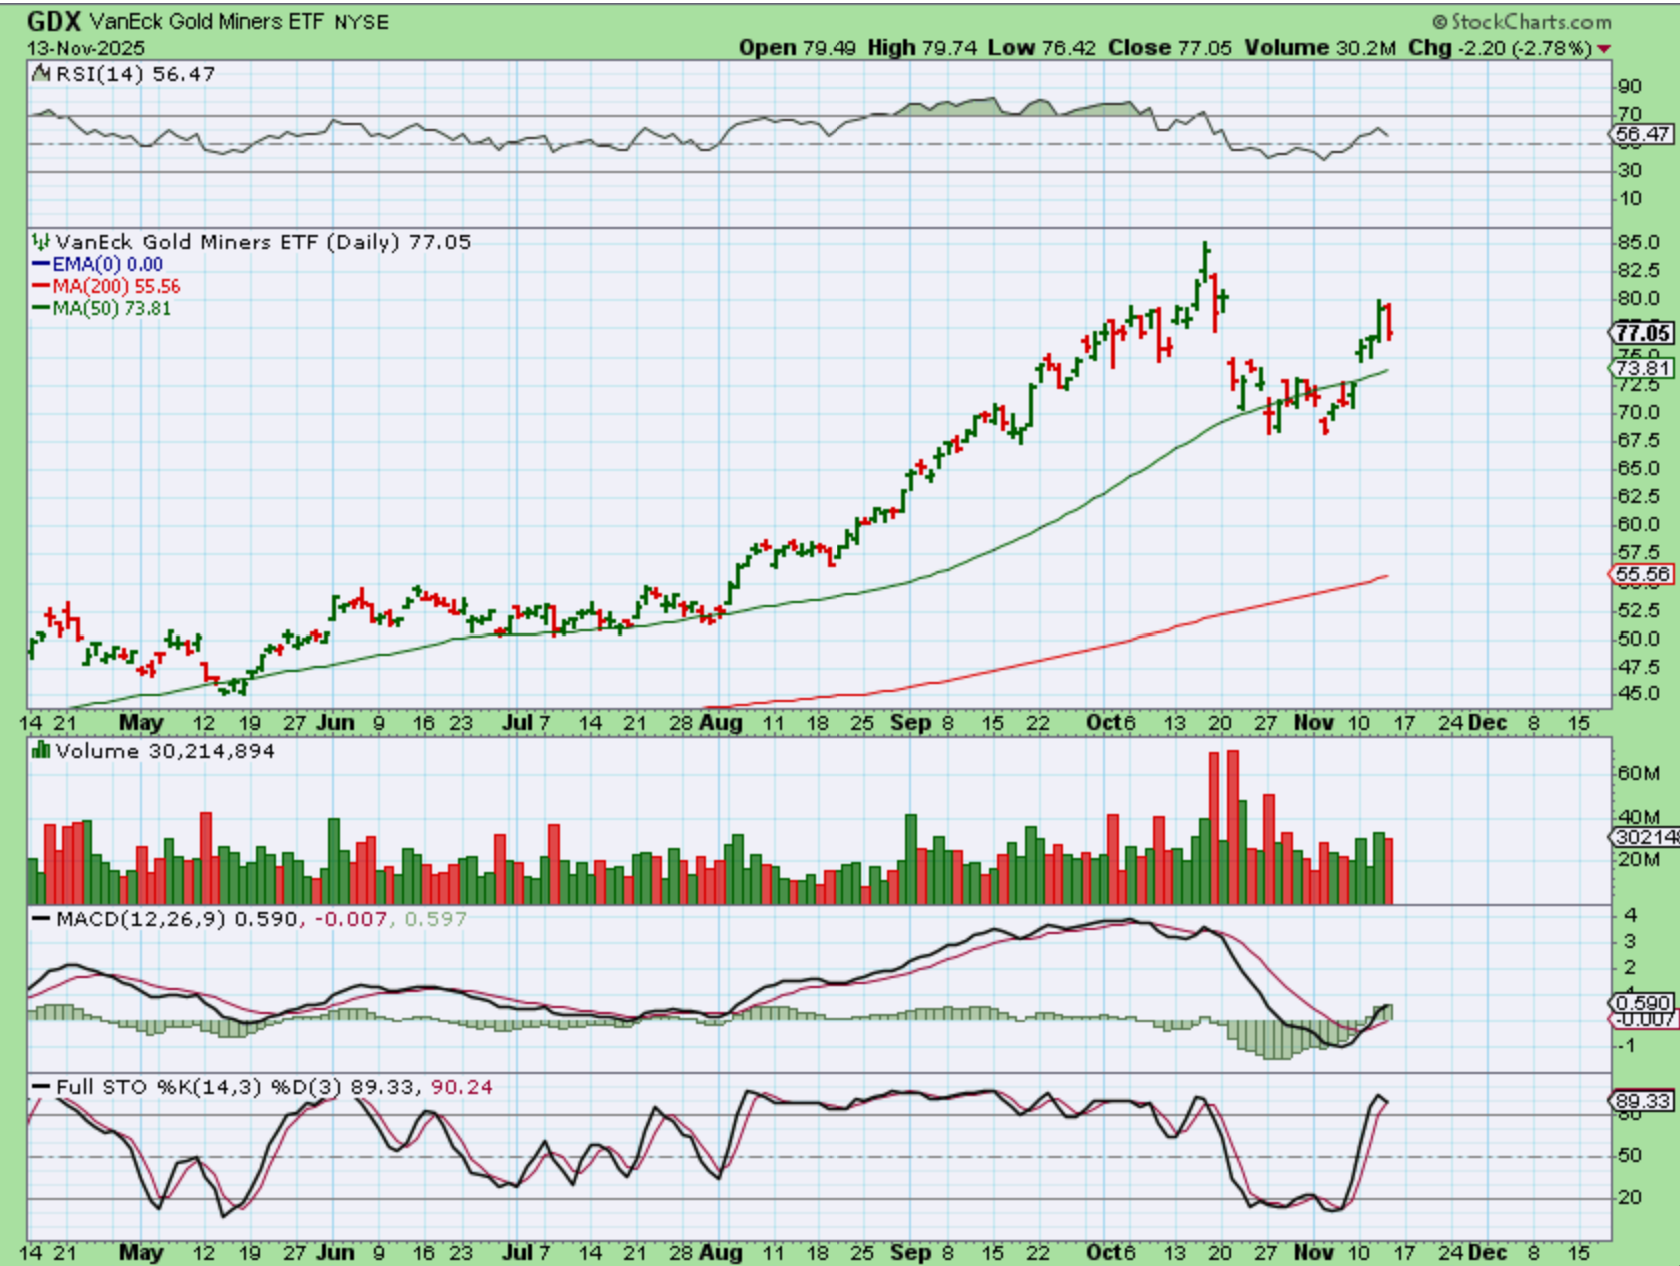
Not much to say here. I’ve been saying that Miners will follow Gold and they did yesterday. Gold and Silver gave us dojis, but the Miners dropped to the lows of the day and most stayed down there, with just a small bounce at the close. GDX will follow Gold, and it did yesterday.
.
The bull was running strong out of the April crash ICL.
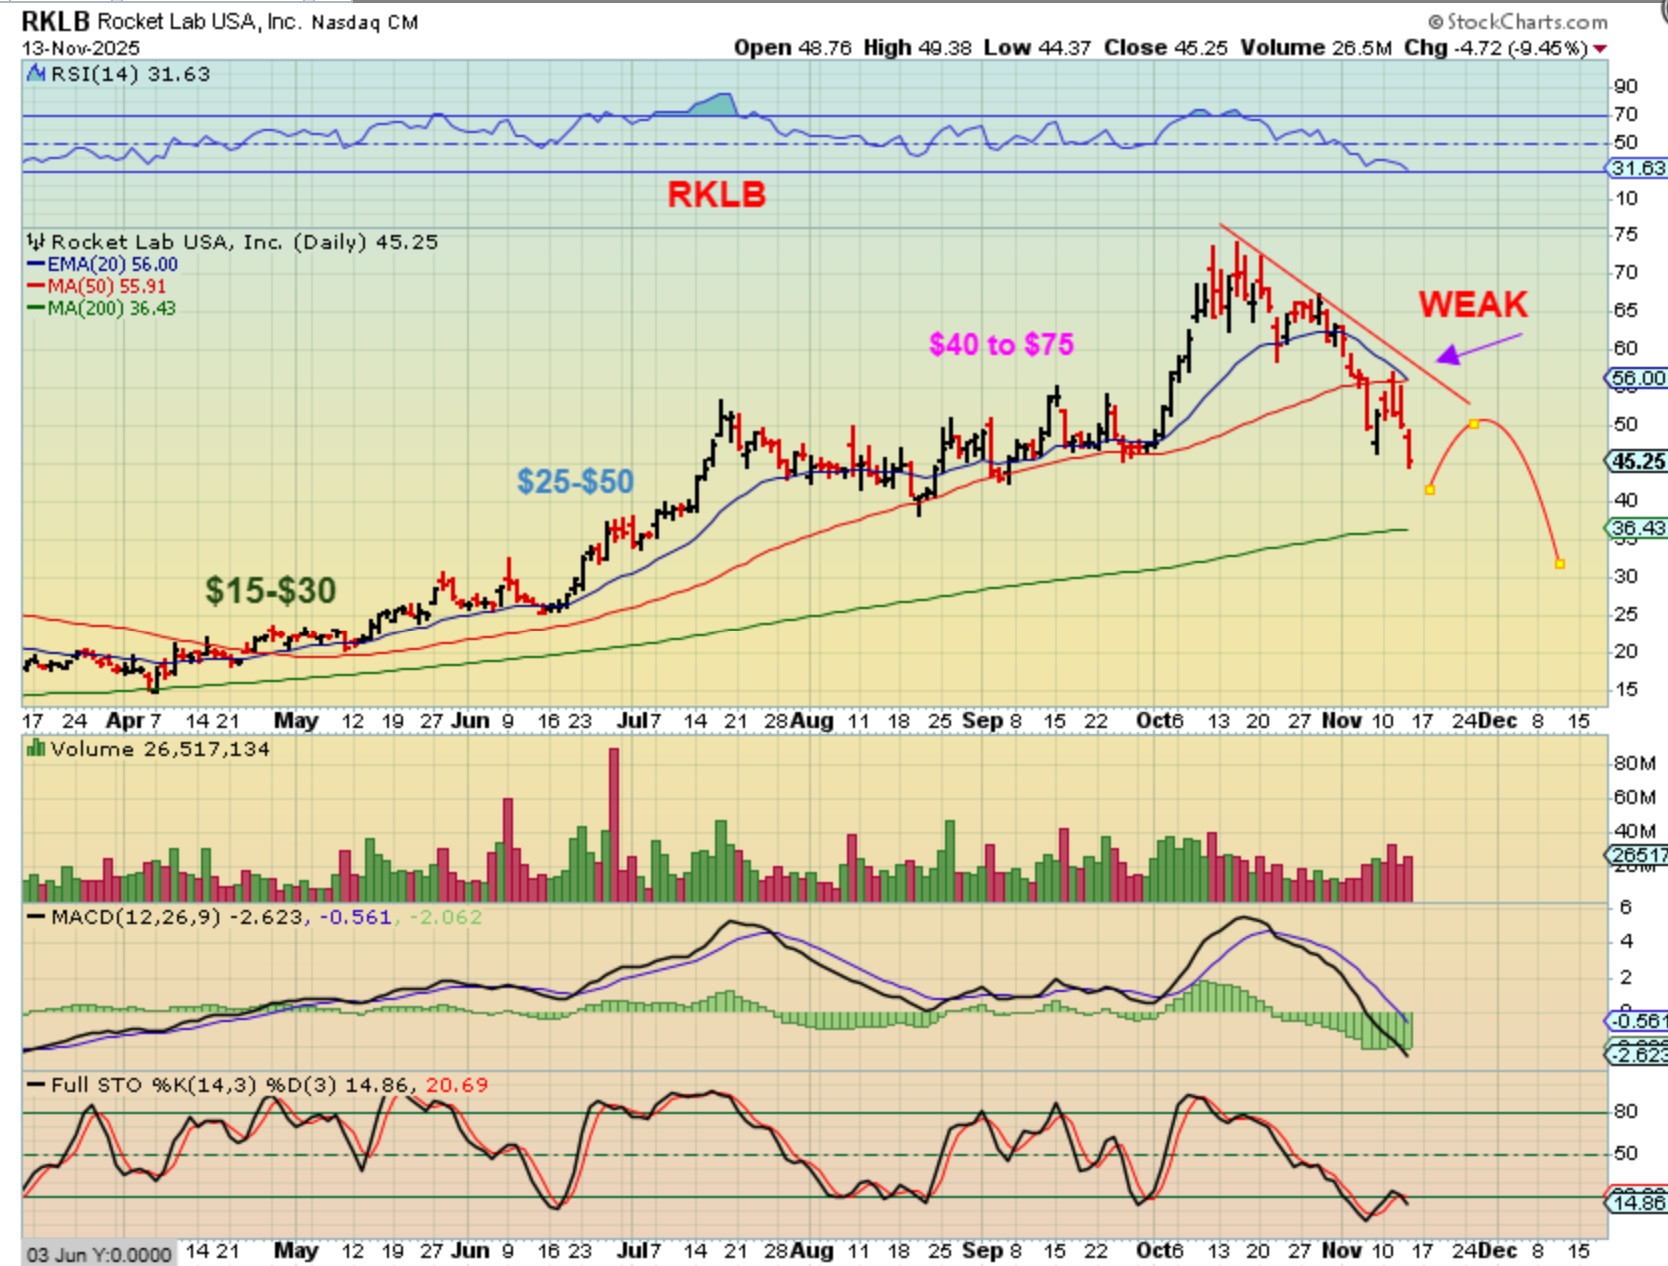
Do you remember when most reports ended with me saying, “The Bulls remain firmly in control’? I cannot say that today. We are on month 7 out of that ICL. Recently I had reports showing how it seemed that ‘Behind the beauty, cracks appear‘ and we are ‘looking for more clues’. Clues of strength or weakness. I have mentioned that In the General Markets, some of my favorite stocks started to drop below the 50sma, ‘AI’ stocks started to lose traction, Quants stocks are dying fast, Energy stocks are weakening, and tech stocks are now looking weak too. In April I mentioned some of my favorite stocks to watch, as buy & Hold. RKLB, PLTR, AAOI, etc were mentioned. They did GREAT, but RKLB is breaking down quickly. AAOI is breaking down. It looks like it’s time to …
.
It looks like it’s time to hold on to these gains, and wait for the next ICL. Active traders may want to try some short ETFs(?) like SQQQ, SOXS, etc or just wait patiently on the sidelines until we get that deeper cleansing sell off. DO I think that we will rally again after an ICL? I do think that we will, but it could lead to a market ‘peak’ and longer consolidation late in 2026. I’ll explain that in the weekend report, but briefly this is what I think we may see. We could get a drop into an ICL next, and this daily cycle seems to have peaked on day 13 now. After a drop A-B-C style, we would then see rate cuts and the markets would rally out of the ICL to new all-time highs. This next bull run could last for months but eventually things will become even more ‘over valued’ and the markets may peak for a longer choppy period in the 2nd half of 2026. We’ll see. We can make good money out of the ICL again (with AI,QUANTS, RKLB, BBAI, PLTR, Energy, etc.), but for now we may be ready for that cleansing drop. Stay Frosty my friends, it may be time to take a break or even try a short after a bounce. Then it will be time to buy heavily at the next ICL. Let’s see what Friday now brings our way. Enjoy your Friday trading.
.
~ALEX
.
FROM YESTERDAYS REPORT:
.
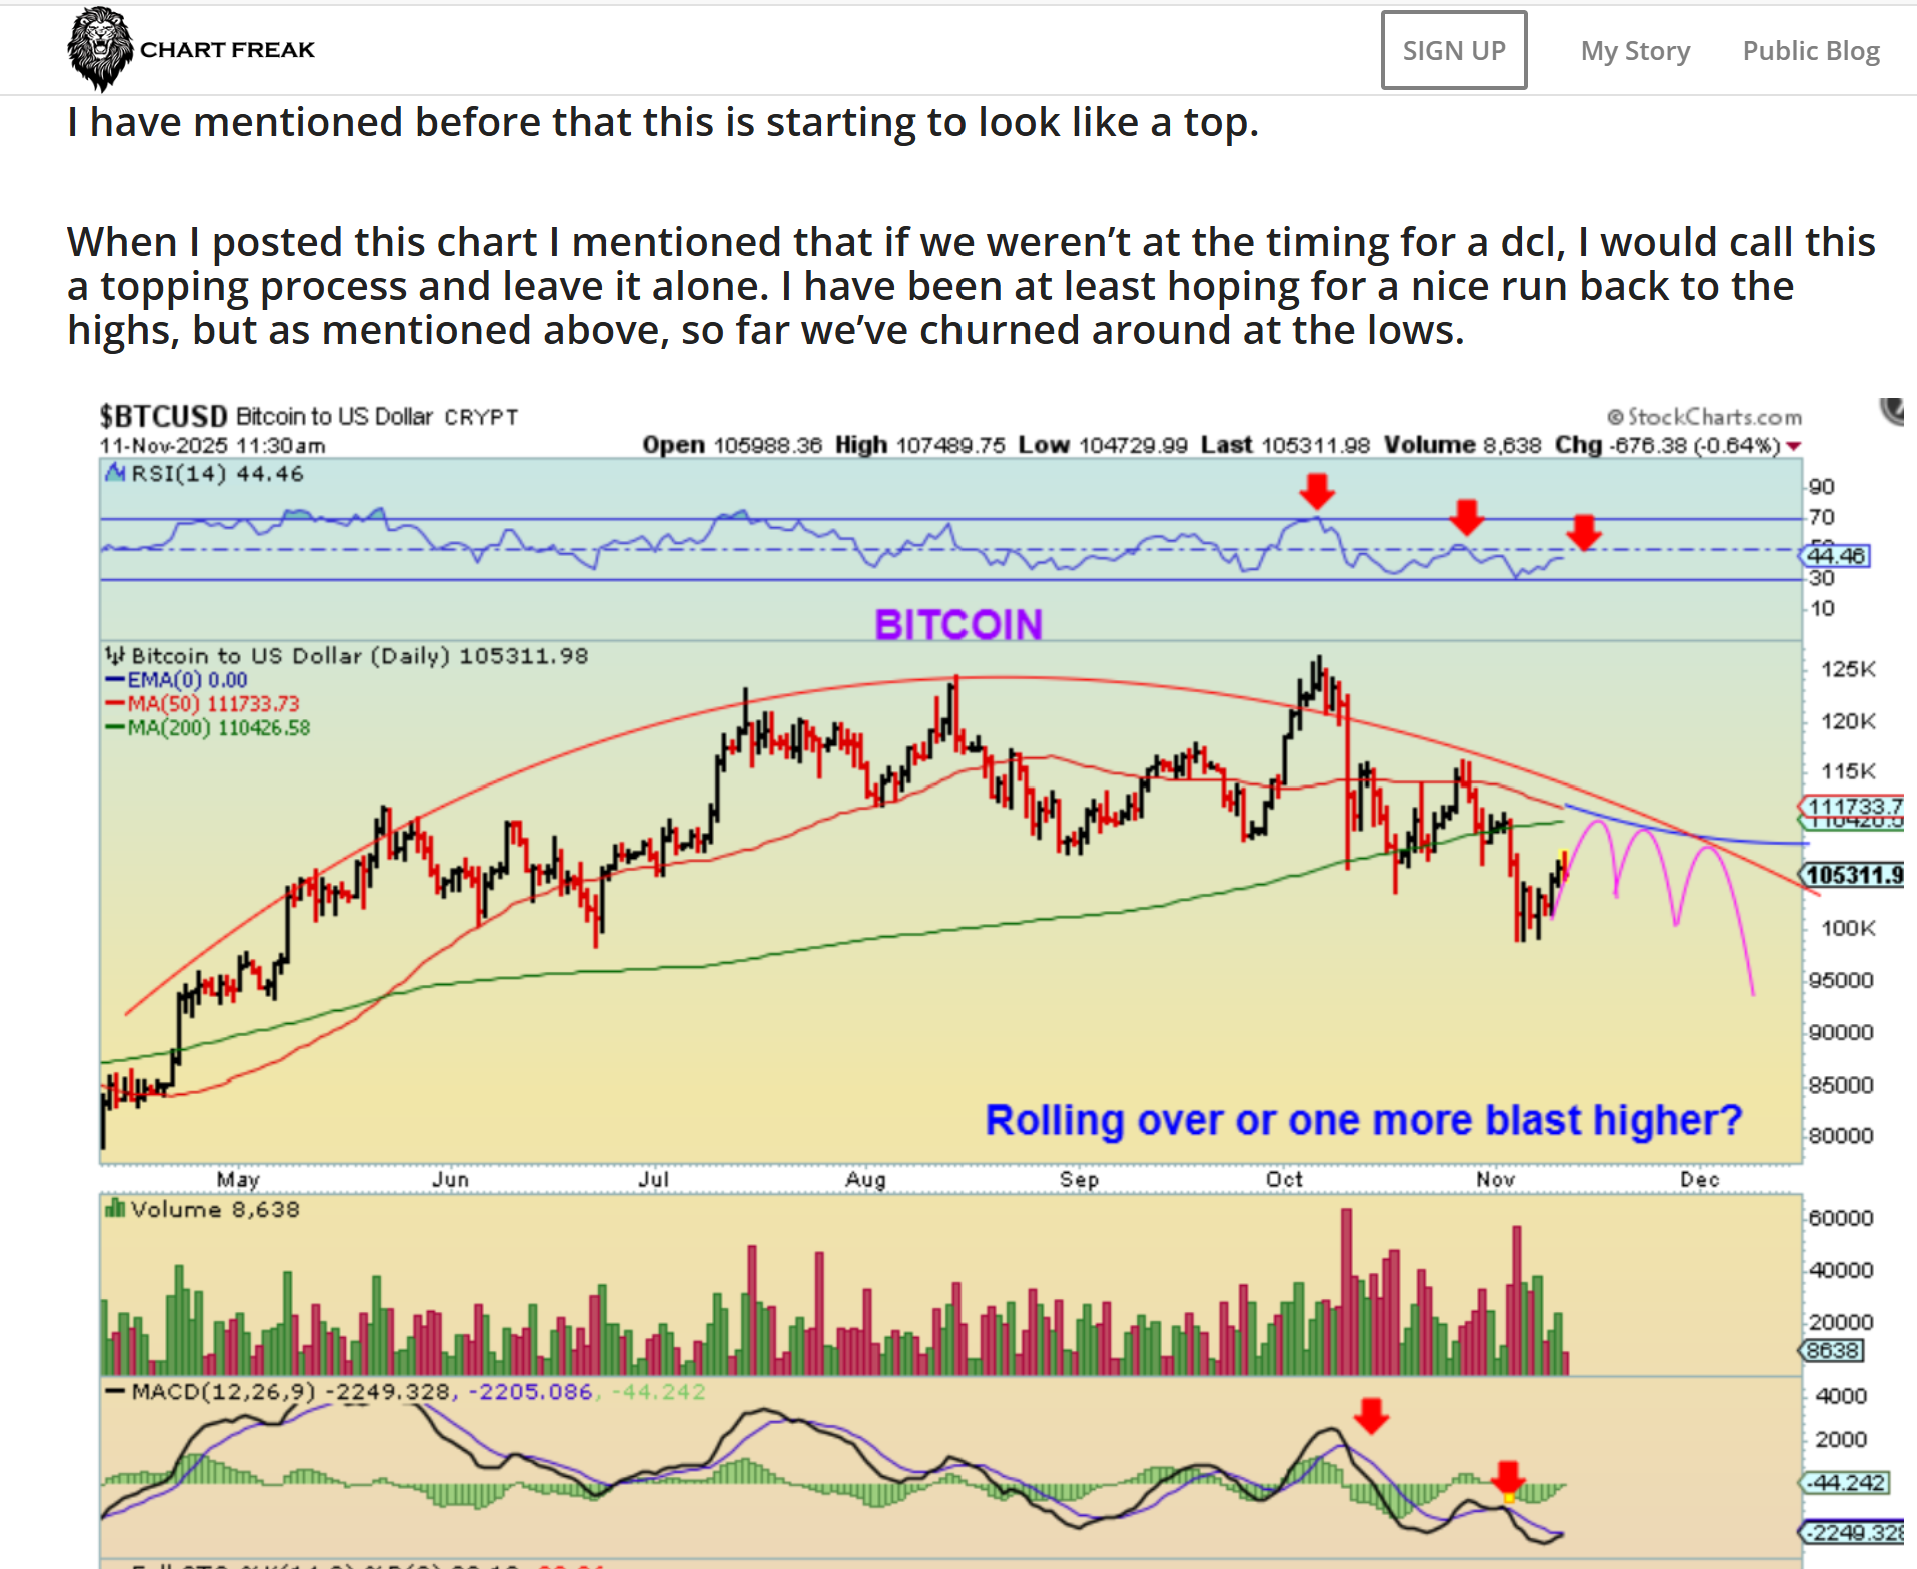
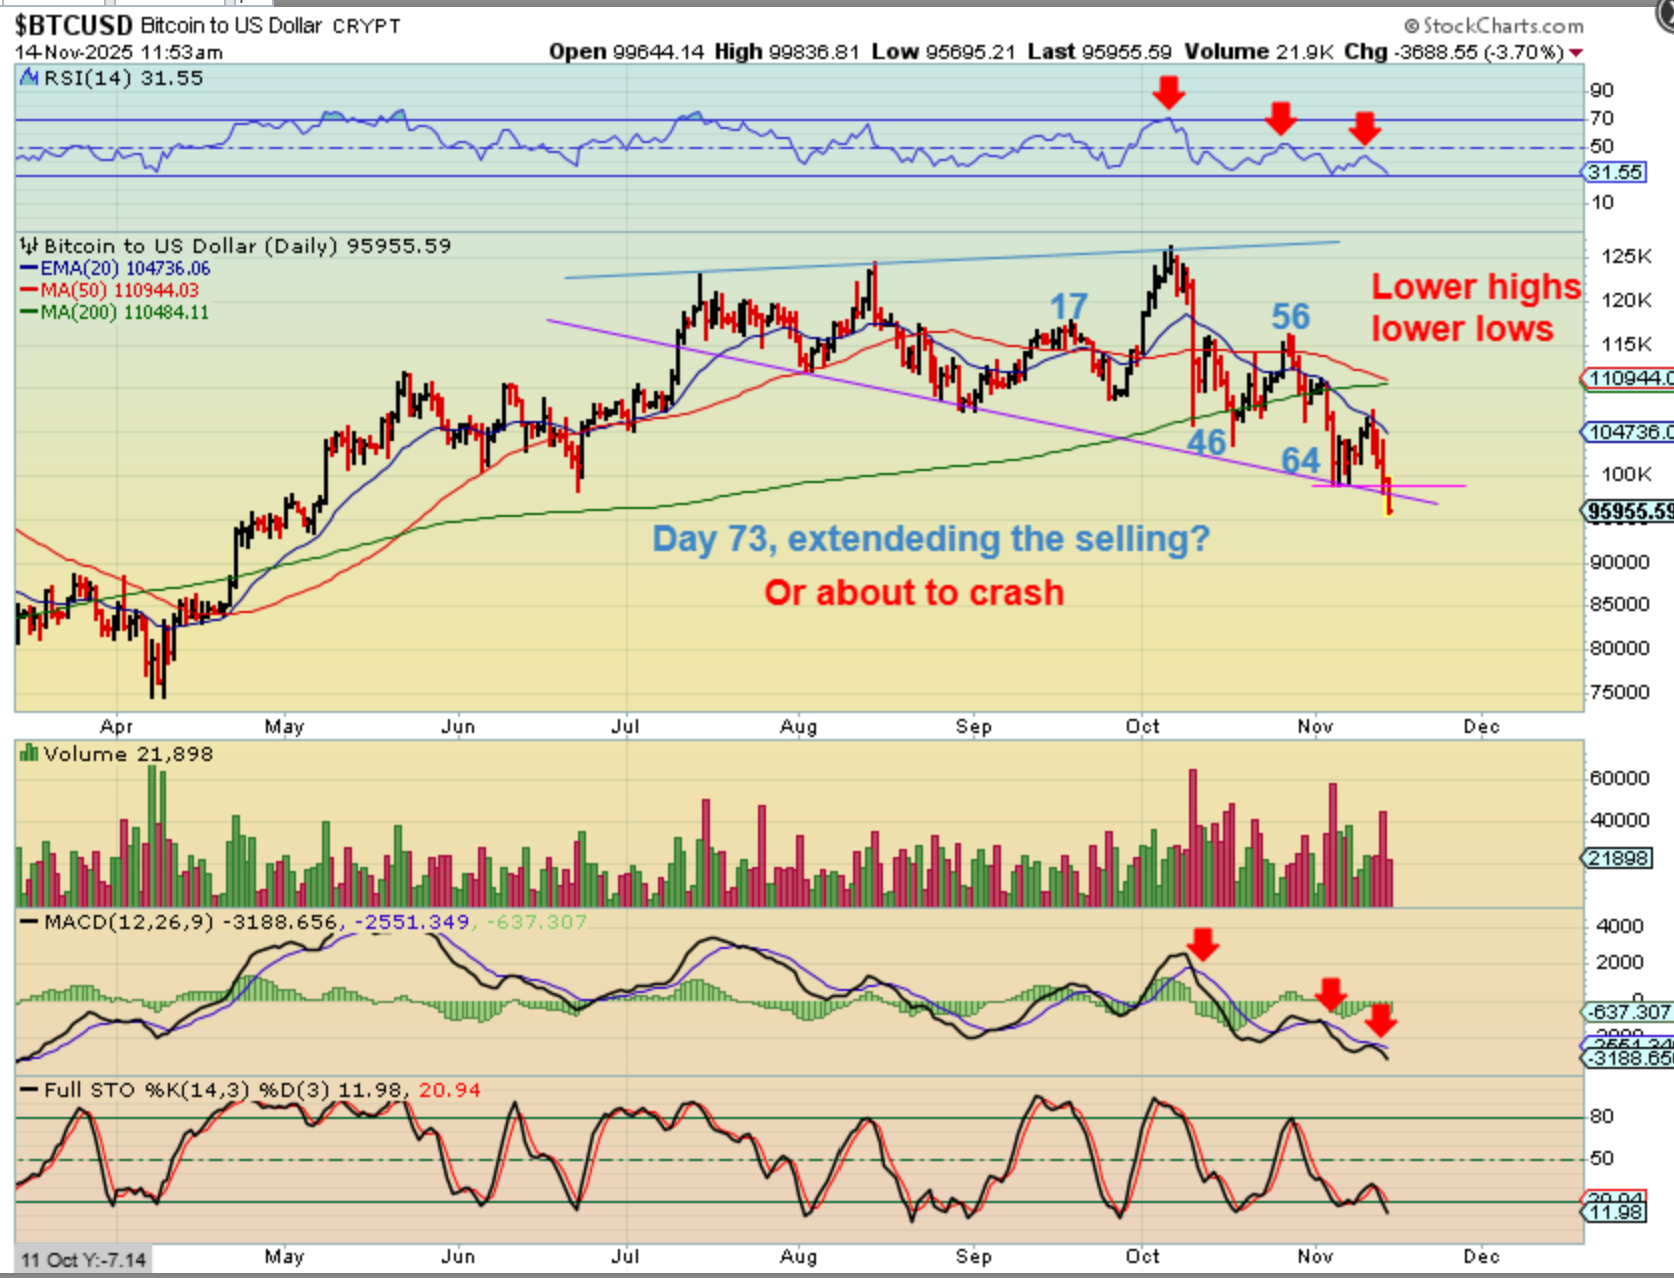
Well, BITCOIN rolled over. The day 64 lows were taken out already!
I had mentioned that with Bitcoin putting in a day 64 low, Crypto stocks were weak, breaking down to new lows day after day. Now Bitcoin has done the same thing.
1. Is it possible that the selling is so persistent that it extended the daily cycle to day 73 and will still bounce? It is possible and bear markets daily cycles do seem to last longer than Bull Markets.
2. Is it possible that this will just crash? Yes it is. It has bounced lower and lower and that can continue.
.
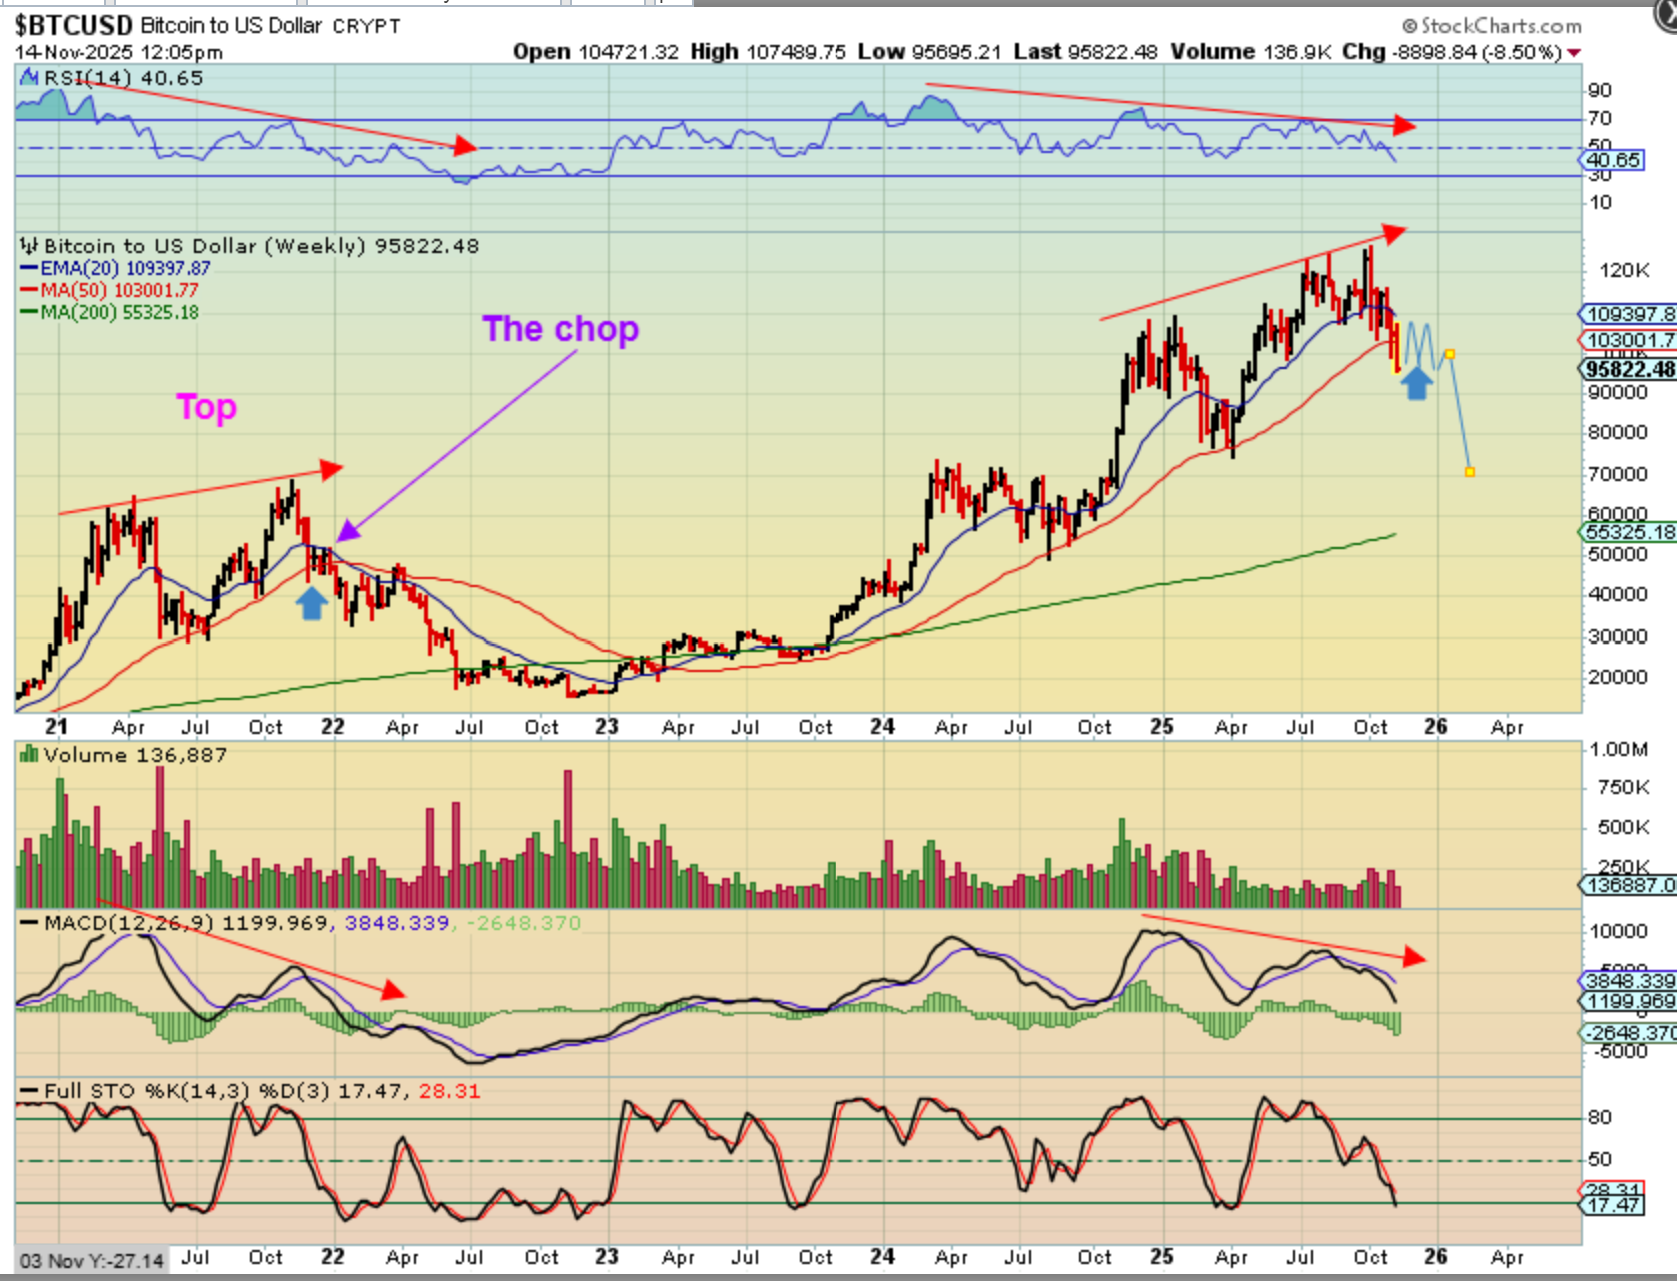
Last week or 2 weeks ago I mentioned that we look to be forming the same kind of a top as the last 4 year cycle. I pointed to a choppy ‘pause’ and said that if we see that, stay out of Cryptos. Well, if we do have an extended daily cycle that bottoms on day 72 or this weekend, then I expect that any bounce will be a week or 2 of sideways chop and then a bigger drop. Look at the red 50 week ma. We haven’t ‘closed’ under that since the lows of 2022 & 2023. This is bearish, even though it can bounce for a while.
.
.
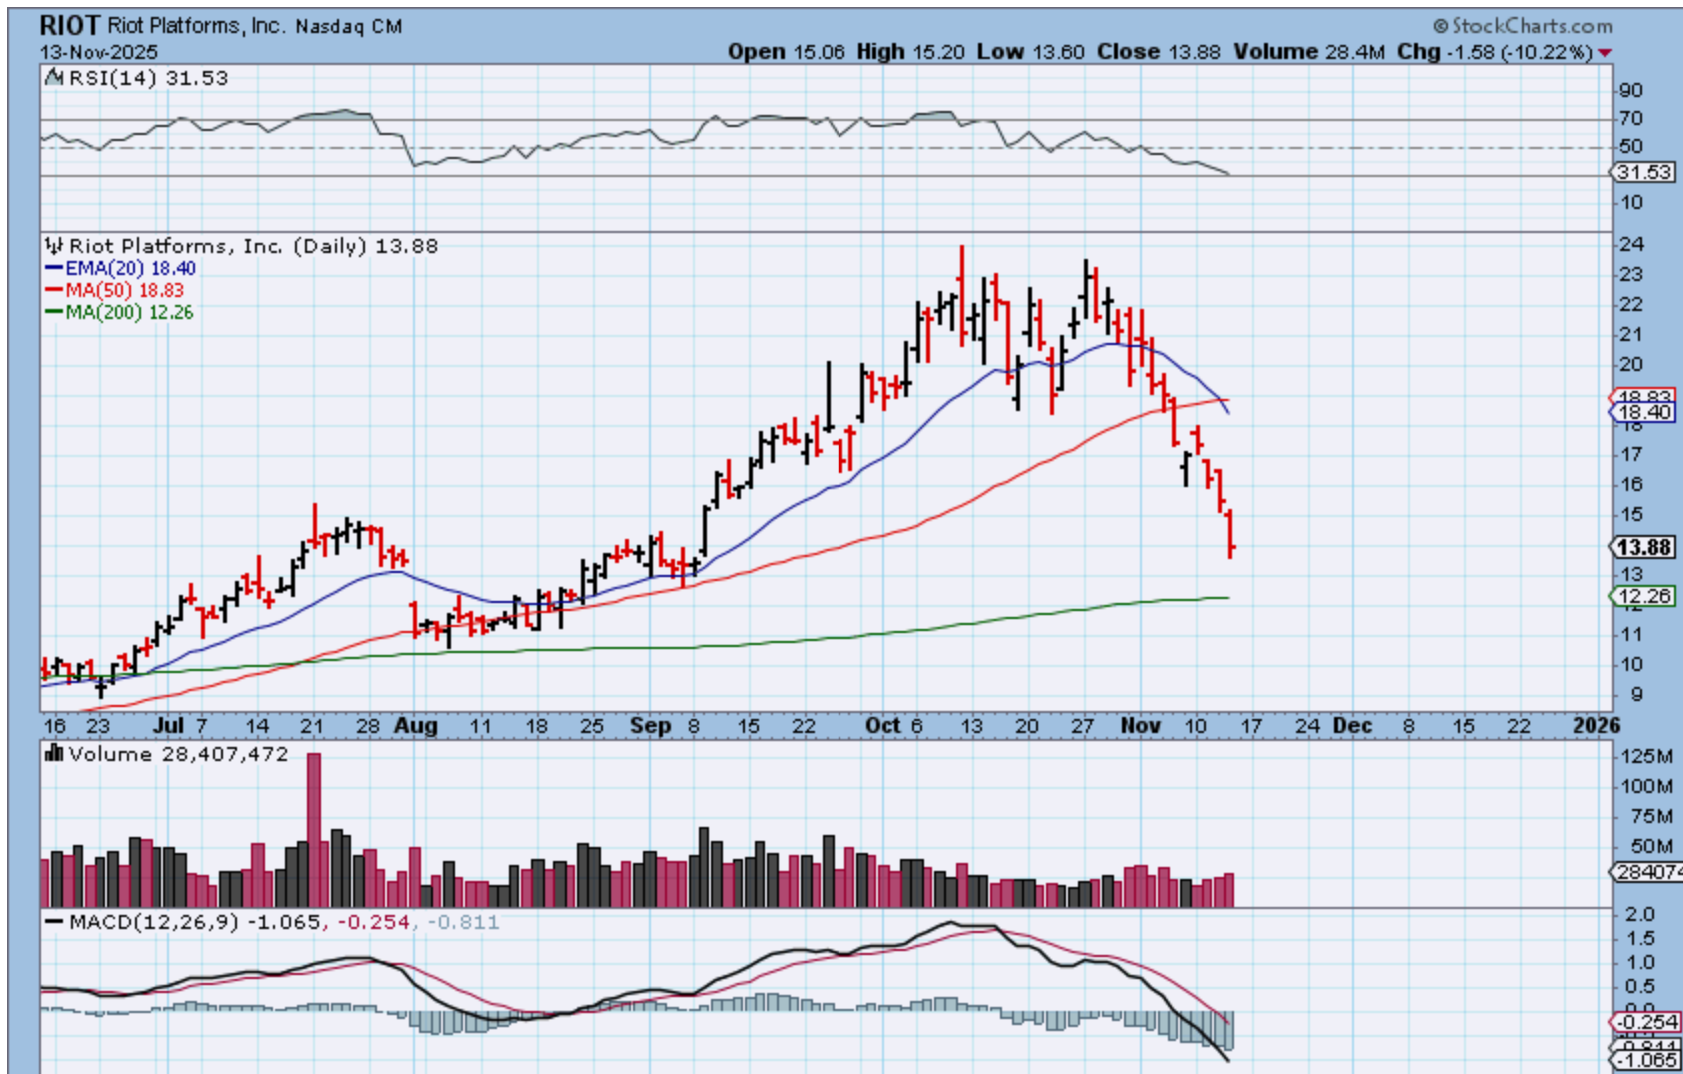
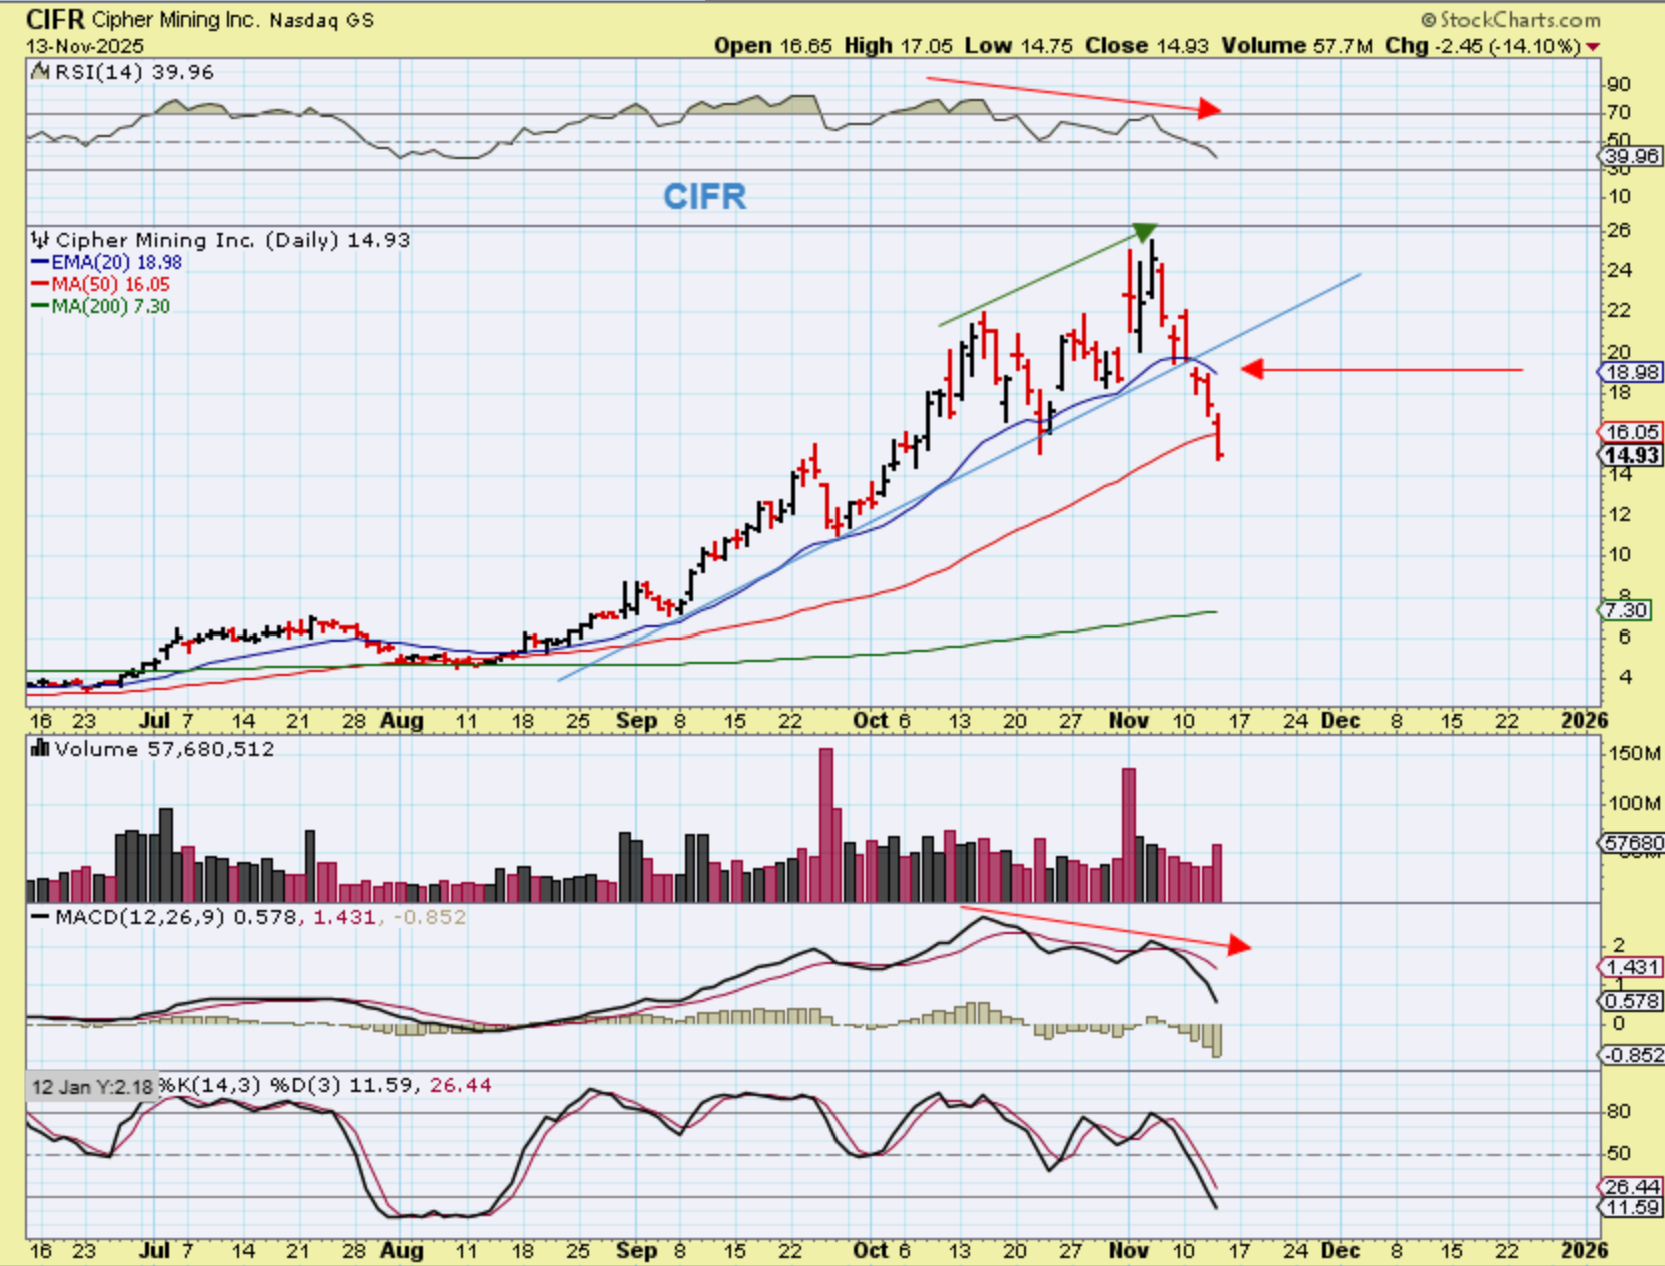
Even the strongest Crypto stocks like CIFR, IREN, WULF, DGXX, etc are failing fast. Last week at the highs, this week crashing.
.
RIOT has been selling off for the last 10 of 11 days! Bitcoin looked like it bottomed on day 64 and held the low for almost 10 days and this was Riot for the last 10 days. A double top with strong divergence.