Thursday November 6th – Clues Along The Way
.
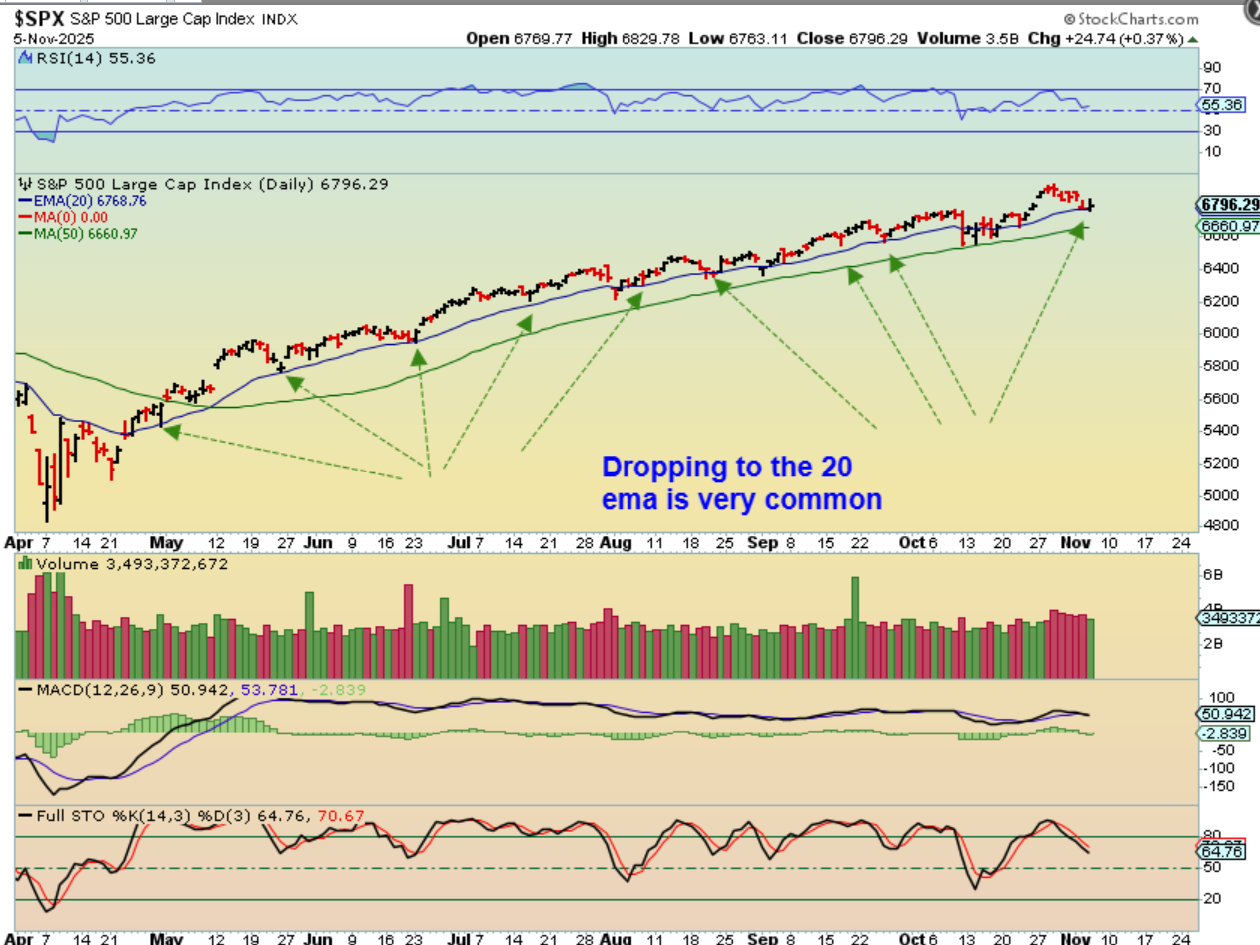
SPX -We have seen dcls and half cycle lows repeatedly on this run out of the ICL. Price has often respected the 20 ema along the way. This is likely the half cycle low that I had mentioned in the last few reports, as price reverses again at the 20ema.
.
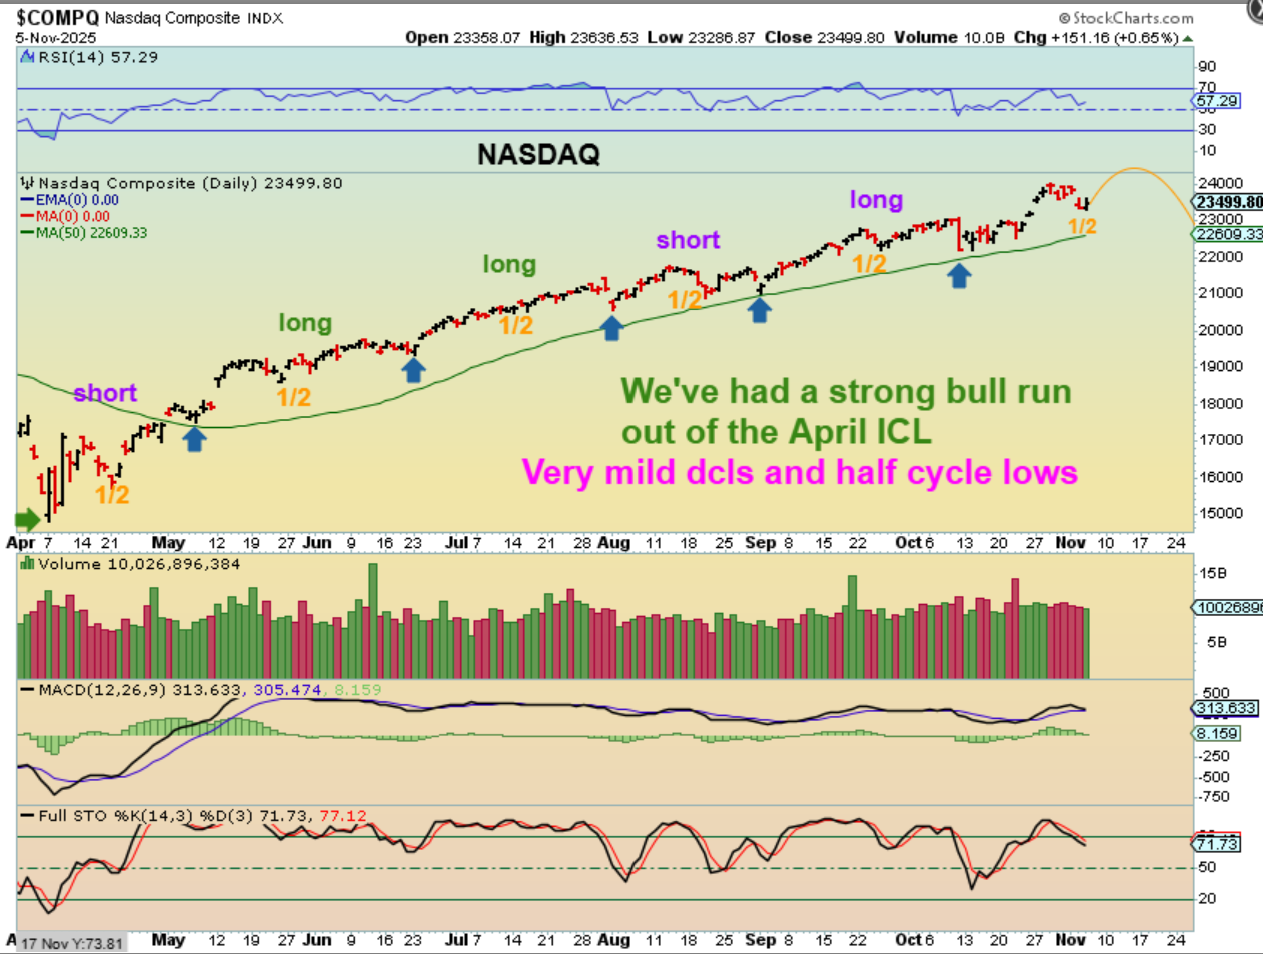
THE NASDAQ has had short and long daily cycles with half cycle lows too, so this should be an area that we see a bounce.
YES, an ICL is due at month 7, but you cannot tell the markets what to do, especially bull markets. We use the cycles as a guide, and they have been working here, the bull run is extending. We HAVE had a few 7 month long intermediate cycle in the past, so until we get a break of support, the bull runs onward and upward. SOME STOCKS like ‘AI’, QUANT, Aviation, etc showed signs of breaking down recently and I pointed that out recently. That may be a ‘Clue’ for us.
.
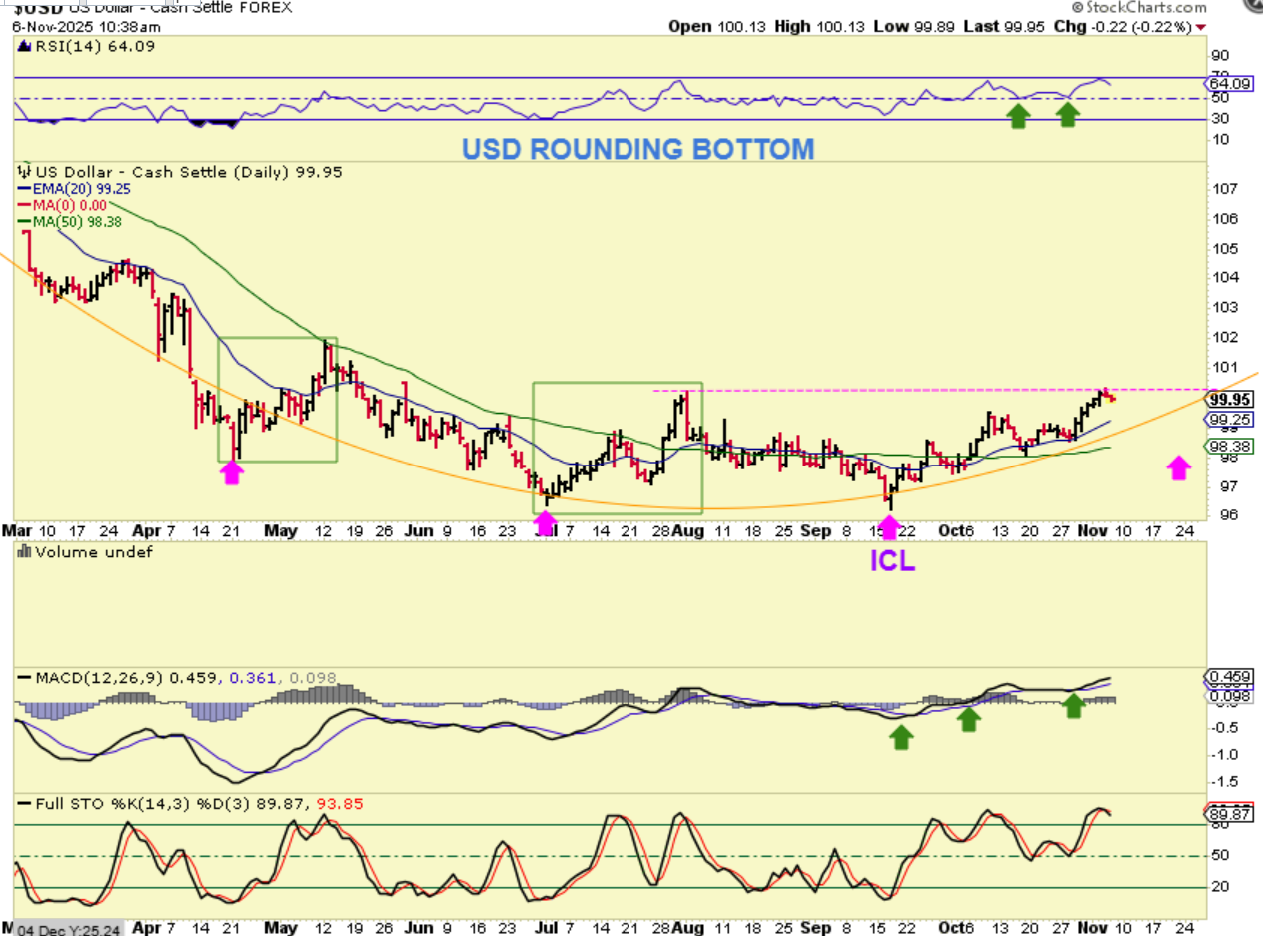
I’ve been looking for ‘Clues’ about the recent USD low ( was it an ICL or not?). I was looking for a sign of new higher high or more lower highs, and I do see a slightly new high for the USD now. So we now have a rounding bottom and should expect higher lows and higher highs going forward.
.
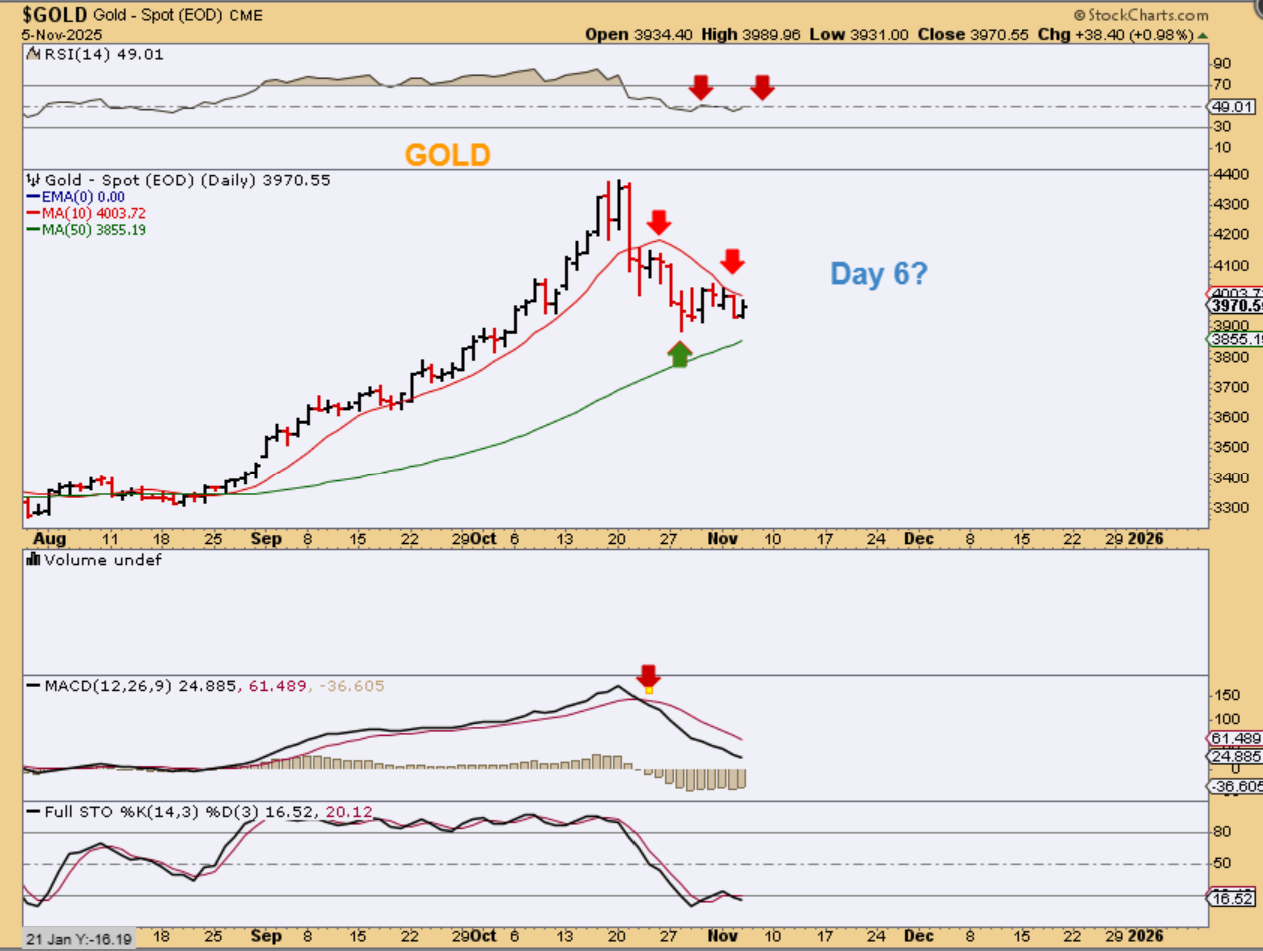
Does this mean that Gold has ‘peaked’ with the USD ICL? That is a ‘clue’ that it is very likely a peak for the short term, after a blow off top type of rally. That does NOT mean that the Gold Bull is dead, it means that we’ll get a drop down into an ICL, and THAT should be a GREAT BUYING OPPORTUNITY for the next rally higher.
.
GOLD currently has an a-b-c dip and that could be the dcl at the 34 sma. We are on day 6 and so far I’m not seeing a curl up on the MACD. That can be a clue that indicates that as gold moves higher toward prior highs, we will see divergence this time.

.
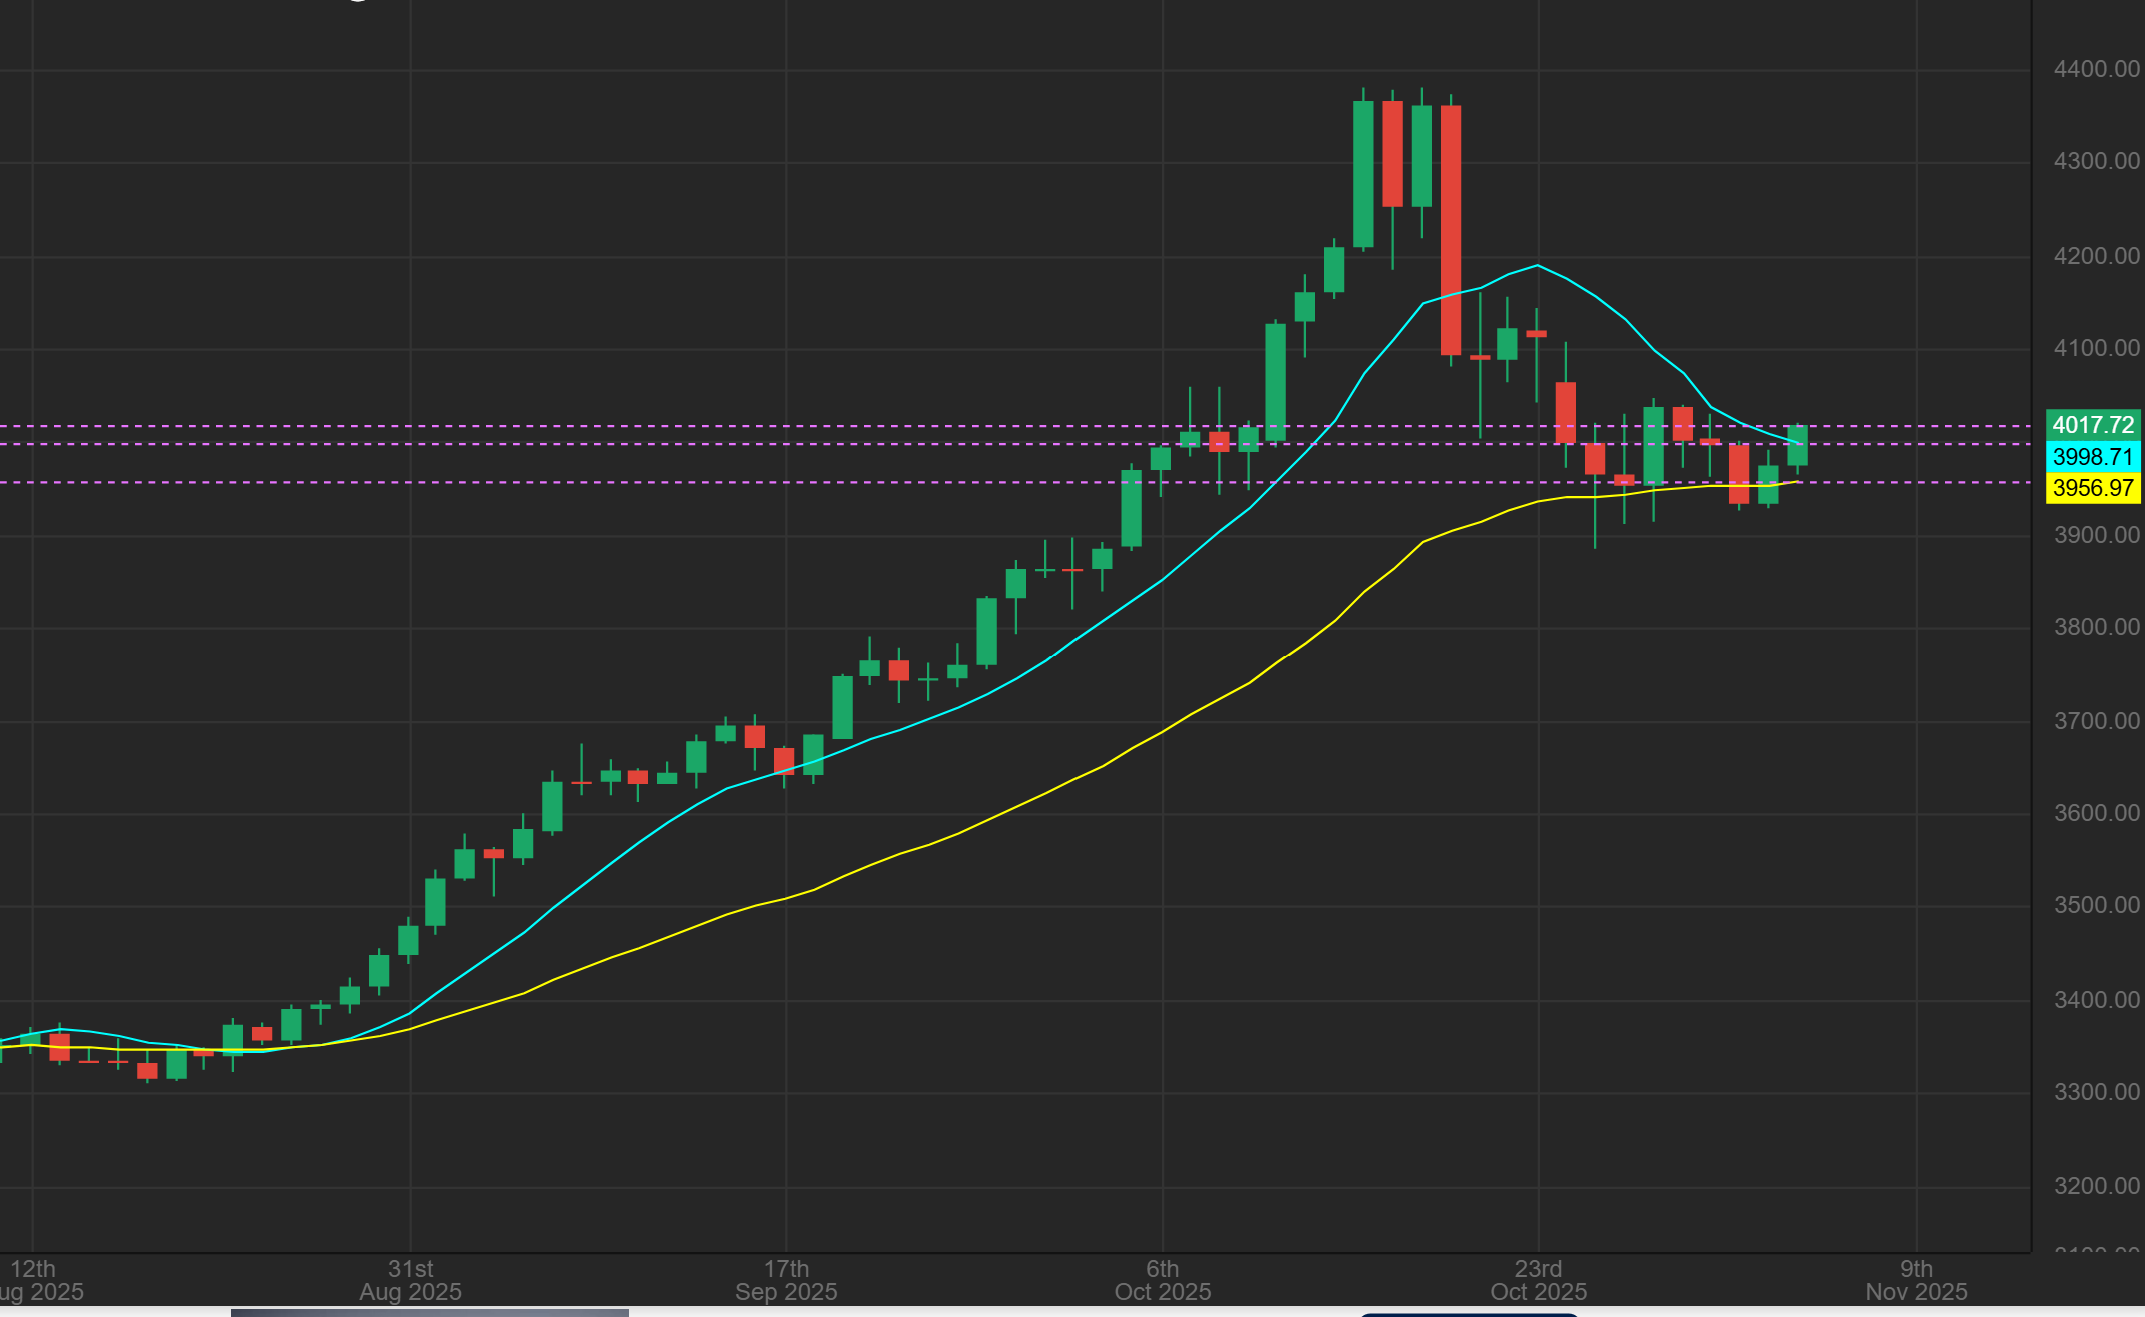
GOLD has yet to break that 10sma, so the dcl really isnt confirmed until GOLD gets above $4003.
.
GOLD LIVE UPDATE:
GOLD has just passed that 10sma, so we have a confirmed dcl on day 7.
.
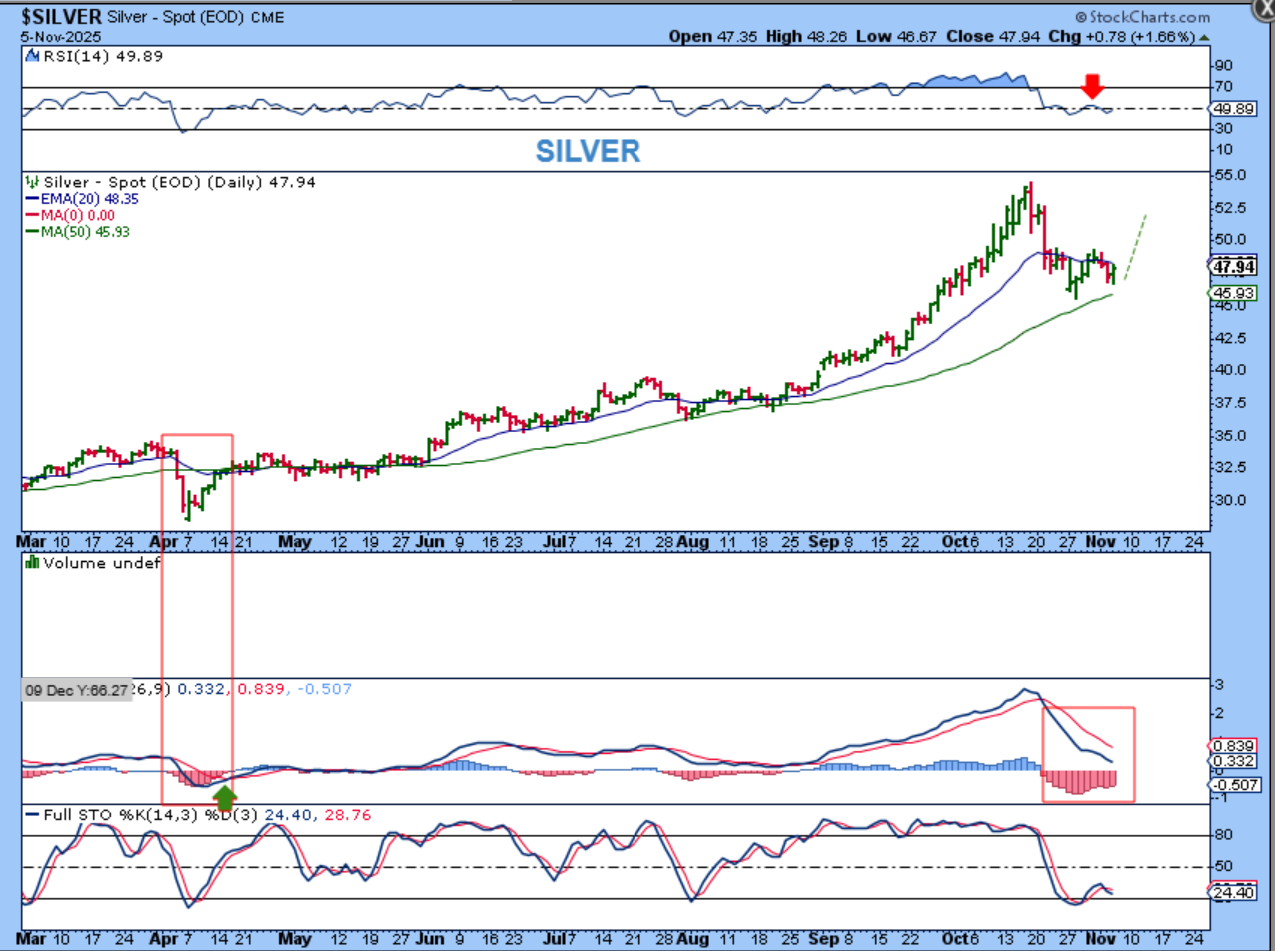
SILVER looks ready to move higher, but here I am also seeing a weak MACD. Again, this isn’t short term bearish or a sell signal, but it tells me that if we run to the highs, we should look for divergence. In fact, let me give you a GUESS as to what we may see…
.
In fact, let me give you a GUESS as to what we may see…
.
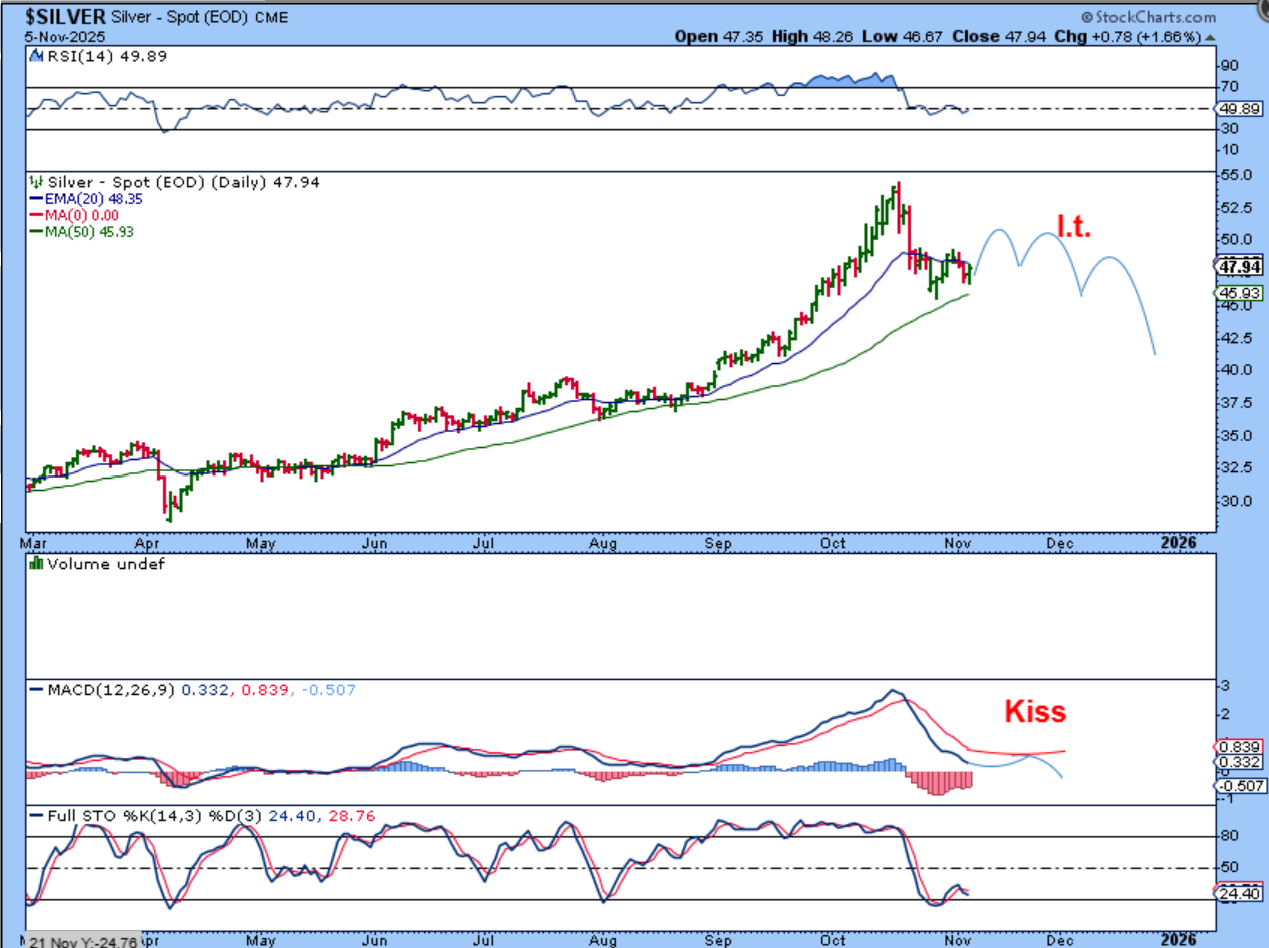
SILVER could rally higher (even higher than I drew it), but the MACD, instead of doing a bull cross, does a ‘Kiss’. The daily cycle becomes L.T. to. This MACD pattern is called a kiss because it just kisses that line and it basically kisses it goodbye as Prive and the MACD drop together after that. This is just a GUESS based on the set up, it gives us something to watch for going forward.
.
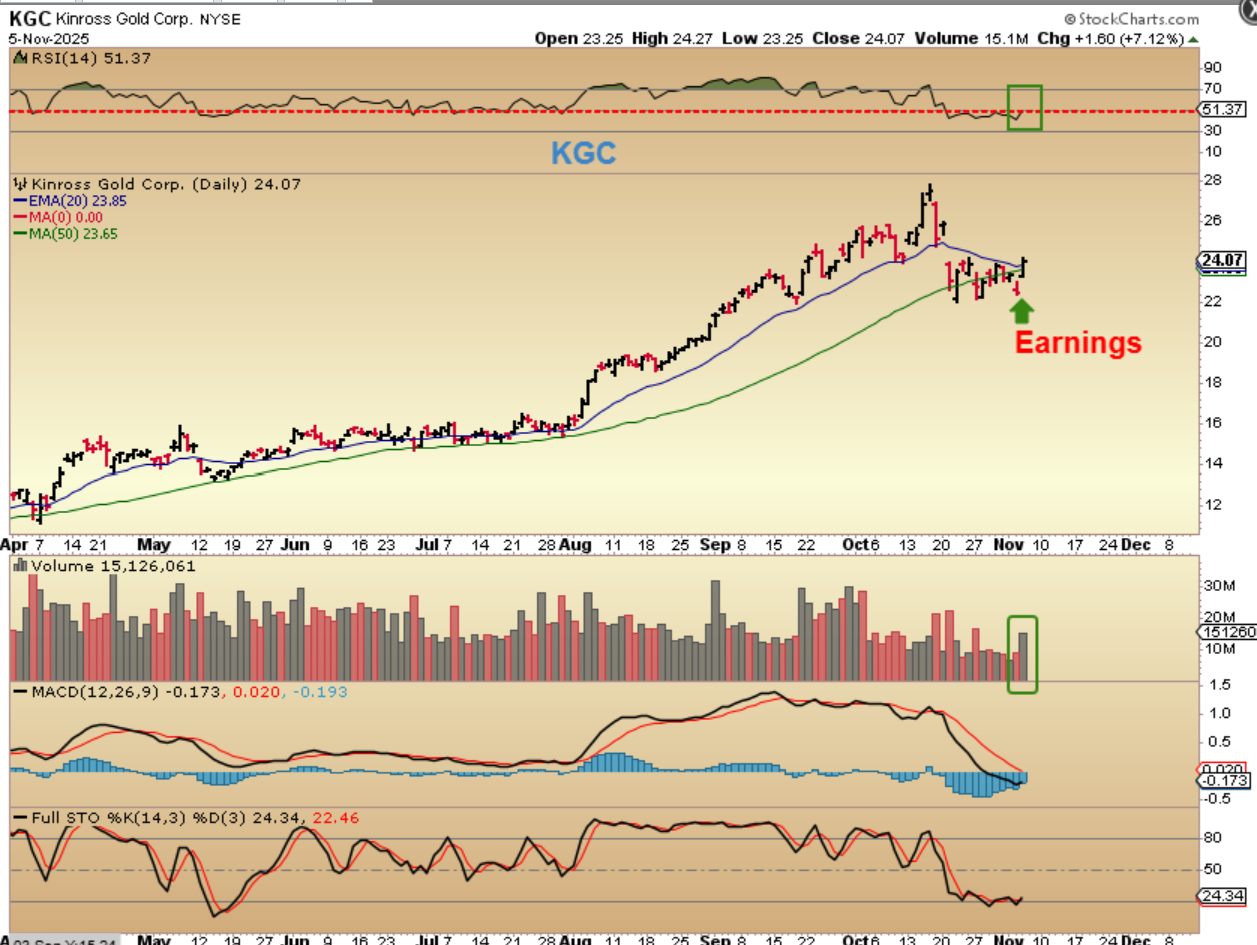
THE GDX looks a little weaker than Gold and Silver (despite IAG and KGC releasing earnings and moving higher). GDX lost the 50sma and is still under it. I believe that GDX will recover with a move higher by Gold and Silver, but it looks weaker at this point.

.
KGC and IAG released earnings and I think that this set up, with a dcl likely in place, is a buy (short term trade). It broke back above the 50 & 20ema.
.
INTERESTING SET UPS FOR A COUPLE OF STOCKS:
.
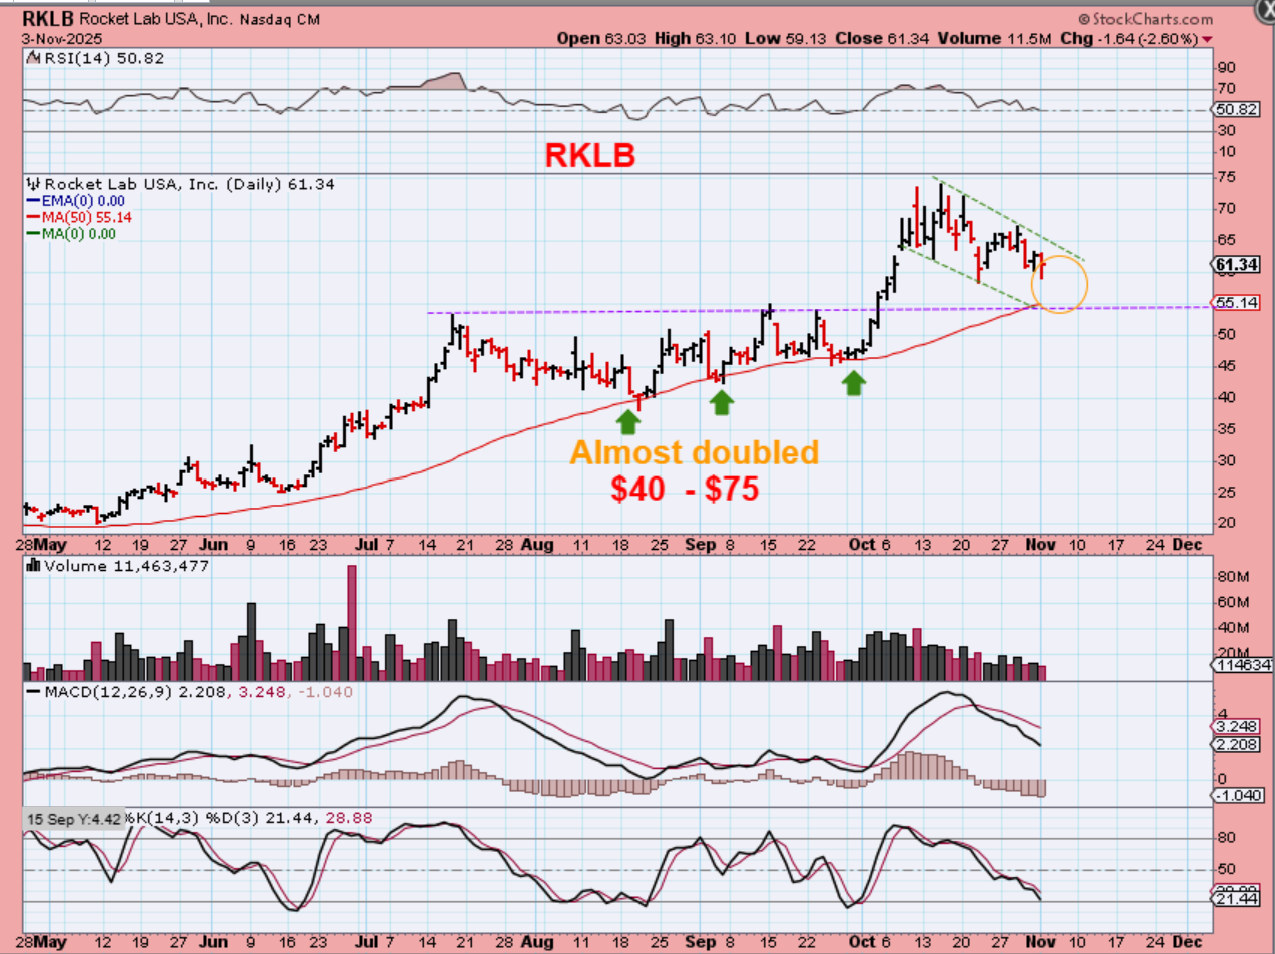
On Nov 3rd I used this chart and said to watch for the drop lower with RKLB. A tag of the 50sma would also be a back-test and could act as support.
.
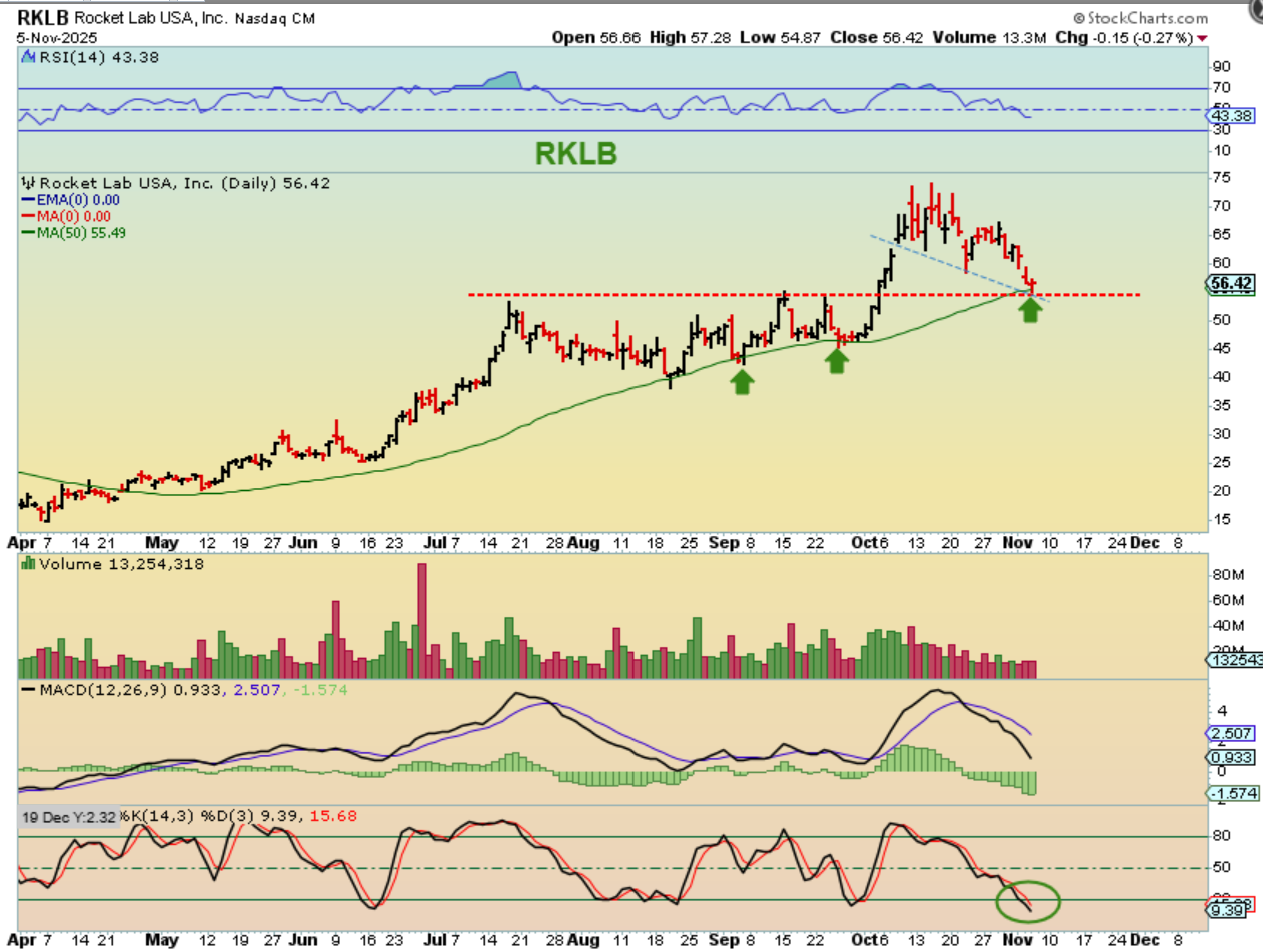
RKLB tagged that area and reversed higher yesterday with out half cycle low. THAT is an easy buy with a stop.
.
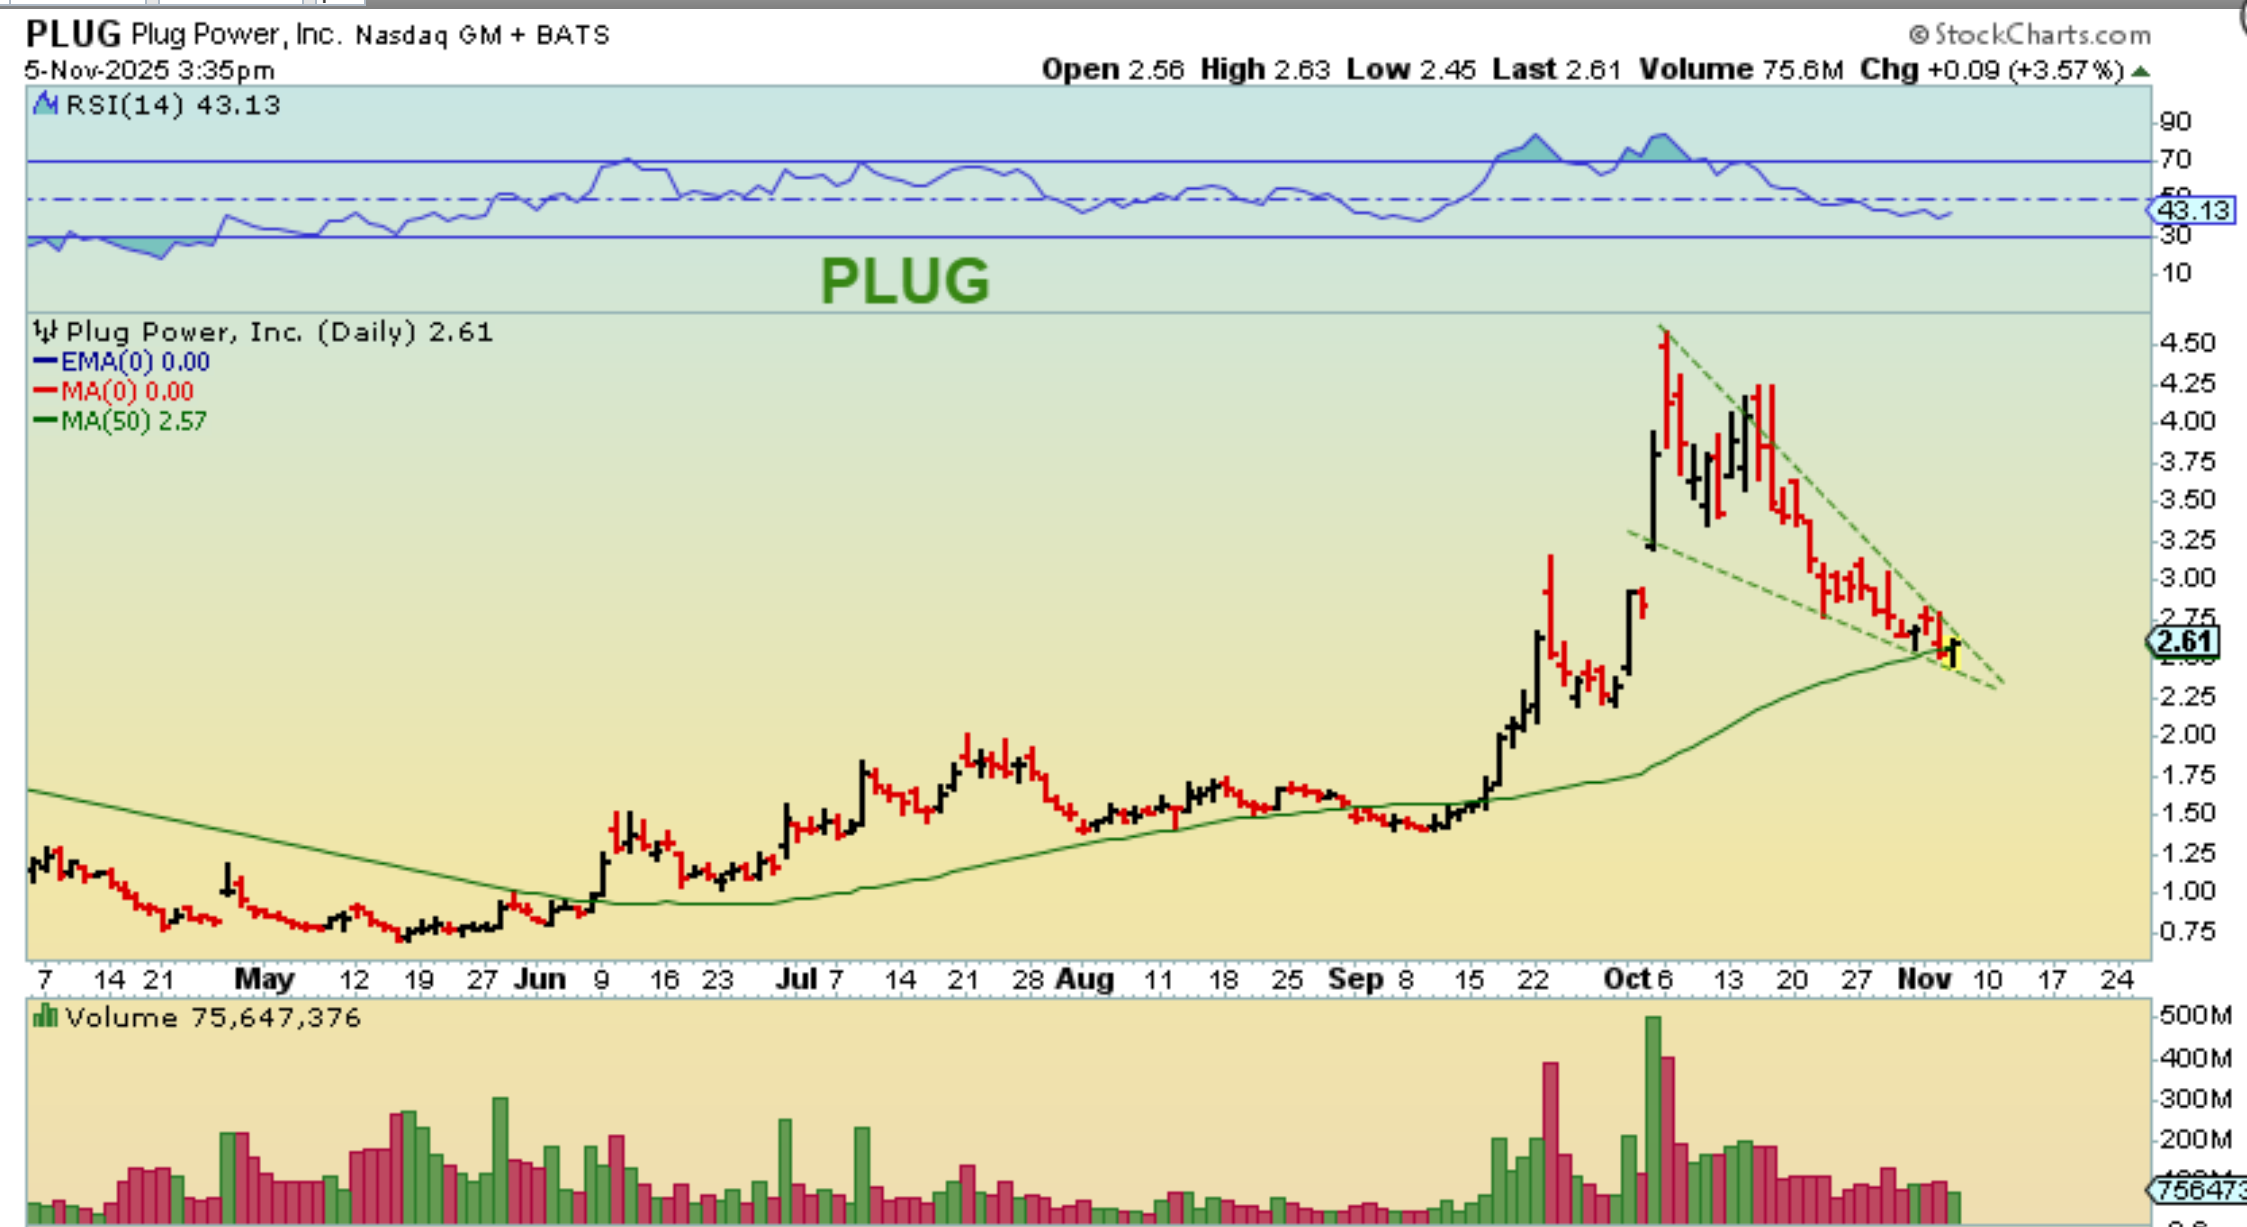
PLUG is also reversing at the 50sma an seems to have a bullish descending wedge. This would be a buy with a sop below Yesterdays candle.
.
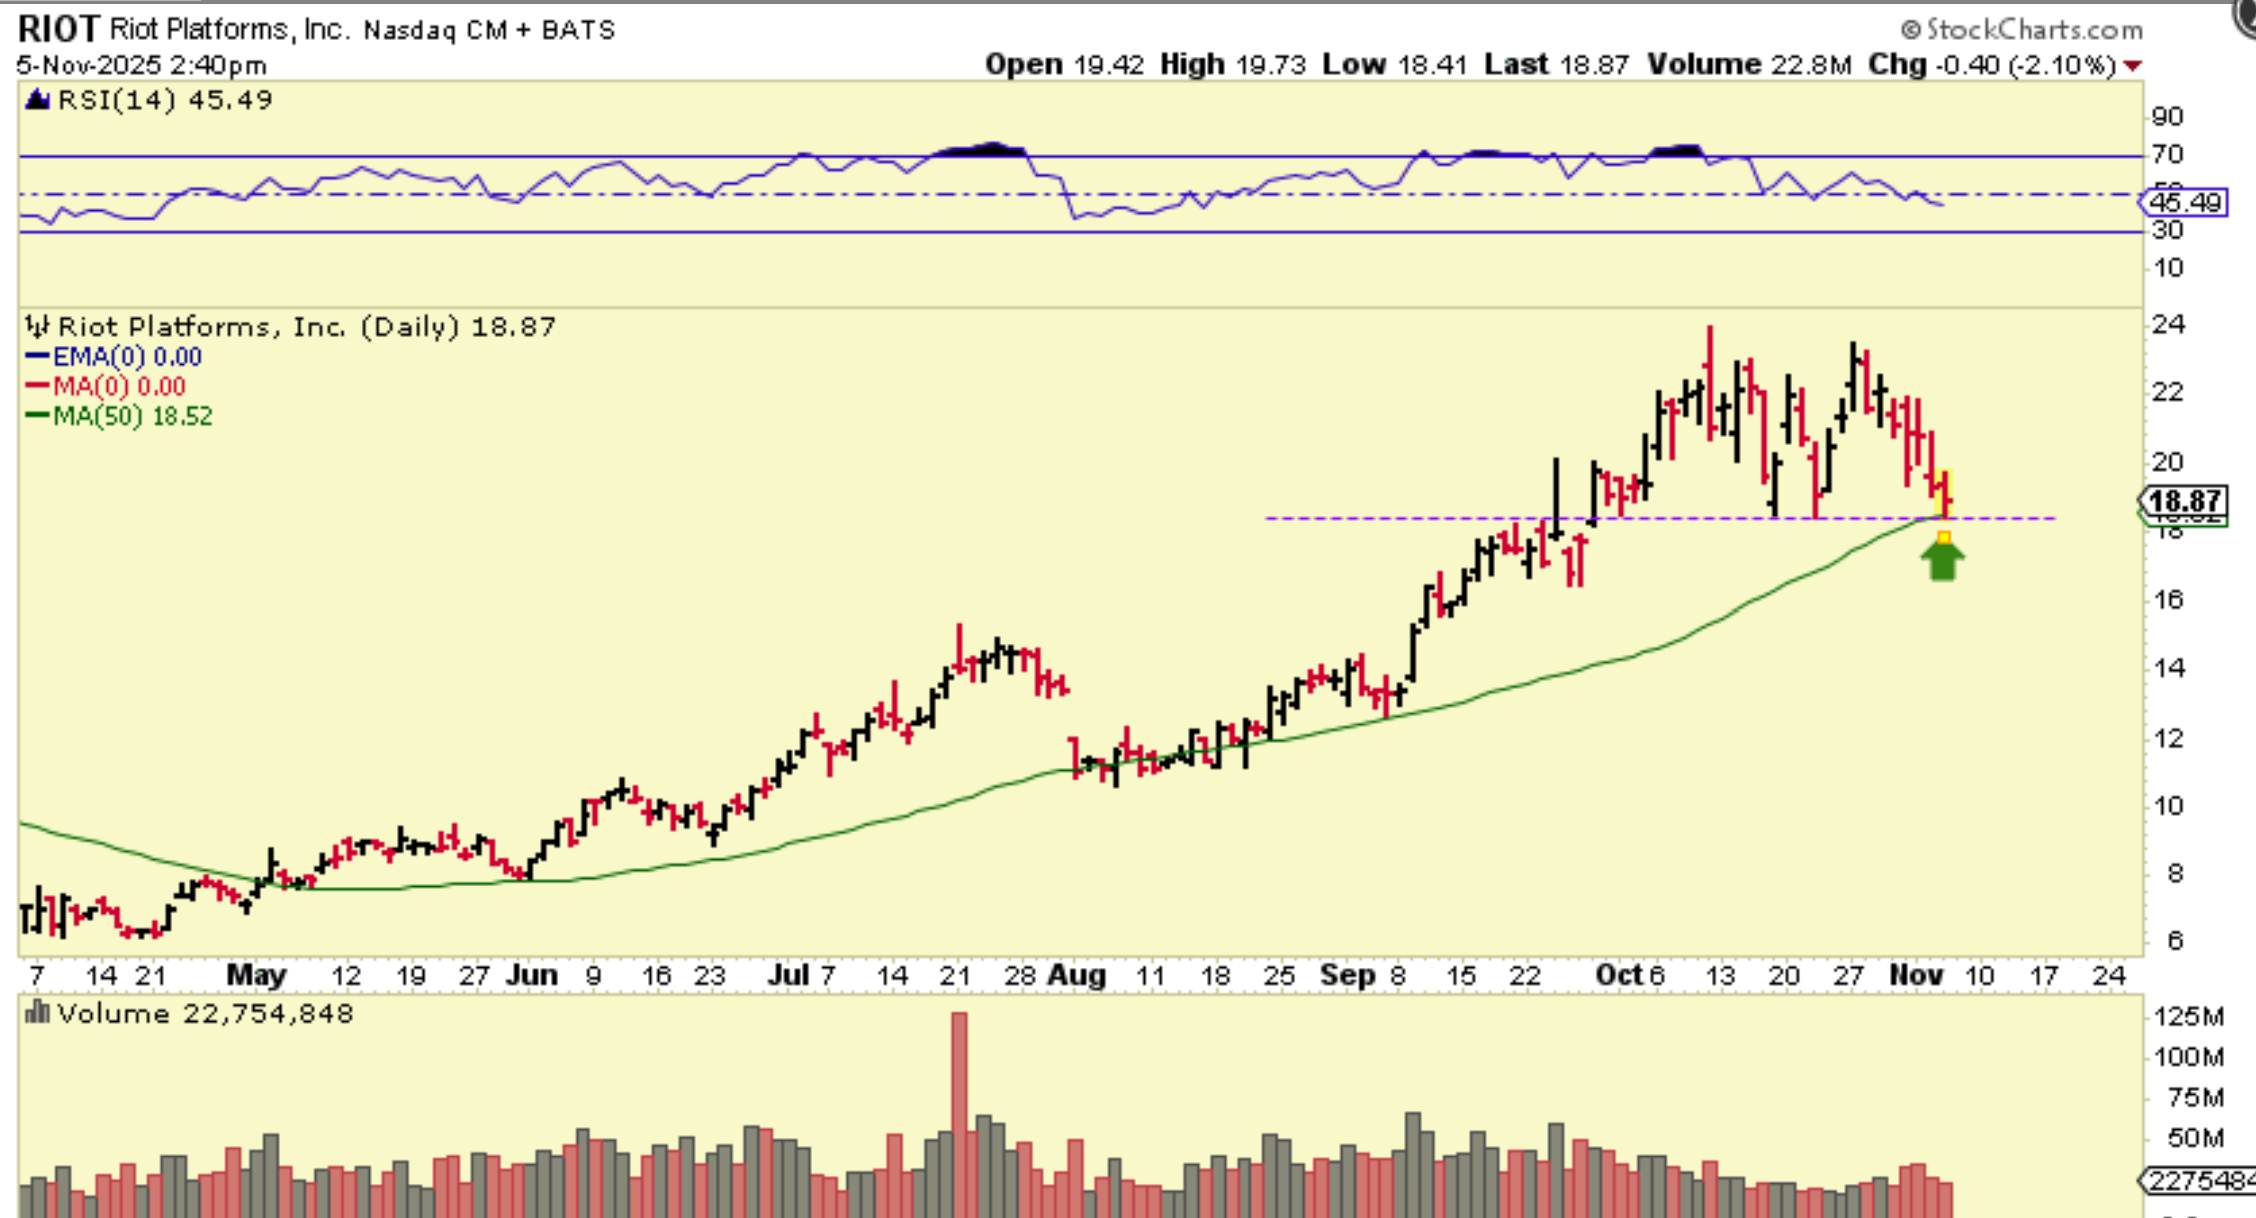
RIOT sat down on the 50sma yesterday as Bitcoin hopefully put in a low at day 64. Buy with a stop under the 50 dma.
.
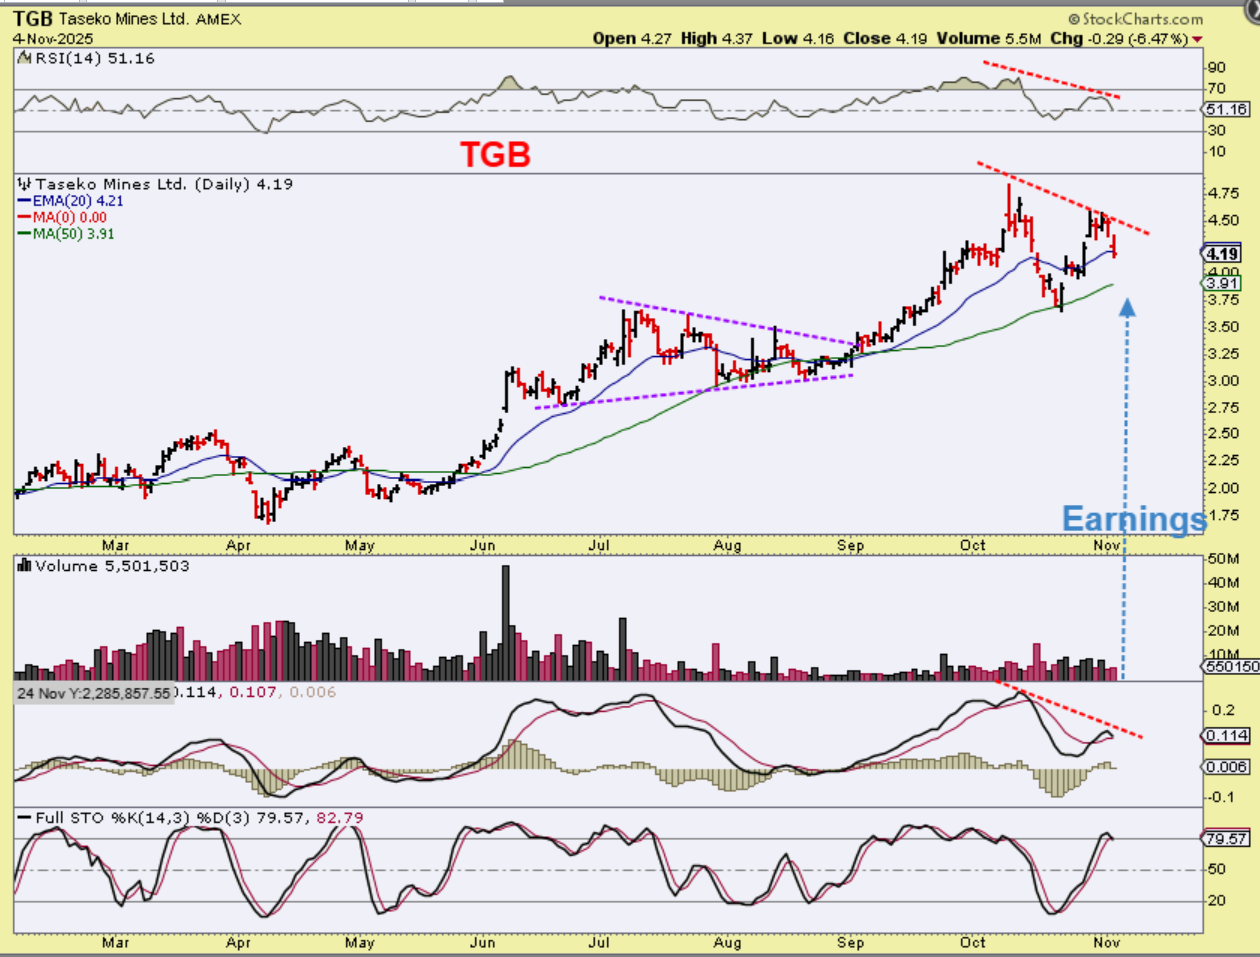
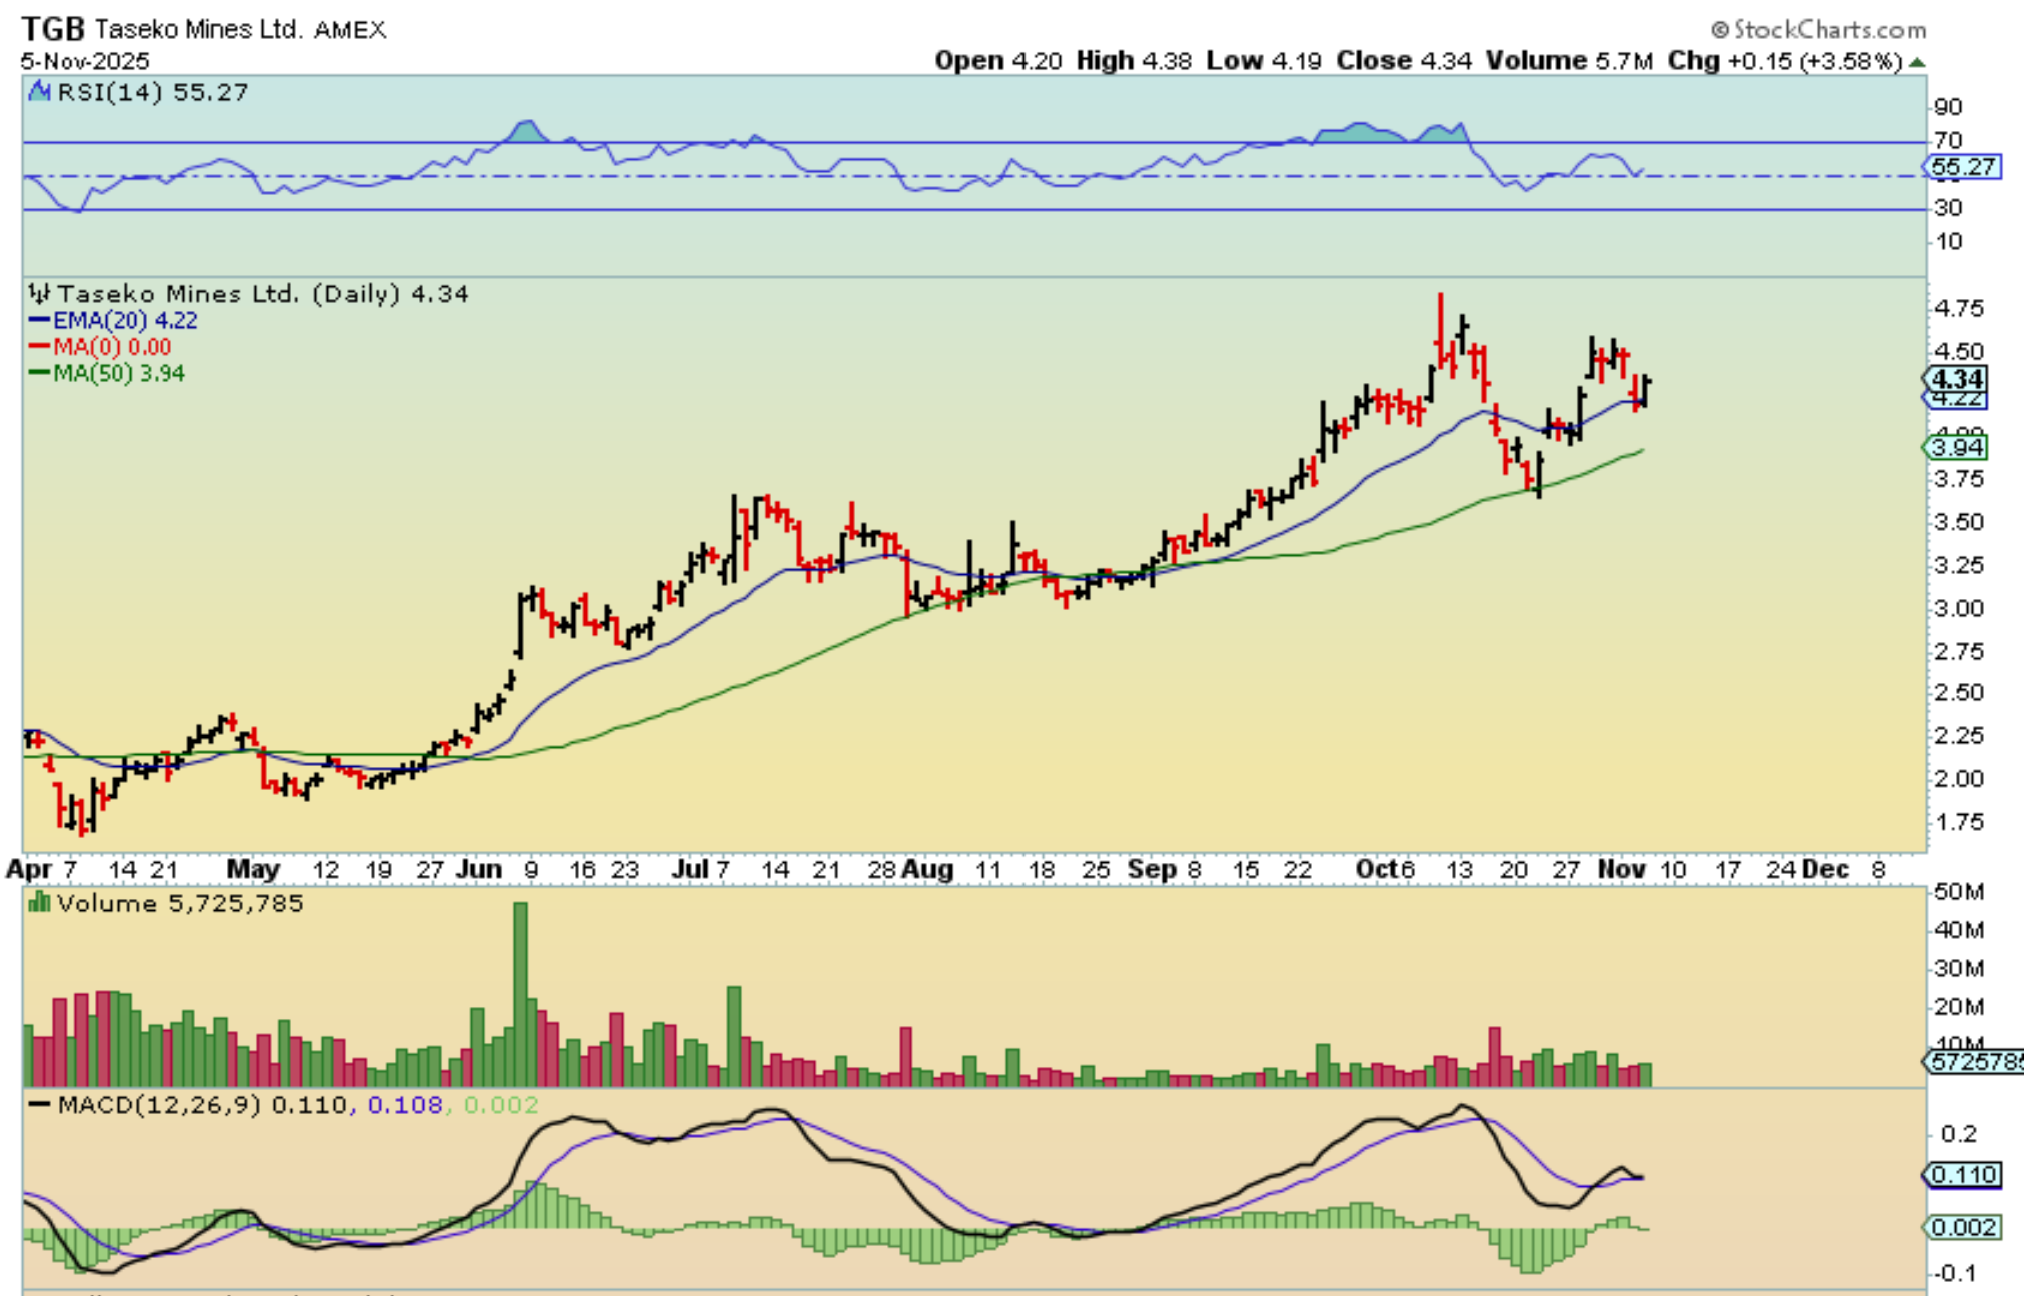
On Nov 4th I mentioned that I like the ‘Metals’ set ups, like CENX, TGB, WRN, AA, STLD, etc. I pointed out TGB. A drop to the 50sma by earnings would be ideal…
.
TGB reversed at the 20ema, but earnings is scheduled for the 12th next week. It still could be considered a buy, but it may do what we saw from July 21-August 1st. See the chart.
.
Enjoy your Thursday trading!
.
~ALEX
.
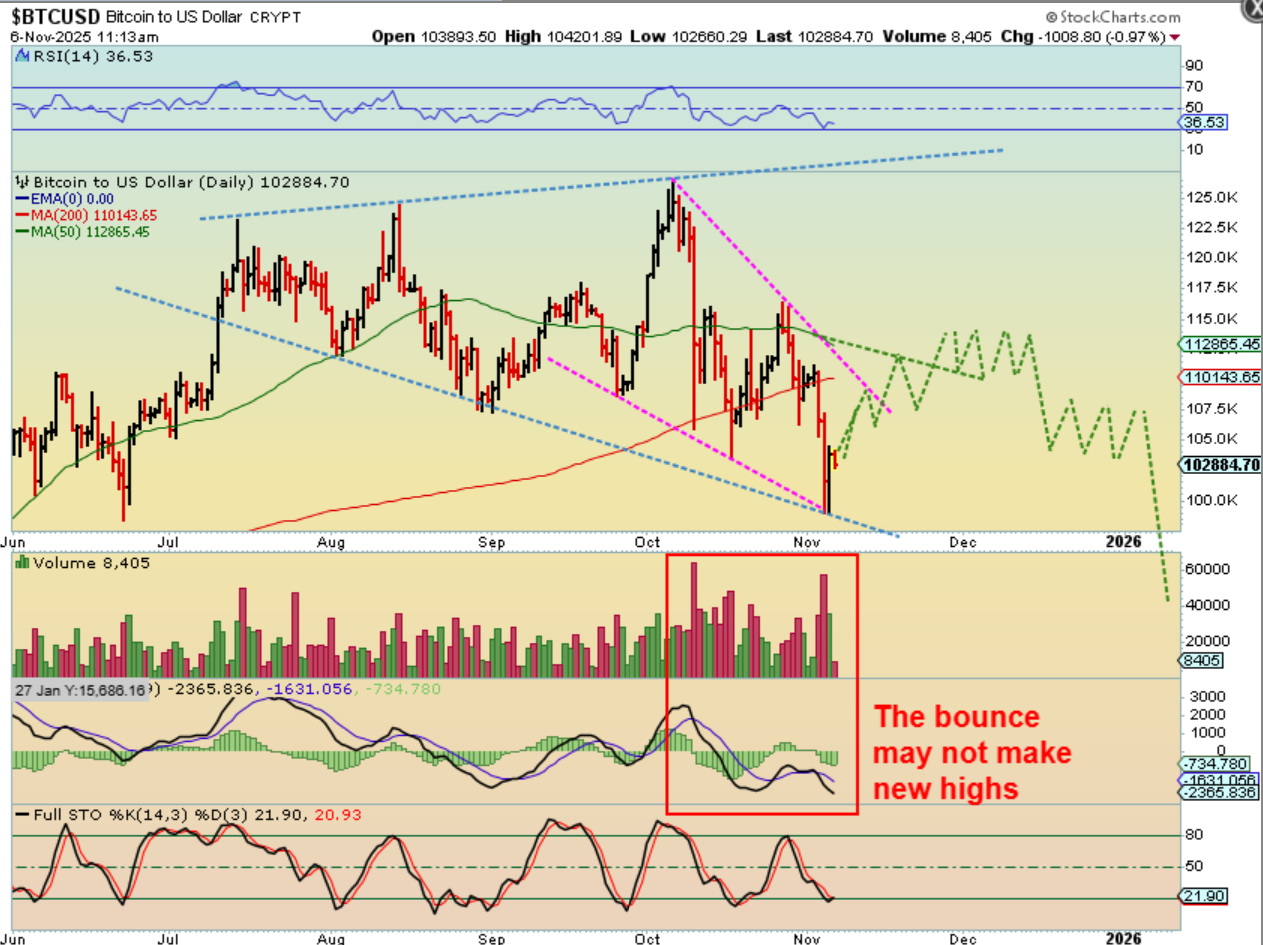
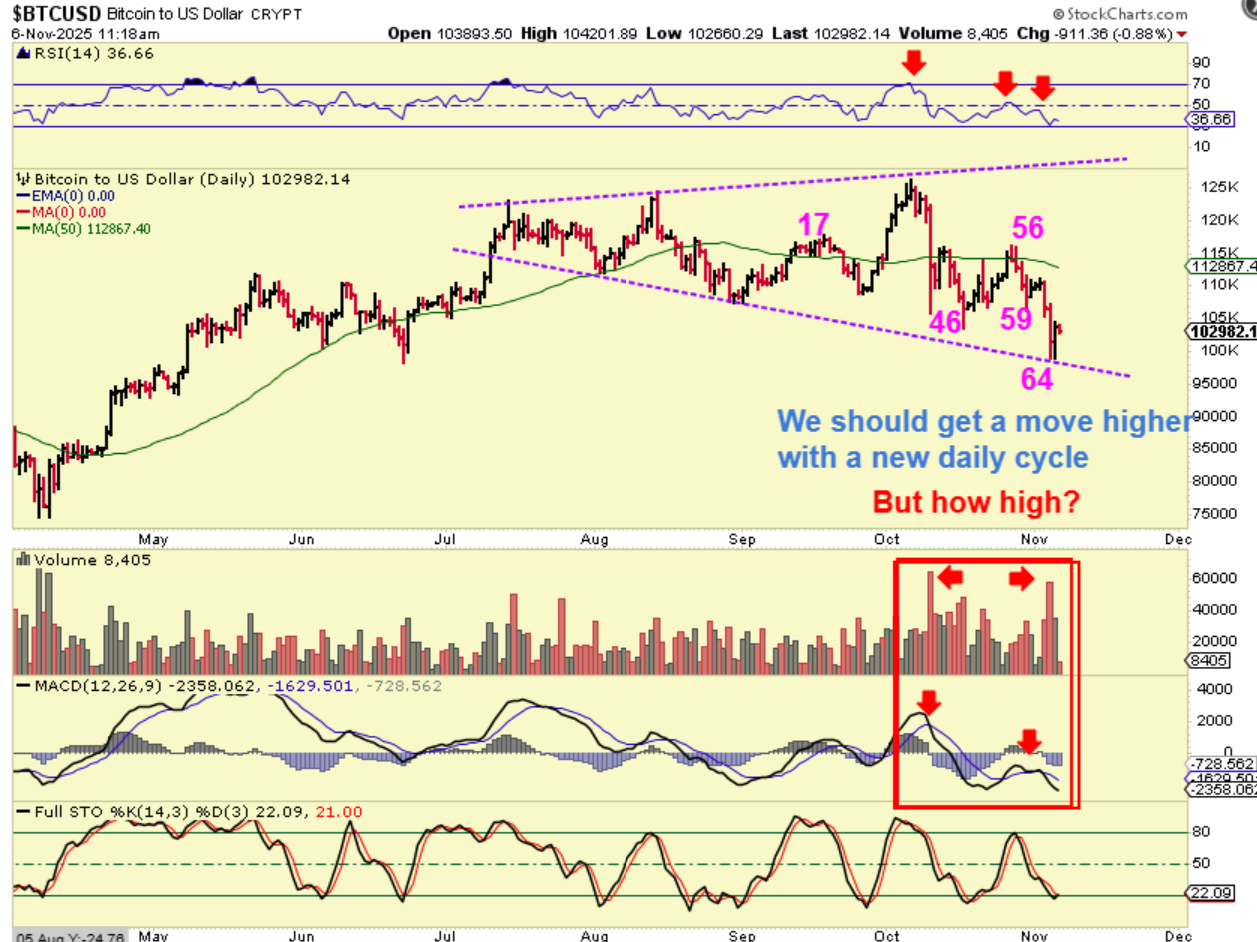
BITCOIN – The set up is short term bullish.
1. We were looking for a day 60+ low and we do seem to have found that low with yesterdays reversal.
2. Just so you know: Weeks ago I was thinking & reporting that we could run to new highs of $140,000+ and then roll over. Well, the more I review the charts as time goes on, the less I feel this is likely.
3. I will cover things along the way and let you know if anything changes (Bitcoin CAN strengthen rapidly when it wants to), but right now I feel that price may only get half way up into this bullhorn again…
.
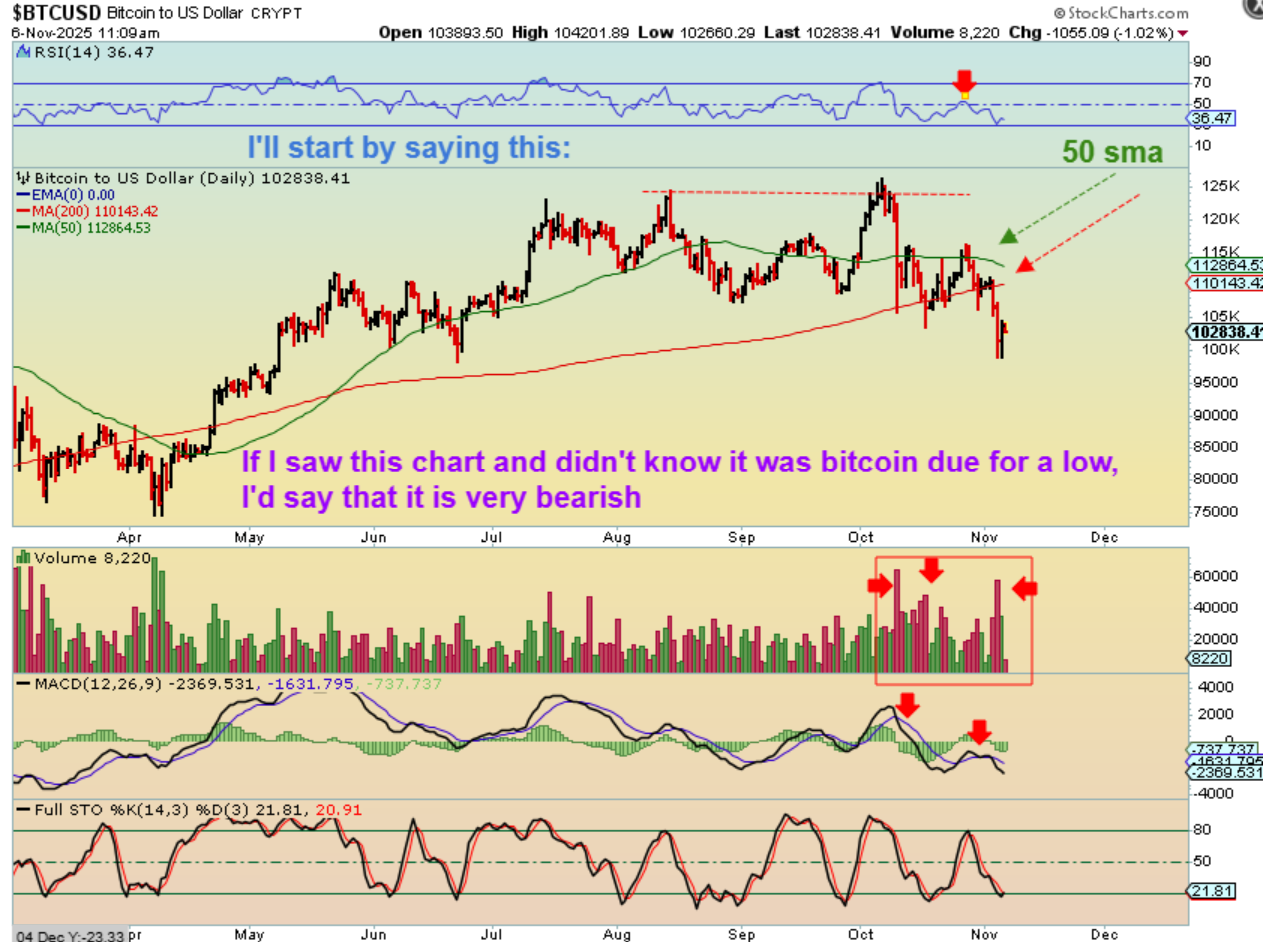
BITCOIN – If I didn’t know that this was Bitcoin due for a cycle low, I would see this as a chart rolling over. The RSI and MACD are weaker and volume has been showing heavy red on the drops. It lost the 50 sma and 200sma. Can it bounce? Yes! And when Bitcoin bounces it often gains strength, but we are at the end of the 3rd year of a 4th year cycle, and I think that I am starting to see that weakness creep in.
.
BITCOIN – I am now wondering if we will just see a move to the 50sma where price recovers and bounces along that area halfway up in the bullhorn and then rolls over. Bitcoin often gets very choppy when it is not trending. The first 30 days of the next 60 day cycle should give us better clues, so stay tuned! At this point, anything could still happen, I’m just reporting what I see at this low. I also think that Crypto sticks could still do well either way, until Bitcoin drops again. Some are already still at their highs.